Article

Urban Land Expansion and Spatiotemporal Dynamics of Urban Green Spaces in Africa

by
Jean Pierre Muhoza
1,* and
Weiqi Zhou
1,2,3,4,5
1
State Key Laboratory of Regional and Urban Ecology, Research Center for Eco-Environmental Sciences, Chinese Academy of Sciences, No. 18 Shuangqing Road, Beijing 100085, China
2
University of Chinese Academy of Sciences, No. 19A Yuquan Road, Beijing 100049, China
3
Beijing Urban Ecosystem Research Station, Research Center for Eco-Environmental Sciences, Chinese Academy of Sciences, No. 18 Shuangqing Road, Beijing 100085, China
4
Beijing JingJinJi Urban Megaregion National Observation and Research Station for Eco-Environmental Change, Research Center for Eco-Environmental Sciences, Chinese Academy of Sciences, No. 18 Shuangqing Road, Beijing 100085, China
5
Xiongan Institute of Innovation, Xiongan 071000, China
*
Author to whom correspondence should be addressed.
Sustainability 2025, 17(7), 2880; https://doi.org/10.3390/su17072880
Submission received: 11 February 2025 / Revised: 6 March 2025 / Accepted: 13 March 2025 / Published: 24 March 2025
(This article belongs to the Section Environmental Sustainability and Applications)

Abstract

:
Urban growth is crucial for economic advancement, but it results in the fragmentation and depletion of natural and semi-natural ecosystems, which are often replaced by built-up areas. The balance between urban green spaces (UGSs) and impervious surfaces (ISs) is a key factor in urban areas for evaluating the environmental quality of cities and addressing the challenges associated with global environmental changes. This study analyzed African urban expansion dynamics from 2000 to 2020, which resulted in changes in the proportion of green spaces and built-up areas. Urban areas in Africa grew significantly, expanding by 207% from 28,461.7 km2 in 2000 to 87,337.2 km2 in 2020. The period from 2010 to 2020 was crucial, witnessing a substantial urban expansion of 33,676 km2. The urban expansion in this period was found to be positively correlated with the population growth. Most urban areas in Africa are small, with about 86% being less than 10 km2 in size. Initially, urban growth led to more impervious surfaces and less green spaces, but the following decade showed a shift towards greener urban areas. There was a 20% increase in the share of urban green spaces (UGSs) and a decrease in impervious surfaces, enhancing urban greenery. Green spaces increased by 225.2%, reaching around 47% of urban areas by 2020. Forested areas expanded, grasslands declined slightly, and croplands increased marginally, indicating a trend towards greener urban regions in Africa.

1. Introduction

The rapid rate of urbanization has resulted in an increasing number of people embracing the benefits of living in cities and appreciating the convenience and opportunity they offer [1]. While urban expansion is essential for economic progress and social well-being, concerns about its negative environmental impact are growing locally and globally [2]. Urban expansion often replaces vital natural and semi-natural landscapes with impervious surfaces, altering local climates, intensifying heat islands, and disrupting hydrological cycles. These changes often lead to higher temperatures, alterations in precipitation patterns, and increased levels of air pollution. Impermeable surfaces affect surface reflectivity and the release of aerosols and artificial heat, exacerbating local environmental changes [3,4,5,6].
Amid escalating urbanization pressures, urban green spaces (UGSs), which encompass diverse vegetation types within urban environments such as trees, shrubs, grasslands, mangroves, and urban agriculture, are increasingly recognized as indispensable nature-based solutions for counteracting the detrimental impacts of urban expansion [7,8,9]. They deliver critical ecosystem services, sustaining biodiversity through habitat conservation [10,11] while enhancing urban resilience by mitigating pollution [12,13], heat [14,15,16], and noise [17,18]. They simultaneously promote public health and social cohesion via accessible recreation, exemplifying their dual role in advancing ecological integrity and societal well-being [19,20], leading to sustainable urban systems.
Africa, home to the world’s fastest-growing urban population, faces acute challenges in balancing developmental needs with ecological sustainability [21]. By 2050, over 1.5 billion people are projected to reside in African cities, driving an unprecedented demand for housing, infrastructure, and resources [22]. This rapid urbanization often occurs through informal settlements and unplanned sprawl, fragmenting ecosystems and depleting UGSs [23,24]. For instance, a spatiotemporal analysis of land use and land cover change in Accra, Ghana revealed a profound transformation characterized by the rapid expansion of the urban built environment. From 1991 to 2018, there was an increase in total land cover from 55.1% to 83.79%, which was followed by the loss of natural green spaces, which diminished from 41% to 15% [25]. Compounding this, climate change amplifies vulnerabilities: rising temperatures, erratic rainfall, and prolonged droughts strain urban ecosystems, while UGS loss diminishes cities’ capacity to buffer these impacts [26,27]. Land-use conflicts further complicate UGS preservation [28]. Urban expansion, driven by speculative development and weak governance [29,30,31], frequently encroaches on agricultural land [32] and protected areas.
UGSs are indispensable for Africa’s adaptive capacity. They serve as biodiversity refuges, hosting endemic species and maintaining ecological networks in increasingly fragmented landscapes [33]. For instance, Accra’s mangrove ecosystems [34] and Cape Town’s Table Mountain National Park [35] illustrate how UGSs can sustain unique flora and fauna while offering recreational and cultural benefits. Moreover, UGSs mitigate climate impacts by reducing ambient temperatures by up to 5 °C and absorbing stormwater runoff, which is crucial for flood-prone cities such as Dar es Salaam. Socially, green spaces enhance mental health, reduce disease burdens linked to pollution, and foster community resilience—a lifeline for marginalized populations in overcrowded informal settlements. However, Africa’s UGSs face systemic challenges such as inequitable distribution [36,37,38,39], inadequate funding for maintenance [40,41], and insufficient integration into urban planning [42,43,44,45].
Despite the rich body of research, the existing research remains fragmented by its predominant focus on individual cities and large metropolises [46,47], obscuring continental-scale trends and neglecting the socio-ecological dynamics inherent to Africa’s small and intermediate urban centers, which are home to 60% of its urban population [48,49]. This study addresses this critical gap through a continent-wide analysis of spatiotemporal urban expansion and its impacts on UGSs across African urban areas from 2000 to 2020. By integrating publicly available multi-temporal satellite imagery and spatial analytics to examine the extent of green space depletion in relationship to urban densification, this research provides critical insights into sustainable urban planning and the need for proactive conservation strategies. These findings will contribute to a better understanding of urban land cover changes and inform policies aimed at sustainable urban growth.

2. Materials and Methods
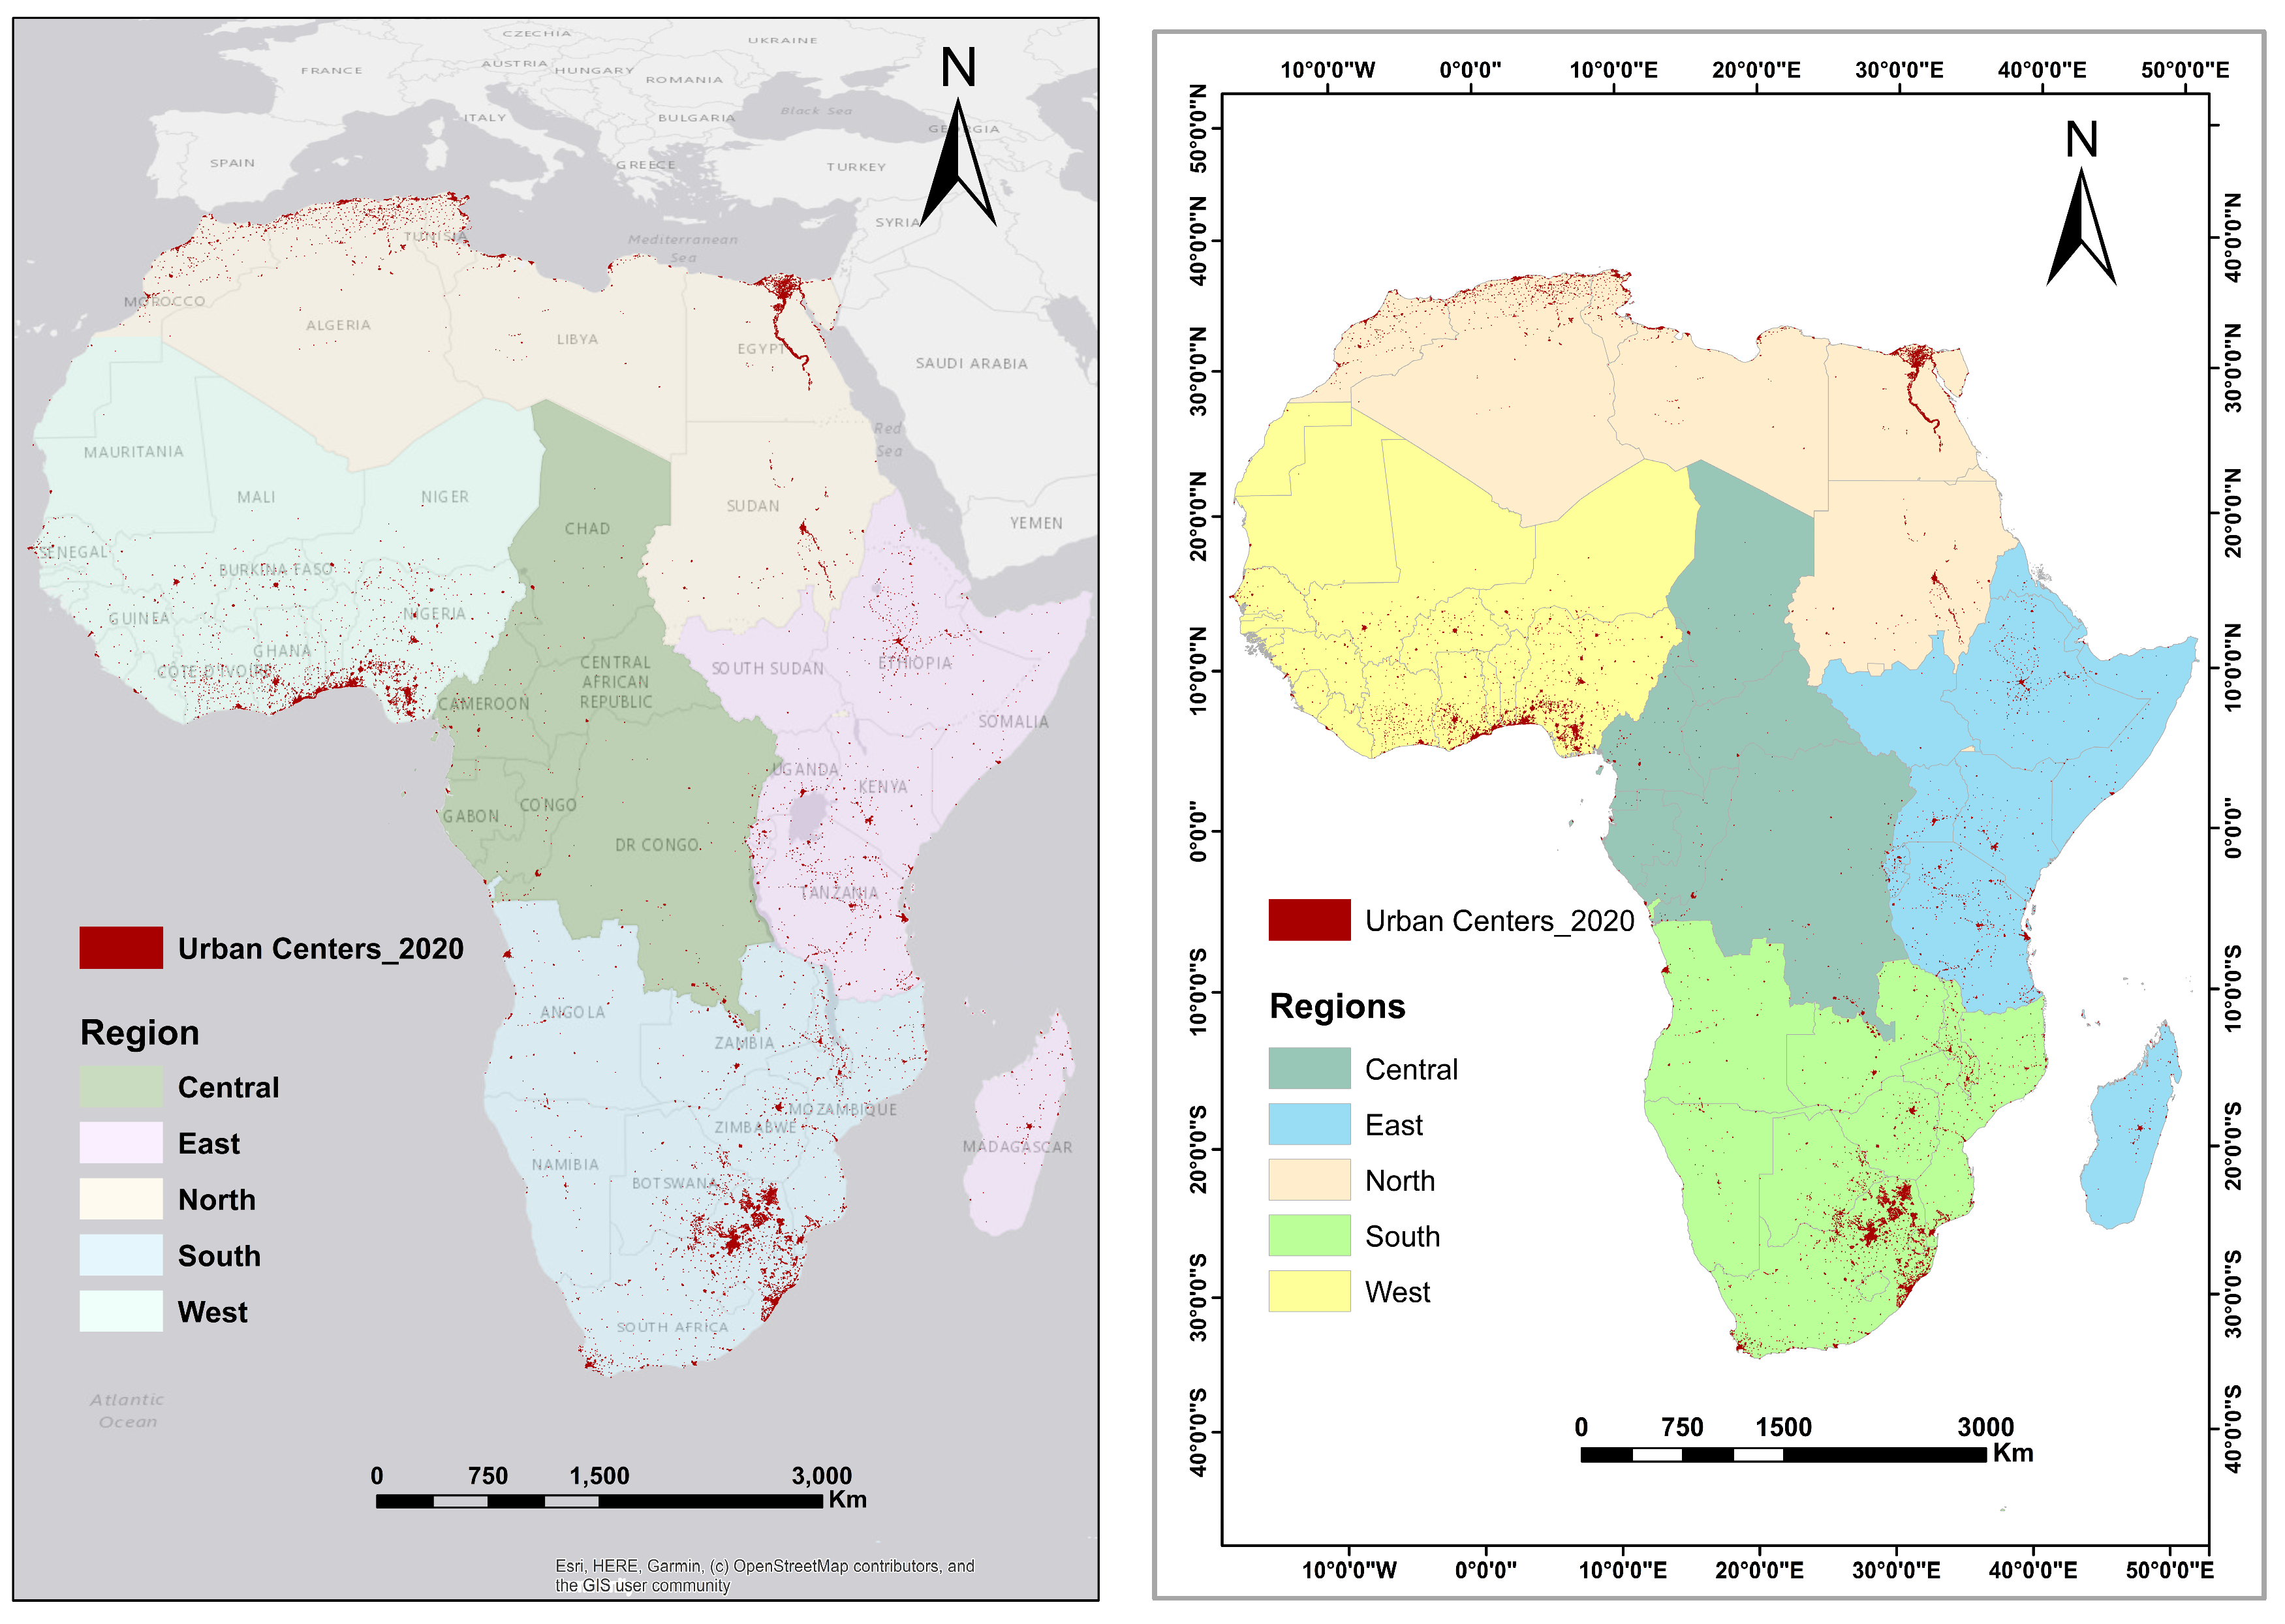
2.1. Study Area

The continent of Africa is situated within the Eastern Hemisphere, predominantly stretching eastward from the Prime Meridian. Encompassing roughly 30.2 million km2, it constitutes approximately 20.4% of the Earth’s total land area, ranking as the second-largest continent both in terms of landmass and population. Africa has undergone an unprecedented process of urbanization and presently, over half of Africa’s inhabitants reside in urban centers with populations exceeding 10,000 individuals. The climate of Africa is highly diverse, influenced by its extensive dimensions and diversified geography, which plays a crucial role in shaping the natural environment, ecosystems, and human activities. The continent exhibits diverse climatic extremes, ranging from the arid Sahara Desert in the north and the Kalahari Desert in the south to the tropical rainforests at the Equator and the temperate regions along the coasts. Africa, characterized by diverse natural landscapes, exhibits variations in urban expansion across the different regions due to its large territory. To analyze these variances, we categorized Africa into five traditional geographical regions: East, West, North, South, and Middle Africa. This classification allowed us to illustrate the distinct patterns of urban growth observed in each region from 2000 to 2020.

2.2. Methods

2.2.1. Urban Expansion

Clearly defining urban area boundaries is crucial for analyzing their unique expansion patterns and environmental effects. However, these boundaries can differ greatly across countries and regions, making direct comparisons challenging (Figure 1). This study examined urban extents in Africa for the years 2000, 2010, and 2020, using data from the 30 m resolution Global Urban Boundary (GUB) dataset (Version 2022) [50]. This dataset identified physical boundaries of urban settlements larger than 1 km2, with 65,582 GUBs recorded in 2020, including 8765 in Africa (Figure 1). We also extracted the newly expanded areas from 2000 to 2010 and from 2010 to 2020 to obtain an understanding of the evolution of the urban landscape.
After the urban extent data were downloaded and processed in ArcMap 10.8, the results were exported to spreadsheets and we used a quantitative analytical framework to examine the spatiotemporal dynamics of urban expansion across national scales, with a focus on characterizing its magnitude and growth patterns. Urban areas were aggregated by countries. Building on established methodologies in land-use change analysis [51,52,53,54], we calculated two key metrics for each country: (1) the overall expanded urban area (OEA), representing the total spatial extent of urbanization, and (2) the compound annual growth rate (CAGR), which quantifies the average yearly rate of urban land expansion. These metrics were derived for two discrete decades, 2000–2010 and 2010–2020, to enable a comparative temporal analysis of urbanization trajectories. The OEA captures the absolute scale of urban expansion, while the CAGR provides a normalized measure of growth intensity, collectively offering a dual perspective on the pace and scale of global urban land-use change.
O E A = U A i U A j  
C A G R = 100 × ( U A i U A j ) 1 Y e a r 1
where UAi and UAj represent the urban area at the beginning of year j and at the end of year i, respectively. The year is defined as the time interval between year j and year i.
The robust empirical literature demonstrates a strong positive relationship between urbanization and national income, driven by the agglomeration economies inherent in urban settings. The concentration of industrial, commercial, and logistical activities, which are fundamental to economic growth, necessitates the spatial expansion of urban areas. This expansion is further fueled by demographic factors, including rural–urban migration and natural population growth, which generate increased demand for housing and infrastructure, reinforcing urbanization [1,55]. Using Spearman’s rank correlation coefficient [56,57], this study employed national-level GDP data from the World Development Indicators database of the World Bank [58] and urban population share from Africapolis [59] to evaluate their relative influence on urban expansion in Africa.

2.2.2. Evaluating Green Spaces and Impervious Surfaces Changes

The land cover composition within each urban boundary was obtained from the global land-cover product with a fine classification system at 30 m resolution (GLC_FCS30) [60], a publicly accessible dataset generated through time-series Landsat imagery. This product has an overall accuracy of 82.5% and delineates 29 distinct land-cover classes. For analytical coherence, these classes were reclassified into six broader categories: cropland, forest, grassland, water, built-up areas, and bare land. To analyze spatiotemporal dynamics in UGSs and impervious surfaces (ISs), we calculated absolute changes in UGSs (forest, grassland, and cropland) and urban built-up (IS) areas, as well as temporal shifts in their proportional composition, using the metric-based framework specified in the equations below. This dual approach of measuring both total area modifications and relative proportional fluctuations enabled a systematic evaluation of scale-dependent transformations in urban land cover, capturing both the magnitude and evolving spatial distribution of UGSs and ISs over time.
O A C = A ( I S   o r   U G S ) i A ( I S   o r   U G S ) j
A P U G S = P i P j
Here, A I S   o r   U G S i and A I S   o r   U G S j are the green space and built-up areas at the start of year j and end of year i, respectively, and OAC represents the total changes in UGS and IS areas. A P U G S refers to the average percentage of green space coverage. The IS fractions were also calculated in the same way as UGSs in three different years and for the newly expanded areas between the two decades.

3. Results

3.1. Urban Growth Dynamics

From 2000 to 2020, there was a substantial surge in urban expansion across all African nations, as shown in Figure 2. The urban areas across the continent experienced a substantial and noteworthy expansion, with the entire urban extent increasing by almost 207%, from about 28,461.7 km2 in 2000 to around 87,337.2 km2 in 2020. The decade spanning from 2010 to 2020 played a pivotal role in this transformation, witnessing a substantial urban land expansion. During this specific timeframe, an extensive 33,676 km2 was added to urban areas, substantially contrasting to the preceding decade, which saw a comparatively modest addition of 5214 km2. The statistical analysis revealed a pronounced increase in both the mean and standard deviation of the overall percentage change in urban expansion across countries, rising from 21.68 (mean) and 26.15 (standard deviation) during the 2000–2010 period to 298.47 and 325.61, respectively, in the 2010–2020 period. These trends not only signify a continent-wide acceleration of urbanization but also highlight the substantial heterogeneity in urban growth rates between nations, reflecting divergent spatial and developmental trajectories.
The assessment of urban expansion dynamics across the various regions (Table 1) of the continent involved the use of the annual urban growth rate, enabling comparisons between countries and regions despite the variations in the urban area sizes. At the regional scale, during the initial decade of the century, the annual growth rates were relatively different. The highest was 2.42% in the south, followed by 2.21% in the west, 1.75% in the east, 1.39% in the north, and 0.28% in the middle. In the subsequent 2010–2020 period, the annual growth rate experienced a significant increase, almost ten times that of the previous decade. The eastern part of the continent recorded the highest average rate at 20.96%, followed by the south, west, north, and middle with rates of 16.38%, 10.31%, 7.11%, and 6.66%, respectively.
While the continent’s average annual urban growth rate stood at approximately 2% during the initial decade, it saw a notable surge to around 13% in the subsequent period. Despite these overall averages, certain countries surpassed the continental norms, displaying even higher growth rates. Table 2 delineates the top ten countries exhibiting elevated compound annual growth rates during the 2000–2010 and 2010–2020 time spans.
Our statistical analysis highlights the predominance of small cities and towns in Africa’s urban landscape. In the year 2000, about 84% of the urban settlements had an area of less than 10 km2. Although this proportion saw a slight decline to 83% by 2010, it subsequently increased to 86% in 2020. This pattern justifies the observed magnitude of the overall urban expansion on the continent.
The results of the population and GDP change analysis and their correlation to urban expansion revealed distinct temporal patterns in urbanization drivers across African countries (Table 3). Between 2000 and 2010, the overall urban population increased by about 57%, and the urban growth rate exhibited weak, non-significant correlations with both population growth (Spearman’s ρ = 0.116, p = 0.454) and GDP growth (ρ = 0.242, p = 0.114). This coincided with moderate urban expansion (mean = 21.68%, SD = 26.15) and robust economic growth (mean GDP = 223.38%, SD = 170.01). By contrast, during 2010–2020, the urban population increased around 83% and urban growth surged dramatically (mean = 298.47%, SD = 325.61), becoming significantly positively correlated with population growth (ρ = 0.313, p = 0.039). This suggests a shift toward population-driven urbanization. Conversely, GDP growth declined sharply (mean = 45.87%, SD = 64.44) and showed no significant linkage to urban growth in either period.

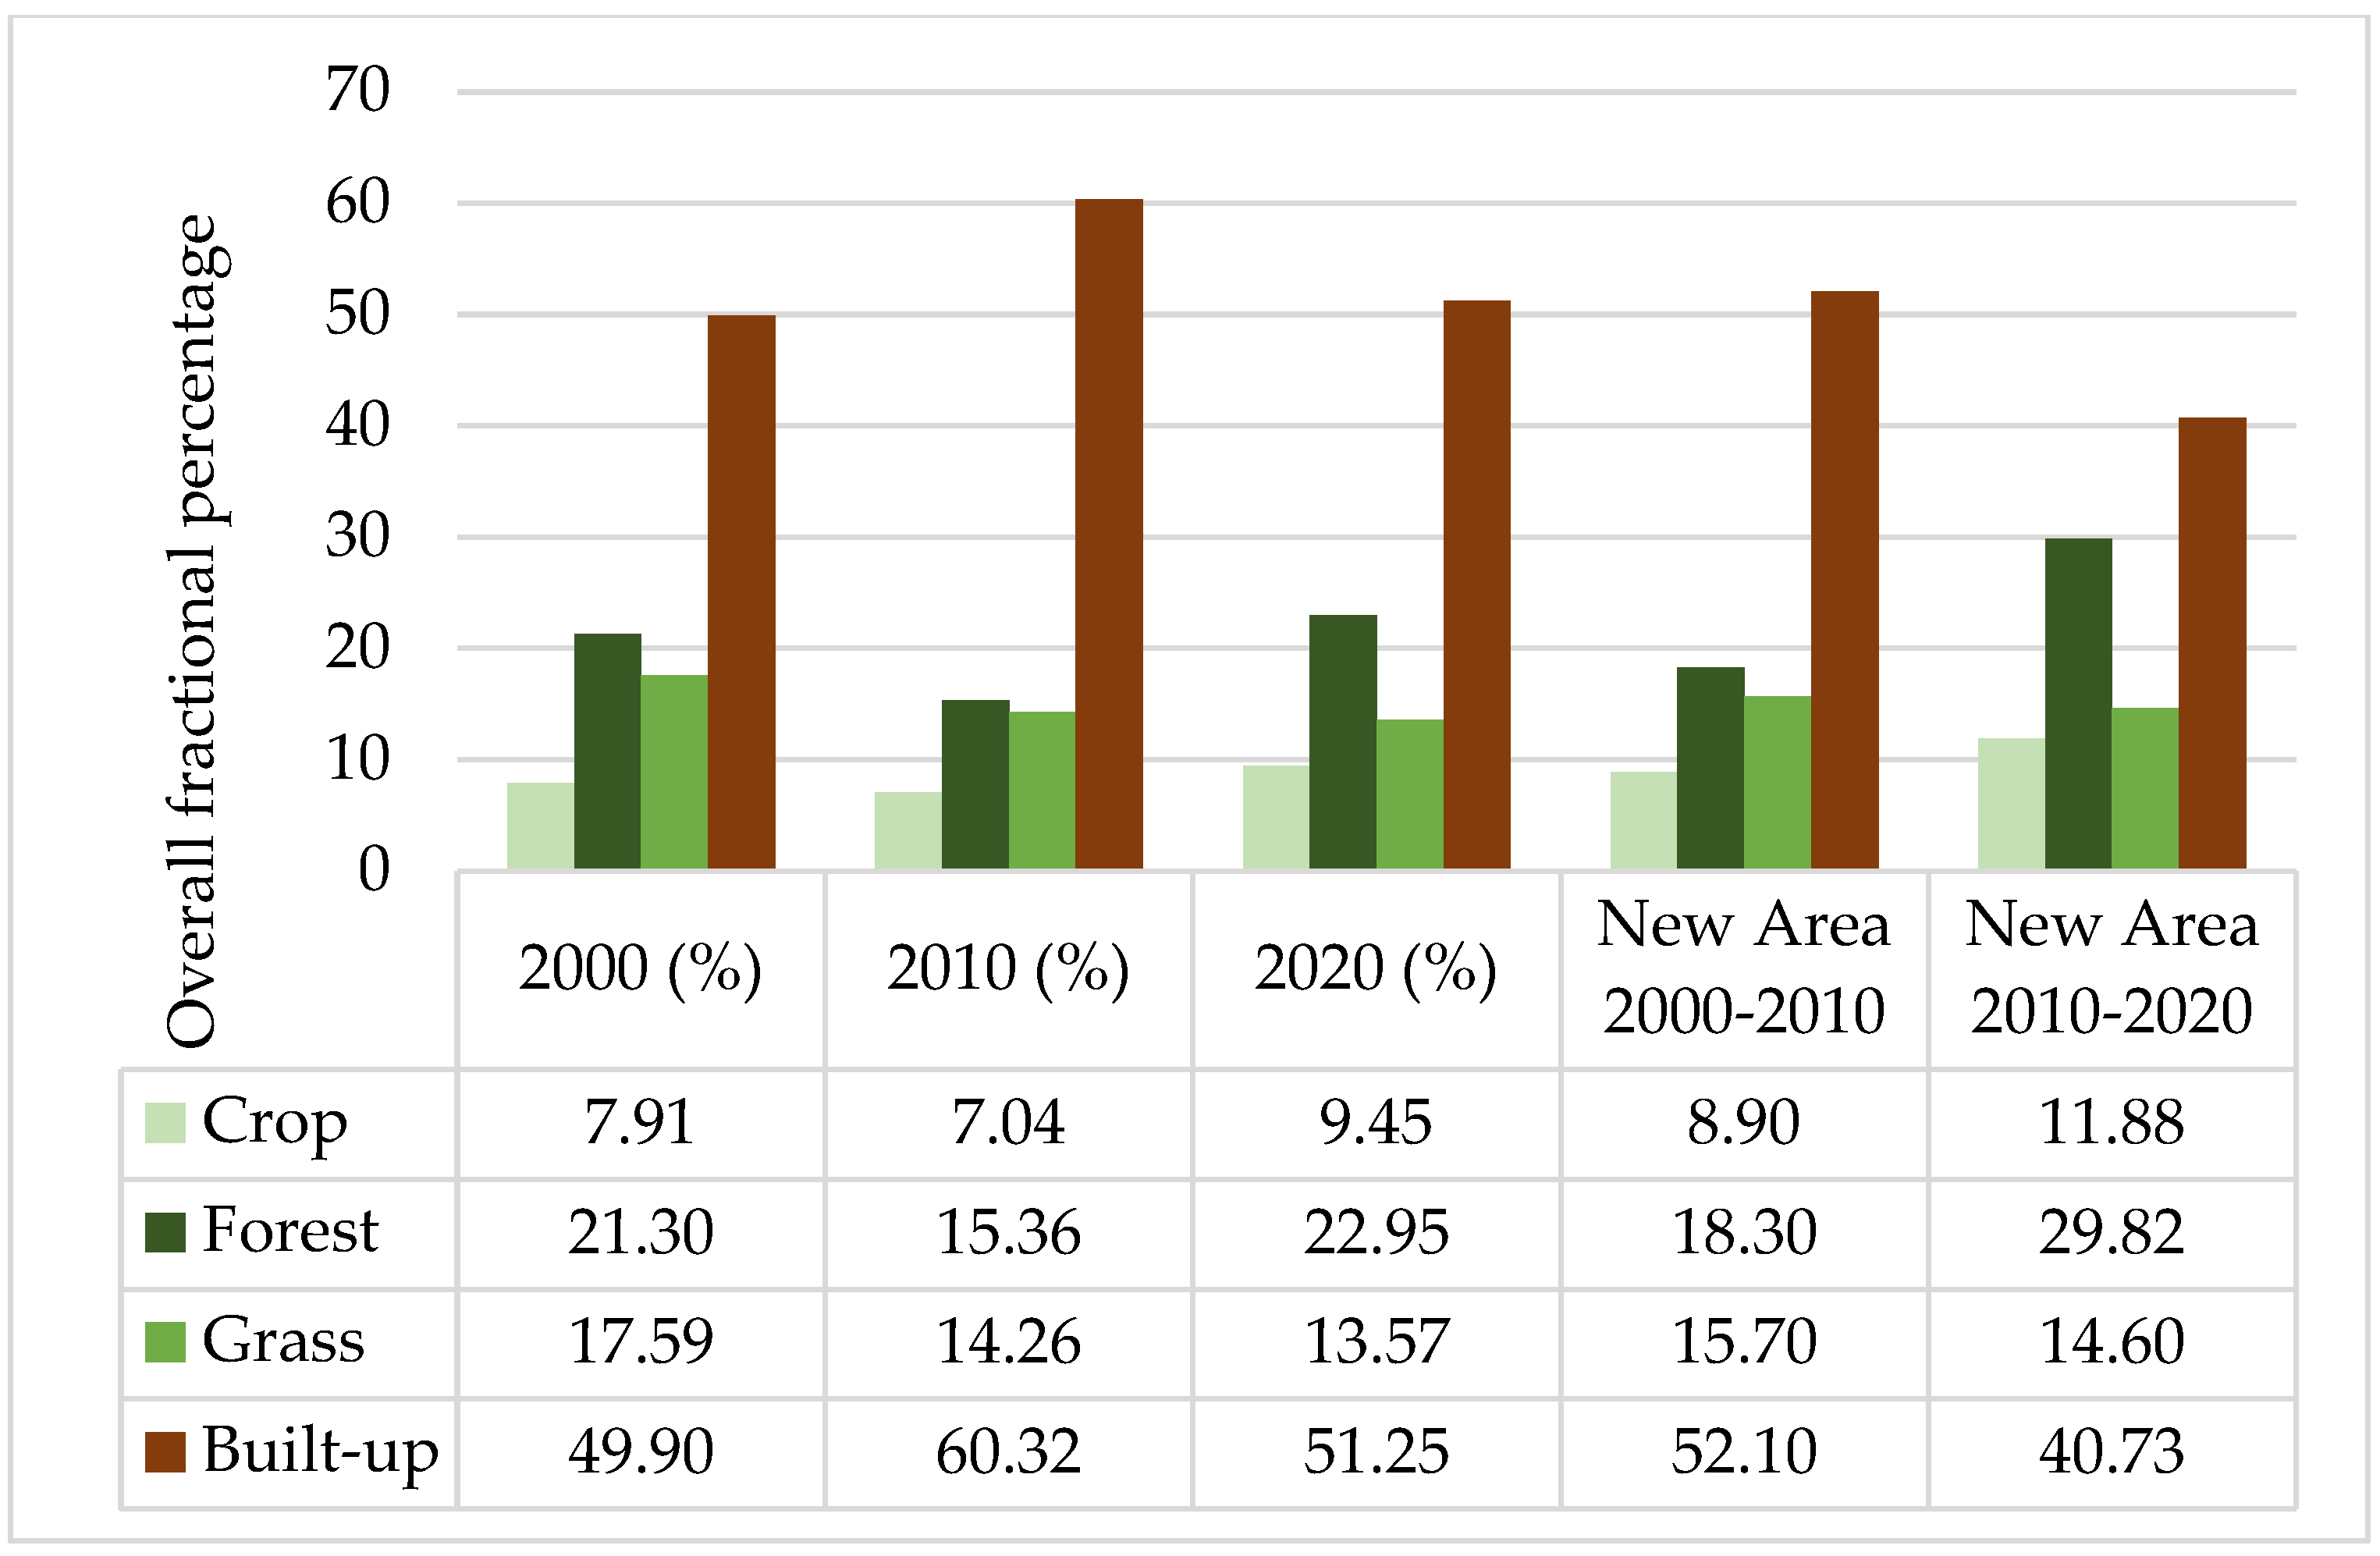
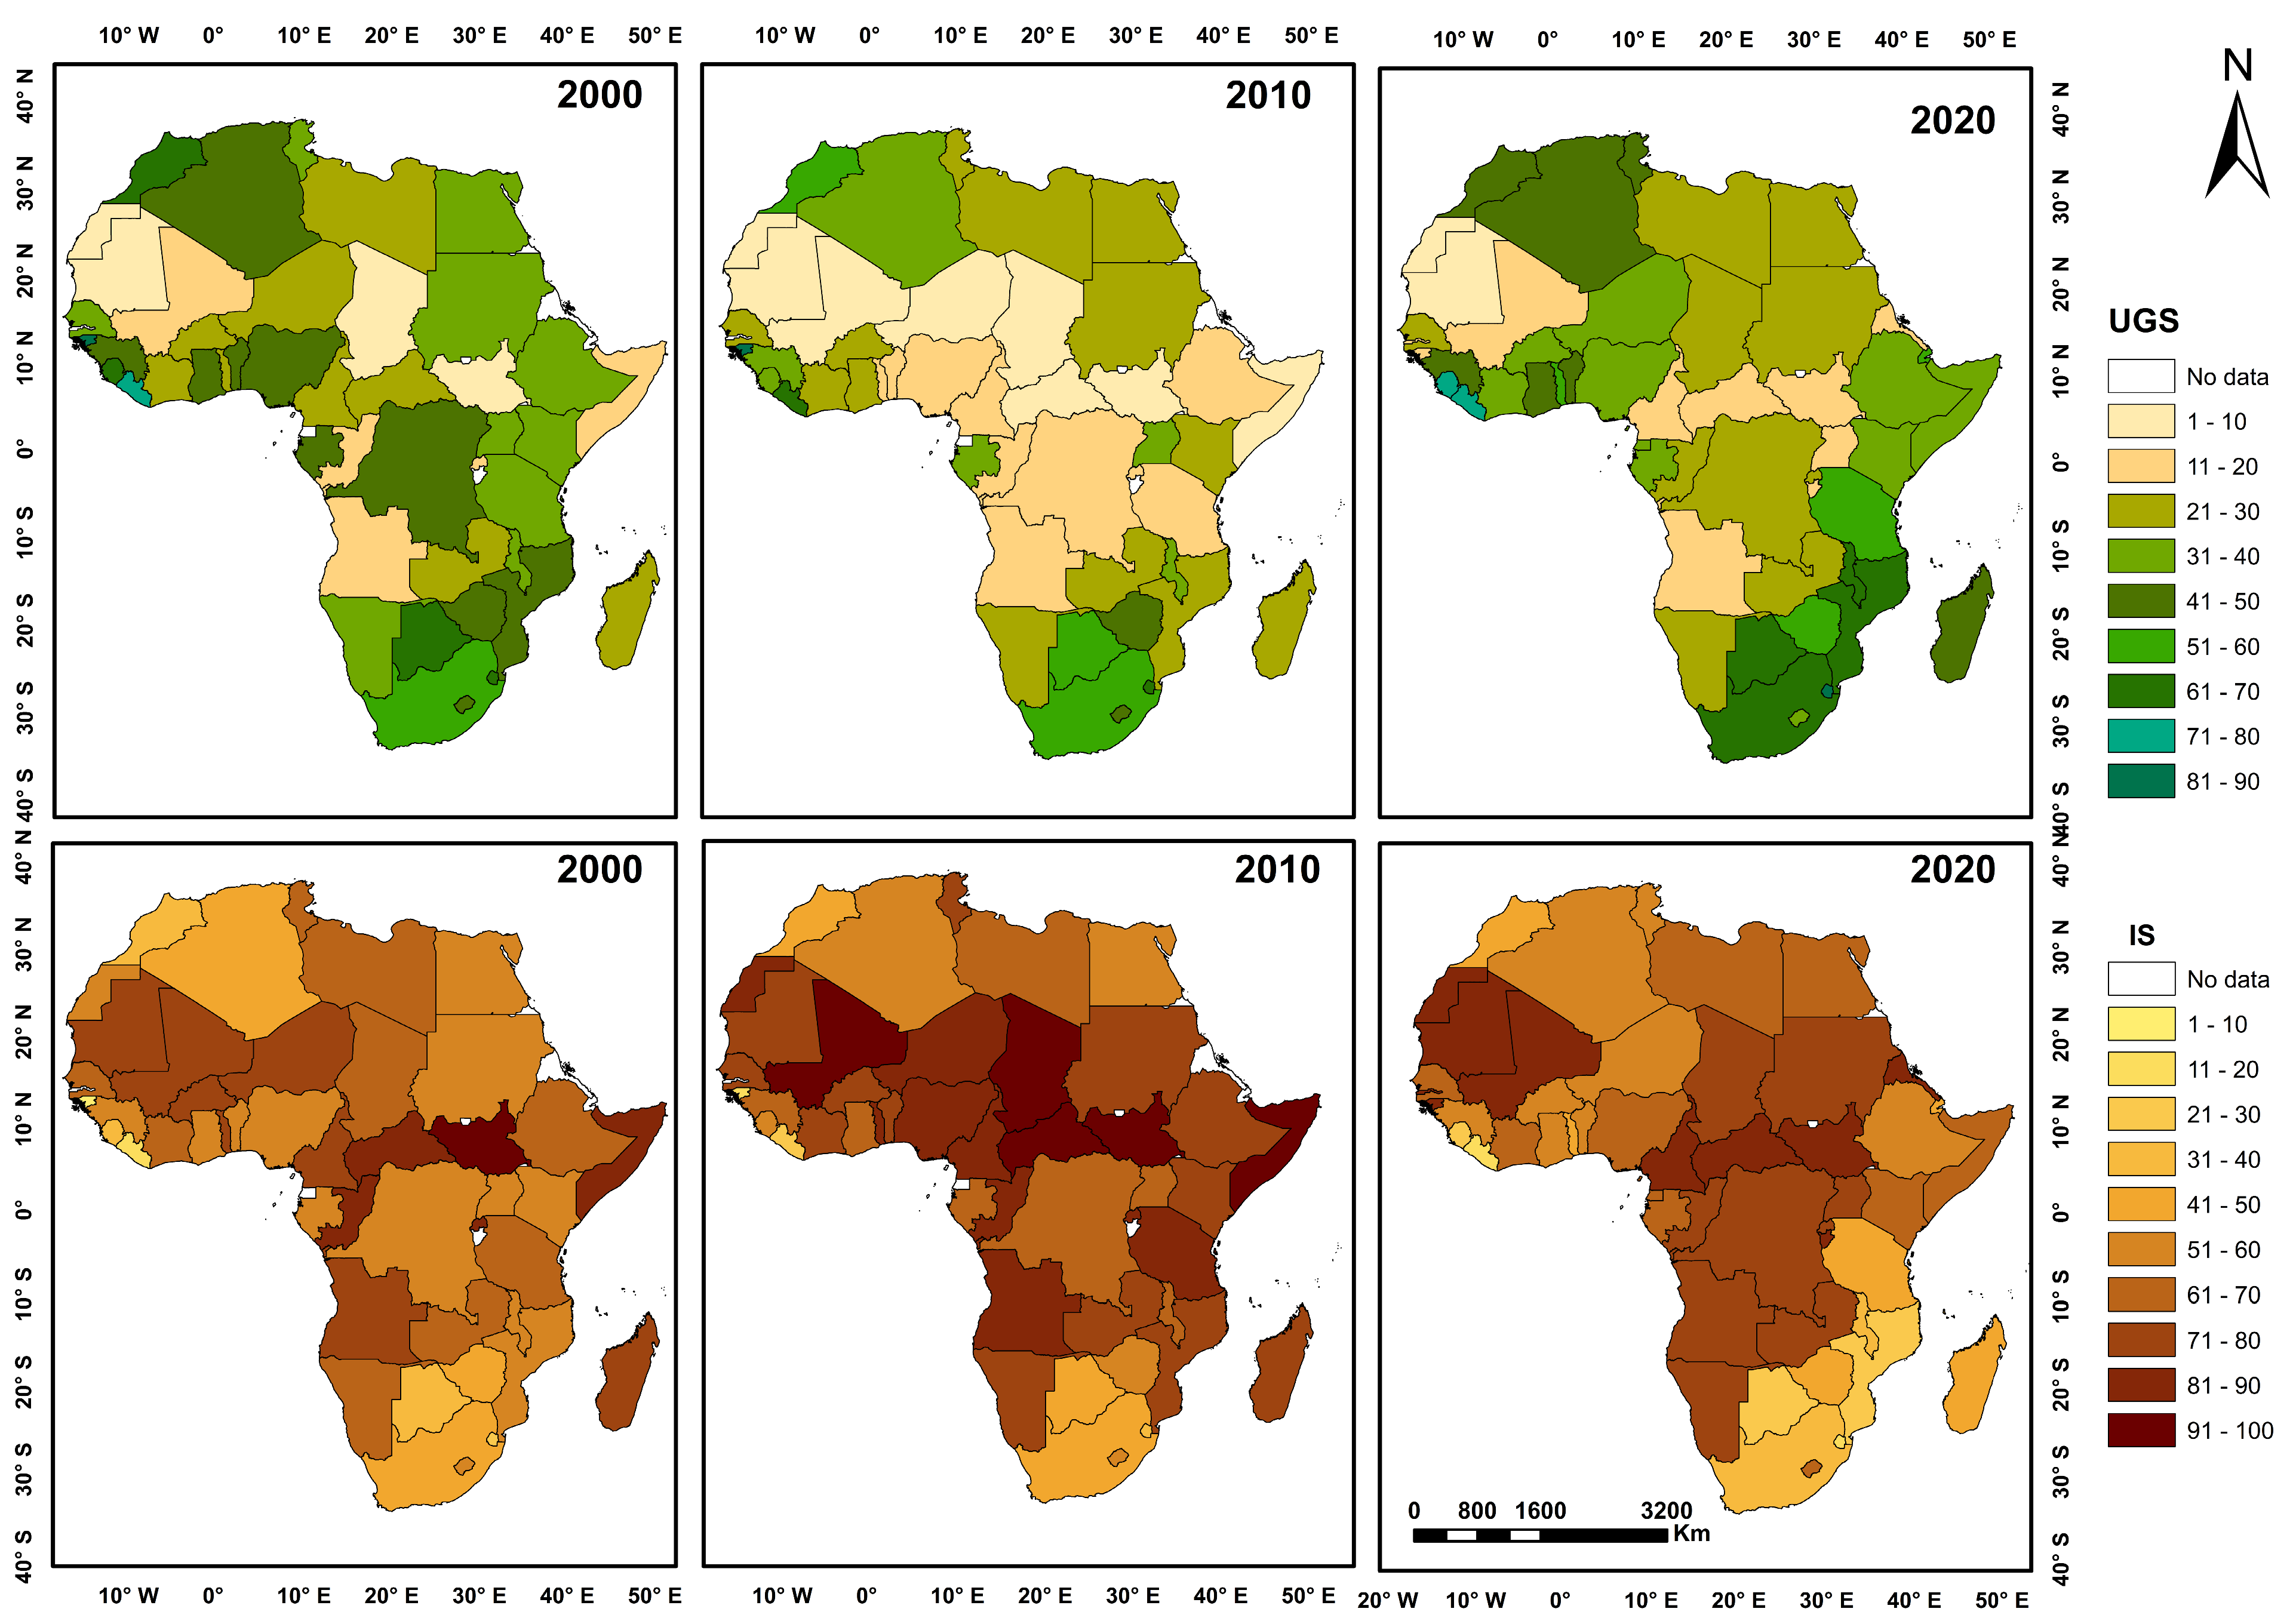
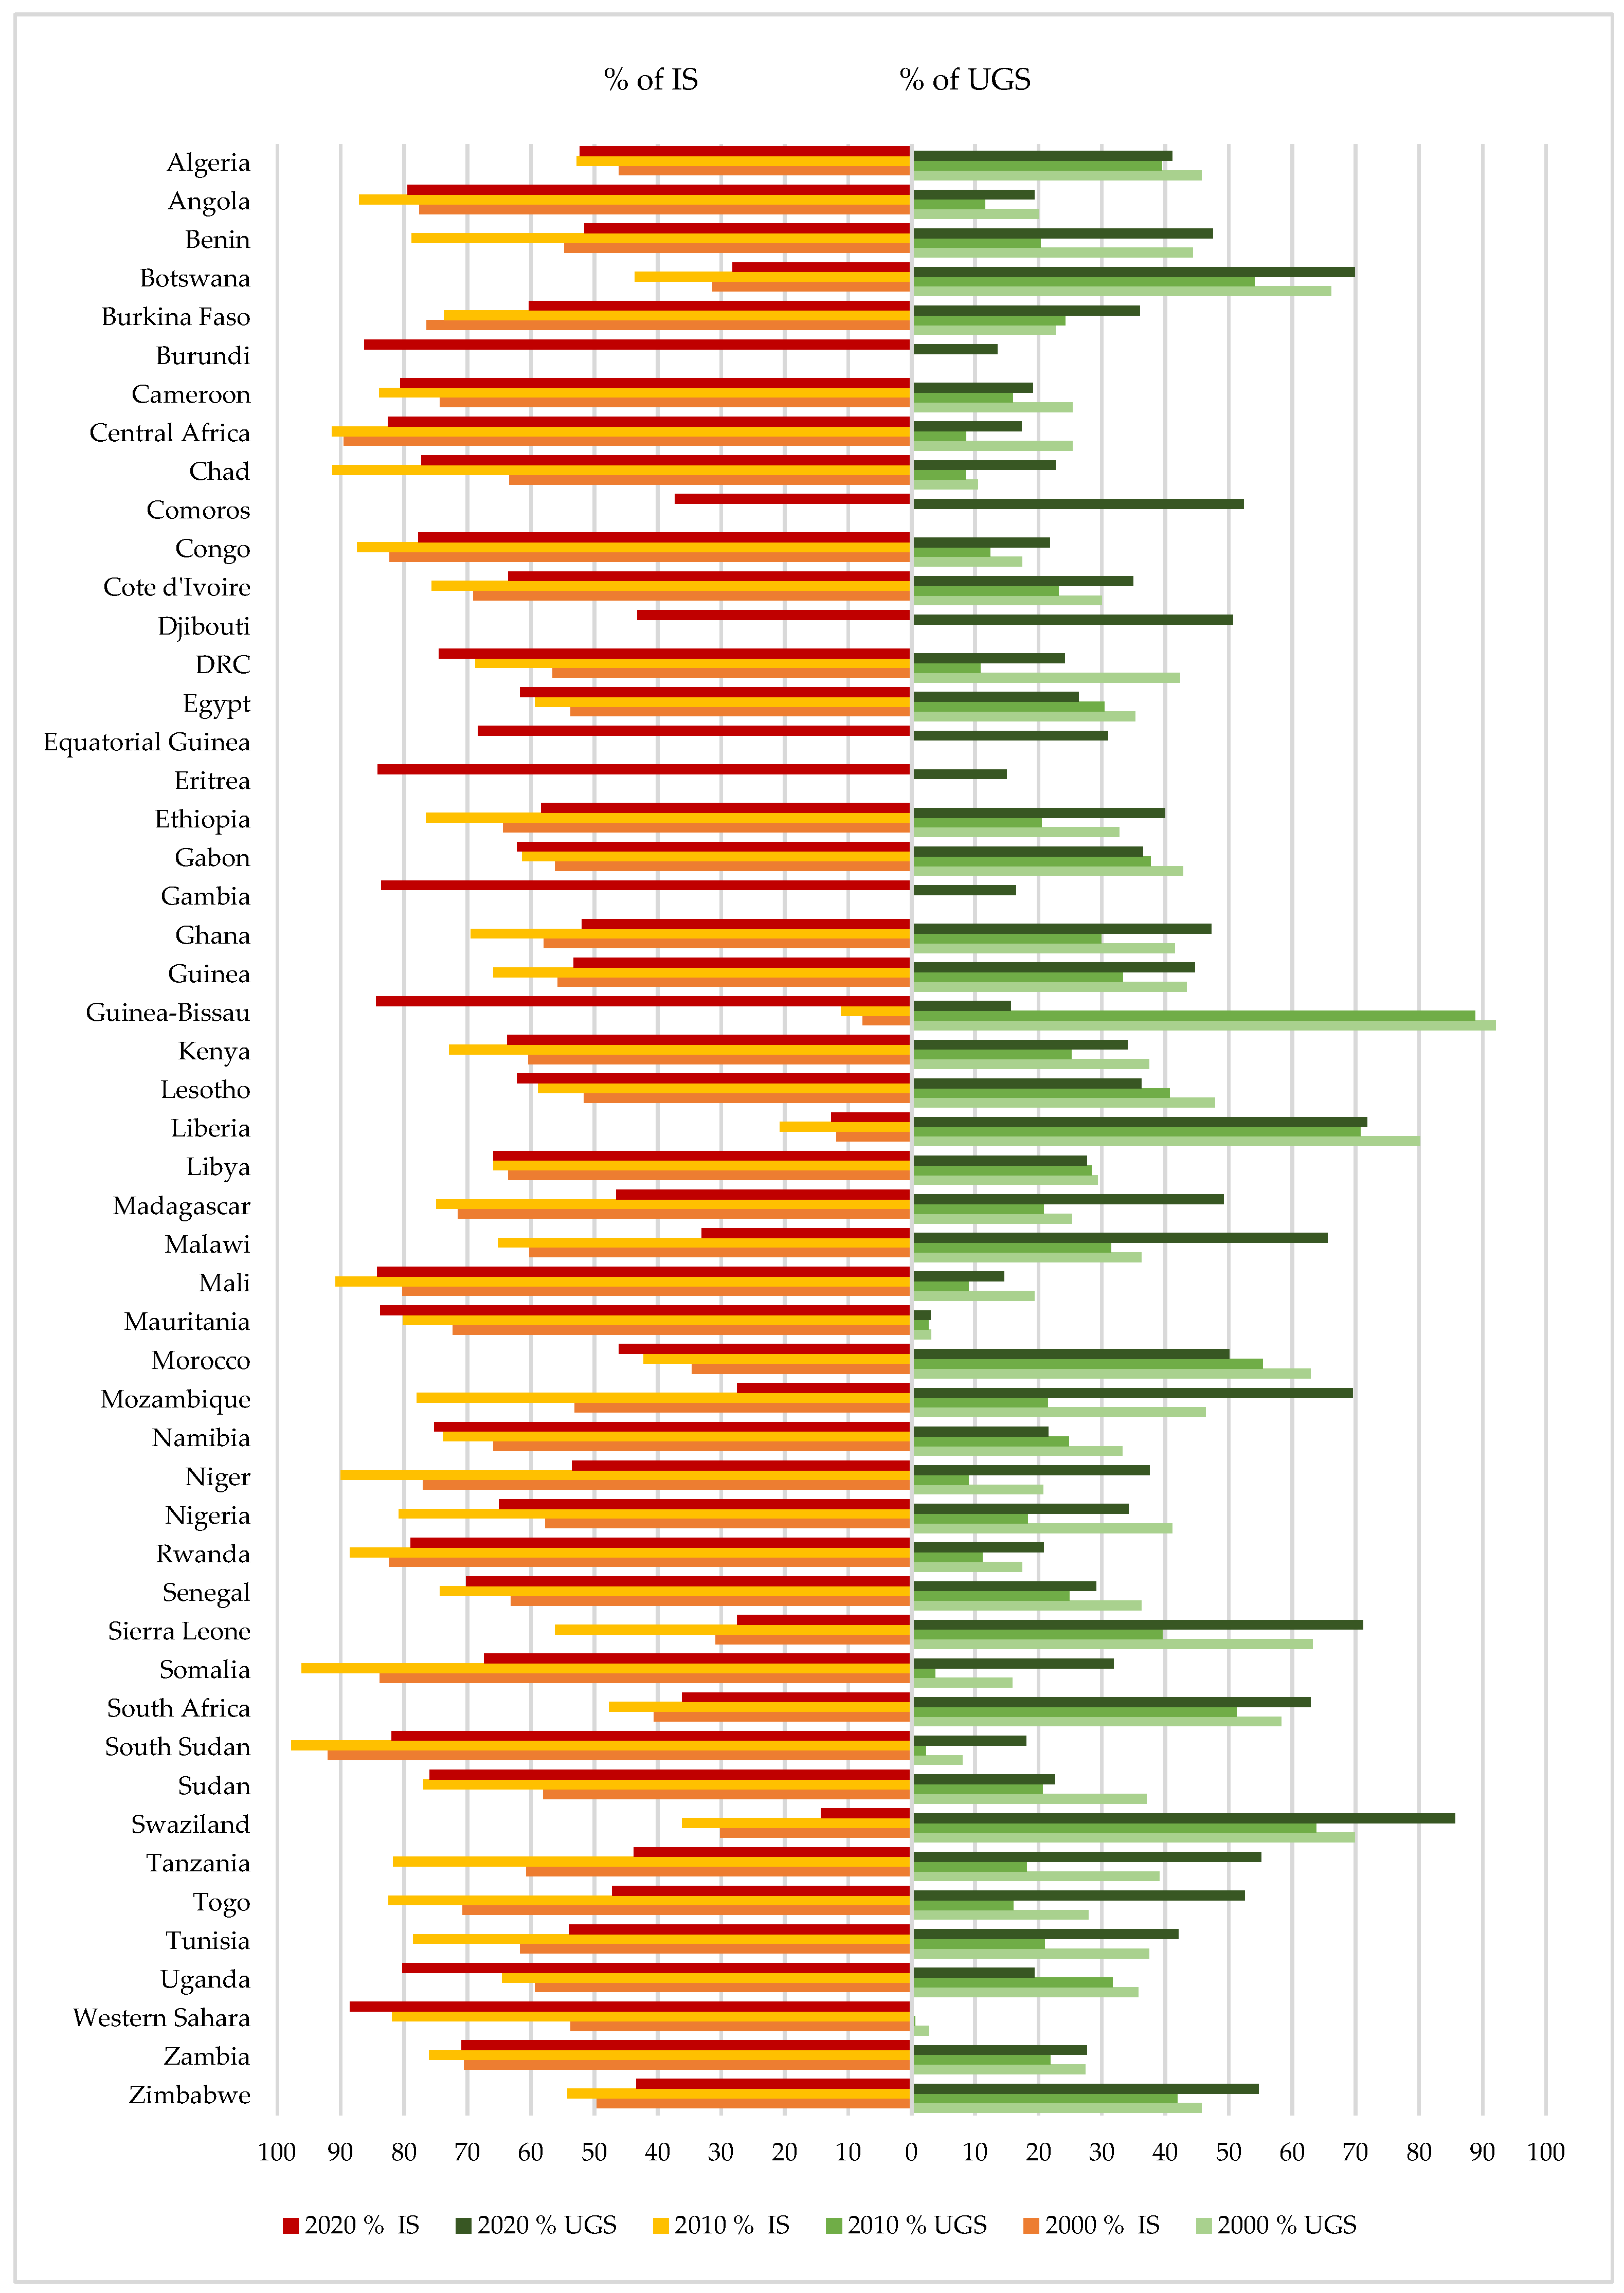
3.2. Spatiotemporal Dynamics of Green Spaces and Built-Up Areas

Over a decade, the total built-up area inside the urban boundaries across the continent experienced significant growth, witnessing a 40% increase from 14,459.8 km2, constituting 50.9% of the total area in 2000, to 20,434.2 km2, representing 60.9% of the total area in 2010. The subsequent decade witnessed an even more substantial expansion, with the built-up area surging by approximately 118.4% from 20,434.2 km2 to around 44,625.7 km2. However, the overall continental fractional percentage of ISs inside urban areas decreased from 60.3% to 51.2%. This remarkable trend underscores the dynamic transformation and notable urbanization that occurred over the two successive decades. From 2000 to 2010, the continental newly expanded area saw a small increase of about 2% in its proportion compared to the starting year. In contrast, the growth witnessed from 2010 to 2020 was marked by a significant change, with an almost 20% decrease in the fractional share. This shift highlights the differing land cover patterns in the size of the expanded regions during the different periods, which could be the result of population growth and infrastructure development on the continent.
Between 2000 and 2010, the total land area covered by urban green spaces on the continent decreased from around 13,050.8 km2, which accounted for approximately 46% of the total area, to 12,101.5 km2, representing about 35.9% of the total area. During this period, forest cover experienced a significant decline of approximately −14%, while grasslands saw a reduction of −3.3% and farmlands had only a small decrease of −0.8%. As can be seen in Figure 3, the newly expanded areas in this decade had a higher fractional percentage of the built-up area but a smaller proportion of the overall green spaces compared to the initial year. It is important to note that the fraction of cropland increased by 1% compared to the initial year.
The spatial dynamics of UGSs in the subsequent decade exhibited a distinct pattern in comparison to the preceding one (Figure 4). Notably, there was a substantial surge in the total area of green spaces, registering an impressive increase of approximately 225.2%. The initial extent of 12,101.5 km2, encompassing 15.4% forest, 14.3% grassland, and 7.04% cropland, transformed to 39,353.6 km2, with the fractional distribution of 23% forest, 13.6% grassland, and 9.4% cropland. This remarkable alteration in green space composition led to an overall continental fractional share modification, transitioning from 36.7% to approximately 47%. This shift was primarily driven by a significant augmentation in forested areas, accompanied by a marginal increase in cropland proportions. The intricate transformation in the landscape composition underscores the dynamic nature of urban green spaces over the specified temporal period. Furthermore, the newly developed urban areas exhibited a noteworthy uptick in the continental UGS percentage between 2010 and 2020. For example, in the baseline year of 2010, the overall UGS percentage observed a substantial 20% increase, accentuating the expanding influence of urban green spaces on the continental landscape.
Surprisingly, the average proportion of UGSs at the regional scale exhibited no statistically significant disparities among the various geographical regions. In the year 2010, the highest average percentage was approximately 37.3% in the northern region, while the lowest was recorded at 36.2% in the middle region. A decade later, the mean fractional allocations witnessed a uniform decline of approximately 10% across all regions, with the northern region maintaining the highest proportion at 27.0% and the western region registering the lowest at approximately 26.2%. This temporal analysis reveals a nearly ten percent augmentation in the overall UGS proportion across the diverse regions from 2010 to 2020. Figure 5 shows countries’ fractional percentages of both UGSs and ISs for different years. In the majority of the countries, we observed a consistent temporal pattern indicating a decline in the proportion of UGSs alongside an increase in ISs during the initial ten years of our study period. However, during the subsequent decade, we noticed a reversal of this trend, with a rise in the percentage of UGSs and a decrease in the proportion of ISs. This shift in temporal dynamics suggests a noteworthy change in the balance between urban expansion and land cover change on the continent.

4. Discussion

4.1. Urban Land Expansion

The analysis revealed a profound transformation in Africa’s urban landscape between 2000 and 2020, marked by a 207% expansion in urban extent. This surge, concentrated in the 2010–2020 period, underscore a continent-wide acceleration of urbanization, with the regional disparities highlighting divergent developmental trajectories. This acceleration was accompanied by a significant rise in both the mean and standard deviation of urban expansion rates, indicating not only rapid growth but also increasing heterogeneity across nations. Regional disparities were evident, with Eastern Africa exhibiting the highest annual growth rate of 20.96% in the latter decade. This contrasted sharply with the more moderate growth observed in the early 2000s. The shifting drivers of urbanization are particularly notable. The weak correlation between urban growth and GDP during 2000–2010, despite robust economic expansion (mean GDP growth = 223.4%), suggests that early urbanization was decoupled from economic intensification, possibly driven by rural–urban migration or informal settlement proliferation. Conversely, the significant association with population growth (ρ = 0.313, p = 0.039) in 2010–2020 indicates a transition to demographically driven urbanization, aligning with the continent’s youth bulge and rising urban fertility rates [61]. This could justify the substantial increase in urban expansion across all African nations within this period. Another reason could be that in the latter decade, the majority of urban areas were small urban settlements (<10 km2), constituting 86% of Africa’s cities by 2020. Smaller cities may experience fragmented, low-density sprawl, which could explain the paradox of rising built-up areas alongside declining impervious surface (IS) fractions in later decades. Such patterns emphasize the challenges of managing sustainable urban growth across a mosaic of rapidly expanding towns and cities.
The surge in urban expansion observed in our study can be related to a study that found that the total built-up area in China had a 287.60% increase from 1995 to 2018 [62], with the rate of urban expansion higher than that of population growth [63]. The contrasting rates of urban expansion observed across the different regions of Africa were positively correlated to urban growth, especially between 2010 and 2020. One study found that urban expansion in Africa was first marked by urban sprawl, wherein existing rural settlements were engulfed by expanding urban areas. Unlike the fixed administrative boundaries of cities, the morphological boundaries of urban agglomerations evolve and often encroach upon rural territories. Secondly, a remarkable and widespread was the in-situ urbanization of rural regions. This occurred when rural areas attained a population density threshold that prompted their reclassification as urban zones. This process blurs the distinction between urban agglomerations and rural settlements, potentially leading to extensive and rapid urbanization. This could have been the case in our study, leading to the observed urban growth [64].
The urban expansion pattern across Africa within the study period suggests a fundamental shift in the continent’s demographic and developmental landscape. This rapid urbanization has profound implications for infrastructure development, resource management, and social dynamics, necessitating careful urban planning and policy interventions to address the emerging challenges and opportunities [65].

4.2. Green Spaces and Impervious Surfaces Dynamics

The ratio of UGSs to ISs is a fundamental element within urban settings. These components play a crucial role in the assessment of urban environmental quality and in the efforts to tackle issues related to global environmental change [54,66]. Their presence and characteristics are key factors in understanding and managing the environmental dynamics of urban areas, influencing various aspects of sustainability and resilience in the face of ongoing environmental challenges worldwide [67,68]. The interplay between impervious surfaces and UGSs revealed a dual-phase transition. During 2000–2010, IS dominance grew (50.9% to 60.9% of urban areas), accompanied by a loss of UGSs (−14% in forests, −3.3% in grasslands). This aligned with the early urbanization phases that were characterized by land conversion for housing and infrastructure. However, the subsequent decade witnessed a striking reversal: IS fractional coverage declined to 51.2% despite a 118.4% surge in absolute built-up areas, while UGSs rebounded by 225.2%. This was driven by forest regeneration (23% of total UGSs by 2020) and cropland incorporation.
This paradox of a rising urban area but a declining IS fraction suggests that urban expansion increasingly occurred in peri-urban zones with pre-existing green cover or adopted lower-density development patterns. The predominance of small urban settlements further contextualizes these trends, because smaller cities may experience fragmented, low-density sprawl. The integration of croplands (9.4% of UGSs by 2020) hints at agro-urban landscapes, where cities expand into agricultural belts but preserve partial green cover. Policy shifts, such as urban greening initiatives or stricter land-use regulations, may also explain this trend, though further regional studies are needed to confirm the causal mechanisms. Regionally, the uniform ~10% decline in UGS proportion (2010–2020) contrasted with absolute UGS gains, highlighting the complex interplay between urban expansion and green space preservation. Northern Africa’s relatively high UGS retention (27.0% in 2020) may reflect adaptive strategies in arid regions, where green infrastructure is critical for climate resilience. The overall prevalence of UGSs, particularly forest cover, during this period could be linked to the fact that the eastern and southern parts of Africa accounted for approximately 70% of the continental urban expansion, while collectively these two regions were home to around 40% of the total African forest cover [69]. Though some countries exhibited higher percentages of UGSs compared to others throughout the study period; however, there was no significant difference in the average fractional share among the regions. While certain countries showed higher UGS percentages than others during the study period, there was no notable variation in the average fractional share across the regions. The differences in green space proportions among cities globally have been linked to various factors, including the natural geographical setting, economic development, urban expansion, land use changes, and environmental policies [68,70,71,72,73]. Even if both the rate and form of urbanization in Africa are unique, the above factors have a significant influence in shaping urban landcover patterns on the continent.

4.3. Limitations and Future Study

While this study provides valuable insights into urban change in Africa, it is essential to acknowledge its potential limitations. This study’s reliance on continental-scale metrics may have masked local heterogeneity. For example, the satellite-derived classifications of UGSs and ISs could have conflated natural forests with street trees or croplands, affecting accuracy. Future research should integrate high-resolution remote sensing data with ground-truth data and socioeconomic factors, which are necessary to refine our understanding of the drivers of urbanization, such as land tenure systems or climate adaptation policies. Longitudinal case studies could further elucidate the role of governance in shaping urbanization outcomes.

5. Conclusions

This study presents a comprehensive analysis of urban expansion, green space, and impervious surface dynamics in Africa from 2000 to 2020, utilizing medium-resolution global datasets. A dramatic 307% increase in urban areas was observed, predominantly as a result of small cities sprouting. The initial decade of the study period was characterized by a decline in green spaces and a corresponding expansion of impervious surfaces, indicating a negative correlation between urbanization and environmental quality. However, a notable shift emerged during the 2010s, with a 20% growth in urban green spaces and a reduction in impervious surfaces. This trend, marked by a substantial 225.2% increase in the total green space area, primarily driven by forest expansion, suggests a potential decoupling of urbanization from environmental degradation.
The observed increase in green spaces holds significant implications for urban sustainability and improved human well-being. Moreover, the expansion of forested areas within urban environments can enhance carbon sequestration and mitigate the impacts of climate change. However, the composition and accessibility of green spaces are crucial factors influencing their benefits. Future research should delve deeper into the types of green spaces emerging in African cities, their spatial distribution, and the extent to which they are accessible to residents. Africa’s urban transformation over these two decades reflects the dynamic interactions between demographic forces, economic shifts, and environmental adaptation. While challenges persist, the resurgence of green spaces in tandem with urban expansion offers a foundation for resilient cities. Addressing spatial inequities and strengthening urban governance will be pivotal in steering this growth toward sustainability.

Author Contributions

Conceptualization, J.P.M. and W.Z.; methodology, J.P.M.; software, J.P.M.; validation, J.P.M. and W.Z.; formal analysis, J.P.M.; investigation, J.P.M.; resources, J.P.M.; data curation, J.P.M.; writing—original draft preparation, J.P.M.; writing—review and editing, J.P.M.; visualization, J.P.M.; supervision, W.Z. All authors have read and agreed to the published version of the manuscript.

Funding

This research was funded by the National Nature Science Foundation of China (Grant No. 43261144888).

Institutional Review Board Statement

Not applicable.

Informed Consent Statement

Not applicable.

Data Availability Statement

The data presented in this study are available on request from the corresponding author.

Acknowledgments

The first author acknowledges the sponsorship of the Chinese Academy of Science (CAS) in partnership with The World Academy of Sciences (TWAS) President’s Fellowship Program for his PhD studies at the University of Chinese Academy of Sciences.

Conflicts of Interest

The authors declare no conflicts of interest.

References

  1. Liu, Y.; Yang, M.; Cui, J. Urbanization, economic agglomeration and economic growth. Heliyon 2024, 10, e23772. [Google Scholar] [CrossRef]
  2. Zhong, C.; Guo, H.; Swan, I.; Gao, P.; Yao, Q.; Li, H. Evaluating trends, profits, and risks of global cities in recent urban expansion for advancing sustainable development. Habitat Int. 2023, 138, 102869. [Google Scholar] [CrossRef]
  3. Zhao, Q.; Gao, L.; Meng, Q.; Zhu, M.; Xiong, M. Nonlinear causal relationships between urbanization and extreme climate events in China. J. Clean. Prod. 2024, 434, 139889. [Google Scholar] [CrossRef]
  4. Zhou, D.; Xiao, J.; Frolking, S.; Zhang, L.; Zhou, G. Urbanization Contributes Little to Global Warming but Substantially Intensifies Local and Regional Land Surface Warming. Earths Future 2022, 10, e2021EF002401. [Google Scholar] [CrossRef]
  5. Cao, J.; Zhou, W.; Yu, W.; Hu, X.; Yu, M.; Wang, J.; Wang, J. Urban expansion weakens the contribution of local land cover to urban warming. Urban Clim. 2022, 45, 101285. [Google Scholar] [CrossRef]
  6. Gao, S.; Chen, Y.; Chen, D.; He, B.; Gong, A.; Hou, P.; Li, K.; Cui, Y. Urbanization-induced warming amplifies population exposure to compound heatwaves but narrows exposure inequality between global North and South cities. npj Clim. Atmos. Sci. 2024, 7, 154. [Google Scholar] [CrossRef]
  7. European Commission. Towards an EU Research and Innovation Policy Agenda for Nature-Based Solutions & Re-Naturing Cities: Final Report of the Horizon 2020 Expert Group on ‘Nature-Based Solutions and Re-Naturing Cities’; Publications Office: Luxembourg, 2015. [Google Scholar]
  8. IUCN. Nature-Based Solutions to Address Global Societal Challenges; IUCN International Union for Conservation of Nature: Gland, Switzerland, 2016. [Google Scholar] [CrossRef]
  9. Nassary, E.K.; Msomba, B.H.; Masele, W.E.; Ndaki, P.M.; Kahangwa, C.A. Exploring Urban Green Packages as Part of Nature-Based Solutions for Climate Change Adaptation Measures in Rapidly Growing Cities of the Global South; Academic Press: Cambridge, MA, USA, 2022. [Google Scholar] [CrossRef]
  10. Dondina, O.; Tirozzi, P.; Viviano, A.; Mori, E.; Orioli, V.; Tommasi, N.; Tanzi, A.; Bazzoli, L.; Caprio, E.; Patetta, C.; et al. Spatial and habitat determinants of small-mammal biodiversity in urban green areas: Lessons for nature-based solutions. Urban For. Urban Green. 2025, 104, 128641. [Google Scholar] [CrossRef]
  11. Bourgeois, M.; Boutreux, T.; Vuidel, G.; Savary, P.; Piot, P.; Bellec, A.; Kaufmann, B. Assessing the strategic role of urban green spaces for habitat connectivity in multi-family residential plots. Urban For. Urban Green. 2024, 99, 128471. [Google Scholar] [CrossRef]
  12. Ai, H.; Zhang, X.; Zhou, Z. The impact of greenspace on air pollution: Empirical evidence from China. Ecol. Indic. 2023, 146, 109881. [Google Scholar] [CrossRef]
  13. Selmi, W.; Weber, C.; Riviere, E.; Blond, N.; Mehdi, L.; Nowak, D. Air pollution removal by trees in public green spaces in Strasbourg city, France. Urban For. Urban Green. 2016, 17, 192–201. [Google Scholar] [CrossRef]
  14. Gillerot, L.; Landuyt, D.; De Frenne, P.; Muys, B.; Verheyen, K. Urban tree canopies drive human heat stress mitigation. Urban For. Urban Green. 2024, 92, 128192. [Google Scholar] [CrossRef]
  15. Wong, N.H.; Tan, C.L.; Kolokotsa, D.D.; Takebayashi, H. Greenery as a mitigation and adaptation strategy to urban heat. Nat. Rev. Earth Environ. 2021, 2, 166–181. [Google Scholar] [CrossRef]
  16. Wang, Q.; Peng, J.; Yu, S.; Dan, Y.; Dong, J.; Zhao, X.; Wu, J. Key attributes of greenspace pattern for heat mitigation vary with urban functional zones. Landsc. Ecol. 2023, 38, 2965–2979. [Google Scholar] [CrossRef]
  17. Koprowska, K.; Laszkiewicz, E.; Kronenberg, J.; Marcinczak, S. Subjective perception of noise exposure in relation to urban green space availability. Urban For. Urban Green. 2018, 31, 93–102. [Google Scholar] [CrossRef]
  18. Margaritis, E.; Kang, J. Relationship between urban green spaces and other features of urban morphology with traffic noise distribution. Urban For. Urban Green. 2016, 15, 174–185. [Google Scholar] [CrossRef]
  19. Aerts, R.; Honnay, O.; Van Nieuwenhuyse, A. Biodiversity and human health: Mechanisms and evidence of the positive health effects of diversity in nature and green spaces. Br. Med. Bull. 2018, 127, 5–22. [Google Scholar] [CrossRef]
  20. Houlden, V.; Jani, A.; Hong, A. Is biodiversity of greenspace important for human health and wellbeing? A bibliometric analysis and systematic literature review. Urban For. Urban Green. 2021, 66, 127385. [Google Scholar] [CrossRef]
  21. UN-Habitat. World Cities Report 2022: Envisaging the Future of Cities; UN-Habitat: Nairobi, Kenya, 2022. [Google Scholar]
  22. United Nations. World Urbanization Prospects the 2018 Revision; United Nations: New York, NY, USA, 2019. [Google Scholar]
  23. Abass, K.; Buor, D.; Afriyie, K.; Dumedah, G.; Segbefi, A.Y.; Guodaar, L.; Garsonu, E.K.; Adu-Gyamfi, S.; Forkuor, D.; Ofosu, A.; et al. Urban sprawl and green space depletion: Implications for flood incidence in Kumasi, Ghana. Int. J. Disaster Risk Reduct. 2020, 51, 101915. [Google Scholar] [CrossRef]
  24. Abass, K.; Adanu, S.K.; Agyemang, S. Peri-urbanisation and loss of arable land in Kumasi Metropolis in three decades: Evidence from remote sensing image analysis. Land Use Policy 2018, 72, 470–479. [Google Scholar] [CrossRef]
  25. Puplampu, D.A.; Boafo, Y.A. Exploring the impacts of urban expansion on green spaces availability and delivery of ecosystem services in the Accra metropolis. Environ. Chall. 2021, 5, 100283. [Google Scholar] [CrossRef]
  26. Urban, M.C.; Alberti, M.; De Meester, L.; Zhou, Y.; Verrelli, B.C.; Szulkin, M.; Schmidt, C.; Savage, A.M.; Roberts, P.; Rivkin, L.R.; et al. Interactions between climate change and urbanization will shape the future of biodiversity. Nat. Clim. Change 2024, 14, 436–447. [Google Scholar] [CrossRef]
  27. Anderson, B.; Prieto-Curiel, R.; Patiño, J. City Shapes and Climate Change in Africa; West African Papers; OECD: Paris, France, 2023. [Google Scholar] [CrossRef]
  28. Chitonge, H.; Mfune, O. The urban land question in Africa: The case of urban land conflicts in the City of Lusaka, 100 years after its founding. Habitat Int. 2015, 48, 209–218. [Google Scholar] [CrossRef]
  29. Yirga Ayele, B.; Megento, T.L.; Habetemariam, K.Y. The governance and management of green spaces in Addis Ababa, Ethiopia. Heliyon 2022, 8, e09413. [Google Scholar] [CrossRef]
  30. Wijesinghe, A.; Thorn, J.P.R. Governance of urban green infrastructure in informal settlements of windhoek, Namibia. Sustainability 2021, 13, 8937. [Google Scholar] [CrossRef]
  31. de Oliveira, J.A.P.; Ahmed, A. Governance of urban agriculture in African cities: Gaps and opportunities for innovation in Accra, Ghana. J. Clean. Prod. 2021, 312, 127730. [Google Scholar] [CrossRef]
  32. Jiang, L.; Deng, X.; Seto, K.C. The impact of urban expansion on agricultural land use intensity in China. Land Use Policy 2013, 35, 33–39. [Google Scholar] [CrossRef]
  33. Anderson, B.; Patiño Quinchia, J.E.; Prieto Curie, R. Boosting African Cities’ Resilience to Climate Change: The Role of Green Spaces; OECD: Paris, France, 2022. [Google Scholar] [CrossRef]
  34. Ofori, S.A.; Asante, F.; Boatemaa Boateng, T.A.; Dahdouh-Guebas, F. The composition, distribution, and socio-economic dimensions of Ghana’s mangrove ecosystems. J. Environ. Manag. 2023, 345, 118622. [Google Scholar] [CrossRef]
  35. Donaldson, R.; Ferreira, S.; Didier, S.; Rodary, E.; Swanepoel, J. Access to the urban national park in Cape Town: Where urban and natural environment meet. Habitat Int. 2016, 57, 132–142. [Google Scholar] [CrossRef]
  36. Venter, Z.S.; Shackleton, C.M.; Van Staden, F.; Selomane, O.; Masterson, V.A. Green Apartheid: Urban green infrastructure remains unequally distributed across income and race geographies in South Africa. Landsc. Urban Plan. 2020, 203, 103889. [Google Scholar] [CrossRef]
  37. Shackleton, C.M.; Gwedla, N. The Legacy Effects of Colonial and Apartheid Imprints on Urban Greening in South Africa: Spaces, Species, and Suitability. Front. Ecol. Evol. 2021, 8, 579813. [Google Scholar] [CrossRef]
  38. Chen, L.; Chen, M.; Zhang, X.; Xian, Y. Evaluating inequality divides in urban development intensity between the Global North and South. Land Use Policy 2024, 145, 107291. [Google Scholar] [CrossRef]
  39. Han, Y.; He, J.; Liu, D.; Zhao, H.; Huang, J. Inequality in urban green provision: A comparative study of large cities throughout the world. Sustain. Cities Soc. 2023, 89, 104229. [Google Scholar] [CrossRef]
  40. King, A.; Shackleton, C.M. Maintenance of public and private urban green infrastructure provides significant employment in Eastern Cape towns, South Africa. Urban For. Urban Green. 2020, 54, 126740. [Google Scholar] [CrossRef]
  41. Adeleke, T.G.; Ikudayisi, A.E.; Adegbehingbe, V.O. Evaluation of Maintenances of Green Open Spaces in Urban Area, A case study of the Federal University of Technology Akure, Nigeria. In Proceedings of the 2018 AARCHES National Conference, Zaria, Nigeria, 21–24 February 2018. [Google Scholar]
  42. Takyi, E.; Mensah, H.; Aazore, F.K.; Nalumu, D.J.; Abu, J.J. Understanding the Urban Planning-Green Space Depletion Nexus: Insights from the Kwabre East Municipality, Ghana. Urban Forum 2022, 34, 319–342. [Google Scholar] [CrossRef]
  43. Eshetu, S.B.; Yeshitela, K.; Sieber, S. Urban green space planning, policy implementation, and challenges: The case of Addis Ababa. Sustainability 2021, 13, 11344. [Google Scholar] [CrossRef]
  44. Arku, G.; Yeboah, I.E.A.; Nyantakyi-Frimpong, H. Public parks as an element of urban planning: A missing piece in Accra’s growth and development. Local Environ. 2016, 21, 1500–1515. [Google Scholar] [CrossRef]
  45. Amado, M.; Rodrigues, E.; Poggi, F.; Pinheiro, M.D.; Amado, A.R.; José, H. Using different levels of information in planning green infrastructure in Luanda, Angola. Sustainability 2020, 12, 3162. [Google Scholar] [CrossRef]
  46. Dipeolu, A.A.; Ibem, E.O. Green infrastructure quality and environmental sustainability in residential neighbourhoods in Lagos, Nigeria. Int. J. Urban Sustain. Dev. 2020, 12, 267–282. [Google Scholar] [CrossRef]
  47. AboElata, A.A.A. Study the Vegetation as Urban Strategy to Mitigate Urban Heat Island in Mega City Cairo. Procedia Environ. Sci. 2017, 37, 386–395. [Google Scholar] [CrossRef]
  48. Brown, D. Emerging African towns are critical urban planning priorities: A research agenda for the sub-continent. Cities 2024, 154, 105347. [Google Scholar] [CrossRef]
  49. Agergaard, J.; Tacoli, C.; Steel, G.; Ørtenblad, S.B. Revisiting Rural–Urban Transformations and Small Town Development in Sub-Saharan Africa. Eur. J. Dev. Res. 2019, 31, 2–11. [Google Scholar] [CrossRef]
  50. Li, X.; Gong, P.; Zhou, Y.; Wang, J.; Bai, Y.; Chen, B.; Hu, T.; Xiao, Y.; Xu, B.; Yang, J.; et al. Mapping global urban boundaries from the global artificial impervious area (GAIA) data. Environ. Res. Lett. 2020, 15, 094044. [Google Scholar] [CrossRef]
  51. Zhao, S.; Zhou, D.; Zhu, C.; Sun, Y.; Wu, W.; Liu, S. Spatial and Temporal Dimensions of Urban Expansion in China. Environ. Sci. Technol. 2015, 49, 9600–9609. [Google Scholar] [CrossRef] [PubMed]
  52. Seto, K.C.; Fragkias, M.; Güneralp, B.; Reilly, M.K. A meta-analysis of global urban land expansion. PLoS ONE 2011, 6, e23777. [Google Scholar] [CrossRef]
  53. Fei, W.; Zhao, S. Urban land expansion in China’s six megacities from 1978 to 2015. Sci. Total Environ. 2019, 664, 60–71. [Google Scholar] [CrossRef]
  54. Dou, Y.; Kuang, W. A comparative analysis of urban impervious surface and green space and their dynamics among 318 different size cities in China in the past 25 years. Sci. Total Environ. 2020, 706, 135828. [Google Scholar] [CrossRef]
  55. Mahtta, R.; Fragkias, M.; Güneralp, B.; Mahendra, A.; Reba, M.; Wentz, E.A.; Seto, K.C. Urban land expansion: The role of population and economic growth for 300+ cities. npj Urban Sustain. 2022, 2, 5. [Google Scholar] [CrossRef]
  56. Ma, Q. Integrating ecological correlation into cellular automata for urban growth simulation: A case study of Hangzhou, China. Urban For. Urban Green. 2020, 51, 126697. [Google Scholar] [CrossRef]
  57. Forthofer, R.N.; Lee, E.S.; Hernandez, M. Descriptive Methods. In Biostatistics; Academic Press: Cambridge, MA, USA, 2007; pp. 21–69. [Google Scholar] [CrossRef]
  58. World Bank. World Development Indicators. Available online: https://databank.worldbank.org/source/world-development-indicators (accessed on 6 March 2025).
  59. OECD/SWAC. Africapolis. Available online: https://africapolis.org/en/data?country=Angola&keyfigure=urbanPop&menu=table&type=abs&year=2020 (accessed on 6 March 2025).
  60. Zhang, X.; Liu, L.; Chen, X.; Gao, Y.; Xie, S.; Mi, J. GLC_FCS30: Global land-cover product with fine classification system at 30 m using time-series Landsat imagery. Earth Syst. Sci. Data 2021, 13, 2753–2776. [Google Scholar] [CrossRef]
  61. Tesfa, D.; Tiruneh, S.A.; Gebremariam, A.D.; Azanaw, M.M.; Engidaw, M.T.; Kefale, B.; Abebe, B.; Dessalegn, T.; Tiruneh, M. The pooled estimate of the total fertility rate in sub-Saharan Africa using recent (2010–2018) Demographic and Health Survey data. Front. Public Health 2023, 10, 1053302. [Google Scholar] [CrossRef]
  62. Hu, Y.; Connor, D.S.; Stuhlmacher, M.; Peng, J.; Turner, B.L. More urbanization, more polarization: Evidence from two decades of urban expansion in China. npj Urban Sustain. 2024, 4, 33. [Google Scholar] [CrossRef]
  63. Liu, S.; Liao, Q.; Liang, Y.; Li, Z.; Huang, C. Spatio–temporal heterogeneity of urban expansion and population growth in China. Int. J. Environ. Res. Public Health 2021, 18, 13031. [Google Scholar] [CrossRef] [PubMed]
  64. OECD/SWAC. Africa’s Urbanisation Dynamics 2020: Africapolis, Mapping a New Urban Geography; West African Studies; OECD: Paris, France, 2020. [Google Scholar] [CrossRef]
  65. White, R.; Turpie, J.; Letley, G. Greening Africa’s Cities: Enhancing the Relationship Between Urbanization, Environmental Assets and Ecosystem Services. 2017. Available online: www.wearezephyr.com (accessed on 28 February 2024).
  66. Li, L.; Lu, D.; Kuang, W. Examining Urban Impervious Surface Distribution and Its Dynamic Change in Hangzhou Metropolis. Remote Sens. 2016, 8, 265. [Google Scholar] [CrossRef]
  67. McDonnell, M.J.; MacGregor-Fors, I. The ecological future of cities. Science 2016, 352, 936–938. [Google Scholar] [CrossRef]
  68. Zhang, W.; Randall, M.; Jensen, M.B.; Brandt, M.; Wang, Q.; Fensholt, R. Socio-economic and climatic changes lead to contrasting global urban vegetation trends. Glob. Environ. Change 2021, 71, 102385. [Google Scholar] [CrossRef]
  69. Jilius, C.T.; Modibo, T. How Forestry Contributes to the African Development Bank’s ‘High 5s’ Priorities for Africa: Challenges and Opportunities. Abidjan. 2018. Available online: https://www.researchgate.net/publication/324221800 (accessed on 28 February 2024).
  70. Huang, C.; Xu, N. Climatic factors dominate the spatial patterns of urban green space coverage in the contiguous United States. Int. J. Appl. Earth Obs. Geoinf. 2022, 107, 102691. [Google Scholar] [CrossRef]
  71. Yin, Z.; Kuang, W.; Bao, Y.; Dou, Y.; Chi, W.; Ochege, F.U.; Pan, T. Evaluating the dynamic changes of urban land and its fractional covers in Africa from 2000–2020 using time series of remotely sensed images on the big data platform. Remote Sens. 2021, 13, 4288. [Google Scholar] [CrossRef]
  72. Bille, R.A.; Jensen, K.E.; Buitenwerf, R. Global patterns in urban green space are strongly linked to human development and population density. Urban For. Urban Green. 2023, 86, 127980. [Google Scholar] [CrossRef]
  73. Feng, F.; Yang, X.; Jia, B.; Li, X.; Li, X.; Xu, C.; Wang, K. Variability of urban fractional vegetation cover and its driving factors in 328 cities in China. Sci. China Earth Sci. 2024, 67, 466–482. [Google Scholar] [CrossRef]
Figure 1. Spatial distribution of urban boundaries across Africa in 2020.
Sustainability 17 02880 g001
Figure 2. Urban area (km2) by countries in three different years.
Sustainability 17 02880 g002
Figure 3. Proportional distribution of UGSs and built-up areas both in the old and newly expanded areas.
Sustainability 17 02880 g003
Figure 4. Proportional (%) distribution of UGSs and ISs across the continent.
Sustainability 17 02880 g004
Figure 5. Fractional percentages of UGSs and ISs in each country in different years.
Sustainability 17 02880 g005
Table 1. Overall expanded urban areas and annual growth rates by region.
Region2000–20102010–2020
OEA (Km2)CAGR (%)OEA (Km2)CAGR (%)
North1474.91.49132.27.1
South1359.52.420,943.116.3
Middle64.60.31857.16.6
East255.71.77953.320.9
West2059.72.213,775.510.3
Table 2. Top 10 countries with the highest compound annual growth rates of urban areas in two different decades.
NoCountry2000–2010Country2010–2020
OEA (Km2)CAGR (%)OEA (Km2)CAGR (%)
1Burkina Faso161.37.52Malawi1232.132.34
2Namibia34.46.98Mauritius345.528.21
3Benin142.46.20South Sudan44.528.13
4Kenya98.35.47Mozambique273526.55
5Mali91.64.68Ethiopia1599.124.51
6Malawi24.83.81Tanzania3245.223.57
7Nigeria1014.13.72Swaziland249.423.34
8Lesotho23.33.51Somalia384.722.78
9Rwanda16.23.49Madagascar709.121.33
10Ghana5393.15Namibia345.219.46
Table 3. Correlation coefficients between urban growth, GDP, and population.
2000–20102010–2020
MeanSt. Dev.Rhop-ValueMeanSt. Dev.Rhop-Value
Urban Growth21.726.2--298.5325.6--
Population Growth61.938.40.1160.45478.250.90.3130.0388
GDP Growth223.4170.00.2420.11445.964.40.1650.283
Disclaimer/Publisher’s Note: The statements, opinions and data contained in all publications are solely those of the individual author(s) and contributor(s) and not of MDPI and/or the editor(s). MDPI and/or the editor(s) disclaim responsibility for any injury to people or property resulting from any ideas, methods, instructions or products referred to in the content.

