Article

Conversion Potential of Renewable Energy Surplus to Methane in China Based on Power Generation Forecasting

1
School of Management, Tianjin University of Technology, Tianjin 300384, China
2
Xinhua Electric Power Development Investment Co., Ltd., CNNC, Tianjin 300300, China
3
China Energy Engineering Group Tianjin Electric Power Design Institute Co., Ltd., Tianjin 300171, China
*
Author to whom correspondence should be addressed.
Sustainability 2025, 17(7), 2879; https://doi.org/10.3390/su17072879
Submission received: 20 January 2025 / Revised: 27 February 2025 / Accepted: 19 March 2025 / Published: 24 March 2025

Abstract

:
With the substantial increase in the penetration rate of renewable energy, the challenges related to renewable energy electricity generation remain partially unaddressed. Enhancing the conversion of electrical energy to methane offers a crucial opportunity. This study established a Bidirectional Long Short-Term Memory (Bi-LSTM) multi-factor prediction model, which effectively forecasts China’s renewable energy generation from 2023 to 2060. The model demonstrated a high level of accuracy, with a low mean absolute percentage error (MAPE) and a high coefficient of determination (R2 value close to 1). The prediction outcomes indicate a significant growth in China’s renewable energy power generation by the end of the forecast period. Three potential scenarios were formulated based on the anticipated proportion of renewable energy within the power generation system in the target year. By integrating future projections of China’s social electricity consumption, this study analyzed the surplus electricity generated by major renewable energy sources and evaluated the potential for methane conversion under different scenarios. Additionally, the amount of carbon dioxide absorbed during the methane conversion process in each scenario was calculated. The results revealed that wind power exhibits the highest potential for methane conversion among the renewable energy sources considered. In terms of carbon dioxide absorption, wind power also leads, demonstrating a substantial capacity to sequester carbon during the conversion process. These findings provide a basis for government departments to assess the contribution of renewable energy to Sustainable Development Goals. Furthermore, the production of methane from surplus electricity not only enables the interconnection between the power system and the fuel system but also serves as an effective energy buffer for the electrical grid, enhancing its stability and resilience.

1. Introduction

To meet its carbon reduction targets, China will need to add new solar and wind power infrastructure. Although energy storage matrices employing batteries offer the opportunity to store excess renewable energy, they do not meet all the future needs for increasing energy storage capacity. In order to fill the existing research gaps and further optimize the renewable energy storage mode, the conversion of generated electric energy to methane and hydrogen is a key technology of integrated energy systems that combines the conversion of renewable energy to natural gas, grid balancing, long-term storage, and decarbonization [1]. In addition, the reliance on fossil fuels for electricity production and energy consumption is the largest contributor to carbon dioxide emissions [2,3]. China is one of the world’s largest carbon dioxide emitters, accounting for approximately one-fifth of global emissions. The power supply sector in China is responsible for about half of the country’s total carbon dioxide emissions, primarily due to the operation of large coal-fired power plants [4]. In response to these challenges, China has developed carbon reduction policies aimed at promoting cleaner power generation by increasing the share of renewable energy in the power generation sector. The implementation of relevant policies has led to a significant rise in both the installed capacity and power generation from renewable energy in China [5]. As wind power, solar photovoltaic, and hydropower are the main sources of renewable energy power generation in China, the seasonality and variability of these energy sources create a mismatch between the peaks of renewable energy generation and the peak periods of electricity consumption. Consequently, the issue of power curtailment has become increasingly prominent. In 2018, China’s renewable energy abandoned power reached 102 billion KWH, surpassing the total power generation of the Three Gorges power station.
Power multiple transformation (Power-to-X: ammonia, methane, methanol) is an important technical means to achieve large-scale consumption of renewable energy at present. Although fuel cells can directly store electricity or convert surplus electricity into fuel gases, fuel cell technology is not yet at the level needed to store electricity at scale and balance energy systems. In addition, unlike battery storage, which often has limitations in terms of storage capacity and relatively high costs for large-scale long-term storage, methane conversion can effectively utilize surplus electricity to produce methane. Methane has a higher energy density than hydrogen in some cases, making it more convenient for long-distance transportation and storage. It can be easily integrated into existing natural gas infrastructure, reducing the need for extensive new infrastructure construction. Additionally, methane can be used directly as a fuel for heating, power generation, and in industrial processes, providing a more versatile end-use option compared to some other methods. In contrast, hydrogen production faces challenges like high energy consumption during production and difficulties in storage and distribution due to its low density and flammability. Thus, methane conversion offers a more practical and efficient solution in certain aspects for utilizing surplus electricity. In the Power-to-X process, the production of methanol and methane, coupled with carbon capture, advances carbon capture technologies, whereas ammonia production is not constrained by the carbon source. Weindler et al. [6] converted renewable electricity into thermal energy in the power range of 1000 W to 3000 W by using ohms heating technology from the food industry, which is used to provide heat and domestic hot water to single-family homes. Taheri et al. [7] used the surplus electricity generated by the biofuel-powered steam turbine for the cooling needs of the heat pump plant. Another study used a p-center model to conduct a building solar photovoltaic surplus electricity analysis combined with parking charging stations [8]. Such studies have considered the application of surplus electricity in real life, but the scale is limited to factories or specific mechanical facilities and cannot be widely used in the study of renewable energy electricity surplus nationwide. Converting surplus electricity into hydrocarbons, such as methane and methanol, not only offers great potential for energy storage but can also be used by other sectors, such as transportation, biochemistry, and heating, in the form of gas or liquid fuels [9].
The International Energy Agency has completed a study showing that Power-to-X is the best way to use the surplus power production of renewable energy fuel [10]. Although natural gas power plants currently serve as a means to connect intermittent renewable generation with consumer reliability needs, the conversion to methane or hydrogen may represent a significant advancement. Unlike natural gas, methane and hydrogen produced using renewable fuels are either net-zero or carbon-neutral [11,12]. The synthesis of these fuel gases relies entirely on hydrogen produced during the electrolysis of water. Although hydrogen is a kind of green energy which solves environmental problems, compared with other energy sources, the storage and transportation cost of hydrogen is very high at present, and the downstream application of hydrogen is not mature and extremely dependent on storage and transportation. As a renewable energy carrier, hydrogen penetrates into the electrical end and requires large-scale storage and transportation [13]. Until infrastructure such as an extensive pure hydrogen pipeline network and large-scale cheap hydrogen storage is perfected, the storage and transportation costs of hydrogen will be high, and these problems will lead to high user costs and suppress the demand for hydrogen, which will, in turn, inhibit the large-scale production of green hydrogen, resulting in the path of large-scale cost reduction. Bouallou et al. [14] proposed a new method for the seasonal storage of renewable energy based on the use of excess electricity generated from renewable energy to convert electrolyte steam and carbon dioxide into syngas via RSOC (reversible solid oxide cell) in SOEC (solid oxide electrolytic cell) mode at a high temperature (1073 K). The resulting syngas (H2 and CO) is fed into a methanation reactor, where it is converted to CH4. The gas is subsequently injected into a natural gas network. During periods of high consumption peaks, RSOC switches to SOFC (solid oxide fuel cell) mode, utilizing syngas as fuel [15]. Unlike hydrogen production technologies, methane storage and power conversion technologies currently offer the highest accessibility. Another advantage of converting surplus renewable electricity into methane storage is the higher energy density of methane. In addition to synthesizing gas into electricity in large power plants, methane synthesis can also be used for decentralized combined heat and power (CHP) systems or as a transportation fuel. According to research by Ancona et al. [16], the use of synthetic methane can simultaneously promote the energy storage of renewable electricity and the storage of carbon dioxide. In addition, the study of Rios et al. [17] concluded that the substitution of synthetic methane for fossil fuel-based natural gas has great potential to reduce net CO2 emissions over the whole life cycle, and that methane can be synthesized using a wide range of existing natural gas network supplies.
Methane potential future renewable energy surplus power system research relies on the accurate prediction of renewable energy power generation. Studies in this field encompass various time spans for electricity prediction, which can be categorized into long-term, short-term, and very short-term forecasts. Chang et al. [18] pointed out in their study of solar photovoltaic power generation that the long-term forecasts typically extend over 1 to 2 years, short-term forecasts cover 1 day to several weeks, and very short-term forecasts focus on energy output predictions for the next few minutes or hours. Different time horizon research perspectives provide different decisions regarding AIDS for the energy sector. Long-term prediction is conducive to the energy sector making strategic decisions on energy structure, while very short-term prediction focuses on the short-term output power prediction of specific renewable energy power stations or power plants, which provides help for the smooth operation of power stations [19].
When tackling energy prediction issues, the deep learning neural network demonstrates robust self-learning capabilities, high adaptability, and remarkable information processing prowess. When dealing with nonlinear time series problems, the deep learning neural network extracts data features through continuous nonlinear transformation, enabling accurate predictions of output variables. These advantages have led to the widespread application of deep neural network models in energy forecasting research [20]. The prediction of renewable energy power generation models generally falls under four categories: physical models, statistical models, machine learning, and the hybrid model [21]. The physical model is established based on the physical equations of the photovoltaic system. Depending on the quantity of indicators needed for prediction purposes, the forecasting model can be classified into a single-factor forecasting model or a multi-factor forecasting model, as documented in reference [22]. Machine learning has evolved with statistical models as its foundation. Owing to its remarkable adaptability in handling time series data, it has found extensive application across diverse engineering domains. For instance, it is commonly employed in predicting power generation levels or estimating energy consumption amounts. In machine model generation, some widely used model architectures include ANN (Artificial Neural Network), ELM (Extreme Learning Machine), and SVM (Support Vector Machine) [23]. The neural network model is a necessary method to predict renewable energy generation, either used as a mixed or a single model.
In the existing research on forecasting renewable energy generation, most studies consider the very short-term prediction of the power output of specific power plants, primarily utilizing meteorological data such as temperature, solar radiation, and humidity as key indicators. However, there is a scarcity of studies that address long-term predictions of overall renewable energy generation from the perspective of national economic development. Analyzing the transformation of energy within the national economy is crucial, as it enables relevant departments to make informed energy strategy decisions [24]. Energy demand has a significant impact on the forecast of renewable energy power generation. When energy demand rises, especially the demand for clean energy increases, the scale of renewable energy power generation will be expanded, and the predicted power generation will increase correspondingly; otherwise, it may decrease. In terms of technology cost, with the increase in investment in the research and development of renewable energy technology, cost reduction, such as the equipment cost and operation and maintenance cost of photovoltaic and wind power, will improve its market competitiveness, attract more investment, promote the growth of power generation, and then cause the predicted power generation to rise, while a high technical cost will limit its development and power generation growth. Policy changes are also crucial. Favorable policies, such as subsidies, tax incentives, and mandatory quotas, can incentivize the development and utilization of renewable energy and increase the projected power generation. If policy support weakens or policy uncertainty increases, the investment in and construction of renewable energy projects may slow down, affecting the power generation forecast. Therefore, energy demand, technology cost, and policy change jointly affect the forecast results of renewable energy generation through their different mechanisms. In the overall forecast research of China’s renewable energy, there are few studies on the future methane production of China’s overall renewable energy surplus electricity, and most of the literature focuses on the output power prediction of specific renewable energy power stations and the influence of weather factors on output fluctuations. Some scholars have also predicted the proportion of various renewable energy sources in 2050 [25], but generally speaking, there is a lack of comparative studies on the proportion of electricity generation and thermal power generation and insufficient studies on the rational use of surplus electricity to reduce carbon emissions. With the change in energy structure, renewable energy and traditional energy replacement phenomena exist, and with the improvement of the permeability of renewable energy, the problem of how to store surplus electricity will gradually be highlighted [26]. Based on the existing literature, this paper studies the change in renewable energy generation in China from 2023 to 2060 from the perspective of economy and energy. On the basis of predicting renewable energy generation, the proportion of each renewable energy in different scenarios and the surplus electricity generated by them are detailed. The potential of methane production from renewable energy in China in 2060 and the amount of carbon absorbed in the methane conversion process are calculated by using surplus electricity, which complements the shortcomings in the existing research.

2. Methodology and Data

2.1. Data and Assumptions

Seven indicators were selected from the level of national energy and economics [27], as is shown in Figure 1 below: renewable power generation, per capita GDP (Gross Domestic Product), electricity import, population, energy intensity, rate of urbanization, electricity consumption per capita, and industrial added value. China’s energy mix affects the amount of renewable energy it generates each year, with the national economy (GDP) serving as the primary driving force of the renewable energy power generation industry. Per capita GDP is a more accurate reflection of national economic development level than the total GDP to some extent. Electricity imports reflect the nation’s dependence and demand for electricity, which, in turn, promotes the development of national power to the demand of the electric power industry. As the urbanization process accounts for a significant portion of the national energy consumption, and the proportion of cities in GDP increases annually, the urbanization rate can reflect the energy intensity of a country. Industrial added value manifests in a highly industrialized society, where the industry demand for electricity includes renewable energy power generation [28]. Demographic scale exerts direct influence on market dynamics and consequently national economic growth. Electricity consumption per capita serves as an indirect indicator of national energy requirements during socioeconomic advancement. The energy intensity metric facilitates cross-regional comparisons of integrated energy efficiency, serving as a key performance indicator for energy-related economic productivity [29]. Primary datasets originate from the International Energy Agency (electricity metrics per capita, imported power volumes, and energy intensity ratios), supplemented by complementary statistics from China’s National Bureau of Statistics.

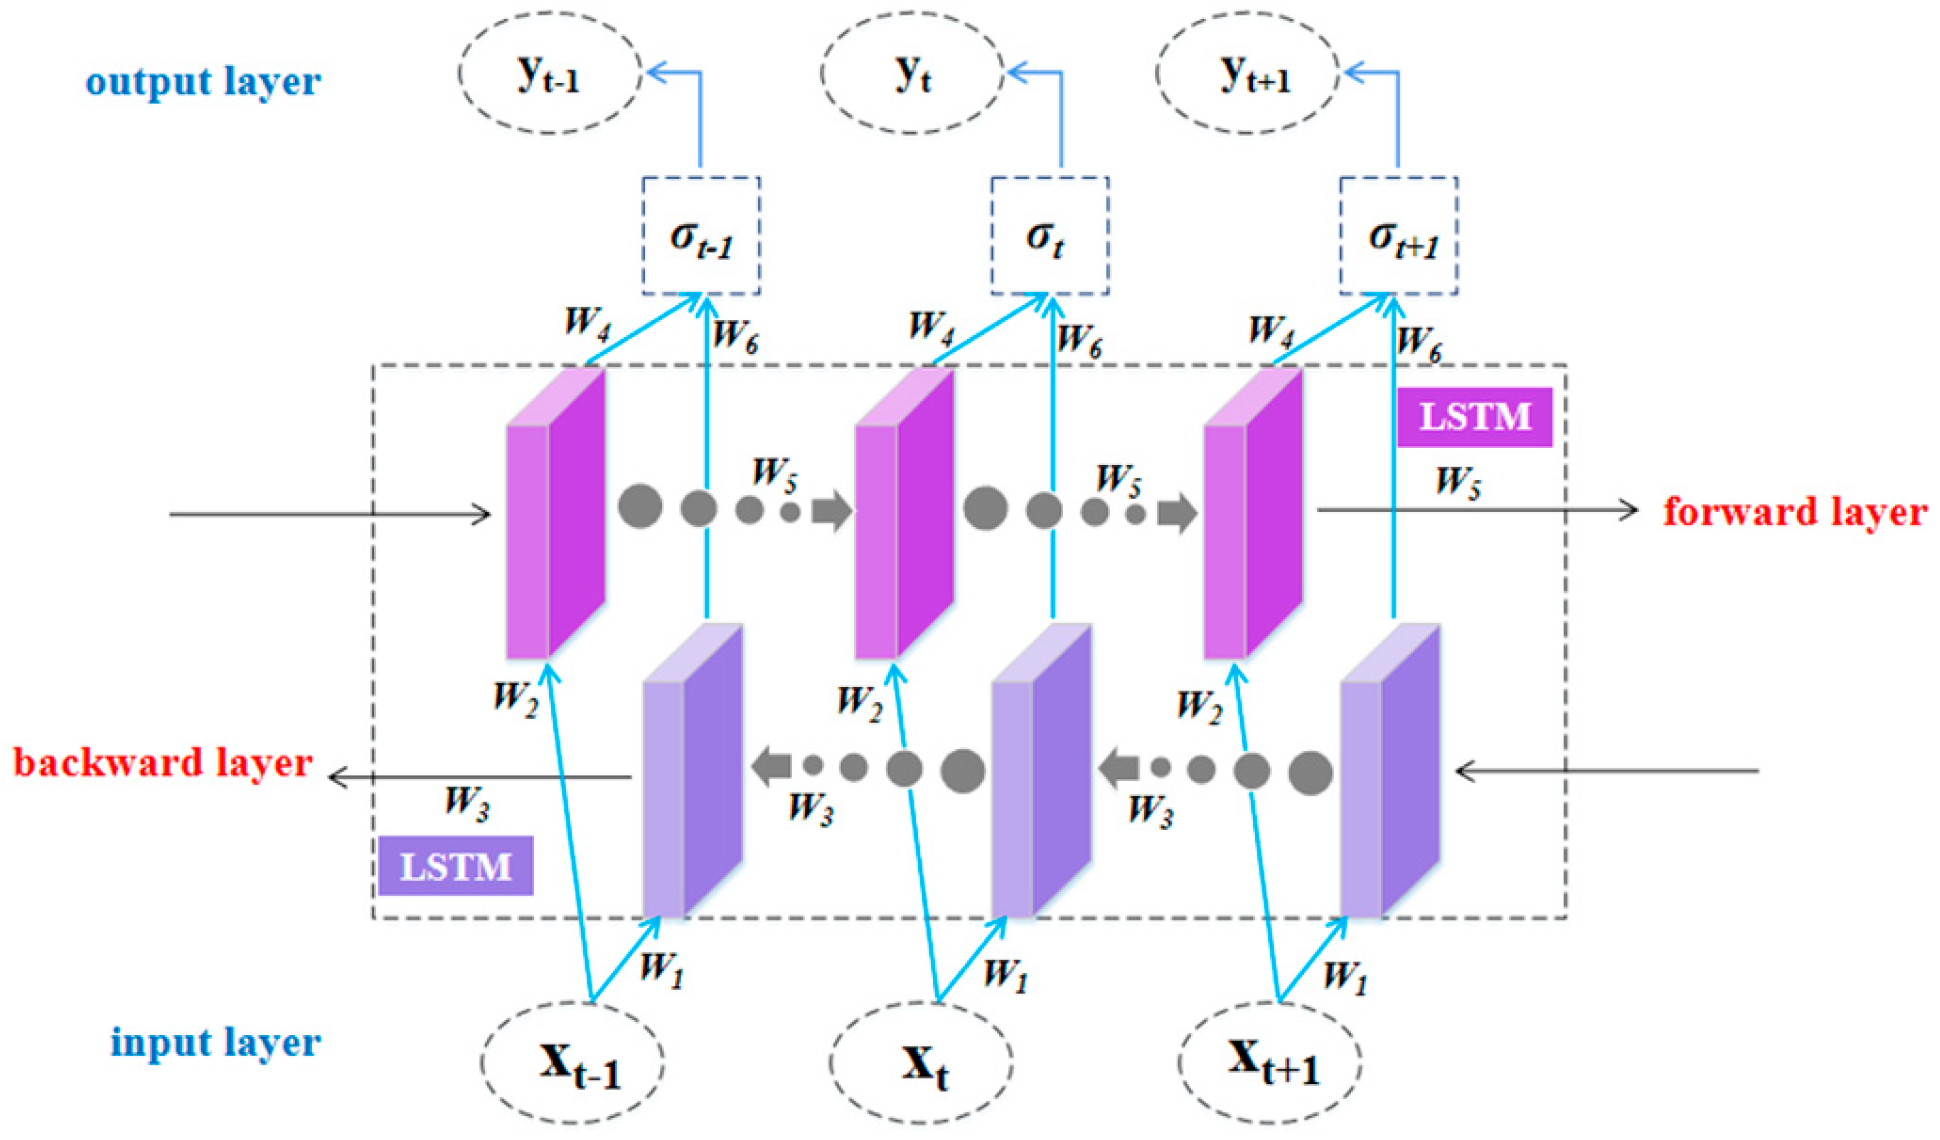
2.2. Model Implementation

The BiLSTM (Bidirectional Long Short-Term Memory) architecture extends the single-layer LSTM framework by incorporating two parallel LSTM layers with opposing directional processing, as illustrated in Figure 2. Unlike conventional unidirectional LSTM models that exclusively utilize historical input data for predictions, the BiLSTM’s dual structure enables the simultaneous analysis of both preceding and subsequent temporal information through its forward (ht) and backward (ht′) hidden states. This bidirectional capability enhances prediction accuracy by contextualizing target points within comprehensive temporal relationships, particularly when adjacent time steps significantly influence outcomes [30].
The model processes sequential data through dual encoding pathways: the forward layer sequentially computes outputs from time 1 to time t, while the reverse layer operates on the inverted input sequence. This parallel processing mechanism allows integrated feature extraction from both chronological and reversed data perspectives, effectively capturing bidirectional temporal dependencies. Each directional layer maintains independent memory cells and gating mechanisms, enabling the concurrent preservation of contextual information from past and future states relative to each timestep [31]. Finally, by combining the positive and negative output results, the final output of each moment can be obtained. The mathematical expression is shown in Equations (1)–(3):
h t = f ( w 1 x t + w 3 h t 1 )
h t = f ( w 2 x t + w 5 h t 1 )
σ t = g ( w 4 h t + w 6 h t )
w1w6 denote distinct weight matrices; xt and yt represent input and output vectors, respectively; ht (forward) and ht′ (backward) correspond to hidden state vectors from bidirectional propagation; σt denotes the activation output formed by aggregating forward and backward hidden states through summation.
The model parameters applied in this research are presented in Section 3. The hyperparameters of the model are ascertained through preliminary experimentation. The data utilized in this study consist of the eight indicators elaborated in Section 2.1. These data are partitioned into training and test datasets, with the division following a ratio of 80:20. In this study, the adjustment process of model parameters is to randomly initialize the weight matrix and the bias term, and select a suitable loss function to measure the difference between the predicted and the real value. With optimization algorithms such as stochastic gradient descent and its variants, the dataset is divided into a training set and a validation set. During the training, the data were input in batches, the loss and gradient are calculated to update the parameters, and the performance of the verification set is up to the standard after several rounds of training. At the same time, hyperparameters such as the number of neurons in the hidden layer and the learning rate are adjusted. After the training is completed, the test set is used to evaluate the model. If the performance is poor, the parameters and hyperparameters are fine-tuned or the model structure is improved, so as to improve the model’s performance and generalization ability. The model is implemented through python 3.9. For the study of the process of methane conversion, the carbon dioxide absorbed in the process of methane conversion is directly separated from the flue gas to reduce the carbon emissions in the process of industrial development.

2.3. Methane Production

The production of hydrocarbon fuels from surplus electric energy can be realized through several technical routes, but the technical routes of hydrogen production by the electrolysis of water and CO2 hydrogenation are the most economical and technically feasible at present. In this study, direct current was used to decompose water into hydrogen and oxygen, while the three primary electrolysis methods are alkaline electrolytic cell electrolysis, proton exchange membrane electrolysis, and high-temperature electrolysis [32]. In this paper, a proton exchange membrane electrolyzer was selected in the research process, because compared with other methods, the electricity generated by renewable energy is unstable, and the proton exchange membrane electrolyzer has higher efficiency and start-up time than other electrolytic methods when utilizing variable power supply, and requires higher flexibility when studying the whole country. In addition, the selective permeability of the proton exchange membrane allows the carrier H3O+ to pass through, ensuring electrical conductivity while avoiding oxygen penetration, thus obtaining higher-purity hydrogen. In addition to hydrogen, methane production necessitates the presence of carbon in the form of carbon monoxide or carbon dioxide. In this study, carbon was sourced as carbon dioxide from the flue gas of a combustion plant. There are several methods for separating carbon dioxide from flue gas, including absorption, adsorption, membrane separation, or other physical and biological techniques [33]. Monoethanolamine (MEA) is commercially available and used in carbon dioxide separation methods in methane production. In addition, the CO2 capture methods proposed by Fytianos et al. [34] and Abu-Zahra et al. [35] can be used in power plants. Therefore, this study selected this technology. MEA has a strong affinity for carbon dioxide, but the regeneration process requires high temperatures, so it needs to use heat energy [36]. As a result of MEA degradation, new MEA must constantly be added in the process of removing carbon dioxide. Fytianos and Zhou [37] further described MEA degradation and the associated challenges. After capture, the carbon dioxide is compressed and stored before being converted into hydrocarbons. The power consumption during CO2 compression was set to 0.61 MJ/kg CO2. This study chose a thermal chemical catalyst because it is regarded as the most promising method for methane production. The thermal catalytic methane carbon dioxide hydrogenation technology has fewer by-products, a high conversion rate, and a low-cost advantage, and has become the best choice at the present stage. The methanation process needs a quantity of heat, so, in addition to the main products, heat is also provided. The usual conversion rate for methanation is 95% [38]; therefore, small amounts of unconverted H2 and CO2 remain in the product gas and are not measured when considering the amount of converted methane.

2.4. Forecast Scenario Setting

2.4.1. Proportion of Major Renewable Energy Generation

When considering the conversion of methane from renewable energy generation in 2060, the proportions of various power generation energy sources must be considered due to their different development degrees and the rapid increase in renewable energy generation at the power generation end due to various policy targets for reducing carbon emissions in China. Therefore, this study made three assumptions on the proportion of renewable energy in power generation in China in 2060, namely, complete renewable energy generation, low-carbon power generation, and the partial replacement of fossil energy by renewable energy. In the scenario where the society uses only renewable energy in the future, wind, light, water, and nuclear energy attract much attention, because wind energy depends on atmospheric flow, while solar energy comes from solar radiation. Both resources are rich and widely distributed. At present, technology continues to progress, and costs continue to decrease. Water energy is based on the water cycle, the use of river drop, and other types of power generation, involving mature technology and a rich experience. In nuclear energy, nuclear fusion raw materials (such as deuterium) have huge reserves in sea water, and thorium and other potential resources of nuclear fission are also rich. Nuclear fusion is almost pollution-free. Although nuclear fission has waste problems, its treatment technology is developing, and nuclear energy can provide stable basic electricity. It is important to note that renewable energy power generation, which includes biomass, will still produce some carbon emissions. Low carbon power is contained in the biomass. In their study on China’s greenhouse gas control, Liu et al. [39] predict the proportion of four renewable energy sources in China in 2050. Hydropower development at the present stage, due to its relatively sufficient way of generation, will account for 31.4–49.4% in 2050. Although the generation technology of biomass power is mature, the cost of power generation is high, accounting for 4.9–7.7% in 2050. The share of these two renewable energy sources is likely to decline further after 2050 due to the continued maturity and rapid development of wind and photovoltaic technologies. Compared with photovoltaic power generation, wind power generation technology is more mature, accounting for 21.3–36% in 2050. Photovoltaic power generation is expected to account for more than 20% [40]. Both are likely to increase substantially after 2050. According to the China Nuclear Energy Association, China’s nuclear power is expected to account for about 18% in 2060 [41]. Policies often set macro and clear goals, such as promoting sustainable energy development, achieving carbon emission reduction commitments, and ensuring national energy security. The achievement of these goals is closely linked to the optimization and adjustment of energy structure. Taking carbon emission reduction targets as an example, in order to effectively reduce carbon emissions, it is necessary to gradually increase the proportion of clean energy (such as solar energy, wind energy, hydro energy, nuclear energy) in the energy system, while reducing the proportion of traditional fossil energy. Through quantitative analysis of the policy target, combined with the carbon emission intensity of different energy sources and other data, we can establish a mathematical model between the target and the energy proportion, so as to calculate the proportion range that each energy source should achieve in the future to achieve the target. Based on the above research estimates of renewable energy generation, combined with the current development level of renewable energy in China and the maturity level of related technologies, this study sets the scenario for the proportion of power generation from several major renewable energy sources in China in 2060, as shown in Table 1 below. In scenario 3, since renewable energy fails to completely replace fossil fuel power generation in China’s power generation energy system, China does not fully realize the clean power generation end, so the energy types are not subdivided when estimating the proportion of power generation. The proportion of renewable energy and thermal power generation is determined according to China’s 14th Renewable Energy Development Plan.

2.4.2. Electricity Consumption Analysis

In the previous subsection regarding renewable energy scenarios, the surplus power is influenced by changes in social power consumption. For China’s social electricity consumption in 2023–2060, based on historical data, this paper puts forward three scenarios (S(a), S(m), and S(i)) to ensure that the growth of electricity consumption is more consistent with reality. The three scenarios represent the change rate of future social electricity consumption under the average growth rate, the minimum growth rate, and the initial growth rate, respectively. According to the average and minimum growth rate of China’s social electricity consumption historical data and the growth rate in 2023 as the initial growth rate, the changes in China’s social electricity consumption under varying degrees of development in the future are illustrated in Figure 3 below. Since the growth rate of electricity consumption fluctuates greatly in the process of economic development, the electricity consumption value from 2023 to 2060 obtained by using the average growth rate is larger. The historical data on social electricity consumption are sourced from the International Energy Agency. Under the three scenarios, China’s electricity consumption in 2060 is 389,003.17, 114,711.12, and 19,400,807 billion KWH, respectively.

3. Results and Discussion

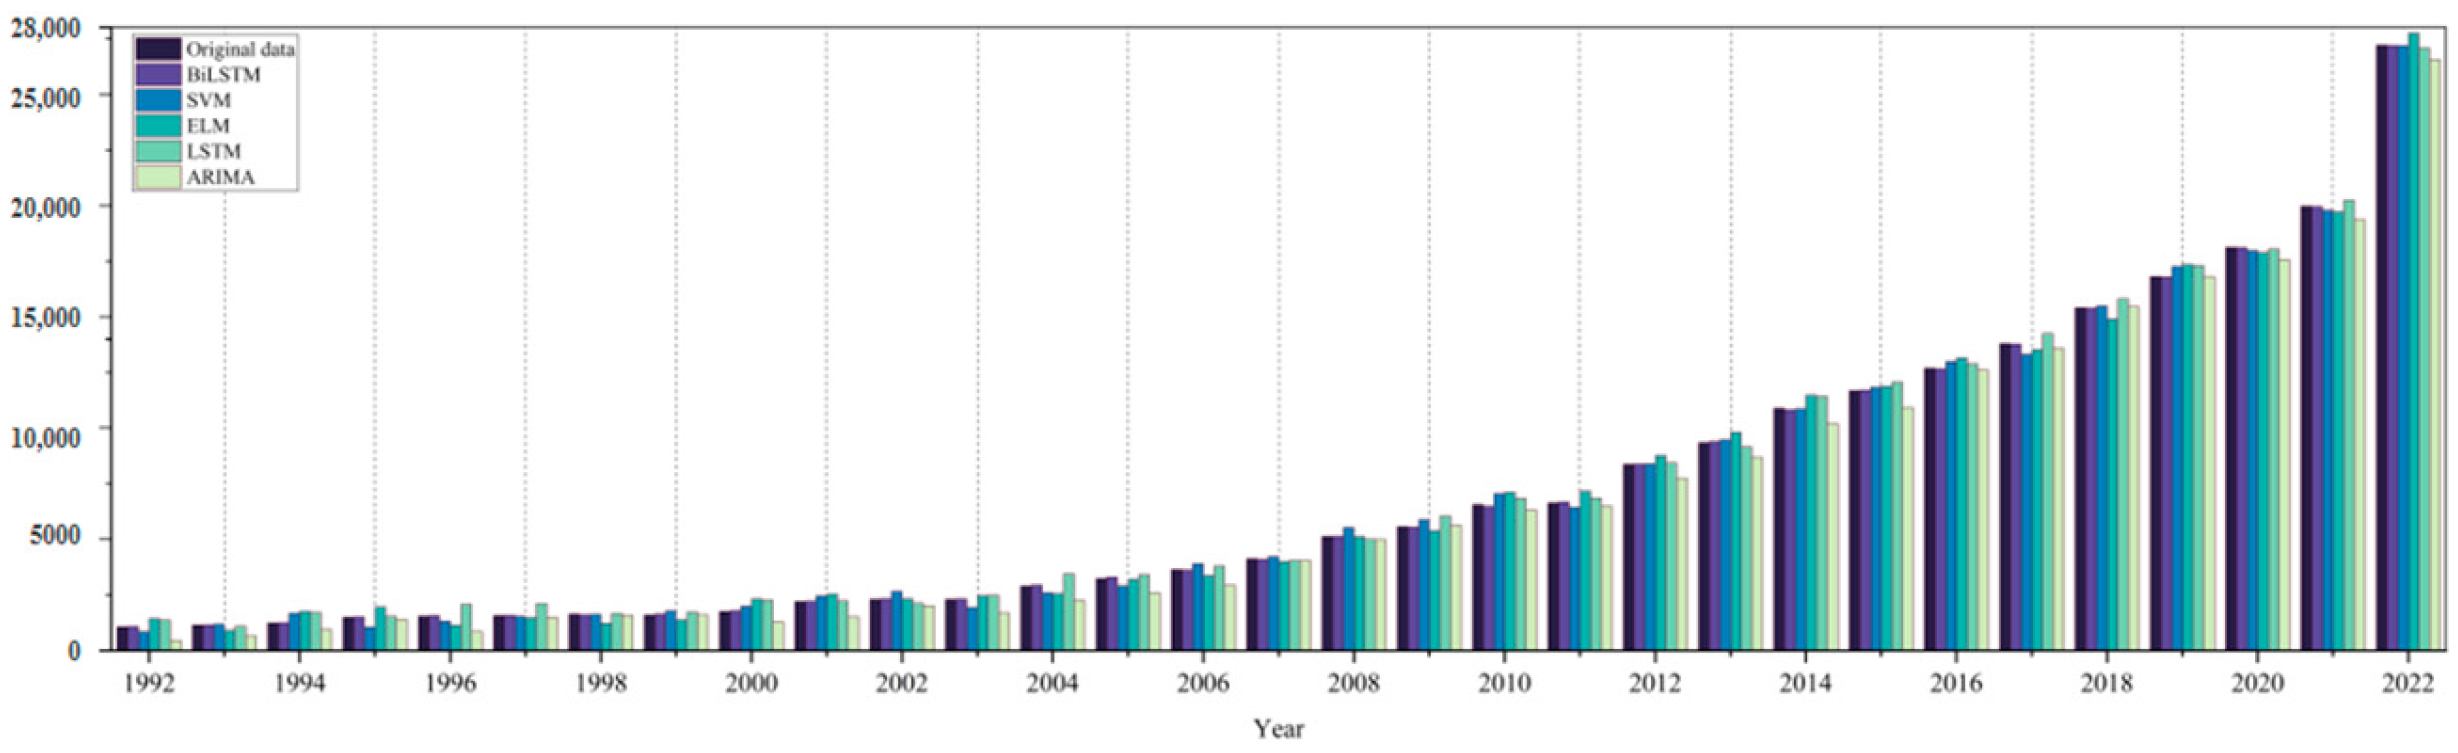
3.1. Model Evaluation

To assess the BiLSTM model’s performance in renewable energy generation forecasting, this study employs four metrics—mean absolute error (MAE), coefficient of determination (R2), mean absolute percentage error (MAPE), and root mean square error (RMSE)—for error evaluation. These metrics are calculated using Formulas (4)–(7):
M A E = i = 1 n y i y ^ i n
M A P E = 100 % i = 1 n y i y ^ i y i n
R M S E = i = 1 n ( y i y ^ i ) 2 n
R 2 = 1 i = 1 n ( y i y i ^ ) 2 i = 1 n ( y i y i ̅ ) 2
where y i = y 1 , y 2 , , y n is the true value, y ^ i = y ^ 1 , y ^ 2 , , y ^ n is the predicted value, and n is the number of y i .
As the data come from multiple data sources, there may be inconsistencies in data format, unit, coding, etc. Therefore, it is necessary to unify the format and unit of data, such as converting different units of length data into a single unit. For the case of inconsistent encoding, the corresponding transformation and mapping are performed. In the process of data collection, in order to avoid the statistical difference in information, data outliers have to be removed. When the BiLSTM model is used to forecast China’s renewable energy generation capacity (KWH) in 2023–2060, the data ratio is 7:3 in the model training process, and the search for the optimal parameters is realized through an Internet search. In this research, a BiLSTM neural network model is employed, which consists of four parameters. Modifying these parameters enables the adjustment of the model’s precision. The parameters of the model encompass the learning rate for each layer, the time step, the dimension of the hidden layer (denoted as Hidden_layer), the quantity of input data (Batch size), and the number of training epochs. Through the successive training of the model, the one with the greatest accuracy was identified. The evaluation metrics and model parameters of this particular model are presented in Table 2 below.
To evaluate the comparative performance of the BiLSTM framework, four conventional models (SVM [42], ELM [43], ARIMA [44], and LSTM), listed in Table 3, were employed for temporal prediction tasks under identical temporal datasets and equivalent data segmentation ratios. Four standard metrics—R2, MAE, MAPE, and RMSE—were computed across all architectures, with comparative results systematically presented in Table 3.
Based on the experimental outcomes of the five models, it is evident that the prediction errors of each model vary to different extents. Among them, the time series processed by the BiLSTM model exhibits the highest level of prediction accuracy. Figure 4 provides a more intuitive comparison of prediction results from each model and the original data, and the BiLSTM model is closest to the changing trend of historical data. Therefore, this study selected the BiLSTM model for prediction. The prediction results of the BiLSTM model are illustrated in Figure 5.
It is important to note that the BiLSTM model has some shortcomings and a high level of complexity. Its disadvantages include its large consumption of computing resources, high hardware requirements, and a time-consuming training process due to the need to process forward and reverse information at the same time. The structure of the model is relatively complex, the parameters are numerous, and it is difficult to adjust the parameters. The improper selection of hyperparameters can easily lead to overfitting or underfitting problems. Its complexity is reflected in the strong dependence on data, high requirements for data preprocessing, and the fine processing of data features for different tasks. At the same time, the model is poor in interpretation, and it is difficult to intuitively understand its decision-making process and the importance of features.
However, these shortcomings and complexities do not have a material impact on the forecast of renewable energy generation, the object of this study. On the one hand, sufficient and reasonable preprocessing of the data is carried out, so that they can meet the model input requirements and the impact of data complexity can be reduced. On the other hand, through proper hyperparameter adjustment and model training strategy, overfitting and underfitting problems are effectively avoided, and the predictive performance of the model is ensured. Moreover, the emphasis of this paper is to achieve accurate prediction based on the BiLSTM model, and the explanatory requirements of the model are relatively low. Therefore, these deficiencies of the BiLSTM model itself do not hinder the achievement of the research objectives of this paper.

3.2. Main Renewable Energy Surplus Electricity Potential Analysis

Based on China’s total renewable energy power generation in 2060 predicted by the BiLSTM model, along with the social electricity consumption in China from 2023 to 2060 obtained in the previous section, the potential surplus electricity generated by renewable energy under different scenarios in 2060 is obtained. The first two scenarios involve several main types of renewable energy electricity production that can meet social power consumption in 2060, considering three different changes in electricity demand. Each type of renewable energy contributes to the surplus electricity produced. In scenario 1, fossil fuels are completely replaced by renewable energy, and electricity consumption is completely provided by renewable energy. Table 4 shows the power generation and surplus generated by the four renewable energy sources. Wind power generates 77,971,589 million KWH, photovoltaic 4,198,702 million KWH, hydropower 4,398,973 million KWH, and nuclear 35,986,887 million KWH. When the social electricity consumption increases rapidly according to the historical average growth rate, the electricity generated by wind power, photovoltaic power, hydropower, and nuclear power alone cannot meet the social electricity demand. Therefore, the surplus electricity in this scenario is provided by renewable energy power generation as a whole, and the surplus electricity is 5526.243 KWH, as shown in the bar chart on the far right of Table 4. When the growth rate of social electricity consumption slows down, according to the lowest growth rate, the surplus electricity generated by wind power, photovoltaic power, hydropower, and nuclear power is, respectively, 66,504.77, 305,135.90, 325,128.61, and 24,515.775 billion KWH. When the growth rate of social electricity consumption is similar to that of recent years, and in line with the growth trend in 2023, no surplus electricity will be generated because nuclear power generation is not enough to offset social electricity consumption. The surplus electricity generated by wind power, photovoltaic power, and hydropower is 390,712.72, 3843.85, and 5,083,656 billion KWH, respectively. Renewable energy completely replaces coal-fired power, and to implement clean power, three kinds of social electricity consumption changes with the four major renewable energy sources in the lowest power consumption growth produce surplus capacity. Wind, photovoltaic, and hydropower will all have electricity surplus when the growth trend of electricity consumption is similar to that in 2023.
In scenario 2, despite failing to achieve full clean power generation, biomass low-carbon generation is still retained, but power consumption is entirely supplied by renewable energy sources. The power generation of five major renewable energy sources under this scenario is as follows: wind power generates 63,966,688 million KWH; photovoltaic power generation produces 43,983,973 billion KWH; hydropower contributes 41,584.848 billion KWH; nuclear power generation accounts for 34,187,543 billion KWH; and biomass power generation is 16,194,099 billion KWH, as shown in Table 4. Similarly to the first scenario, when the social electricity consumption rises according to the historical average trend, the electricity generated by wind, photovoltaic, hydropower, nuclear, and biomass alone will not be enough to offset the social electricity demand. The total social surplus electricity is obtained according to the total renewable energy generation, and the surplus electricity is the same as in scenario 1, which is shown by the rightmost bar in Table 4. However, according to the 2023 growth rate changes, due to nuclear energy and biomass producing much less power than the social demand, this situation does not produce surplus electricity. The wind power, solar, and hydropower generation of surplus electricity is 250,763.71, 50,836.56, and 2.68453 trillion KWH. When the social electricity consumption changes slowly and at the lowest growth rate in history, the surplus electricity generated by wind power, photovoltaic, hydropower, nuclear energy, and biomass energy is 5255.5576, 325,128.61, 301,137.35, 227,164.31, and 4722.987 billion KWH. In the scenario where the social demand for electricity is provided by renewable energy and some low-carbon energy remains, five major renewable energy sources are used in both social power consumption growth rate change under the lowest surplus capacity, and surplus capacity only. Since the proportion of nuclear energy and biomass energy is relatively low compared with the other three energy sources, no surplus electricity will be generated in the social electricity consumption under the other two growth rates.
In scenario 3, renewable energy fails to completely replace fossil fuels, and thermal power generation has a large share in the total generating capacity of society; therefore, the refinement of renewable energy is no longer considered. Renewable energy generates 19,992,715 trillion KWH of electricity, and thermal power generates 16,357,759 trillion KWH. Under the scenario that the electricity consumption is the historical average growth rate, the surplus electricity generated by renewable energy is 5526.343 billion KWH, as shown in Table 4. Under the scenario of the lowest growth rate in power consumption, renewable energy will produce 188.456038 trillion KWH surplus electricity. If electricity consumption grows at the same rate as in 2023, renewable energy will generate a surplus of 161,026.833 billion KWH of electricity.

3.3. Methane Conversion Quantity Analysis

The methane conversion process relies on the electrolytic water process, with the conversion method and procedure detailed in Section 2.3. Since the research scope of this paper is the whole country, the adoption of an electrolyzer requires a high degree of universality, so the methane conversion efficiency is set at 95%. In their study on the methane conversion process of renewable energy, Uusitalo et al. [38] concluded that, according to the 95% conversion rate of methane, producing 1 kg of methane requires 1.19 MJ of electric energy and 2.89 kg of carbon dioxide, along with approximately 0.041 kg of oxygen and 0.005–0.0061 kg of hydrogen. According to the previous section, surplus electricity under different scenarios can be obtained, and the amount of methane produced by renewable energy under different scenarios can be calculated, as shown in Figure 6 below. Under the average growth rate of electricity consumption in society, the renewable energy in the three scenarios cannot be subdivided, the total surplus electricity of renewable energy is fixed at 5526.343 billion KWH, and the electricity generated is 198.95 × 10¹¹ MJ, so it is not shown in the figure. Under the average growth rate, the total amount of methane produced by renewable energy is 167.18 × 10¹¹ kg. Under the lowest growth rate, in scenario 1, hydropower, nuclear power, photovoltaic energy, and energy produced through methane conversion are 2011.78, 923.1, 983.58, and 741.65 (1 × 10¹¹ kg). The initial growth figures for wind, solar, and hydropower transformation were 1181.99, 93.31, and 153.8 (1 × 10¹¹ kg). Because nuclear power does not produce surplus electricity in this scenario, methane cannot be converted. Similarly to scenario 1, the total amount of methane produced by renewable energy under the average growth rate in scenario 2 is 167.18 × 10¹¹ kg. In the lowest growth scenario for wind power, the methane conversion significantly exceeds that of scenario 2, reaching 441.22 × 10¹¹ kg. Photovoltaic power generation under the initial growth, with the transformation of low-carbon generation situations to a fully renewable energy generation situation, reaches 153.8 × 10¹¹ kg. In the low-carbon generation scenario, with the power consumption based on the lowest growth rate, the amount of energy that water can convert is far lower than in the renewable energy power generation scenario, reaching 253.06 × 10¹¹ kg.

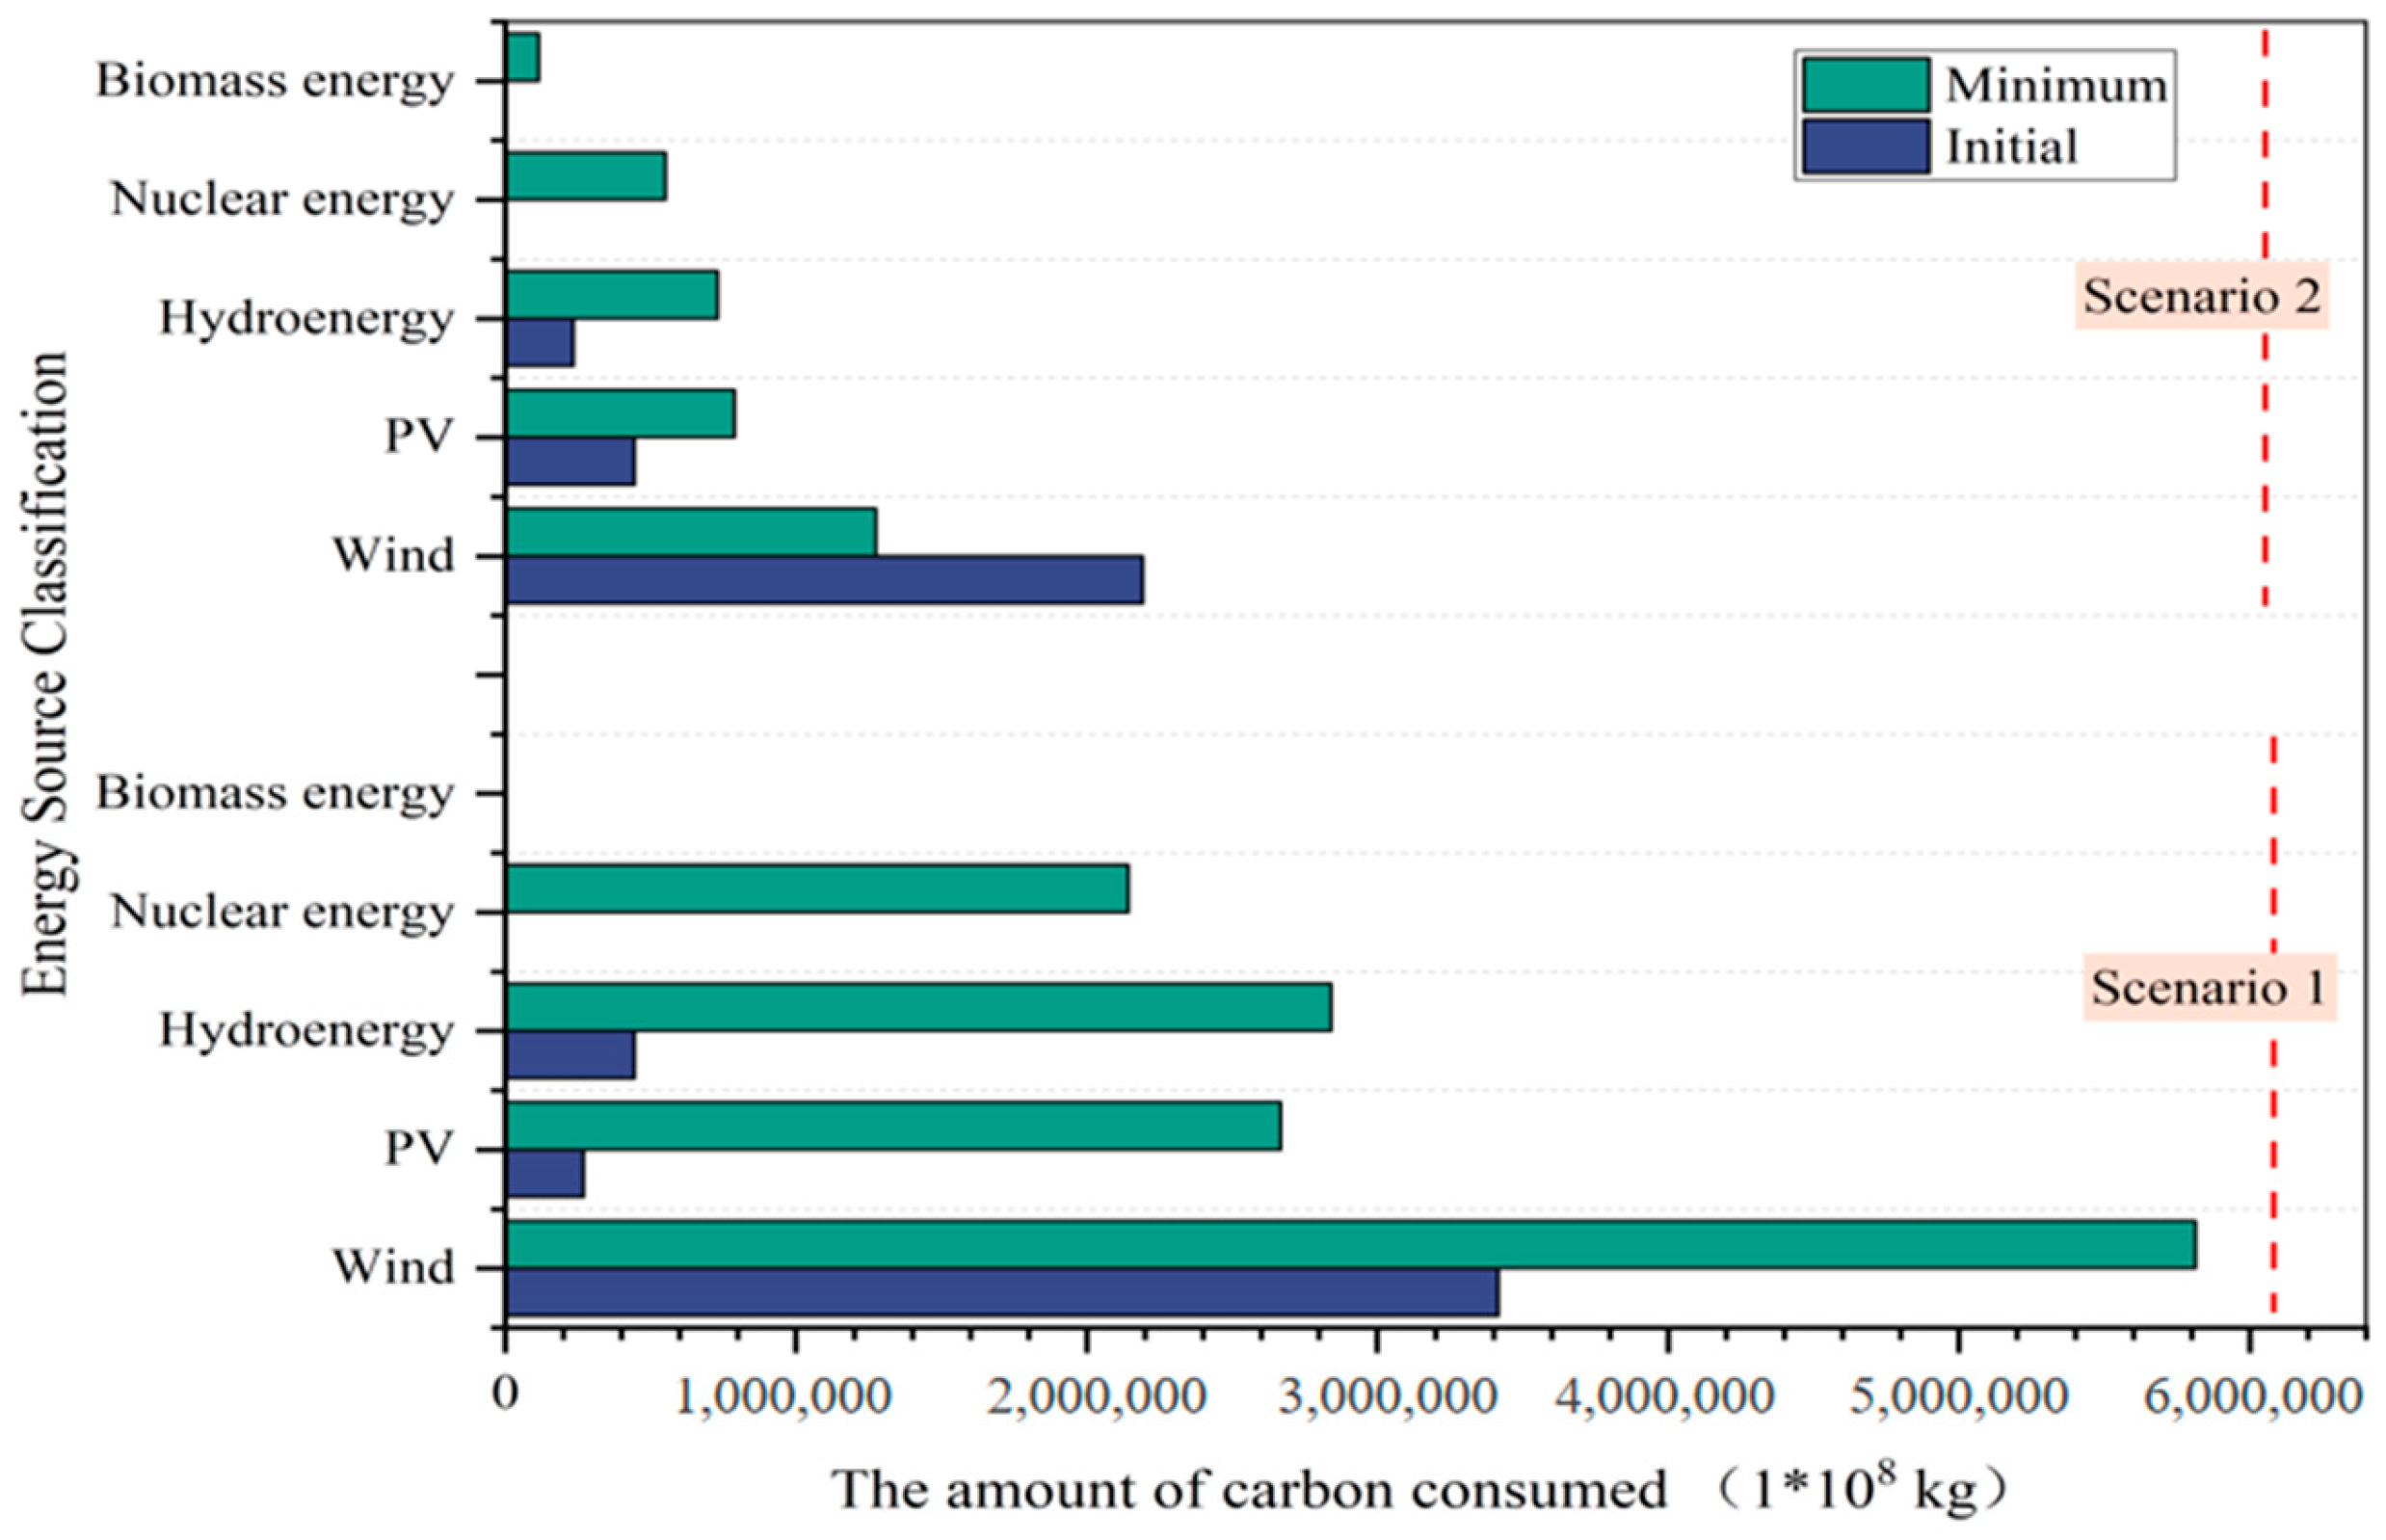
3.4. Carbon Dioxide Consumption

A significant amount of carbon dioxide is required for the process of converting surplus electricity from renewable energy sources to gas. Therefore, this conversion is an effective method for reducing carbon dioxide emissions by using surplus electricity. Through the methanation process, carbon is absorbed during the conversion of surplus electricity to methane under different scenarios, which is shown in Figure 7 below. In either case, surplus electricity-methanation can absorb large amounts of carbon dioxide. In scenario 1, the maximum carbon dioxide absorption is 5814.04 × 1011 kg by the conversion of surplus electricity from wind power to methane under the minimum growth rate of social electricity consumption. Under initial growth conditions, the conversion of wind electricity to methane results in a carbon absorption of 3415.95 × 1011 kg. Compared with scenario 1, when the national renewable energy generation is fixed in 2060, low-carbon power generation reduces the proportion of the original four major clean energy generation sources, resulting in the loss of clean electricity for methane conversion. In scenario 1, with the lowest electricity consumption and initial growth rate, the carbon absorption from PV is measured at 2667.76 and 2696.63 × 1011 kg, respectively. Hydropower contributes 2842.55 and 444.46 × 10¹¹ kg, while nuclear energy achieves a carbon absorption of 2143.38 × 1011 kg at the lowest growth rate. Due to carbon-containing power generation, in scenario 2, which also employs the lowest power consumption and initial growth rate, the carbon absorption of photovoltaic is 789.60 and 444.46 × 10¹¹ kg, respectively. The carbon absorption of hydropower is 731.33 and 234.7 × 10¹¹ kg. At the lowest growth rate, the carbon absorption of nuclear energy and biomass energy is 551.69 and 114.7 × 10¹¹ kg, respectively. When renewable energy does not completely replace thermal power, its carbon uptake is 483.16 × 10¹¹ kg.
From the perspective of the result of the methane conversion process and carbon dioxide adsorption, the efficiency of Chinese society changes significantly in the conversion of methane and carbon dioxide. The increase in social electricity consumption indicates better economic growth, reflecting the effectiveness of China’s supply-side reform. Based on this, when China achieves its carbon target for 2060, due to wind power and solar photovoltaic battery technology being relatively mature at the present stage, wind power and photovoltaic scale will grow rapidly. The primary measures to reduce carbon emissions will stem from these two types of renewable energy, with a particular focus on wind power. In addition, energy storage technology represented by methane conversion can address the intermittency and volatility of renewable energy. Methane conversion has a large capacity and long operational cycles, enabling significant time scale energy buffering for the grid. This serves to stabilize power fluctuations and support demand response for electricity. Surplus power methane production can realize the interconnection of the power system and fuel system, and in the process of methane conversion, CO2 can be separated from the flue gas, which can promote the recycling of CO2 in the atmosphere and contribute to efforts to mitigate climate change.

4. Conclusions

The research results of this paper show that the surplus electricity of renewable energy in China has great potential to convert methane in the future. Combining the surplus electricity generated by several major renewable energy with the electrolytic water process and replacing the traditional fossil production process, the largest absorption of carbon dioxide is achieved with wind power, and the amount of carbon dioxide can be reduced by up to 5,814,041.68 × 108 kg through PtG. Other findings are as follows:
(1)
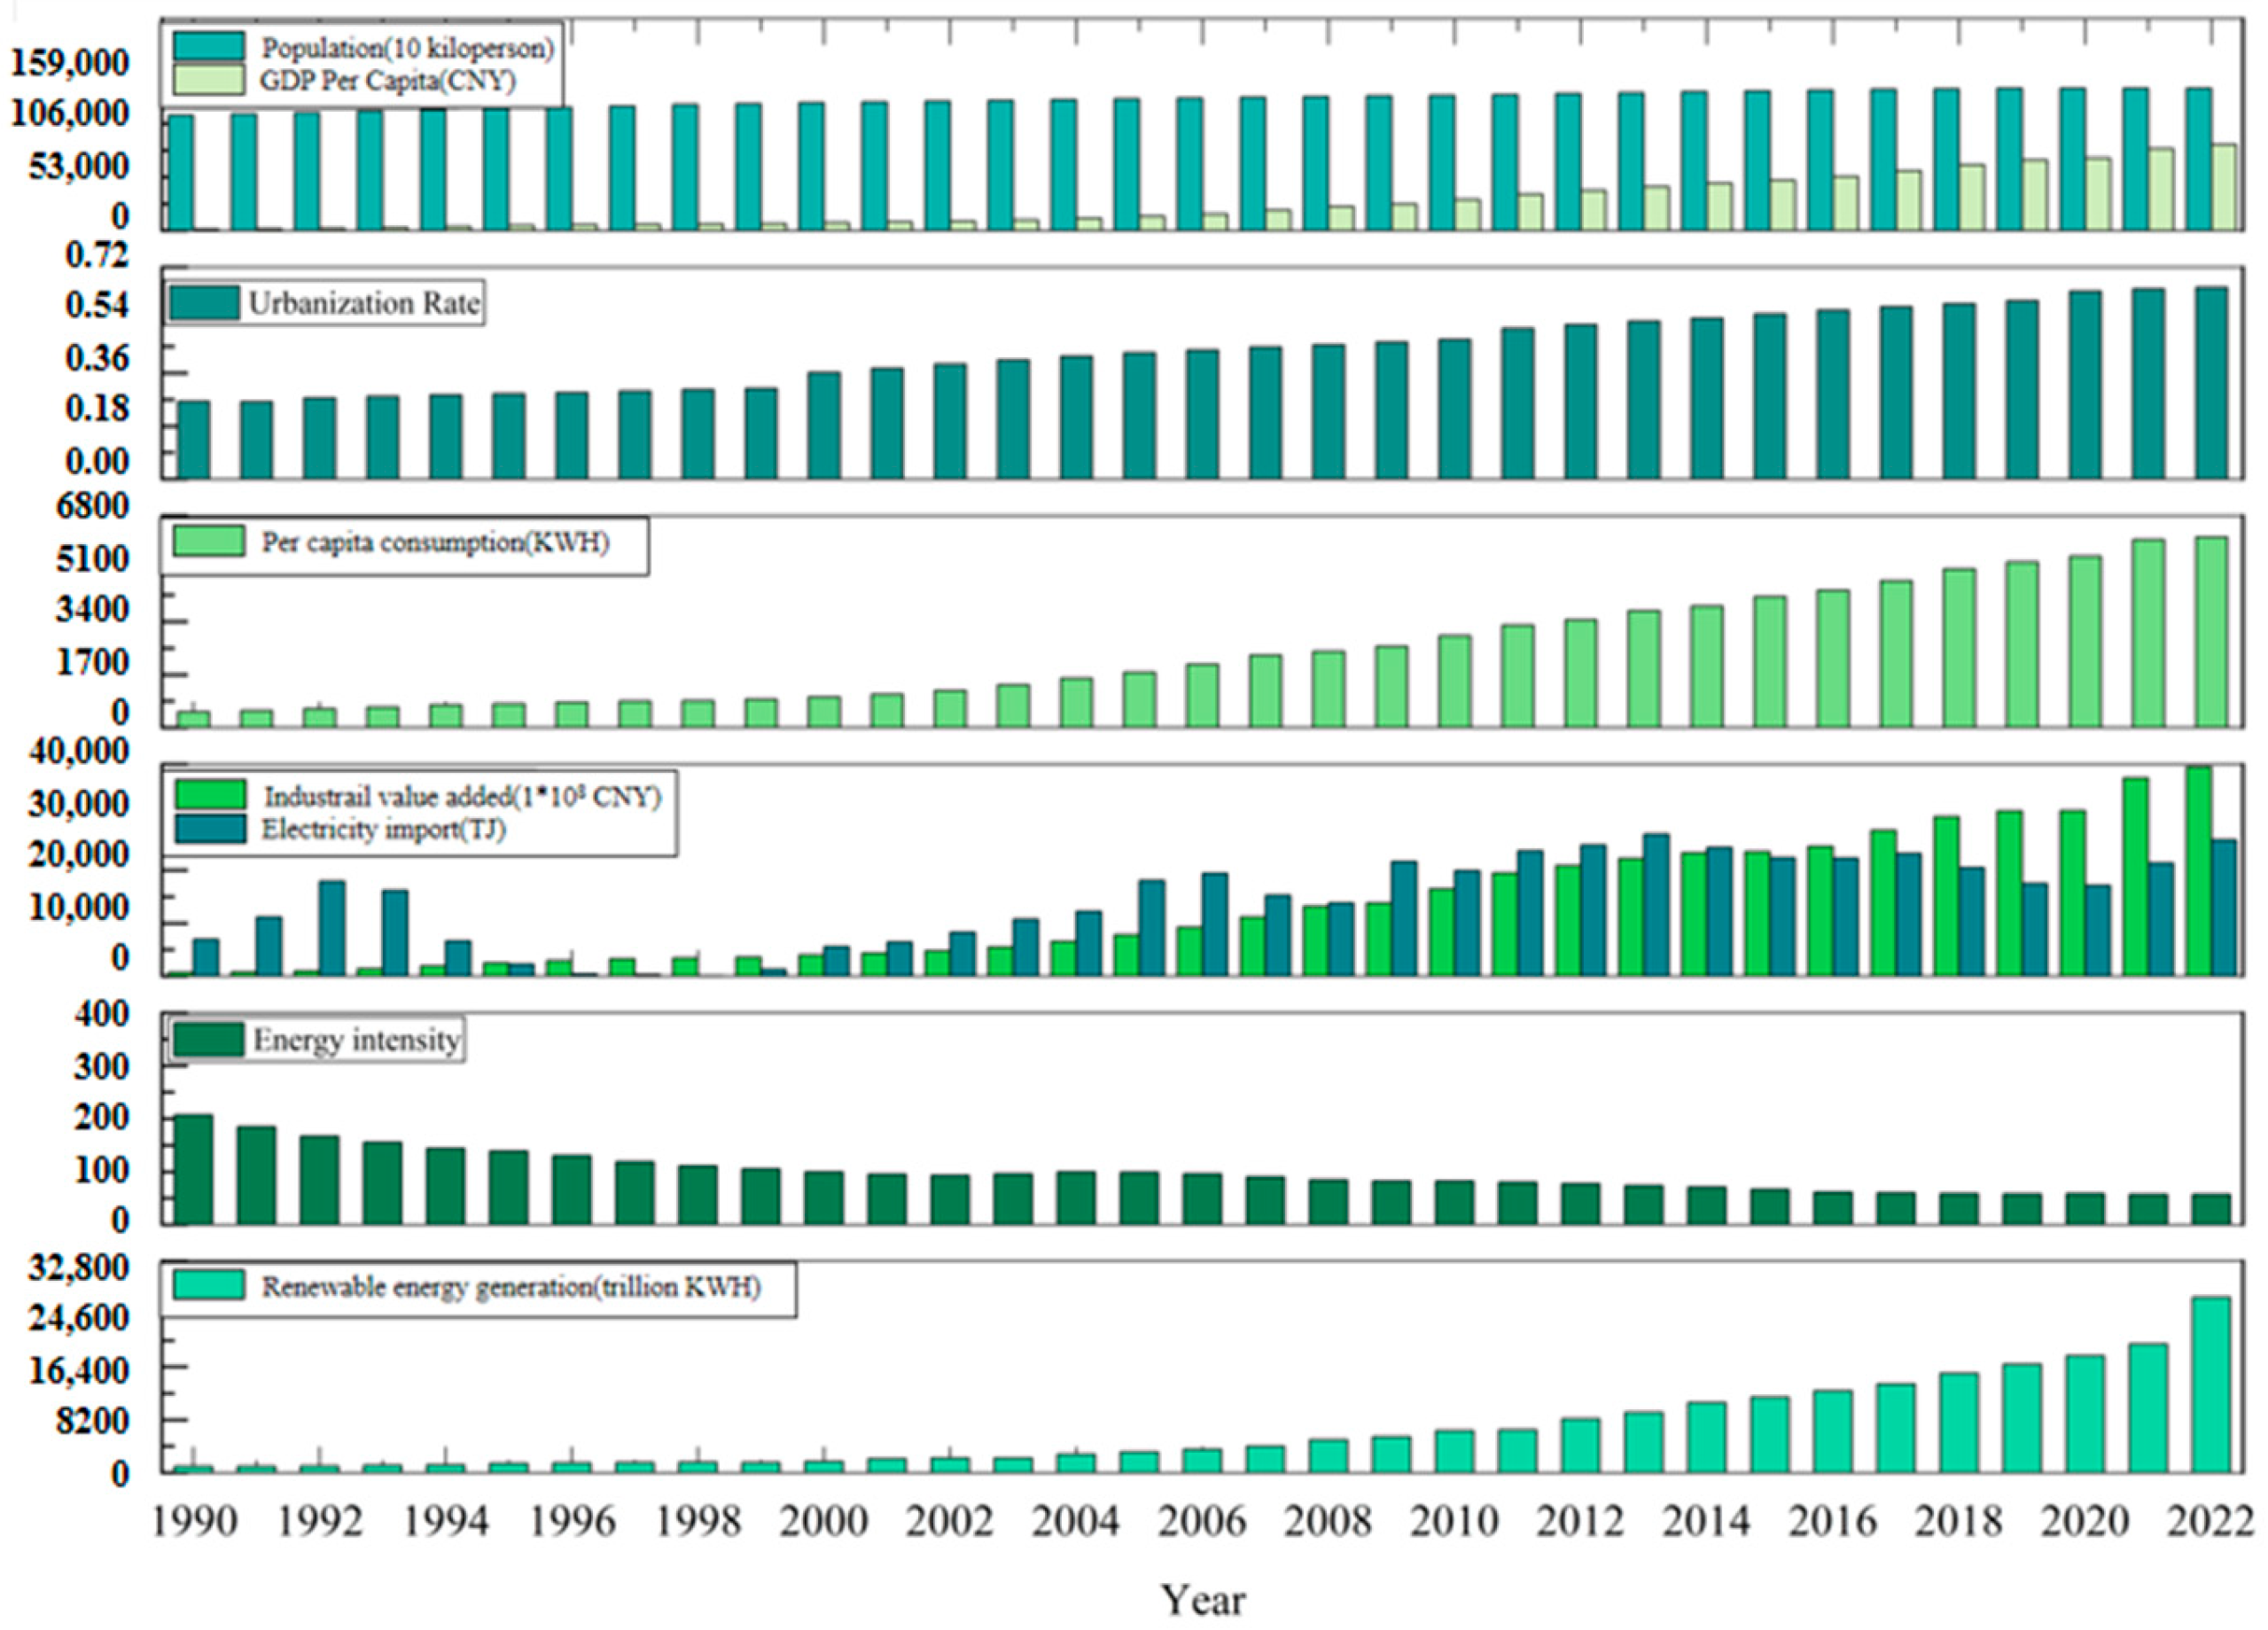
The MAPE value of the model established in this study reached 2.46%, with high precision. This study, combined with the national economy and energy development process selection of seven input indicators in the prediction of renewable energy power generation, has high applicability and provides a reference for future research.
(2)
For the power generation side of renewable energy development in China in 2060, according to the historical trend of economic growth and as a reference for the government department of energy for China’s future economic conditions, the main proportions of different types of renewable energy in the power generation energy system are determined. China’s 2060 carbon neutrality pathway presents two energy transition scenarios: either a full displacement of traditional energy by renewables or a partial retention of low-carbon power generation. Under full decarbonization, four renewable energy categories would be systematically deployed. The low-carbon generation framework comprises five principal renewable sources. This study establishes a 55% renewable adoption rate as a contingency parameter, applicable when actual renewable development underperforms the national policy baseline of 60% capacity threshold. The surplus electricity depends on the social electricity consumption. Based on historical trends, three possible scenarios for future social electricity consumption in China are identified. Finally, in different energy proportion scenarios, the specific proportions of each renewable energy source under different social demands for electricity and the generated surplus electricity are obtained.
(3)
Through scenario setting, the changes in renewable energy surplus electricity and social electricity consumption under different future development scenarios are obtained. In scenarios 1 and 2, social electricity consumption at the historical average growth rate does not generate surplus electricity to convert methane. So when the social power consumption growth does not rise, renewable energy surplus electricity will be limited by electricity demand, and these are negatively correlated. In addition, when the growth rate of social electricity consumption is the lowest, the maximum amount of methane that can be converted is achieved when renewable energy completely replaces traditional energy, that is, when the power generation end is completely clean. In the low-carbon scenario, there is still a great deal of surplus electricity that can be used to convert methane.
In the prediction of the overall development level of China’s renewable energy power generation, the influence of national economic conditions and energy policies is more significant than that of local meteorological factors. The predictive indicators used in this study are fairly representative in measuring the future economic and energy development of the country. The decarbonization of China’s power sector is a key link to achieving carbon neutrality. Therefore, the long-term prediction of the future of renewable energy generation can provide an effective reference for government departments to formulate reasonable carbon reduction policies.
This paper has potential limitations in delineating the future of renewable energy and methane production processes. The prediction results of the model are based on the overall data of the country, and regional factors and the distribution of various renewable energy sources may have a certain impact on the prediction results. (1) The methane conversion process was not discussed in detail in this study. (2) The geographical environment and climate conditions are quite different between the south and the north and between the east and the west of China. The scales of wind power generation, photovoltaic power generation, hydropower power generation, and nuclear power generation are quite different. The economic development and energy system reform process are different among provinces. (3) From the perspective of national overall renewable energy development in the future, the progress of renewable energy across different regions is not identical, making it difficult to refine a geographic future development trend of several kinds of main renewable energy scales. In research on future renewable energy power generation and how it affects the carbon and energy structure, there is a need to consider the country from the perspective of the overall development trend of power generation, in order to determine whether China can meet its future goals for carbon emission reduction, so the prediction research does not take into account the above factors. However, in future research on differences in the development of terrestrial renewable energy, the above limitations can be considered in the data analysis to draw more refined conclusions. In addition, the focus of this study was to accurately predict renewable energy generation and estimate the amount of methane that can be converted. The detailed process and key technical factors of methane conversion were not accurately calculated, and the methane conversion rate and the ratio of various substances may be slightly different under different catalyst and temperature conditions. A follow-up study can make a detailed classification of the technical parameters of methane conversion, in order to explore the process of surplus power conversion to methane under different conditions.
Based on the shortcomings of the above research, future studies can be conducted in the following directions. (1) An in-depth exploration of the methane conversion process should be carried out. It is not only necessary to accurately determine the methane conversion rate under different catalysts, temperatures, pressures, and other conditions, but also to clarify the optimal ratio relationship of various substances, while studying the life and activity attenuation characteristics of the catalyst, so as to achieve accurate control of the methane production process. (2) In the construction and application of the model for forecasting, regional factors should be comprehensively and carefully incorporated, and differences in geographical environments, climate conditions, economic development levels, energy system reform processes, policy orientation, and other aspects in different regions of China (such as the north and south, east and west) should be quantitatively analyzed. According to the resource endowment of each region, the local renewable energy development trend prediction model should be established, covering wind, photovoltaic, hydroelectric, nuclear, and other types of power generation to improve the accuracy of prediction. (3) Regional perspectives should be integrated with national macro perspectives when analyzing the impact of renewable energy generation on carbon emissions and energy structure. (4) In addition to geographical, climate and economic factors, the influence mechanism of policies and regulations, technological innovation, market demand, social acceptance, and other factors on the development of renewable energy should be systematically investigated and a comprehensive analysis framework that includes multiple factors should be constructed.

Author Contributions

Conceptualization, B.L.; Methodology, B.L. and Y.Z.; Software, Y.Z.; Formal analysis, T.Y.; Investigation, X.Z. and T.Y.; Data curation, X.Z.; Writing—original draft, X.Z.; Visualization, X.Z.; Supervision, B.L.; Project administration, B.L. and Y.Z. All authors have read and agreed to the published version of the manuscript.

Funding

This research received no external funding.

Institutional Review Board Statement

This study did not require ethical approval as it utilized publicly available meteorological and energy grid data for predictive modeling. No human or animal subjects were involved.

Informed Consent Statement

Not applicable. This study utilized publicly available statistical data (sources cited in the manuscript), which do not involve human participants or sensitive/identifiable information.

Data Availability Statement

The original contributions presented in this study are included in the article. Further inquiries can be directed to the corresponding author.

Conflicts of Interest

Author Yasen Zhou was employed by the company Xinhua Electric Power Development Investment Co., Ltd. Tiezhu Yuan was employed by the company China Energy Engineering Group Tianjin Electric Power Design Institute Co., Ltd. The remaining authors declare that the research was conducted in the absence of any commercial or financial relationships that could be construed as a potential conflict of interest.

References

  1. Yilmaz, H.Ü.; Kimbrough, S.O.; van Dinther, C.; Keles, D. Power-to-gas: Decarbonization of the European electricity system with synthetic methane. Appl. Energy 2022, 323, 119538. [Google Scholar] [CrossRef]
  2. Qiu, R.; Zhang, H.; Wang, G.; Liang, Y.; Yan, J. Green hydrogen-based energy storage service via power-to-gas technologies integrated with multi-energy microgrid. Appl. Energy 2023, 350, 121716. [Google Scholar] [CrossRef]
  3. Lanni, D.; Minutillo, M.; Cigolotti, V.; Perna, A. Biomethane production through the power to gas concept: A strategy for increasing the renewable sources exploitation and promoting the green energy transition. Energy Convers. Manag. 2023, 293, 117538. [Google Scholar] [CrossRef]
  4. Liu, H.; Han, P. Renewable energy development and carbon emissions: The role of electricity exchange. J. Clean. Prod. 2024, 439, 140807. [Google Scholar] [CrossRef]
  5. Wang, C.; Wang, H.; Ji, X.; Xu, H.; Yang, C.; Meng, X. Hybrid energy storage capacity configuration strategy for virtual power plants based on variable-ratio natural gas-hydrogen blending. Int. J. Hydrogen Energy 2024, 58, 433–445. [Google Scholar] [CrossRef]
  6. Weindler, J.; Dawoud, B. Experimental investigation of a small-scale continuous flow ohmic heating reactor for a highly effective conversion of renewable electricity surpluses into heat. Appl. Therm. Eng. 2024, 242, 122401. [Google Scholar] [CrossRef]
  7. Taheri, B.; Jabari, F.; Foroud, A.A. A green cogeneration microgrid composed of water-source heat pumps, a gravity energy storage, and a bio-fueled gas turbine: Design and techno-economic optimization. Sustain. Cities Soc. 2023, 95, 104594. [Google Scholar] [CrossRef]
  8. Bailera, M.; Peña, B.; Lisbona, P.; Romeo, L.M. Decision-making methodology for managing photovoltaic surplus electricity through Power to Gas: Combined heat and power in urban buildings. Appl. Energy 2018, 228, 1032–1045. [Google Scholar] [CrossRef]
  9. Marzi, E.; Morini, M.; Saletti, C.; Vouros, S.; Zaccaria, V.; Kyprianidis, K.; Gambarotta, A. Power-to-Gas for energy system flexibility under uncertainty in demand, production and price. Energy 2023, 284, 129212. [Google Scholar] [CrossRef]
  10. Pintér, G. The development of global power-to-methane potentials between 2000 and 2020: A comparative overview of international projects. Appl. Energy 2024, 353, 122094. [Google Scholar] [CrossRef]
  11. Carrera, E.; Azzaro-Pantel, C. Bi-objective optimal design of Hydrogen and Methane Supply Chains based on Power-to-Gas systems. Chem. Eng. Sci. 2021, 246, 116861. [Google Scholar]
  12. Ikäheimo, J.; Weiss, R.; Kiviluoma, J.; Pursiheimo, E.; Lindroos, T.J. Impact of power-to-gas on the cost and design of the future low-carbon urban energy system. Appl. Energy 2022, 305, 117713. [Google Scholar]
  13. Pastore, L.M.; Basso, G.L.; Quarta, M.N.; de Santoli, L. Power-to-gas as an option for improving energy self-consumption in renewable energy communities. Int. J. Hydrogen Energy 2022, 47, 29604–29621. [Google Scholar]
  14. Er-rbib, H.; Bouallou, C. Modeling and simulation of CO methanation process for renewable electricity storage. Energy 2014, 75, 81–88. [Google Scholar]
  15. Ren, J.; Lou, H.; Xu, N.; Zeng, F.; Pei, G.; Wang, Z. Methanation of CO/CO2 for power to methane process: Fundamentals, status, and perspectives. J. Energy Chem. 2023, 80, 182–206. [Google Scholar]
  16. Ancona, M.A.; Bianchi, M.; Branchini, L.; Catena, F.; De Pascale, A.; Melino, F.; Peretto, A. Numerical prediction of off-design performance for a Power-to-Gas system coupled with renewables. Energy Convers. Manag. 2020, 210, 112702. [Google Scholar]
  17. Ríos, C.; Molina, P.; de León, C.M.; Brey, J.J. Simulation of the optimal plant size to produce renewable hydrogen based on the available electricity. Int. J. Hydrogen Energy 2024, 52, 1325–1337. [Google Scholar] [CrossRef]
  18. Chang, R.; Bai, L.; Hsu, C.-H. Solar power generation prediction based on deep Learning. Sustain. Energy Technol. Assess. 2021, 47, 101354. [Google Scholar]
  19. Geng, D.; Wang, B.; Gao, Q. A hybrid photovoltaic/wind power prediction model based on Time2Vec, WDCNN and BiLSTM. Energy Convers. Manag. 2023, 291, 117342. [Google Scholar]
  20. Agga, A.; Abbou, A.; Labbadi, M.; El Houm, Y.; Ali, I.H.O. CNN-LSTM: An efficient hybrid deep learning architecture for predicting short-term photovoltaic power production. Electr. Power Syst. Res. 2022, 208, 107908. [Google Scholar] [CrossRef]
  21. Agga, A.; Abbou, A.; Labbadi, M.; El Houm, Y. Short-term self consumption PV plant power production forecasts based on hybrid CNN-LSTM, ConvLSTM models. Renew. Energy 2021, 177, 101–112. [Google Scholar] [CrossRef]
  22. Wang, J.; Zhou, Y.; Li, Z. Hour-ahead photovoltaic generation forecasting method based on machine learning and multi objective optimization algorithm. Appl. Energy 2022, 312, 118725. [Google Scholar]
  23. Etxegarai, G.; López, A.; Aginako, N.; Rodríguez, F. An analysis of different deep learning neural networks for intra-hour solar irradiation forecasting to compute solar photovoltaic generators’ energy production. Energy Sustain. Dev. 2022, 68, 1–17. [Google Scholar]
  24. Kermani, A.A.; Houshfar, E. Design and energy, exergy, and exergoeconomic analyses of a novel biomass-based green hydrogen and power generation system integrated with carbon capture and power-to-gas. Int. J. Hydrogen Energy 2024, 52, 177–189. [Google Scholar]
  25. Li, P.; Sun, W.; Zhang, Z.; He, Y.; Wang, Y. Forecast of renewable energy penetration potential in the goal of carbon peaking and carbon neutrality in China. Sustain. Prod. Consum. 2022, 34, 541–551. [Google Scholar]
  26. Xia, L.; Ren, Y.; Wang, Y. Forecasting clean energy power generation in China based on a novel fractional discrete grey model with a dynamic time-delay function. J. Clean. Prod. 2023, 416, 137830. [Google Scholar]
  27. Liu, B.; Huo, X. Prediction of Photovoltaic power generation and analyzing of carbon emission reduction capacity in China. Renew. Energy 2024, 222, 119967. [Google Scholar]
  28. Wang, Q. Effective policies for renewable energy—The example of China’s wind power—Lessons for China’s photovoltaic power. Renew. Sustain. Energy Rev. 2010, 14, 702–712. [Google Scholar]
  29. Cameron, L.; van der Zwaan, B. Employment factors for wind and solar energy technologies: A literature review. Renew. Sustain. Energy Rev. 2015, 45, 160–172. [Google Scholar]
  30. Shi, H.; Wei, A.; Xu, X.; Zhu, Y.; Hu, H.; Tang, S. A CNN-LSTM based deep learning model with high accuracy and robustness for carbon price forecasting: A case of Shenzhen’s carbon market in China. J. Environ. Manag. 2024, 352, 120131. [Google Scholar] [CrossRef]
  31. Wang, Q.; Suo, R.; Han, Q. A study on natural gas consumption forecasting in China using the LMDI-PSO-LSTM model: Factor decomposition and scenario analysis. Energy 2024, 292, 130435. [Google Scholar]
  32. Shehzad, M.F.; Ishaq, H.; Crawford, C. Offshore wind energy prospects for power-to-direct air capture and power-to-gas. Int. J. Hydrogen Energy 2023, 48, 39216–39224. [Google Scholar] [CrossRef]
  33. Choe, C.; Kim, H.; Lim, H. Feasibility study of power-to-gas as simultaneous renewable energy storage and CO2 utilization: Direction toward economic viability of synthetic methane production. Sustain. Energy Technol. Assess. 2023, 57, 103261. [Google Scholar]
  34. Fytianos, G.; Vevelstad, S.J.; Knuutila, H.K. Degradation and corrosion inhibitors for MEA-based CO2 capture plants. Int. J. Greenh. Gas Control 2016, 50, 240–247. [Google Scholar]
  35. Quang, D.V.; Milani, D.; Abu Zahra, M. A review of potential routes to zero and negative emission technologies via the integration of renewable energies with CO2 capture processes. Int. J. Greenh. Gas Control 2023, 124, 103862. [Google Scholar]
  36. Huo, L.; Wang, Z.; Reda, S.A.; Tashkandi, M.A.; Moria, H.; Nag, K.; Mouldi, A.; Loukil, H.; Lee, V.F.; Fang, H. Power generation enhancement and CO2 emission reduction of a biomass powered gas turbine via hydrogen injection and wind energy incorporation. Process Saf. Environ. Prot. 2024, 185, 105–115. [Google Scholar]
  37. Liu, S.; Lin, Z.; Jiang, Y.; Zhang, T.; Yang, L.; Tan, W.; Lu, F. Modelling and discussion on emission reduction transformation path of China’s electric power industry under “double carbon” goal. Heliyon 2022, 8, e10497. [Google Scholar]
  38. Uusitalo, V.; Väisänen, S.; Inkeri, E.; Soukka, R. Potential for greenhouse gas emission reductions using surplus electricity in hydrogen, methane and methanol production via electrolysis. Energy Convers. Manag. 2017, 134, 125–134. [Google Scholar]
  39. Liu, T.; Xu, G.; Cai, P.; Tian, L.; Huang, Q. Development forecast of renewable energy power generation in China and its influence on the GHG control strategy of the country. Renew. Energy 2011, 36, 1284–1292. [Google Scholar]
  40. Gao, J.; Meng, Q.; Liu, J.; Wang, Z. Thermoelectric optimization of integrated energy system considering wind-photovoltaic uncertainty, two-stage power-to-gas and ladder-type carbon trading. Renew. Energy 2024, 221, 119806. [Google Scholar]
  41. Yu, S.; Yarlagadda, B.; Siegel, J.E.; Zhou, S.; Kim, S. The role of nuclear in China’s energy future: Insights from integrated assessment. Energy Policy 2020, 139, 111344. [Google Scholar]
  42. Lai, Z.; Liang, G.; Zhou, J.; Kong, H.; Lu, Y. A Joint Learning Framework for Optimal Feature Extraction and Multi-class SVM. Inf. Sci. 2024, 671, 120656. [Google Scholar]
  43. Hu, Y.; Wang, X.; Liu, Y.; Ding, W.; Knoll, A. PI-ELM: Reinforcement learning-based adaptable policy improvement for dynamical system. Inf. Sci. 2023, 650, 119700. [Google Scholar]
  44. Guerra, R.R.; Vizziello, A.; Savazzi, P.; Goldoni, E.; Gamba, P. Forecasting LoRaWAN RSSI using weather parameters: A comparative study of ARIMA, artificial intelligence and hybrid approaches. Comput. Netw. 2024, 243, 110258. [Google Scholar]
Figure 1. Historical data from 1990 to 2022.
Sustainability 17 02879 g001
Figure 2. The framework of the BiLSTM model.
Sustainability 17 02879 g002
Figure 3. Electricity consumption under different scenarios.
Sustainability 17 02879 g003
Figure 4. Comparison of model accuracy.
Sustainability 17 02879 g004
Figure 5. Comparison of model prediction results with original data and forecast trends for 2023–2060.
Sustainability 17 02879 g005
Figure 6. Methane conversion under different scenarios.
Sustainability 17 02879 g006
Figure 7. The amount of carbon consumed under different scenarios.
Sustainability 17 02879 g007
Table 1. Proportion of each power generation energy in different scenarios.
ScenariosWindPVHydro EnergyNuclear EnergyBiomass Energy
Scenario 1:
Fully renewable energy
39%21%22%18%-
Scenario 2:
Low-carbon power generation
32%22%20.8%17.1%8.1%
Scenario 3:
Incomplete substitution
Renewable energy: 55%
Thermal power: 45%
Table 2. BiLSTM model values for accuracy evaluation.
AlgorithmsEpochLrTime StepHidden_LayerBatch Size
BiLSTM-120000.012163
BiLSTM-285000.00011205
Accuracy evaluationMAEMAPE (%)RMSER2
8.712.46%8.210.994
Table 3. Comparison of model accuracy.
AlgorithmsR2MAERMSEMAPE (%)
SVM0.98424.4466.118.12
ELM0.99338.2277.8512.45
LSTM0.98854.11104.5312.82
ARIMA0.98333.4573.86.11
BiLSTM0.9948.718.212.46
Table 4. Surplus electricity in 2060 under different scenarios.
ScenariosEnergyPower Generation (KWH)Surplus Electricity (KWH)
S(a)S(m)S(i)
Scenario 1Wind779,715.89-665,004.77390,712.72
PV419,847.02-305,135.9030,843.85
Hydropower439,839.73-325,128.6150,836.56
Nuclear power359,868.87-245,157.75-
Scenario 2Wind639,766.88-525,055.76250,763.71
PV439,839.73-325,128.6150,836.56
Hydropower415,848.47-301,137.3526,845.30
Nuclear power341,875.43-227,164.31-
Biomass power161,940.99-472,29.87-
Scenario 3Renewable energy1,999,271.5055,263.431,884,560.381,610,268.33
Thermal power1,635,767.59198,948.36--
Disclaimer/Publisher’s Note: The statements, opinions and data contained in all publications are solely those of the individual author(s) and contributor(s) and not of MDPI and/or the editor(s). MDPI and/or the editor(s) disclaim responsibility for any injury to people or property resulting from any ideas, methods, instructions or products referred to in the content.

