Article

Technological Innovation in Promoting the Sustainable Development of Tourist Factories: Factors Influencing Tourists’ Perceived Value and Loyalty in Immersive VR Experiences

1
Faculty of Innovation and Design, City University of Macau, Macau 999078
2
School of Digital Media & Communication, Dongguan Polytechnic, Dongguan 523808, China
*
Author to whom correspondence should be addressed.
Sustainability 2025, 17(7), 2871; https://doi.org/10.3390/su17072871
Submission received: 23 January 2025 / Revised: 11 March 2025 / Accepted: 18 March 2025 / Published: 24 March 2025

Abstract

:
Chinese tourist factory attractions are increasingly adopting Virtual Reality (VR) technology into experience design to enhance the appeal, visitor loyalty, and the industry’s sustainable development. However, research regarding the impact of VR on the sustainable development of factory tourism remains underexplored. This study reconstructs the “VR Perceived Experience-Perceived Value-Tourist Loyalty” model to explore the mechanisms through which VR experiences affect tourists’ perceived value, loyalty, and sustainability in tourist factories. We surveyed 521 VR participants at tourist factories and employed structural equation modeling for empirical analysis. The results indicate that: (1) the authenticity, immersion, interactivity, and aesthetics of VR experiences at tourist factories significantly and positively affect VR multi-sensory perception experiences; (2) multi-sensory VR perception experiences significantly and positively affect the perceived quality and perceived value of tourist factories; (3) multi-sensory VR perception experiences do not directly influence tourist loyalty; (4) VR perceived quality significantly and positively affects the perceived value and loyalty toward tourist factories; (5) the perceived value of tourist factories significantly and positively affects tourist loyalty. The findings elucidate the interrelationships between VR experiences, tourists’ perceived value, and loyalty in the context of tourist factories. They also provide theoretical support and practical guidance for policymakers in industrial tourism policymaking, management, experience design, and the sustainable development of factory tourism.

1. Introduction

Amid evolving consumer demands, the blooming experience economy, and ongoing optimization of industrial structures, manufacturing enterprises increasingly recognize that tourist factories are a key strategy for enhancing brand awareness, expanding their consumer base, and achieving sustainable development [1]. A tourist factory (i.e., a factory tour or sightseeing factory) is a specific venue providing factory tourism services and experiences that combine production tours, leisure services, experiential activities, product sales, and industrial cultural storytelling [2]. People visit tourist factories for various reasons, e.g., understanding product manufacturing processes, creating products, acquiring industry knowledge, broadening their horizons, purchasing specialty products, and for leisure/relaxation [3]. The goal of tourist factories is to revitalize industries, promote the transformation of traditional industries, and achieve sustainable development [4]. As enterprises recognize that expanding their business to attract consumers and increase competitiveness is essential for sustainable tourism [5], many Chinese manufacturing enterprises have integrated industrial features into unique factory tourism services, leading to rapid growth in China’s factory tourism industry. For example, BY-HEALTH, a brand of dietary supplements in Guangdong Province, has established a transparent factory, opening the raw materials and the entire production process to all sectors of society. The Choi Heong Yuen Bakery Tourism Factory in Guangdong Province has set up a Tourist attraction for “tourism + technology demonstration” and “tourism + experience production”. It comprehensively demonstrates the cake culture, development history, and inheritance of non-heritage technology through scene reenactment, displaying precious old objects and handmade experiences. These enterprises have successfully enhanced consumer recognition and strengthened their brand image through the characteristic tourism model of tourism factories. However, challenges such as inconsistent service quality, product homogenization, lack of uniqueness, low satisfaction, limited visitors, and insufficient recognition constrain the industry’s sustainable development. The World Commission on Environment and Development (WCED) report states that sustainable development means ensuring that development meets the needs of the present without compromising the ability of future generations to meet their own needs [6]. It is widely recognized that for development to be sustainable, it is necessary to consider environmental (ecological), social and economic harmonization [7,8]. Therefore, the sustainable development of tourism factories refers to the long-term, stable and coordinated development of tourism factories in the three aspects of environment, economy and society. Whether factories can achieve sustainable development has become a central concern for the future business plans of tourist factories.
The continual innovation of digital media technologies and scientific advancements such as Internet + AI, Augmented Reality (AR), and Virtual Reality (VR) are diversifying the interactive forms of digital displays. As such, Chinese tourist factory enterprises have begun to incorporate VR tourist experiences to attract visitors. VR is a virtual computer-simulated world widely used in product design, shopping, education and training, manufacturing process simulation, and entertainment tools [9]. Currently, only a small number of Chinese tourist factory attractions have designed VR interactive experience projects. Examples include a drone-piloting VR experience (flight skills training) at Dongguan’s YN Drone Company, pest control VR experience (mini-game for identifying pests and beneficial insects) at the Dongguan Tailiang Rice Exploration Pavilion (Figure 1), the space-living VR experience (simulated space-living scenarios) at the Shenzhen Green Navigation Space Research Institute, and the cultural VR experience of Luosifen at the Liuzhou Luosifen Industrial Park (interactive cultural education game). Surveys indicate that most VR applications in Chinese tourist factories are immersive, interactive game types or immersive virtual simulation environments [10]. Visitors wear VR equipment to interact with digital content in a virtual environment, experience simulated production processes, and learn about brand stories and corporate culture. Tourists can enjoy rich multi-sensory experiences through these activities [11], significantly enhancing their engagement and enjoyment in tourist activities [12]. Research indicates that integrating digital tools and technologies can significantly improve tourist service quality and adapt to evolving customer needs more effectively, ensuring sustainable development and enhancing competitiveness within the tourist industry [13]. Technologies such as artificial intelligence, the Internet of Things (IoT), circular economy, big data, AR, and VR are significant trends in achieving sustainable tourism [14]. Regarding the factory tourism industry, the innovation and development of digital media technologies continuously enriches display formats and communication methods for visitors. Previously static exhibits are now more dynamic, meeting the public need for knowledge acquisition and leisure entertainment. This transformation aids industrial upgrades, cultural preservation, and brand promotion while supporting sustainable development [15].
Research shows that VR tourist products available at tourist factory attractions often face practical issues such as high investment and maintenance costs, and long wait times for visitors [16,17]. Many operators of tourist factories have questioned whether VR activities in tourist factories deliver actual value. Thus, determining whether VR experiences in tourist factories can enhance tourists’ perceived value—improving their loyalty and promoting the sustainable development of enterprises—is essential for the sustainable development of tourist factories. Several studies indicate that sustainable tourism evolves with the development of tourist technologies and consumer demands while continually facing new challenges [18,19]. Research on destination experiences is critical in sustainable tourism [20]. However, reviewing the relevant literature shows a lack of research on VR experiences in tourist factories, particularly regarding the impact of VR experiences on tourists’ perception experiences, highlighting a critical research gap. Based on the above, this study focuses on fully immersive VR experiences in tourist factories. We propose the following research questions to explore the relationships between VR experiential perception factors, tourists’ VR perceived quality, perceived value, and loyalty:
(1)
What is the relationship between VR multi-sensory perception experience, VR perceived quality, and the perceived value of tourist factories?
(2)
What is the relationship between tourists’ VR perceived quality and the perceived value of tourist factories?
(3)
What is the relationship between the perceived value of tourist factories and tourist loyalty? Does it impact the sustainable development of tourist factories?
To address the research gaps, the present study addresses the questions above regarding the role of VR experiences in influencing tourists’ perceived value in the context of factory tourism. Referring to the “theoretical model of the indirect effects among tourists’ perceived value, satisfaction, and behavioral intentions” [21] and the relevant literature, this study introduces additional factors. We refined and organized the theoretical model and employed structural equation modeling (SEM) to analyze the mechanisms through which VR perception experiences affect tourists’ perceived value and loyalty in tourist factories. We discuss the empirical results and provide theoretical guidance and practical recommendations to enhance tourists’ VR experiences in tourist factories, improve their perceived value and loyalty, and promote the sustainable development of tourist factories.

2. Literature Review and Research Hypothesis

2.1. Current Works

Since its inception, VR technology has advanced rapidly, evolving from foundational software and hardware to the expansion of diverse application scenarios. Initial research primarily concentrated on developing VR technologies. Recent studies have shifted focus to hardware innovations such as VR wearable near-eye displays [22] and advancements in high-quality immersive VR video services [23]. VR is now widely applied across domains, including tourism, culture, retail, conferences and exhibitions, education, healthcare, and entertainment, demonstrating its robust adaptability. Within the tourist sector, VR has attracted significant scholarly attention since the 1990s [24]. Over decades of rapid growth, VR has profoundly influenced various aspects of tourism, including marketing, education, and cultural heritage preservation, profoundly impacting the industry [25]. Today, VR is predominantly used in art exhibitions, museums, historical sites, and leisure districts. Its authenticity and innovativeness have significantly propelled the growth of cultural tourism [26,27]. Research on this topic focuses primarily on optimizing tourist environments, enhancing interactive tourist experiences, and exploring innovative VR applications. The evolution of VR technology has fostered diversified tourist experiences, such as VR previews of attractions, VR-enhanced historical collections, VR theme park simulations, and VR museum visits. These applications can be categorized into interactive tours, exhibit interactions, multimedia resource integration, interactive gaming, and virtual simulated environments, enriching virtual tourist experiences [10,28].
However, the literature on factory tourism focuses on development models and strategies, tourist experiences, and visitor satisfaction. Despite the widespread application and study of VR technology across fields, research on VR in factory tourism remains underexplored. Early studies often drew on successful factory tourist development models from developed countries such as Europe, the United States, Japan, and Taiwan, proposing localized application strategies. For instance, Tang [29] summarized successful practices and typical pathways in industrial tourism, analyzing the advantages of winery-based factory tours while offering strategies for other wine companies. Zhang et al. [30] examined successful factory tourism cases in Taiwan, highlighting the significance of factory tourism models for urban tourist development. Wang [31] integrated brand development and communication theory to propose development strategies for factory tourism, focusing on factors such as positioning, industrial chains, talent cultivation, and media engagement. Recent research has increasingly explored visitor experiences in factory tourism. For instance, studies indicate that creating interactive and enjoyable factory tourist experiences can enhance visitors’ perceptions and evaluations of souvenirs [3]. Hong et al. [1] analyzed sensory design elements that can be applied in factory tourism, organizing design strategies to guide practitioners in sensory design and operational models. Visitor satisfaction and loyalty in factory tourism have persistently been key topics in tourism research on tourism. Lee [32] surveyed seven dimensions influencing visitor satisfaction during factory tours: accommodations and dining facilities, internal accessibility, nearby attractions, external accessibility, safety, and emergency systems, and the provision of on-site attractions and information services. Several studies have confirmed that higher visitor satisfaction is associated with stronger intentions to revisit and recommend [33,34]. However, most studies on factory tourism have adopted qualitative methods, such as case analysis, participant observation, in-depth interviews, and grounded theory, which may result in small sample sizes while limiting the representativeness of findings. Few studies have adopted quantitative methods, primarily surveys, with even fewer employing the Analytical Network Process (ANP) or Analytic Hierarchy Process (AHP). For example, Lee [32] and Hsieh [35] explored the factors influencing visitor satisfaction, revisit intention, and recommendation intention through survey methods.
While VR-related research encompasses a wide range of fields and topics, discussions on specific application contexts such as factory tourism are limited, leaving room for further research. Current studies have overlooked the profound impact of VR technology on the factory tourism industry and its potential role in the development of sustainable tourism. This gap in research on VR experiences in factory tourism needs to be further explored. Although research on factory tourism has addressed specific topics, the question of whether VR technology affects visitors’ perceived value and loyalty, consequently influencing sustainable development, has not been explored comprehensively.

2.2. Concepts Related to VR Sensory Experience Elements, Perceived Quality, Perceived Value and Tourist Loyalty

2.2.1. VR Realistic Perceived Experience (REE)

Authentic tourist experiences can be defined as “the genuine enjoyment and perception of the visitors” while primarily exploring “how real their experiences are” [36,37]. Authenticity is a key component of a meaningful travel experience [38,39]. VR technology enables tourists to experience virtual destinations closely aligned with real-world attractions, providing them with sensations similar to the real world [40]. Therefore, this study considers “VR authenticity” as the realism of the virtual world that culminates in an immersive tourist experience [12]. Research indicates that tourists’ VR realism perception directly affects their visit intentions [41]. Regarding consumer value, Gilmore and Pine [42] argued that perceived authenticity is as essential as memorable experiences. Therefore, tourists’ perceptions of VR realism are critical in shaping their travel experience. This study defines VR realistic experience as authentic sensory experiences tourists perceive through elements such as characters, scenes, and sounds in the VR of sightseeing factories.

2.2.2. VR Immersive Perceived Experience (IME)

An “immersive experience” refers to users’ subjective perceptions during human–computer interaction—a concept originating from video gaming [43]. An immersive experience is similar to a flow state and can be measured through six dimensions: concentration, dissociation, sense of passage, challenge, emotional investment, and enjoyment [44]. Through continuous stimulation and experience, an immersive environment helps users feel surrounded while interacting with the environment [45]. VR immersive experiences enable individuals to fully engage in the virtual world [42], forgetting time and space while generating a sense of presence [46,47]. This characteristic is a prominent feature of the VR experience [48], making users feel like they are the agents of action. This feeling stems from the user’s cognitive reconstruction rather than relying solely on devices like HMDs [49].
The concept of “immersion” is similar to, but distinct from, the notion of “presence” [50]. Presence refers to the perceptual illusion of a no-mediation experience that users undergo in human/technology-mediated environments. It is related to the psychological state known as the feeling of “being there”. Immersion encompasses a broader range of experiences than presence and is considered an experience that evolves [44]. The concept of “presence” has gradually been integrated with the notion of “immersion” for academic research and discussion [51]. Therefore, this study defined VR immersive experience as the extent to which tourists become immersed in the virtual environment—forgetting the passage of time and the outside world—fully engaging in the task environment.

2.2.3. VR Interactive Perceived Experience (INE)

Interactivity refers to the process through which users influence an environment or system [52]. It is also be considered the extent to which users can modify the form and content of a mediated environment in real time [53]. VR enables a system to respond to tracking data (e.g., user movement, walking, gestures, and gaze). Thus, it is a medium that offers more interactivity than other media types [54]. Therefore, interactivity is critical to the immersive VR user experience [53,55]. Interaction design aims to “enhance people’s understanding of what can be done, what is happening, and what has just happened” [56]. Since user control of virtual content in the VR world is a key issue in virtual interaction [57], designers must help users understand the content of interactive VR interfaces and where/how to interact and improve their discoverability and understandability. Furthermore, users rely on knowledge acquired from the real world to understand VR interaction rules. Therefore, this study defines VR interactive experience as the extent to which tourists perceive their ability to interact within the virtual environment across five aspects: sensory experience (interface), operational experience (interaction), exploration experience (information), interactivity discoverability, and interactivity understandability.

2.2.4. VR Aesthetic Perceived Experience (AEE)

Aesthetics refer to the perceived visual appeal of technology by users and depend on design, typography, colors, and images [58]. Research has comprehensively demonstrated the importance of aesthetics to user satisfaction [59] in influencing purchase intention [60]. Since aesthetics also significantly impact human–computer interaction [61], these are a critical perceptual factor in VR experiences [62]. Studies indicate that the aesthetics of a VR interface determine users’ willingness to use and accept the technology [63]. Among aesthetic factors, color plays a crucial role in the perception of VR devices, shaping users’ emotions and social perceptions [64]. Designers can employ color strategies to actively attract and guide participants’ experiences [65]. However, the subjectivity of aesthetics has led to it being overlooked by academia, along with the notion that it is not feasible to conduct deeper analyses on this topic [66]. The present study defines VR aesthetics as the degree of perceived visual aesthetic experience by users using VR devices, including color, interface, and appearance design.

2.2.5. VR Multi-Sensory Perceived Experience (MUE)

Schmitt [67] indicates that experiences surround the five senses (sight, hearing, smell, taste, and touch); they are triggered by perceptual stimulation to evoke aesthetic enjoyment and satisfaction that result from comprehensive engagement at the physical, mental, and cognitive levels. Emerging from communication and education studies, the term “multi-sensory” was initially used to describe concepts related to communication media [68]. Many tourist destinations leverage new media technologies such as VR to create multi-sensory VR experiences for visitors by enriching visual scenes, incorporating sound interactions, recreating tactile sensations, and releasing scents [69]. Jung et al. [70] note that multi-sensory VR systems surpass visual–audio VR in delivering superior visual and auditory experiences, significantly enhancing presence and user preferences. By integrating diverse sensory inputs, they achieve highly immersive and appreciated user experiences. However, most current VR devices are limited to visual and auditory experiences, with the occasional inclusion of basic tactile feedback [71]. Based on the above, this study defined VR multi-sensory perceptual experiences as the degree of realistic, natural, and immersive perceptual experiences provided by VR during factory tours involving the simulation and reproduction of multiple senses.

2.2.6. VR Perceived Quality (PQ)

Aaker [72] defined perceived quality as a customer’s perception of whether the overall quality of a product or service exceeds their expectations. Quality assessment is determined by consumers’ subjective and comprehensive evaluation of a product rather than its objective, technical quality components [73]. For instance, tourists typically evaluate perceived quality based on four aspects: product, price, environment, and service [74]. In the hospitality industry, the perceived quality of a destination is shaped by consumers’ perspectives regarding infrastructure, hotel service quality, and amenities such as accommodations [75].
Regarding VR tourist activities, perceived quality is defined as “the evaluation of the quality or performance of VR by tourists”, primarily reflected in aspects such as technical execution, content richness, and the smoothness of interactions [41]. The functional and experiential attributes of VR (effectiveness, vividness, enjoyment, control, curiosity, and engagement) can also be used to measure perceived quality [76,77]. Considering the above, this study defines visitors’ perceived quality of VR factory tours as comparing their expectations and actual perceptions of the VR experience, including the richness of VR content, interface aesthetics, clarity, and interaction.

2.2.7. Tourism Factory Perceived Value (PV)

Visitors’ perceived value refers to the overall assessment regarding the value of an experience, involving the degree to which personal needs and expectations are satisfied [78]. Scholars have established two main perspectives on the concept of perceived value. The first surrounds perceived value as a trade-off between perceived benefits and sacrifices [79]. It is assessed based on whether the experience is worth its associated cost [80]. The second considers perceived value to comprise multiple dimensions, including emotional, social, and functional values (diversity, quality, and price) [81,82]. Functional value (or utilitarian value) is widely recognized as a key factor influencing consumer choices [83]. Social value is typically expressed through communication and interactions between visitors and their companions or new acquaintances [84], manifesting in visitors’ engagement on social media [85]. Emotional value refers to various emotional states or feelings associated with consumption [86]. Entertainment value arises from the enjoyment experienced during engaging activities or consumption [87,88]. When well-designed factory tours transform traditional visits into captivating educational experiences, visitors can perceive their inherent educational value more fully [89]. For instance, through the factory tour VR experience, visitors not only perceive the appearance and production scenes of industrial products while hearing the environmental sounds of the real scene, but they also experience the manufacturing process through the operation of a controller. This multi-sensory participation enhances visitors’ understanding and recognition of industrial products, processes, and brands, increasing their perceived value. As such, this study defines visitors’ perceived value of factory tours as the comprehensive value perception derived from factory tour experiences, including functional, social, emotional, entertainment, and educational values.

2.2.8. Tourism Factory Tourist Loyalty (TL)

Customer satisfaction and loyalty are widely regarded as the foundation for achieving long-term profitability and success across various business sectors [90]. In the research on tourism, the concept of “tourist loyalty” is derived from “brand loyalty” in general marketing and “customer loyalty” in service marketing. Tourist loyalty refers to tourists’ willingness to revisit a destination and their level of endorsement [91], reflected in behavioral and attitudinal dimensions [92,93]. Behavioral loyalty is typically measured by revisit intention [94], whereas attitudinal loyalty is evaluated based on a strong commitment to purchasing products or services (i.e., repurchase and recommendation intentions) [95]. Yoon and Uysal [96] found that tourists’ willingness to recommend and repurchase or revisit is a significant indicator of tourist loyalty, even amid price increases. Studies suggest that factors influencing tourist loyalty include satisfaction, motivation, perceived value, perceived quality, and experience quality [34]. Therefore, researchers can quantitatively analyze tourist loyalty based on user behavior (willingness to revisit) and attitude (willingness to repurchase and recommend) perspectives. Based on the above, this study defines visitors’ loyalty to factory tours as the degree to which tourists maintain long-term positive attitudes and behaviors toward the factory tour experience.

2.3. Research Hypotheses

2.3.1. Relationship Between VR Realistic, Immersive, Interactive, Aesthetic Perceived Experience, and VR Multi-Sensory Perceived Experience

VR realistic perceived experiences can enhance users’ multi-sensory experiences in virtual environments by simulating multi-sensory elements and constructing virtual scenes [97,98,99]. Adding authentic content such as tour guides, navigation, and attractions to VR presentations enhances tourists’ sensory experiences [100]. Moreover, the immersive environment generated through VR contributes to multi-sensory perception experiences [97]. At the same time, VR interactivity is prominently reflected in multi-sensory experiences, including visual, auditory, tactile, and olfactory interactions [101], collectively shaping the VR multi-sensory experience. VR can blend multimedia technology and art [102], leveraging visual elements such as color, shape, and texture to create a beautiful illusion that enhances tourists’ visual perception experiences [103]. Based on the above, this study posits that VR authenticity, immersion, interactivity, and aesthetics influence VR multi-sensory perception experiences, proposing the following hypotheses:
H1: 
VR realistic perceived experience is significantly positively correlated with VR multi-sensory perceived experience.
H2: 
VR immersive perceived experience is significantly positively correlated with VR multi-sensory perceived experience.
H3: 
VR interactive perceived experience is significantly positively correlated with VR multi-sensory perceived experience.
H4: 
VR aesthetic perceived experience is significantly positively correlated with VR multi-sensory perceived experience.

2.3.2. Relationship Between VR Multi-Sensory Perceived Experience, VR Perceived Quality, Factory Tour Perceived Value, and Tourist Loyalty

Research indicates that VR multi-sensory design helps enhances the user experience, playing a crucial role in the evaluation of the quality of a product or service [104]. Through multi-sensory design, such as visual, auditory, and tactile elements, VR can improve users’ perceived quality [9]. At the same time, users construct their perceptions of the experiential quality of VR that produces immersive experiences, presence, and empathy, increasing their willingness for continued use [105]. Therefore, this study suggests that VR multi-sensory experiences influence tourists’ quality judgments of VR.
Furthermore, multi-sensory experiences can improve consumers’ perceived value by enhancing their perception of the functionality of products or services, stimulating emotional responses, and creating memorable experiences. First, multi-sensory experiences can capture consumers’ attention and influence their perception of the functional characteristics of a product or service, enhancing perceived value [106]. Research also shows that consumers’ multi-sensory perception directly affects their sense of enjoyment [107,108]. This indicates that VR multi-sensory experiences can stimulate emotional responses through the senses of sight, hearing, touch, and other sensory organs, enhancing the emotional value perception of a product or service. Additionally, a destination’s multi-sensory image helps increase visitors’ choices and loyalty toward a destination. Trang et al. [109] recommended that tourism managers incorporate more multi-sensory imagery in destination marketing. Further studies emphasize the role of multi-sensory experiences during travel in enhancing visitors’ attachment to a destination [110].
Based on the above, this study posits that VR multi-sensory perception experiences influence the perceived quality, perceived value, and tourist loyalty of VR factory tourism, proposing the following hypotheses:
H5: 
VR multi-sensory perceived experience is significantly positively correlated with VR perceived quality.
H6: 
VR multi-sensory perceived experience is significantly positively correlated with factory tour perceived value.
H7: 
VR multi-sensory perceived experience is significantly positively correlated with factory tour tourist loyalty.

2.3.3. Relationship Between VR Perceived Quality, Perceived Value, and Tourist Loyalty

The relationship between perceived quality, price, and perceived value is complex and varies across practical contexts in scholarly research [111]. Several empirical studies have confirmed that destination experience quality, perceived price, and perceived value directly impact tourist satisfaction and loyalty in the tourist industry [112,113].
The relationship between perceived quality and tourist loyalty has been recognized and studied in past research. Wang, Park, and Fesenmaier [114] found that perceived factors such as enjoyment, novelty, and interactivity elicited by smart tourism activities significantly impact tourist loyalty, indicating that the quality of tourist activities directly affects satisfaction and loyalty. Similarly, a positive correlation exists between tourist value perception and loyalty [115].
Several studies indicate that tourists’ perceived values in emotional, functional, and social aspects enhance overall satisfaction, subsequently leading to greater loyalty [115,116]. Other studies argue that perceived quality is the precursor to customer loyalty [117]. When tourists have a higher perceived value evaluation of a destination, it often increases revisit rates and encourages recommendations to others. Differing tourist background characteristics may foster significant differences in destination imagery, experience satisfaction, and customer loyalty [93].
Based on the above, this study proposes that tourist VR perceived quality has a positive impact on the perceived value of sightseeing factories; perceived quality has a positive effect on tourist loyalty; and perceived value of sightseeing factories has a positive impact on tourist loyalty, promoting sustainable development of sightseeing factory tourism. Therefore, this study proposes the following hypotheses:
H8: 
VR perceived quality is significantly and positively correlated with tourist perceived value of sightseeing factories.
H9: 
VR perceived quality is significantly and positively correlated with tourist loyalty.
H10: 
The perceived value of sightseeing factories is significantly and positively correlated with tourist loyalty.

3. Research Methods

3.1. Research Model

This study integrates VR experience elements to explore their interaction mechanisms with VR perceived quality, perceived value, and tourist loyalty of VR sightseeing factories. It investigates the influencing factors of tourists’ VR perception experience on the perceived value and loyalty of sightseeing factories. The research framework (Figure 2) comprises eight dimensions: VR authenticity, immersion, interactivity, aesthetic experience, multi-sensory perception experience, VR perceived quality, the perceived value of factory tourism, and tourist loyalty.

3.2. Variable Definition and Measurement

The questionnaire items in this study were designed based on recent theoretical research on VR experience, perceived quality, perceived value, and loyalty. Table 1 provides the operational definitions of latent variables, questionnaire items, and reference scales. Since this study explores how sightseeing factory VR experiences affect perceived value and tourist loyalty, the questionnaire includes multiple items to ask participants about their experiences with sightseeing factory VR activities, aiming to capture genuine post-experience feedback.

3.3. Questionnaire Design

This study employed an online survey for data collection. Before officially distributing the questionnaire, we conducted a pretest to determine its reliability. The pretest questionnaire was distributed to VR participants of the Dongguan Industrial Tourism Factory in June and July 2024, with 97 responses received. The survey gathered feedback from VR participants to minimize the questionnaire’s complexity and model-based expressions. In conducting reliability and exploratory factor analysis, items that did not meet the requirements were eliminated to ensure more accurate research results.
The formal survey questionnaire comprised 40 questions, divided into two main sections. The first section gathered basic information about the respondents, including age, gender, education level, occupation, income, and use experience, based on six questions. The second section focused on the tourist perception experience, with 32 questions categorized into subtopics. The questionnaire was distributed from July to September 2024 to visitors and staff participating in VR activities at industrial tourism sites.
The respondents participated in the following VR experience activities: (1) The Pests and Beneficial Insects Identification VR Game at the TL discovery museum in Dongguan. The TL discovery museum is a sightseeing factory with a core concept design for exploring knowledge about rice; it is a platform for promoting rice culture by integrating exhibitions, popularization of science, education, and cultural and creative industries. (2) The Drone VR Game at the YN drone factory in Dongguan. The YN drone factory is a study platform founded by drone enterprises to provide drone education, training, and other industrial tourism services. (3) The Space Life Scene Simulation VR Game in the LH interstellar space factory in Shenzhen. The LH interstellar space factory is a science education industrial tourism base with the theme of aerospace and aviation knowledge promotion. This tourist attraction integrates science education, leisure and entertainment.
To complete the questionnaire, the respondents were required to answer personal basic information and indicate their level of agreement or disagreement on a 7-point Likert scale ranging from 1 (strongly disagree) to 7 (strongly agree). Before the survey, the researchers provided detailed explanations regarding the questionnaire to the respondents, who voluntarily answered the questions and were free to withdraw at any time. This study was conducted based on the respondents’ full knowledge and voluntary participation.

4. Research Analysis and Findings

4.1. Descriptive Statistical Analysis

This study collected a total of 609 responses. After removing 88 invalid samples (those with logical errors or duplicates), 521 valid samples remained, with an effective response rate of 85.6%. We used a simple random sampling method and employed IBM SPSS 23 for descriptive data analysis. AMOS 23 was used for confirmatory factor analysis and structural modeling. Table 2 presents the distribution of demographic variables based on the survey data.
The respondents’ demographic data were categorized based on age, gender, educational level, occupation, monthly income, and frequency of VR experiences (Table 2). The survey results indicate that the number of female respondents was slightly higher than that of male respondents. Most responses were from the 18–29 and 30–39 age groups. Most respondents held bachelor’s or associate’s degrees; most were students, with a small proportion being retired or nearing retirement. The distribution of other occupations was evenly distributed. Most respondents earned less than CNY 2000. All respondents had experienced VR games or activities, with a slightly larger number having experienced them two or more times.

4.2. Reliability Analysis and Exploratory Factor Analysis

Cronbach’s alpha coefficient is commonly used in social scientific research to assess the reliability of subscales. Table 3 shows that the reliability (α) of the study scales was greater than 0.8, indicating good data reliability. Scale reliability remained unaffected by item deletion, as the reliability was above 0.8 even after item removal. This demonstrates a good correlation between the analysis items, indicating high internal consistency. The KMO values for all dimensions were greater than 0.8, and the p-values were lower than 0.05. This suggests that the data are suitable for exploratory factor analysis, highly reliable, and can be used for further study.
This study used exploratory factor analysis to examine the hypothesized model structure. Table 4 shows the results from factor extraction on the scale, indicating eight common factors with a cumulative variance contribution rate of 74.467% (greater than 60%). This finding indicates a reasonable degree of explanation while suggesting that the extracted factors are effective. The data in this study were rotated using maximum variance rotation to identify the correspondence between the factors and items. Table 5 shows that the communalities for all items were above 0.4, indicating a strong correlation between the items and factors. This means the factors can effectively extract information, and the correspondence between the factors and items was good.

4.3. Confirmatory Factor Analysis

The factor loadings table shows the analysis of the relationship between the factors and measurement items, and generally, the standardized factor loadings. Table 6 shows that the standardized factor loadings for all variables were greater than 0.6. This indicates that each observed variable significantly contributed to explaining its latent variable. This study used convergent and discriminant validity to validate structural validity. Table 6 shows that the AVE values for all data were greater than 0.5, and the CR values were higher than 0.7. This indicates that the data have good convergent validity. Based on the work of Fornell and Larcker (1981) regarding discriminant validity [122], the square root of the AVE for each dimension is greater than the correlations between dimensions (Table 7), indicating good discriminant validity.

4.4. Structural Model Analysis

4.4.1. Model Fit Test

Following the work of Schumacker [123], this study selected multiple indicators (CMIN/DF, SRMR, GFI, AGFI, NFI, IFI, TLI, CFI, RMSEA) to evaluate the model fit (Figure 2). Based on the model and hypothesized measurement parameters, the results show that CMIN/DF was lower than 3, SRMR was lower than 0.08, the GFI, NFI, IFI, TLI, and CFI values were all greater than 0.9, and RMSEA was lower than 0.08 (Table 8). Most model fit indices met the criteria, indicating good model fit.

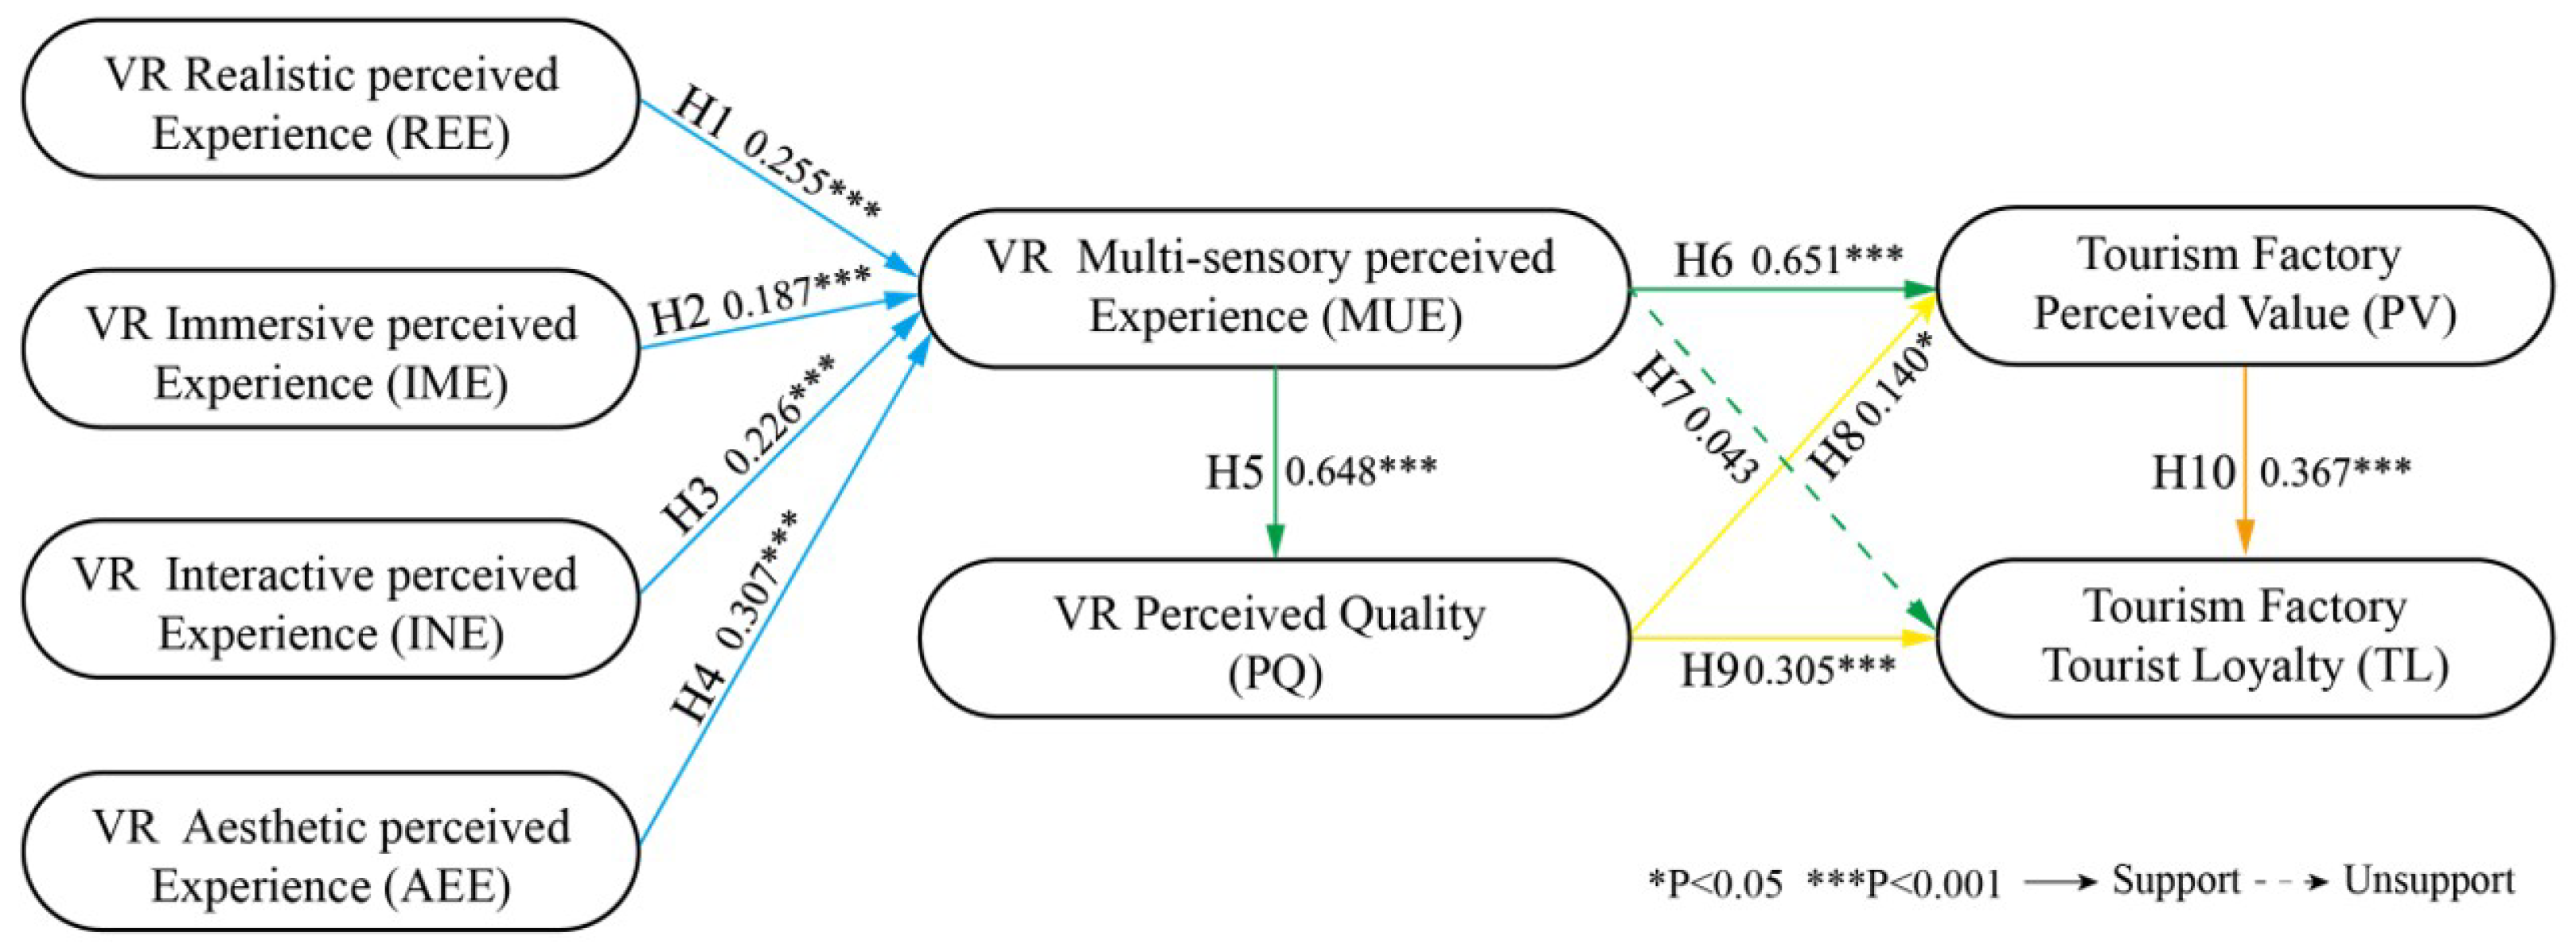
4.4.2. Path Analysis and Hypothesis Testing

The path coefficients in the structural equation model reflect the relationships and impact effects between the model variables. The standardized coefficients are presented in Table 9. The relationships between the variables in the structural model are presented in Figure 3. The path analysis results in Table 9 show that the authenticity experience of VR (β = 0.255, p < 0.05), immersion experience (β = 0.187, p < 0.05), interactivity experience (β = 0.226, p < 0.05), and aesthetic experience (β = 0.307, p < 0.05) significantly and positively affected multi-sensory perception experiences, supporting H1, H2, H3, and H4. VR multi-sensory perception experiences significantly and positively affected perceived VR quality (β = 0.648, p < 0.05) and the perceived value of factory tours (β = 0.651, p < 0.05). Thus, H5 and H6 are supported. VR multi-sensory perception experiences did not significantly affect visitor loyalty (β = 0.043, p > 0.05), indicating that H7 is not supported. The perceived quality of VR significantly and positively affected the perceived value (β = 0.140, p < 0.05) and visitor loyalty (β = 0.305, p < 0.05). Thus, H8 and H9 are supported. The perceived value also significantly and positively affected visitor loyalty (β = 0.367, p < 0.05), supporting H10. The weight ratio calculation method determined the proportion of each variable’s standardized coefficient. This led to the percentage data of each variable’s influencing factors (Table 10), which can clearly show the degree of influence of different factors.

5. Discussion

Based on the literature review, this study innovatively constructed a research model linking VR perception experience, perceived value, and visitor loyalty in the context of factory tours. Building on this model, we analyzed the questionnaire survey results. We discuss the interaction mechanisms between immersive VR experience, perceived value, and visitor loyalty to factory tours.
Based on the results, H1, H2, H3, and H4 are supported. The findings indicate that the authenticity, immersion, interactivity, and aesthetic experiences elicited by immersive VR during factory tours significantly and positively affected the multi-sensory perception experiences of the respondents. This finding aligns with the work of Feng et al. [97] and Mei and Chen [101], who examined the role of VR experience elements on multi-sensory experiences. These findings suggest that when VR experiences enhance authenticity, immersion, interactivity, and aesthetics, visitors can engage with multiple senses, resulting in richer, higher-quality experiences. The findings support that various dimensions of VR perceived elements do not exist in isolation but collectively shape high-quality multi-sensory perception experiences [124]. Among the dimensions, the aesthetic perception experience during VR factory tours exhibited the most significant impact on multi-sensory perception experiences (with a standardized path coefficient value of 0.307, with an influence percentage of 31.5%). In addition, the degree of influence of authenticity experience (with an influence percentage of 26.2%), interactive experience (23.2%), and immersive experience (19.2%) on multi-sensory experience decreases in turn. This indicates that visitors perceive aesthetic elements (e.g., spatial layout, material selection, and color matching) more prominently during VR virtual experiences [125]. The literature on factory tours illustrates that discussions on aesthetic experience are relatively scarce. Therefore, the present study addresses the theoretical gap on this topic while emphasizing the key role of aesthetic elements in optimizing visitor perception experiences. It provides essential theoretical support for enhancing the aesthetic research of VR experiences in factory tours, offering new perspectives and insights into the design practices of VR factory tours.
The results indicate that H5 and H6 are supported, demonstrating that VR multi-sensory perception experiences significantly affect visitors’ perceived VR quality and perceived value of factory tours. The standardized path coefficients for H5 and H6 were notably higher than those for other dimensions (with a standardized path coefficient value of 0.648 and 0.651). This finding suggests multi-sensory perception experience during VR factory tours significantly impacts perceived quality and value. When a VR experience engages multiple sensory channels (sight, sound, and touch), it can significantly enhance visitors’ perceived VR quality, thereby increasing their overall perceived value of the factory tour. In comparison to tourists’ perceived quality (with an influence percentage of 17.7%), a multi-sensory experience has a significant impact on perceived value (with an influence percentage of 82.3%). The research results further demonstrate the importance of a VR multi-sensory experience to perceived value. The findings are consistent with those of Wu et al. [107], who found that VR multi-sensory experiences in fashion product design stimulate users’ emotional, educational, and entertainment value perceptions, expanding the generalizability of the theory that VR multi-sensory perception experiences promote perceived value. These findings emphasize the significant impact of VR multi-sensory perception experiences on visitors’ perceived VR quality, aligning with the work of Fels and Schmitt [104] in the context of factory tours.
Based on the results, H7 is not supported, indicating that the VR multi-sensory perception experiences of factory tours did not directly affect visitor loyalty. The path analysis results showed that VR multi-sensory perception experiences did not directly influence visitor loyalty; however, they may indirectly impact visitor loyalty through perceived VR quality or perceived value of factory tours. Therefore, VR perceived quality and perceived value of factory tours are the key variables linking VR multi-sensory experiences and visitor loyalty. This finding contrasts with the work of Trang et al. [109], who found that the multi-sensory image of a destination directly enhances visitors’ choice of and loyalty to that tourist destination. Visitor loyalty is influenced and constrained by various factors, including satisfaction, experience quality, perceived value, perceived quality, price, and marketing strategies [34]. This further suggests that relying solely on the VR multi-sensory perception experience of factory tours may not directly generate visitor loyalty as multiple influencing factors need to be considered.
Based on the results, H8 and H9 are supported, indicating that visitors’ perceived VR quality significantly and positively affected their perceived value of factory tours and visitor loyalty. When visitors experience the VR program at the factory tour, if they rate the overall quality of the VR experience highly, they will form a higher judgment of the perceived value of the factory tour. This finding aligns with the work of Zhang et al. [126], who found that perceived quality in online shopping influences perceived value. Our results extend the theory of how perceived quality impacts perceived value in the context of factory tours, highlighting the importance of enhancing technology, product, and service quality for improving tourist experiences.
Based on the results, H10 is supported. This finding indicates that the perceived value of factory tours significantly affects visitor loyalty, impacting the sustainable development of the factory tour industry. Research data indicate that tourists’ perceived value (54.6% influence) affects loyalty more than perceived quality (45.4% influence). Currently, the notion that perceived value significantly affects visitor loyalty has been widely recognized across studies [33,92]; however, it has not been explored in depth in the context of factory tours. Therefore, the present study’s focus on the specific context of factory tours further validates the critical impact of visitors’ perceived value on their loyalty, aligning with past studies. This finding supports the importance of the perceived value of tourist experiences and provides practical guidance for factory tours to enhance service quality while meeting visitor needs.
Overall, the path from the aesthetic perception experience of VR factory tours to VR multi-sensory perception experiences, perceived value of factory tours, and visitor satisfaction had the highest standardized coefficient, forming the most significant impact path. This suggests that by introducing VR technology, factory tours provide visitors with an entirely new aesthetic and multi-sensory perception experience, significantly and positively impacting their perceived value and loyalty. Therefore, creating high-quality visual experiences during VR factory tours is key to enhancing visitors’ multi-sensory experiences and perceived value, deepening their loyalty. Specifically, the aesthetic and multi-sensory experiences of VR are essential to improving visitors’ overall evaluation of factory tours and tourist loyalty. For example, Tsingtao Beer Museum’s VR brewery experience uses rich sensory design to make visitors feel as if they were in a real brewery environment and learn each detail of the beer brewing process in a pleasant and easy way; Asahi Breweries Asahi Breweries has created a high-quality VR factory tour experience for visitors to remotely visit factories and production lines, which satisfies consumers’ curiosity and significantly enhances brand loyalty at the same time. Thus, optimizing and improving the quality of VR experiences during factory tours can strengthen visitor experiences, increase perceived value and loyalty, and promote the sustainable development of the factory tour industry.
The results of this study indicate that tourist factories can significantly increase the perceived value and loyalty of tourists by designing experiential activities using advanced VR technology. From a perspective of sustainable economic development perspective, increased visitor loyalty means a greater willingness to revisit and recommend. This suggests that high-quality VR experiences attract more tourists and enhance the brand awareness and tourism economic income of tourism factories, effectively alleviating economic pressure. From an environmental sustainability perspective, VR technology enables tourists to experience the production process and environment of factories in a virtual environment without requiring on-site visits, thus reducing resource consumption and carbon emissions due to transportation and accommodations. These combined positive impacts strongly support the sustainable development of factory tourism. Based on the above, we recommend that factory tours continue to deepen the research and application of VR technology, optimize VR experience content to meet the diverse needs of visitors, and strengthen interaction and communication with visitors to establish stronger brand loyalty. These steps may enhance visitors’ willingness to return, driving the sustainable development of the factory tour industry.

6. Conclusions and Implications

6.1. Conclusions

This study explored the impact of VR experiences in sightseeing factories on tourists’ perceived value and loyalty from an innovative perspective. In addition to expanding the theoretical framework of VR perception experiences and tourists’ perceived value, this study applied these concepts to sustainable tourism, particularly in the context of sightseeing factories. The findings highlight the indispensability of VR aesthetic experiences to the overall sightseeing factory experience. The results emphasize the key role of multi-sensory VR perception experiences in influencing VR perception quality, perceived value of sightseeing factories, and tourist loyalty. These findings fill the theoretical gap in the application of immersive VR perception experiences in sightseeing factories while providing scientific theoretical support and practical guidance for promoting and applying VR technology in the sightseeing factory sector. Based on the above, we offer strategic recommendations for policymakers and managers to foster the sustainable development of sightseeing factories. The findings can assist VR experience designers and industrial tourism planners in addressing the challenges posed by the continual innovation of digital media technologies more effectively.

6.2. Theoretical Contribution

This study innovatively constructed a more comprehensive research model while elucidating the key influencing factors through empirical research. We identified that the VR aesthetic perception experiences in sightseeing factories, VR multi-sensory perception experiences, and the perceived value of sightseeing factories formed the most significant impact pathway. The findings enrich the theoretical content of VR experiences in sightseeing factories. This study addresses the research gap on this topic while augmenting the scope of research on VR experience through an interdisciplinary perspective. Specifically, this study underscores the integrity of the theoretical system of sustainable development research in sightseeing factories as follows:
(1)
Based on past studies, this study innovatively constructed a research model linking VR perception experiences in sightseeing factories, tourists’ perceived value, and tourist loyalty. Our model addresses the relationships between tourists’ perceived quality, perceived value, and loyalty [115,117] while building a more comprehensive and scientifically sound theoretical framework. This model considers the core perceptual elements of VR in sightseeing factories, including realism, immersion, interactivity, aesthetics, and multi-sensory experience while incorporating rich dimensions regarding theories on tourism. The findings demonstrate the potential relationship between VR perception elements and tourists’ perceived value and loyalty in sightseeing factories, addressing the gap in research on perceived value in the context of sightseeing factories.
(2)
This study clarified the key influencing factors of perceived value and tourist loyalty in sightseeing factories. The results indicate a significant and positive impact of VR perception experiences in sightseeing factories, including realism, immersion, interactivity, and aesthetics, on VR multi-sensory perception experiences. VR aesthetic perception is a particularly critical factor. Furthermore, VR multi-sensory perception experiences significantly and positively impact tourists’ VR perception quality and the perceived value of sightseeing factories. Moreover, the perceived value of sightseeing factory visitors significantly and positively affects loyalty. The findings provide theoretical support for sightseeing factory practitioners and researchers in planning, designing, operating, and managing VR activities to enhance tourists’ perceived value, loyalty, and word-of-mouth promotion. This helps sightseeing factories stand out in the highly competitive tourism market while promoting the sustainable development of their business.
(3)
This study involved multiple disciplines, including VR experience, aesthetics, marketing, and industrial tourism. It promotes interdisciplinary theoretical connections and facilitates mutual learning between related disciplines regarding research methods and theoretical perspectives. Moreover, this study expanded the research perspectives and directions for interdisciplinary theory in research on the sustainable development of industrial tourism.

6.3. Practical Contributions

This study approached this topic from the perspective of VR experiences in sightseeing factories, exploring issues related to VR experiences, tourists’ perceived value, and loyalty. The conclusions surrounding the factors influencing the effect of VR perception experiences on the perceived value and loyalty of sightseeing factories offer practical implications. The implications for industrial tourism, policymaking in the sightseeing factory industry, management and operations, and tourism experience design care are detailed below.
(1)
The findings indicate that when VR experiences excel in aspects such as realism, immersion, interactivity, and aesthetics, tourists are better able to engage multiple senses while obtaining a richer and higher-quality experience. We recommend sightseeing factory managers and operators prioritize these four VR perception dimensions when evaluating VR effectiveness, paying close attention to tourists’ experiences while gaining insights into consumer behavior. When developing VR environments, designers should consciously enhance the realism, immersion, interactivity, and aesthetic qualities of the VR experience, focusing on technological innovation while continuously optimizing the visitor experience. The findings emphasize the critical importance of the aesthetic quality of VR. Thus, designers should prioritize optimizing the aesthetic effects of virtual interfaces in sightseeing factories, particularly the combination of materials, sound effects, animation, and other elements.
(2)
The findings highlight the impact of VR multi-sensory perception experiences on the perceived value and quality of VR sightseeing factories. We recommend that practitioners in the sightseeing factory industry reassess the importance of VR multi-sensory perception experiences in tourism. They should integrate multi-sensory experience elements into VR tourist products and services at attractions. This can involve designing attractive and unique multi-sensory stimuli to enhance tourists’ perception quality and increase their recognition of the perceived value of sightseeing factories.
(3)
The findings suggest that VR perception quality impacts tourist loyalty. Thus, we recommend that sightseeing factory managers prioritize VR experience quality monitoring and consumer feedback. For example, professionals should be assigned to conduct regular checks to mitigate issues such as VR screen lag or poor interactivity, making targeted improvements based on user feedback. We suggest allocating resources efficiently to continuously enhance experience quality, e.g., increasing investment in technology research and development, optimizing software and hardware, and introducing advanced equipment and technologies. VR experience designers should focus on fostering a sense of realism, optimizing interactivity, pursuing aesthetics, and continuously improving product quality when developing VR content.
(4)
Based on the research findings that highlight the close relationship between perceived value and tourist loyalty in sightseeing factories, we recommend that designers leverage VR interface visual effects, music, interactivity, narrative methods, and other elements to develop virtual experiences that convey the core values of a company, brand essence, and the artisanship behind its products. These experiences should meet consumers’ needs for education, entertainment, and social value experiences during sightseeing factory tours.

7. Study Limitations and Future Research

The conclusions of this study, based on empirical analysis, still have limitations. The following details the limitations and potential future research directions:
(1)
This study focused on tourists who have experienced VR games or activities in sightseeing factories. To recruit a sufficient number of experienced participants, a more detailed analysis of the participants’ purpose for visiting could be conducted. Perceived value may vary depending on the purpose of their visit, socio-economic factors, and the degree to which VR influences perceived value in different ways. Future research should analyze VR perception elements among tourists who are visiting for various purposes, along with socio-economic factors.
(2)
Due to China’s vast socio-economic landscape, this study focused on developed regions such as Dongguan, Guangzhou, and Shenzhen in Guangdong Province without surveying other areas. Future research should investigate tourist groups visiting sightseeing factories in different regions.
(3)
VR offers various display modes, such as animation, live-action, and mixed reality. It offers many application scenarios, providing users with diverse virtual experiences. Different types of VR elicit different focuses in perceptual experience, which can have varying degrees of influence on perceived value. Future research should examine the varying impact of different VR displays and interaction types in sightseeing factories on perceived value to advance knowledge in this field.

Author Contributions

L.Z. was the major writer of the manuscript; Y.W. analyzed the manuscript and led the project. All authors read the first draft, helped with the revision, and approved the article. All authors have read and agreed to the published version of the manuscript.

Funding

This work was supported by the 2024 Guangdong Provincial Characteristic Innovation Program for Higher Education Institutions (Project ID: 2024WTSCX355).

Institutional Review Board Statement

This study has been approved by Digital Media College, Dongguan Polytechnic with approval code DGPTDMC20240520 on date 20 May 2024.

Informed Consent Statement

Informed consent was obtained from all subjects involved in the study.

Data Availability Statement

The datasets used or analyzed during the current study are available from the corresponding author on reasonable request.

Conflicts of Interest

The authors declare no conflicts of interest.

References

  1. Hong, Q.Y.; Chen, J.L.; Lin, T.R. Exploring the sensory experience mode of tourist factories from the perspective of social design. J. Des. 2017, 22, 69–71. [Google Scholar]
  2. Jia, Y.; Li, Y.J. Factory planning and landscape layout design of edible mushroom sightseeing park. Edible Fungi China 2019, 38, 127–129. [Google Scholar]
  3. Lin, C.-H. Industrial tourism: Moderating effects of commitment and readiness on the relationship between tourist experiences and perceived souvenir value. Int. J. Cult. Tour. Hosp. Res. 2020, 14, 545–564. [Google Scholar] [CrossRef]
  4. Lin, P.F. The strategy of innovation and transformation of traditional small and medium-sized enterprises in Guangdong: Learning from Taiwan’s “tourist factory” model. Sci. Technol. Manag. Res. 2016, 36, 145–149. [Google Scholar]
  5. Luekveerawattana, R. Key factors affecting of tourists’decisions to stay at environmental friendly hotels. Pol. J. Manag. Stud. 2018, 17, 148–157. [Google Scholar]
  6. WCED—Special Working Session. World commission on environment and development. Our Common Future 1987, 17, 1–91. [Google Scholar]
  7. Ben-Eli, M. Sustainability: Definition and Five Core Principles; A Sustainability Laboratory Publication: New York, NY, USA, 2015. [Google Scholar]
  8. Hák, T.; Janoušková, S.; Moldan, B. Sustainable Development Goals: A need for relevant indicators. Ecol. Indic. 2016, 60, 565–573. [Google Scholar] [CrossRef]
  9. Kim, D.; Ko, Y.J. The impact of virtual reality (VR) technology on sport spectators’ flow experience and satisfaction. Comput. Hum. Behav. 2019, 93, 346–356. [Google Scholar] [CrossRef]
  10. Xu, L.F.; Tian, Z.Z.; He, Q. Virtual reality media research overview. Publ. J. 2022, 30, 77. [Google Scholar]
  11. Zhang, C. The why, what, and how of immersive experience. IEEE Access 2020, 8, 90878–90888. [Google Scholar] [CrossRef]
  12. Lee, H.; Jung, T.H.; tom Dieck, M.C.; Chung, N. Experiencing immersive virtual reality in museums. Inf. Manag. 2020, 57, 103229. [Google Scholar]
  13. Chorna, N.; Korzh, N.; Kiziun, A.; Onyshchuk, N.; Antoniuk, K. The role of digital technologies in the transformation of the tourism business: Prospects for development and impact on the country’s economy. AD ALTA 2024, 14, 136–140. [Google Scholar] [CrossRef]
  14. Loureiro, S.M.C.; Nascimento, J. Shaping a view on the influence of technologies on sustainable tourism. Sustainability 2021, 13, 12691. [Google Scholar] [CrossRef]
  15. Li, G.L. An exploration of immersive experiences in interaction design—A case study of TEAMLAB BORDERLESS Digital Art Museum. Design 2021, 34, 120–122. [Google Scholar]
  16. Song, Y.; Liu, X.Y. The application prospect of virtual reality technology in tourism industry. J. Wuhan Shipbuild. Vocat. Tech. Coll. 2024, 23, 103–108. [Google Scholar]
  17. Lv, Y.; Liu, D.M. Analysis of advantages and disadvantages of virtual reality technology application. Art Panor. 2015, 11, 130–131. [Google Scholar]
  18. Streimikiene, D.; Svagzdiene, B.; Jasinskas, E.; Simanavicius, A. Sustainable tourism development and competitiveness: The systematic literature review. Sustain. Dev. 2021, 29, 259–271. [Google Scholar]
  19. Guo, Y.; Jiang, J.; Li, S. A sustainable tourism policy research review. Sustainability 2019, 11, 3187. [Google Scholar] [CrossRef]
  20. Yoopetch, C.; Nimsai, S. Science mapping the knowledge base on sustainable tourism development, 1990–2018. Sustainability 2019, 11, 3631. [Google Scholar] [CrossRef]
  21. Gao, M. A review on the relationship between tourist perceived value, tourist satisfaction and behavioral tendency. J. Jiangxi Agric. Univ. (Soc. Sci. Ed.) 2011, 10, 135–143. [Google Scholar]
  22. Chang, C.; Bang, K.; Wetzstein, G.; Lee, B.; Gao, L. Toward the next-generation VR/AR optics: A review of holographic near-eye displays from a human-centric perspective. Optica 2020, 7, 1563–1578. [Google Scholar] [CrossRef] [PubMed]
  23. Du, J.; Yu, F.R.; Lu, G.; Wang, J.; Jiang, J.; Chu, X. MEC-assisted immersive VR video streaming over terahertz wireless networks: A deep reinforcement learning approach. IEEE Internet Things J. 2020, 7, 9517–9529. [Google Scholar] [CrossRef]
  24. Perry Hobson, J.; Williams, A.P. Virtual reality: A new horizon for the tourism industry. J. Vacat. Mark. 1995, 1, 124–135. [Google Scholar]
  25. Zhu, J.; Jiang, Y.; Wang, Y.; Yang, Q.; Li, W. Richness and dynamics: How to improve virtual reality tourism adoption with virtual social clues. J. Res. Interact. Mark. 2024, 18, 142–158. [Google Scholar]
  26. Guttentag, D.A. Virtual reality: Applications and implications for tourism. Tour. Manag. 2010, 31, 637–651. [Google Scholar]
  27. Cao, S.S.; Wang, C.H.; Li, C. The application innovation and trend of VR/AR in cultural tourism and film and television. Sci. Technol. Guide 2018, 36, 57–60. [Google Scholar]
  28. Hudson, S.; Matson-Barkat, S.; Pallamin, N.; Jegou, G. With or without you? Interaction and immersion in a virtual reality experience. J. Bus. Res. 2019, 100, 459–468. [Google Scholar]
  29. Tang, W.L.; Wei, B.S.; Zeng, B.; Kong, W.F.; Liu, T.; Ruan, S.L. Analysis on Industrial Tourism Development and Construction Path of Chateau Changyu Rena. Chin. Foreign Grapes Wine 2022, 2, 80–85. [Google Scholar]
  30. Zhang, M.S.; Jian, X.L.; Lin, S.H. A study on the development of post-industrial cities and tourist factories: A case study of tourist factories in Taiwan’s “Chocolate Republic”. Urban Plan. Shanghai 2016, 6, 116–122. [Google Scholar]
  31. Wang, Z.G. Research on brand building and communication strategy of Tangshan Industrial tourism. J. Hebei Energy Vocat. Tech. Coll. 2023, 23, 30–33. [Google Scholar]
  32. Lee, C.-F. Tourist satisfaction with factory tour experience. Int. J. Cult. Tour. Hosp. Res. 2015, 9, 261–277. [Google Scholar] [CrossRef]
  33. Lee, K.-T.; Kim, J.-H. World culture festivals: Their perceived effect on and value to domestic and international tourism. J. Psychol. Afr. 2016, 26, 443–448. [Google Scholar] [CrossRef]
  34. Wang, L.; Li, X. The five influencing factors of tourist loyalty: A meta-analysis. PLoS ONE 2023, 18, e0283963. [Google Scholar] [CrossRef]
  35. Hsieh, Y.-H.; Chuang, I.-C. Evaluation of key factors for service experience: A comparison of tourism factories and international tourism hotels. Tour. Econ. 2020, 26, 404–436. [Google Scholar] [CrossRef]
  36. Atzeni, M.; Del Chiappa, G.; Mei Pung, J. Enhancing visit intention in heritage tourism: The role of object-based and existential authenticity in non-immersive virtual reality heritage experiences. Int. J. Tour. Res. 2022, 24, 240–255. [Google Scholar]
  37. Kolar, T.; Zabkar, V. A consumer-based model of authenticity: An oxymoron or the foundation of cultural heritage marketing? Tour. Manag. 2010, 31, 652–664. [Google Scholar]
  38. Zatori, A.; Smith, M.K.; Puczko, L. Experience-involvement, memorability and authenticity: The service provider’s effect on tourist experience. Tour. Manag. 2018, 67, 111–126. [Google Scholar]
  39. Seyfi, S.; Hall, C.M.; Rasoolimanesh, S.M. Exploring memorable cultural tourism experiences. J. Herit. Tour. 2020, 15, 341–357. [Google Scholar]
  40. Kang, H.J.; Shin, J.-H.; Ponto, K. How 3D virtual reality stores can shape consumer purchase decisions: The roles of informativeness and playfulness. J. Interact. Mark. 2020, 49, 70–85. [Google Scholar]
  41. Li, M.; Sun, X.; Zhu, Y.; Qiu, H. Real in virtual: The influence mechanism of virtual reality on tourists’ perceptions of presence and authenticity in museum tourism. Int. J. Contemp. Hosp. Manag. 2024, 36, 3651–3673. [Google Scholar] [CrossRef]
  42. Gilmore, J.H.; Pine, B.J. Authenticity: What Consumers Really Want; Harvard Business Review Press: Boston, MA, USA, 2007. [Google Scholar]
  43. Brown, E.; Cairns, P. A grounded investigation of immersion in games. In Proceedings of the ACM Conference on Human Factors in Computing Systems, CHI, Vienna, Austria, 24–29 April 2004. [Google Scholar]
  44. Jennett, C.; Cox, A.L.; Cairns, P.; Dhoparee, S.; Epps, A.; Tijs, T.; Walton, A. Measuring and defining the experience of immersion in games. Int. J. Hum.-Comput. Stud. 2008, 66, 641–661. [Google Scholar] [CrossRef]
  45. Fan, X.; Jiang, X.; Deng, N. Immersive technology: A meta-analysis of augmented/virtual reality applications and their impact on tourism experience. Tour. Manag. 2022, 91, 104534. [Google Scholar] [CrossRef]
  46. Haywood, N.; Cairns, P. Engagement with an interactive museum exhibit. Springer: London, UK, 2006; pp. 113–129.
  47. Shin, D. How does immersion work in augmented reality games? A user-centric view of immersion and engagement. Inf. Commun. Soc. 2019, 22, 1212–1229. [Google Scholar] [CrossRef]
  48. Slater, M.; Sanchez-Vives, M.V. Enhancing our lives with immersive virtual reality. Front. Robot. AI 2016, 3, 74. [Google Scholar] [CrossRef]
  49. Shin, D. Empathy and embodied experience in virtual environment: To what extent can virtual reality stimulate empathy and embodied experience? Comput. Hum. Behav. 2018, 78, 64–73. [Google Scholar] [CrossRef]
  50. Lombard, M. At the heart of it all: The concept of presence. J. Comput.-Mediat. Commun. 1997, 3, JCMC321. [Google Scholar] [CrossRef]
  51. Jung, Y. Understanding the role of sense of presence and perceived autonomy in users’ continued use of social virtual worlds. J. Comput.-Mediat. Commun. 2011, 16, 492–510. [Google Scholar] [CrossRef]
  52. Blom, K.J.; Beckhaus, S. The design space of dynamic interactive virtual environments. Virtual Real. 2014, 18, 101–116. [Google Scholar] [CrossRef]
  53. Steuer, J. Defining virtual reality: Dimensions determining telepresence. In Communication in the Age of Virtual Reality; Lawrence Erlbaum and Associates: Mahwah, NJ, USA, 1995. [Google Scholar]
  54. Lanier, J. Virtually there. Sci. Am. 2001, 284, 66–75. [Google Scholar]
  55. Kim, J.; Ha, J. User experience in VR fashion product shopping: Focusing on tangible interactions. Appl. Sci. 2021, 11, 6170. [Google Scholar] [CrossRef]
  56. Norman, D.A. The Psychology of Everyday Things; Basic Books: New York, NY, USA, 1988. [Google Scholar]
  57. Boy, J.; Eveillard, L.; Detienne, F.; Fekete, J.-D. Suggested interactivity: Seeking perceived affordances for information visualization. IEEE Trans. Vis. Comput. Graph. 2015, 22, 639–648. [Google Scholar] [CrossRef] [PubMed]
  58. Oyibo, K.; Vassileva, J. HOMEX: Persuasive technology acceptance model and the moderating effect of culture. Front. Comput. Sci. 2020, 2, 10. [Google Scholar] [CrossRef]
  59. Liu, W.; Guo, F.; Ye, G.; Liang, X. How homepage aesthetic design influences users’ satisfaction: Evidence from China. Displays 2016, 42, 25–35. [Google Scholar] [CrossRef]
  60. Toufani, S.; Stanton, J.P.; Chikweche, T. The importance of aesthetics on customers’ intentions to purchase smartphones. Mark. Intell. Plan. 2017, 35, 316–338. [Google Scholar] [CrossRef]
  61. Jiang, Q.; Sun, J.; Yang, C.; Gu, C. The impact of perceived interactivity and intrinsic value on users’ continuance intention in using mobile augmented reality virtual shoe-try-on function. Systems 2021, 10, 3. [Google Scholar] [CrossRef]
  62. Li, N.; Gao, S.H. Research on the influencing factors of user intention in cultural heritage AR. Packag. Eng. 2023, 44, 87–98. [Google Scholar]
  63. Tabone, W.; Happee, R.; García, J.; Lee, Y.M.; Lupetti, M.L.; Merat, N.; de Winter, J. Augmented reality interfaces for pedestrian-vehicle interactions: An online study. Transp. Res. Part F Traffic Psychol. Behav. 2023, 94, 170–189. [Google Scholar] [CrossRef]
  64. Magalhães, M.; Coelho, A.; Melo, M.; Bessa, M. Measuring users’ emotional responses in multisensory virtual reality: A systematic literature review. Multimed. Tools Appl. 2024, 83, 43377–43417. [Google Scholar] [CrossRef]
  65. Carroll, F. Designing (for) experiences in photorealistic VR environments. New Rev. Hypermedia Multimed. 2010, 16, 181–194. [Google Scholar] [CrossRef]
  66. Álvarez-Marín, A.; Velázquez-Iturbide, J.Á.; Castillo-Vergara, M.; Acuña-Opazo, C. The moderating role of aesthetics and information quality for acceptance of augmented reality. Innov. Educ. Teach. Int. 2023, 62, 102–119. [Google Scholar] [CrossRef]
  67. Schmitt, B. Experiential marketing. J. Mark. Manag. 1999, 15, 53–67. [Google Scholar] [CrossRef]
  68. Liu, B.W. Research on the Application of Multi-Sensory Interactive Art in Immersive Exhibition Halls; Lu Xun Academy of Fine Arts: Shenyang, China, 2022. [Google Scholar]
  69. Dong, J.G.; Lu, J.J.; Ji, X. Research on museum exhibition design based on multi-sensory interaction—A case study of the new museum of Nantong Museum. Ind. Des. 2024, 1, 108–111. [Google Scholar]
  70. Jung, S.; Wood, A.L.; Hoermann, S.; Abhayawardhana, P.L.; Lindeman, R.W. The impact of multi-sensory stimuli on confidence levels for perceptual-cognitive tasks in VR. In Proceedings of the 2020 IEEE Conference on Virtual Reality and 3D User Interfaces (VR), Atlanta, GA, USA, 22–26 March 2020; pp. 463–472. [Google Scholar]
  71. Brengman, M.; Willems, K.; De Gauquier, L. Customer engagement in multi-sensory virtual reality advertising: The effect of sound and scent congruence. Front. Psychol. 2022, 13, 747456. [Google Scholar]
  72. Aaker, D.A. Managing Brand Equity: Capitalizing on the Value of a brand Name; Simon and Schuster: New York, NY, USA, 2009. [Google Scholar]
  73. Anderson, K.C.; Laverie, D.A. In the consumers’ eye: A mixed-method approach to understanding how VR-Content influences unbranded product quality perceptions. J. Retail. Consum. Serv. 2022, 67, 102977. [Google Scholar]
  74. Wong, J.; Law, R. Difference in shopping satisfaction levels: A study of tourists in Hong Kong. Tour. Manag. 2003, 24, 401–410. [Google Scholar]
  75. Pike, S.; Bianchi, C.; Kerr, G.; Patti, C. Consumer-based brand equity for Australia as a long-haul tourism destination in an emerging market. Int. Mark. Rev. 2010, 27, 434–449. [Google Scholar]
  76. Van Nguyen, T.; Van Nguyen, T.; Van Nguyen, D. Perceived Quality of Virtual Reality and Augmented Reality Technology Influences Travel Intention: The Case of Vietnam. J. Hunan Univ. Nat. Sci. 2024, 51, 14–23. [Google Scholar]
  77. Lee, W.-J.; Kim, Y.H. Does VR tourism enhance users’ experience? Sustainability 2021, 13, 806. [Google Scholar] [CrossRef]
  78. Lai, I.K.W.; Liu, Y.; Lu, D. The effects of tourists’ destination culinary experience on electronic word-of-mouth generation intention: The experience economy theory. Asia Pac. J. Tour. Res. 2021, 26, 231–244. [Google Scholar]
  79. Oh, H. Price fairness and its asymmetric effects on overall price, quality, and value judgments: The case of an upscale hotel. Tour. Manag. 2003, 24, 387–399. [Google Scholar]
  80. Díaz, M.R.; Rodríguez, T.F.E.s.; Díaz, R.R. A model of market positioning based on value creation and service quality in the lodging industry: An empirical application of online customer reviews. Tour. Econ. 2015, 21, 1273–1294. [Google Scholar] [CrossRef]
  81. Sweeney, J.C.; Soutar, G.N.; Johnson, L.W. The role of perceived risk in the quality-value relationship: A study in a retail environment. J. Retail. 1999, 75, 77–105. [Google Scholar]
  82. Yu, Y.; Lang, M.; Zhao, Y.; Liu, W.; Hu, B. Tourist perceived value, tourist satisfaction, and life satisfaction: Evidence from Chinese Buddhist temple tours. J. Hosp. Tour. Res. 2023, 47, 133–152. [Google Scholar] [CrossRef]
  83. Song, H.J.; Lee, C.-K.; Park, J.A.; Hwang, Y.H.; Reisinger, Y. The influence of tourist experience on perceived value and satisfaction with temple stays: The experience economy theory. J. Travel Tour. Mark. 2015, 32, 401–415. [Google Scholar]
  84. Choe, J.Y.J.; Kim, S.S. Effects of tourists’ local food consumption value on attitude, food destination image, and behavioral intention. Int. J. Hosp. Manag. 2018, 71, 1–10. [Google Scholar]
  85. Zhu, W.; Huangfu, Z.; Xu, D.; Wang, X.; Yang, Z. Evaluating the impact of experience value promotes user voice toward social media: Value co-creation perspective. Front. Psychol. 2022, 13, 969511. [Google Scholar]
  86. Rasoolimanesh, S.M.; Iranmanesh, M.; Amin, M.; Hussain, K.; Jaafar, M.; Ataeishad, H. Are functional, emotional and social values interrelated? A study of traditional guesthouses in Iran. Int. J. Contemp. Hosp. Manag. 2020, 32, 2857–2880. [Google Scholar] [CrossRef]
  87. Wirth, W.; Hofer, M.; Schramm, H. Beyond pleasure: Exploring the eudaimonic entertainment experience. Hum. Commun. Res. 2012, 38, 406–428. [Google Scholar] [CrossRef]
  88. Vogel, H.L. Entertainment Industry Economics: A Guide for Financial Analysis; Cambridge University Press: Cambridge, UK, 2014. [Google Scholar]
  89. Wu, M.-H.; Liang, H.-Y.; Chiang, T.-E. The management mode of metal craft tourist factory was discussed. Leis. Recreat. Res. 2022, 12, 17–34. [Google Scholar]
  90. Oliver, R.L.; Burke, R.R. Expectation processes in satisfaction formation: A field study. J. Serv. Res. 1999, 1, 196–214. [Google Scholar]
  91. Oppermann, M. Tourism destination loyalty. J. Travel Res. 2000, 39, 78–84. [Google Scholar]
  92. Suhartanto, D.; Brien, A.; Primiana, I.; Wibisono, N.; Triyuni, N.N. Tourist loyalty in creative tourism: The role of experience quality, value, satisfaction, and motivation. Curr. Issues Tour. 2020, 23, 867–879. [Google Scholar] [CrossRef]
  93. Luo, J.X.; Liu, C.M. Study on the relationship between tourist image, tourist experience satisfaction and customer loyalty. Leis. Bus. Res. 2017, 15, 35–51. [Google Scholar]
  94. Zeng, L.; Yi Man Li, R. Tourist satisfaction, willingness to revisit and recommend, and mountain kangyang tourism spots sustainability: A structural equation modelling approach. Sustainability 2021, 13, 10620. [Google Scholar] [CrossRef]
  95. Le Chi Cong, L.C.C. A formative model of the relationship between destination quality, tourist satisfaction and intentional loyalty: An empirical test in Vietnam. J. Hosp. Tour. Manag. 2016, 26, 50–62. [Google Scholar] [CrossRef]
  96. Yoon, Y.; Uysal, M. An examination of the effects of motivation and satisfaction on destination loyalty: A structural model. Tour. Manag. 2005, 26, 45–56. [Google Scholar] [CrossRef]
  97. Feng, M.; Dey, A.; Lindeman, R.W. An initial exploration of a multi-sensory design space: Tactile support for walking in immersive virtual environments. In Proceedings of the 2016 IEEE Symposium on 3D User Interfaces (3DUI), Greenville, SC, USA, 19–20 March 2016; pp. 95–104. [Google Scholar]
  98. Globa, A.; Beza, B.B.; Wang, R. Towards multi-sensory design: Placemaking through immersive environments–Evaluation of the approach. Expert Syst. Appl. 2022, 204, 117614. [Google Scholar] [CrossRef]
  99. Mura, P.; Lovelock, B. A not so little Italy? Tourist and resident perceptions of authenticity in Leichhardt, Sydney. Tour. Cult. Commun. 2009, 9, 29–48. [Google Scholar]
  100. Mura, P.; Tavakoli, R.; Pahlevan Sharif, S. Authentic but not too much’: Exploring perceptions of authenticity of virtual tourism. Inf. Technol. Tour. 2017, 17, 145–159. [Google Scholar] [CrossRef]
  101. Mei, J.Q.; Chen, Q. Multi-sensory visual interface generation method based on virtual reality. Comput. Simul. 2022, 39, 212–216. [Google Scholar]
  102. Li, S.; Li, J. Construction of Interactive Virtual Reality Simulation Digital Media System Based on Cross-Media Resources. Comput. Intell. Neurosci. 2022, 2022, 6419128. [Google Scholar] [CrossRef] [PubMed]
  103. Wang, Y. Aesthetic analysis of virtual reality technology system. Study Dialectics Nat. 2007, 23, 4. [Google Scholar]
  104. Fels, A.; Falk, B.; Schmitt, R. Multisensory product development. In Proceedings of the 21st International Conference on Engineering Design (ICED 17), Vancouver, BC, Canada, 21–25 August 2017; pp. 069–078. [Google Scholar]
  105. Lu, J.J.; Zhang, H. Transcendental Presence: Cognition, experience, and action research in virtual Reality journalism. Press Circ. 2023, 5, 16–27. [Google Scholar]
  106. Krishna, A.; Cian, L.; Aydınoğlu, N.Z. Sensory aspects of package design. J. Retail. 2017, 93, 43–54. [Google Scholar] [CrossRef]
  107. Wu, C.M.; Liao, Y.H.; Yuan, S. Construction of fashion experience design model from multi-sensory perspective. Packag. Eng. 2023, 44, 170–178. [Google Scholar]
  108. Fang, D.; Zhao, Z.; Xiong, C. What leads to an immersive night tourism experience? The relevance of multi-sensory stimuli, emotional involvement, and delight. Asia Pac. J. Tour. Res. 2024, 29, 31–46. [Google Scholar] [CrossRef]
  109. Trang, N.T.; Yoo, J.J.-E.; Joo, D.; Lee, G. Incorporating senses into destination image. J. Destin. Mark. Manag. 2023, 27, 100760. [Google Scholar] [CrossRef]
  110. Dong, Y.Y.; Qu, Y. How does sensory stimulation trigger emotion? The mechanism of persistent influence of multi-sensory travel experience on destination attachment. Tour. Sci. 2022, 2, 101–121. [Google Scholar]
  111. Chen, C.-F.; Chen, F.-S. Experience quality, perceived value, satisfaction and behavioral intentions for heritage tourists. Tour. Manag. 2010, 31, 29–35. [Google Scholar] [CrossRef]
  112. Chumpitaz, R.; Swaen, V. Service quality and brand loyalty relationships: Investigating the mediating effect of customer satisfaction. In Proceedings of the 31st European Marketing Academy Conference, Braga, Portugal, 26–28 May 2002; pp. 1–7. [Google Scholar]
  113. Wang, T.-L.; Tran, P.T.K.; Tran, V.T. Destination perceived quality, tourist satisfaction and word-of-mouth. Tour. Rev. 2017, 72, 392–410. [Google Scholar] [CrossRef]
  114. Wang, D.; Park, S.; Fesenmaier, D.R. The role of smartphones in mediating the touristic experience. J. Travel Res. 2012, 51, 371–387. [Google Scholar]
  115. Liu, S.; Li, S.; Chen, Y.; Zheng, T. Examining relationships among food’s perceived value, well-being, and tourists’ loyalty. J. Vacat. Mark. 2023, 29, 161–174. [Google Scholar]
  116. Guntoro, B.; Hui, T.-K. Travel satisfaction and revisit intention of Chinese visitors: The case of Singapore. In Advances in Hospitality and Leisure; Emerald Group Publishing Limited: Bingley, UK, 2013; Volume 9, pp. 29–47. [Google Scholar]
  117. Keller, K.L.; Lehmann, D.R. How do brands create value? Mark. Manag. 2003, 12, 26. [Google Scholar]
  118. Xiao, Y.F. Research and Implementation of Key Technologies for the Authenticity of Indoor Virtual Tour. Master’s Thesis, Xidian University, Xi’an, China, 2007. [Google Scholar]
  119. Shedroff, N. Experience Design 1; New Riders Publishing: Indianapolis, IN, USA, 2001. [Google Scholar]
  120. Chen, H.Q.; Ji, T.P. Aesthetic experience of virtual reality and visual simulation. Decoration 2004, 2, 169–172. [Google Scholar]
  121. Zeithaml, V.A.; Berry, L.L.; Parasuraman, A. The behavioral consequences of service quality. J. Mark. 1996, 60, 31–46. [Google Scholar] [CrossRef]
  122. Fornell, C.; Larcker, D.F. Evaluating structural equation models with unobservable variables and measurement error. J. Mark. Res. 1981, 18, 39–50. [Google Scholar] [CrossRef]
  123. Schumacker, R.E.; Lomax, R.G. A Beginner’s Guide to Structural Equation Modeling; Psychology Press: Hove, UK, 2004. [Google Scholar]
  124. Damayanti, R.; Redyantanu, B.P.; Kossak, F. A study of multi-sensory senses in museum virtual-visits. IOP Conf. Ser. Earth Environ. Sci. 2021, 907, 012020. [Google Scholar] [CrossRef]
  125. Li, J.; Li, D.N. Aesthetic research of virtual reality art. J. Nanjing Univ. Arts Fine Arts Des. 2021, 4, 169–172. [Google Scholar]
  126. Zhang, H.B.; Li, C.L.; Wei, S. The influence of online customers’ perceived quality and perceived value on purchase intention: Based on the perspective of consumer heterogeneity. Enterp. Econ. 2020, 39, 9. [Google Scholar]
Figure 1. VR interactive activities at the Tailiang Rice Exploration Pavilion.
Sustainability 17 02871 g001
Figure 2. Research structure.
Sustainability 17 02871 g002
Figure 3. Research structure diagram.
Sustainability 17 02871 g003
Table 1. Definitions of variable operability and reference scales.
Research VariableOperability DefinitionITEMSQuestionsReference
VR realistic perceived experiencePerceived realism: the extent to which elements such as characters, scenes, and sounds in sightseeing factory VR provide a sense of realism for tourists.REE1I believe the VR visuals in the sightseeing factory accurately and vividly replicate real scenes.[37,118]
REE2I believe the background music and sound effects in the VR experience of the sightseeing factory are quite realistic.
REE3I believe the scenes and object interaction methods in the VR experience of the sightseeing factory are quite realistic and natural.
REE4I can gain experience similar to interacting with the real world through the VR sightseeing factory.
VR immersive perceived experiencePerceived level of immersion: the degree to which tourists become immersed in the virtual environment, losing track of time, forgetting the outside world, fully engaging in a way that creates a sense of being present in the task environment.IME1During the VR experience at the sightseeing factory, I felt like I lost track of time.[12,44,45,47]
IME2During the VR experience at the sightseeing factory, I felt isolated from the outside world.
IME3During the VR experience at the sightseeing factory, I felt completely immersed.
IME4I forgot about my daily worries during the VR experience at the sightseeing factory.
VR interactive perceived experienceThe level of interaction perception: the degree to which visitors perceive the ability to interact with the virtual environment, including sensory experience (interface), operational experience (interaction), and exploratory experience (information), as well as interaction discoverability and comprehensibility.INE1During the VR experience at the sightseeing factory, I could interact freely with the VR environment.[28,55,119]
INE2During the VR experience at the sightseeing factory, I could explore the places or items I wanted to see.
INE3During the VR experience at the sightseeing factory, I could move around the environment.
INE4During the VR experience at the sightseeing factory, VR offered a variety of dialogue modes.
INE5During the VR experience at the sightseeing factory, I could easily understand and use the VR interaction features.
VR aesthetic perceived experienceAesthetic perception level: The visual aesthetic experience visitors perceive when using VR devices, including color, interface, and appearance design.AEE1I believe the visual effects of the VR sightseeing factory are very aesthetically pleasing.[12,58,120]
AEE2I believe the VR visual effects of the sightseeing factory are unique.
AEE3I believe the appearance of the VR sightseeing factory equipment is attractive.
VR multi-sensory perceived experienceMulti-sensory perception: The VR experience at the sightseeing factory provides visitors with a realistic, natural, and immersive sensory experience, including the simulation and reproduction of various senses, such as vision, hearing, and touch.MUE1During my VR experience at the sightseeing factory, I had different sensory experiences.[69,71]
MUE2During my VR experience at the sightseeing factory, I saw different visual scenes.
MUE3During my VR experience at the sightseeing factory, I could hear different sound effects and ambient background sounds.
MUE4During my VR experience at the sightseeing factory, I could feel the texture, temperature, and other qualities of the equipment’s surface.
Visitors’ VR perceived qualityComparing visitors’ expectations and actual experience perception of the VR experience at the sightseeing factory, including content richness, interface aesthetics, clarity, interactivity, and other qualities.PQ1The VR content of the tourist factory is very rich. [46,73,121]
PQ2The VR screen of the tourist factory is very beautiful.
PQ3The VR picture of the tourist factory is very clear.
PQ4The VR interaction of the tourist factory is very smooth.
Tourism factory perceived valueVisitors’ overall value perception gained from the sightseeing factory experience, including social, emotional, entertainment, and educational values, among others.PV1I believe the sightseeing factory is worth visiting.[81,82]
PV2I believe the sightseeing factory is an excellent place for me to make new friends or strengthen existing friendships.
PV3I believe the sightseeing factory makes me feel happy and relaxed.
PV4I believe the sightseeing factory is very interesting.
PV5I believe that visiting industrial factories has taught me a lot about industrial culture, production processes, and related knowledge.
Tourism factory tourist loyaltyThe extent to which tourists maintain a long-term positive attitude toward a tourist destination or activity is reflected in three aspects: willingness to revisit, willingness to recommend, and price tolerance.TL1I hope to revisit this tourist factory. [93,94,95,121]
TL2I will recommend this tourist factory to my relatives and friends.
TL3If the ticket price increases, I will still visit this tourist factory.
Table 2. Respondents’ basic information.
SampleCategoryFrequency (N)Percent (%)
AgeUnder 187714.8
18–29 years old19236.9
30–39 years old14227.3
40–49 years old9317.9
50 and above173.3
GenderMale25248.4
Female26951.6
Educational levelJunior high school or below499.4
Secondary school or high school8015.4
Undergraduate or college29456.4
Graduate and above9818.8
ProfessionStudent11221.5
Teacher5911.3
Independent workers10019.2
Civil servant or public institution officer7614.5
Company employee7113.6
Retiree173.3
Other8616.5
Monthly income (CNY)Under 200014427.6
2000–40007113.6
4001–60007514.4
6001–80007815.0
8001–10,000499.4
10,001–15,0005310.2
15,001 and above519.8
How many times have you experienced VR?One24547
Two or more27653
Table 3. Reliability and exploratory factor analysis.
ConstructItemCitcα If Item DeletedCronbach’s Alpha
Coefficient of Dimension
Cronbach Alpha Coefficient
Authentic experienceAUE10.7810.8450.8870.949
AUE20.7340.863
AUE30.7530.855
AUE40.7460.858
Multi-sensory experienceIME10.7260.8430.876
IME20.7320.841
IME30.6990.854
IME40.7740.824
Authentic experienceINE10.7150.8790.896
INE20.7390.874
INE30.7160.879
INE40.7730.867
INE50.7760.866
Perceived qualityAE10.7640.8150.874
AE20.7210.853
AE30.7870.794
Authentic experienceMPE10.7280.7980.852
MPE20.6870.814
MPE30.7350.793
MPE40.6250.84
Multi-sensory experiencePQ10.7760.870.899
PQ20.7780.868
PQ30.7710.872
PQ40.7770.869
Authentic experiencePV10.8090.8730.905
PV20.6910.898
PV30.7740.881
PV40.7640.883
PV50.7690.882
Perceived qualityTL10.7440.7620.848
TL20.7250.781
TL30.6820.822
KMO and Bartlett’s Test
Kaiser–Meyer–Olkin value0.941
Bartlett’s sphere testThe approximate chi-square10,824.954
df.496
Significance0.000
Table 4. Total variance explained.
ElementInitial EigenvalueExtract the Sum of Squared LoadsRotating Load Sum of Squares
TotalVariance %Cumulative %TotalVariance %Cumulative %TotalVariance %Cumulative %
112.48239.00739.00712.48239.00739.0073.69111.53611.536
22.2857.1446.1472.2857.1446.1473.55311.10322.638
31.9776.17752.3241.9776.17752.3243.1539.85432.493
41.6635.19657.521.6635.19657.523.0949.66942.162
51.5914.97262.4921.5914.97262.4922.9729.28651.448
61.5444.82467.3161.5444.82467.3162.6618.31659.763
71.2093.77871.0941.2093.77871.0942.3837.44667.209
81.0793.37374.4671.0793.37374.4672.3227.25874.467
90.6021.88176.348
100.5011.56677.914
110.4841.51479.428
120.4591.43580.863
130.4451.39182.254
140.4171.30483.557
150.4011.25384.81
160.391.21986.03
170.3731.16487.194
180.3591.12288.316
190.3451.07989.394
200.3291.02790.422
210.3180.99491.415
220.3090.96792.382
230.3050.95393.335
240.3030.94794.282
250.2830.88395.166
260.260.81295.978
270.2360.73896.716
280.2330.72797.442
290.2170.67898.12
300.2120.66298.782
310.1970.61499.397
320.1930.603100
Extraction method: Principal component analysis.
Table 5. Rotated component matrix.
QuestionElement
12345678
REE10.1020.1370.1060.8400.1430.1270.0870.052
REE20.2260.1230.1120.7800.1640.0900.1040.028
REE30.1510.1080.0870.7850.1810.1660.1290.115
REE40.1390.1820.1210.7710.1760.1660.0510.128
IME10.1190.1590.0700.1480.8020.0890.1110.049
IME20.1920.0410.0610.1760.8150.1040.0650.073
IME30.1190.2270.1620.1920.7190.1460.0730.128
IME40.1910.1990.1720.1500.7880.1200.1020.062
INE10.7430.2320.0960.1180.1760.0730.0370.128
INE20.7430.0910.1600.1950.1300.1910.1380.128
INE30.7570.1750.1050.0520.1400.1660.1320.088
INE40.8010.1260.1170.1480.0900.1080.1020.155
INE50.7840.1510.1260.1800.1520.1200.0000.170
AEE10.2110.2150.1540.0830.1410.1970.1980.762
AEE20.2100.1930.1350.1150.0580.0960.0930.806
AEE30.2030.1920.1360.1110.1080.1460.2000.799
MUE10.2070.2410.2150.1360.1280.7230.0970.106
MUE20.2400.2290.1850.1430.1540.6970.0120.103
MUE30.1900.2660.2120.2480.1520.6710.1480.149
MUE40.0750.1360.1470.1340.0940.7610.0950.126
PQ10.1450.1540.7780.1050.1230.2020.1870.113
PQ20.1380.1310.8110.0760.1000.1980.1710.054
PQ30.1000.1960.7940.1600.1080.1130.1230.179
PQ40.1790.1720.7970.1090.1310.1590.1180.102
PV10.1510.7940.2280.1060.1280.1500.1190.199
PV20.2090.6470.1320.1410.1760.1580.2580.088
PV30.1600.7350.1720.1830.1710.1710.1640.171
PV40.2030.7080.1200.1640.1590.2570.1560.158
PV50.1790.7730.1450.1200.1350.1960.1020.135
TL10.1330.2250.2250.1140.0580.0890.7890.152
TL20.0870.2000.1510.1050.1230.1010.7930.153
TL30.0980.1290.1590.1150.1270.0780.8060.122
Table 6. Measurement model.
ConstructItemEstimateS.E.pStd. EstimateCRAVE
Authentic experienceAUE11 0.8390.8880.665
AUE20.9630.047***0.79
AUE31.0050.046***0.823
AUE40.9840.047***0.808
Immersive experienceIME11 0.7780.8760.639
IME21.0190.055***0.788
IME30.9640.053***0.771
IME41.1240.056***0.857
Interactive experienceINE11 0.7590.8960.634
INE21.1210.06***0.802
INE31.0230.058***0.758
INE41.1050.057***0.823
INE51.1730.06***0.836
Aesthetic experienceAE11 0.860.8740.699
AE20.8670.043***0.777
AE31.0060.043***0.869
Multi-sensory experienceMPE11 0.8010.8530.594
MPE210.055***0.759
MPE31.1310.055***0.842
MPE40.890.057***0.67
Perceived qualityPQ11 0.8360.8990.691
PQ21.0670.048***0.831
PQ31.0890.049***0.826
PQ41.0280.046***0.833
Perceived valuePV11 0.8590.9060.658
PV20.8130.042***0.734
PV30.9490.04***0.828
PV40.9560.042***0.816
PV50.8980.039***0.814
Tourist loyaltyTL11 0.8590.8490.653
TL20.9340.047***0.812
TL30.8780.048***0.75
*** represents p < 0.001.
Table 7. Discriminant validity of measurement models.
REEIMEINEAEEMUEPQPVTL
REE0.815
IME0.474 **0.799
INE0.443 **0.448 **0.796
AEE0.355 **0.354 **0.497 **0.836
MUE0.482 **0.441 **0.501 **0.474 **0.771
PQ0.374 **0.386 **0.420 **0.429 **0.535 **0.831
PV0.457 **0.484 **0.516 **0.540 **0.606 **0.508 **0.811
TL0.348 **0.343 **0.349 **0.461 **0.380 **0.468 **0.505 **0.808
** represents p < 0.01.
Table 8. Model fit test.
Fit IndexFit CriteriaFit ResultsJudgment
CMIN/DF<31.759ideal
SRMR<0.050.054good
GFI>0.90.914ideal
AGFI>0.90.899good
NFI>0.90.929good
IFI>0.90.968good
TLI>0.90.964good
CFI>0.90.968good
RMSEA<0.080.038good
Table 9. Evaluation results.
HypothesisPathEstimateS.E.C.R.pStd. EstimateResultsImportance (Weight Ratio)
H1REE→MUE0.2290.0435.324***0.255Supported8.26%
H2IME→MUE0.1530.0393.889***0.187Supported6.06%
H3INE→MUE0.1930.0444.390***0.226Supported7.32%
H4AEE→MUE0.2500.0396.346***0.307Supported9.95%
H5MUE→PQ0.7350.05712.963***0.648Supported21.00%
H6MUE→PV0.7980.07310.918***0.651Supported21.10%
H7MUE→TL0.0530.0980.5390.5900.043Unsupported/
H8PQ→PV0.1510.0562.6770.0070.140Supported4.54%
H9PQ→TL0.3330.0665.073***0.305Supported9.88%
H10PV→TL0.3710.0725.185***0.367Supported11.89%
*** represents p < 0.001.
Table 10. Influence percentage of variables.
First-Level VariableSecond-Level VariableStd. EstimateInfluence Percentage (Weight Ratio)
MUEREE0.25526.2%
IME0.18719.2%
INE0.22623.2%
AEE0.30731.5%
TLPQ0.14045.4%
PV0.36754.6%
PVMUE0.65182.3%
PQ0.14017.7%
Disclaimer/Publisher’s Note: The statements, opinions and data contained in all publications are solely those of the individual author(s) and contributor(s) and not of MDPI and/or the editor(s). MDPI and/or the editor(s) disclaim responsibility for any injury to people or property resulting from any ideas, methods, instructions or products referred to in the content.

