Article

Predictors of Intention to Quit Among Urban Bus Drivers in Developing Countries: A Case Study of Vietnam

Faculty of Transport—Economics, University of Transport and Communications, Hanoi 100000, Vietnam
Sustainability 2025, 17(7), 2850; https://doi.org/10.3390/su17072850
Submission received: 24 January 2025 / Revised: 2 March 2025 / Accepted: 8 March 2025 / Published: 24 March 2025
(This article belongs to the Section Sustainable Transportation)

Abstract

Turnover is a significant challenge to maintaining the continuity of service provision and service quality. A high turnover rate is frequently seen for demanding and stressful jobs like bus driving. The Hanoi Transportation Corporation (TRANSERCO) takes responsibility for operating nearly half of the Hanoi bus network, including over 130 subsidized routes. According to the enterprise, over 55% of canceled trips come from a lack of drivers, and the decrease in the number of drivers has remained stable since 2020. The present study aimed to predict the antecedents of the turnover intention among bus drivers in Hanoi, Vietnam. The data used were collected from 428 drivers working on 68 routes operated by TRANSERCO. The results highlighted that drivers aged over 55 were more likely to have higher turnover intention. A worrying finding was that the most experienced drivers (>5 years) were more inclined to think about stopping driving buses. The respondents working on routes lying entirely in urban districts were more likely to be intent to quit their job, albeit with a weak significance level (90%). All four pressure types (i.e., traffic and road, schedule, cabin and vehicle, and weather) contributed to the turnover intention. The facilitating effects of pressures related to schedule and road/traffic were much larger than those of the remaining pressures. Rewards and organizational support were found to play a role in relieving this intention. Based on the findings of influential factors, managerial policies are proposed to lessen turnover intention among drivers. The current study is valuable to the literature, as it is one of the first investigations of the turnover intention among bus drivers in emerging countries.

1. Introduction

Turnover is indicated as the rate at which employees leave a company and are substituted [1]. It also can be understood as the fact that an employee leaves their organization or profession voluntarily. As such, it is the result of a worker’s initiation of terminating their relationship with the company [2]. Some earlier studies concentrated on the turnover issue through similar or alternative terminologies, such as “rates of departure” or “stability of employment” [3]. Turnover is described a process rather than a moment and encompasses a sequence of procedures, such as thinking about quitting, searching for a new job, and planning to leave [4]. Some researchers mentioned that the process of turnover intention comprises three elements in nature: psychological, cognitive, and behavioral [5].
Some levels of employee turnover are desirable because they bring about fresh ideas and new working motivations. However, high or unmanaged turnover can exhibit dramatic challenges and substantial adverse influences on a business. Loss of workers leads to increased recruitment expenses spent on advertising jobs, carrying out interviews, and even formulating recruitment agencies in response to a (very) high turnover rate [6]. New employees need time and training to become productive. As such, enterprises must consume a great deal of time and money to handle the gaps caused by quitting. Beyond financial and temporal expenses, losing experienced employees who have valuable knowledge about the operation of companies and relationships with customers and partners may result in a lack of expertise in the production process and even disruption of workflow [7]. The lack of labor pertains to additional responsibilities and tasks allocated to the remaining workers, imposing burnout and job dissatisfaction on them. Exhausted employees may work unsafely to complete heavy workloads, leading to safety concerns among managers [8]. New workers may be subject to lapses and mistakes because of a limited understanding of companies’ standards and regulations. Hence, turnover undeniably damages the organization’s performance by conveying a loss of valuable knowledge, abilities, and skills and disrupting existing interaction by diverting attention to nonproductive behaviors, not to mention incurring costs regarding replacement. More seriously, the repercussions of staff turnover may become more devastating when considering its consequences on customer satisfaction and enterprise reputation [9]. Customers can become frustrated when interacting with new, less experienced employees, generating decreased trust and loyalty. The lack of labor possibly results in a failure of maintaining service quality, particularly for the fields requiring direct interaction with clients, such as public transport [9]. Consequently, company profitability is dramatically reduced [10].
As a result of acknowledging turnover-related issues, a great deal of research has been undertaken to explore what contributes to personnel turnover. Knowledge of the influential factors is beneficial for proposing timely solutions to keep laborers. However, directly observing employees who leave their jobs is time-consuming and costly; therefore, turnover intention, which is a precursor of actual turnover, has been of interest to academics [6,11]. The literature of turnover intention, which is reviewed in details in Section 2.1, has been relatively rich, with a great deal of empirical evidence from a wealth of professions and sectors (e.g., hospitality industry, federal employees, financial officers, social workers, lawyers, IT professionals, pharmacists, and teachers [12,13,14,15,16,17,18,19,20,21]); however, little is known about the antecedents of turnover intention among bus drivers in developing countries. In response to this gap, the current paper examined contributors and barriers to workers’ intention to stop working in the bus sector in Vietnam. The data were collected from 428 drivers working on 68 routes operated by TRANSERCO in Hanoi, Vietnam. Exploratory factor analysis and linear regression were applied to identify the factors associated with turnover intention among bus drivers in Hanoi.
The current study can help advance the literature on the bus driver turnover issue by extending the border of our understanding of developing countries and incorporating personal and work-related characteristics into a model of predicting the intention to leave. The positive effects of the four pressures (i.e., traffic and road, schedule, cabin and vehicle, and weather) and the negative effects of rewards and organizational support on turnover intention has reinforced the literature. The present research’s results may be inspiring for other researchers when thinking about the solutions to labor-related problems in the bus sector. The managerial implications proposed can be informative for cities beyond Vietnam in the process of sustaining their public transport.
The remainder of this article includes four parts. The following section presents the literature review and the formulation of the research model. The data collection and methods are presented in Section 3. Subsequently, results and discussions are provided in Section 4. The last part comprises conclusions and proposes future research directions.

2. Literature Review and Research Model

2.1. Related Studies of Turnover Intention

There is a range of reasons why turnover takes place, including external environment (e.g., economy), organizational factors (e.g., sector type, payment, supervisory degrees, locations, promotions, and working conditions), personal demographics (e.g., age, education, income, and household component), and working characteristics (e.g., working experience) [6,11]. According to Takase [22], determinants of turnover intention can be classified into four groups. The first includes organizational factors that are characterized by organizational attributes (e.g., status or ranking of unionization or profitability of organization), organizational culture (e.g., justice, ethical climate, and congruence between the company’s and employees’ value systems), and interpersonal relationships within organizations (relationships between supervisors and colleagues, sexual harassment at the workplace, etc.). The second consists of work-specific factors, including role stress (e.g., conflict and ambiguity of the role and insufficient use of workers’ skill within the current role), workload, financial rewards, working conditions (e.g., work hazard, work schedule, etc.), and workers’ access to power (e.g., autonomy level). The third is attributable to employee-based factors that are involved in demographical variables (e.g., gender, educational level, and age), work-involved variables (e.g., profession type, work area, and work experience), and employees’ perceptions (e.g., job performance, job satisfaction, burnout, and work–life balance). The last group is external factors like job opportunities. Previous studies have only considered some rather than all potential factors.
Turnover intention (also mentioned as “intention to quit” and “intention to leave” in the literature) has always been explored for workers in demanding and stressful sectors that need a great deal if labor but confront high turnover rates [22,23,24]. For example, intentions to quit among nurses have been extensively investigated since the turnover rate for this sector is high at 10–20% in the U.S., the U.K., and Japan [23,25,26]. Even a higher rate of 27% is witnessed for first-year nurses in the U.S., and the upward trend of the rate has remained stable [22]. For the transportation field, most related research is on truck drivers [27,28,29,30]. As a typical instance, a study set in the U.S. analyzed staff turnover intention for truckload irregular-route motor carriers. It reported that direct management and supervisory contact with drivers are important in lessening turnover [31]. The study carried out by Takase [32] based in Canada looked at the effects of the transparency of algorithmic management functions, including surveillance and performance management, on distributive and procedural justice, which are predictors of intention to quit among truck drivers. Tanning et al. [33] compared key indicators of transportation companies, with a focus on turnover rates in Central and Eastern Europe. Specifically, they analyzed changes in the labor market, turnover, added value, profit, and labor productivity based on different kinds of companies. Several analyses of intention to leave for other kinds of drivers have been performed recently. Nguyen et al. [2] analyzed the turnover intention among 806 delivery riders in Ho Chi Minh City, Vietnam, during the pandemic period. Quitting intention was found to be associated negatively with job resources, male sex, having chronic diseases, and migrant status while positively with job burnout. So far, to the best of our knowledge, there are only two papers on turnover intention among bus drivers in developing countries. Lannoo et al. [34] indicated that a shortage of fulfillment, a demanding working environment, a work–life imbalance, a temporary contract, and a lack of social support are the main catalysts for shaping the intention to quit for Belgian bus and coach drivers. Using the data from 324 workers of city bus enterprises in Kaohsiung, Taiwan, Chen et al. [35] reported a strong relationship between turnover to leave and organizational commitment that is deteriorated by emotional exhaustion and facilitated by job satisfaction. Since the behavioral findings are context-specific, it is necessary to extend the knowledge on bus drivers’ turnover intention to the developing world.

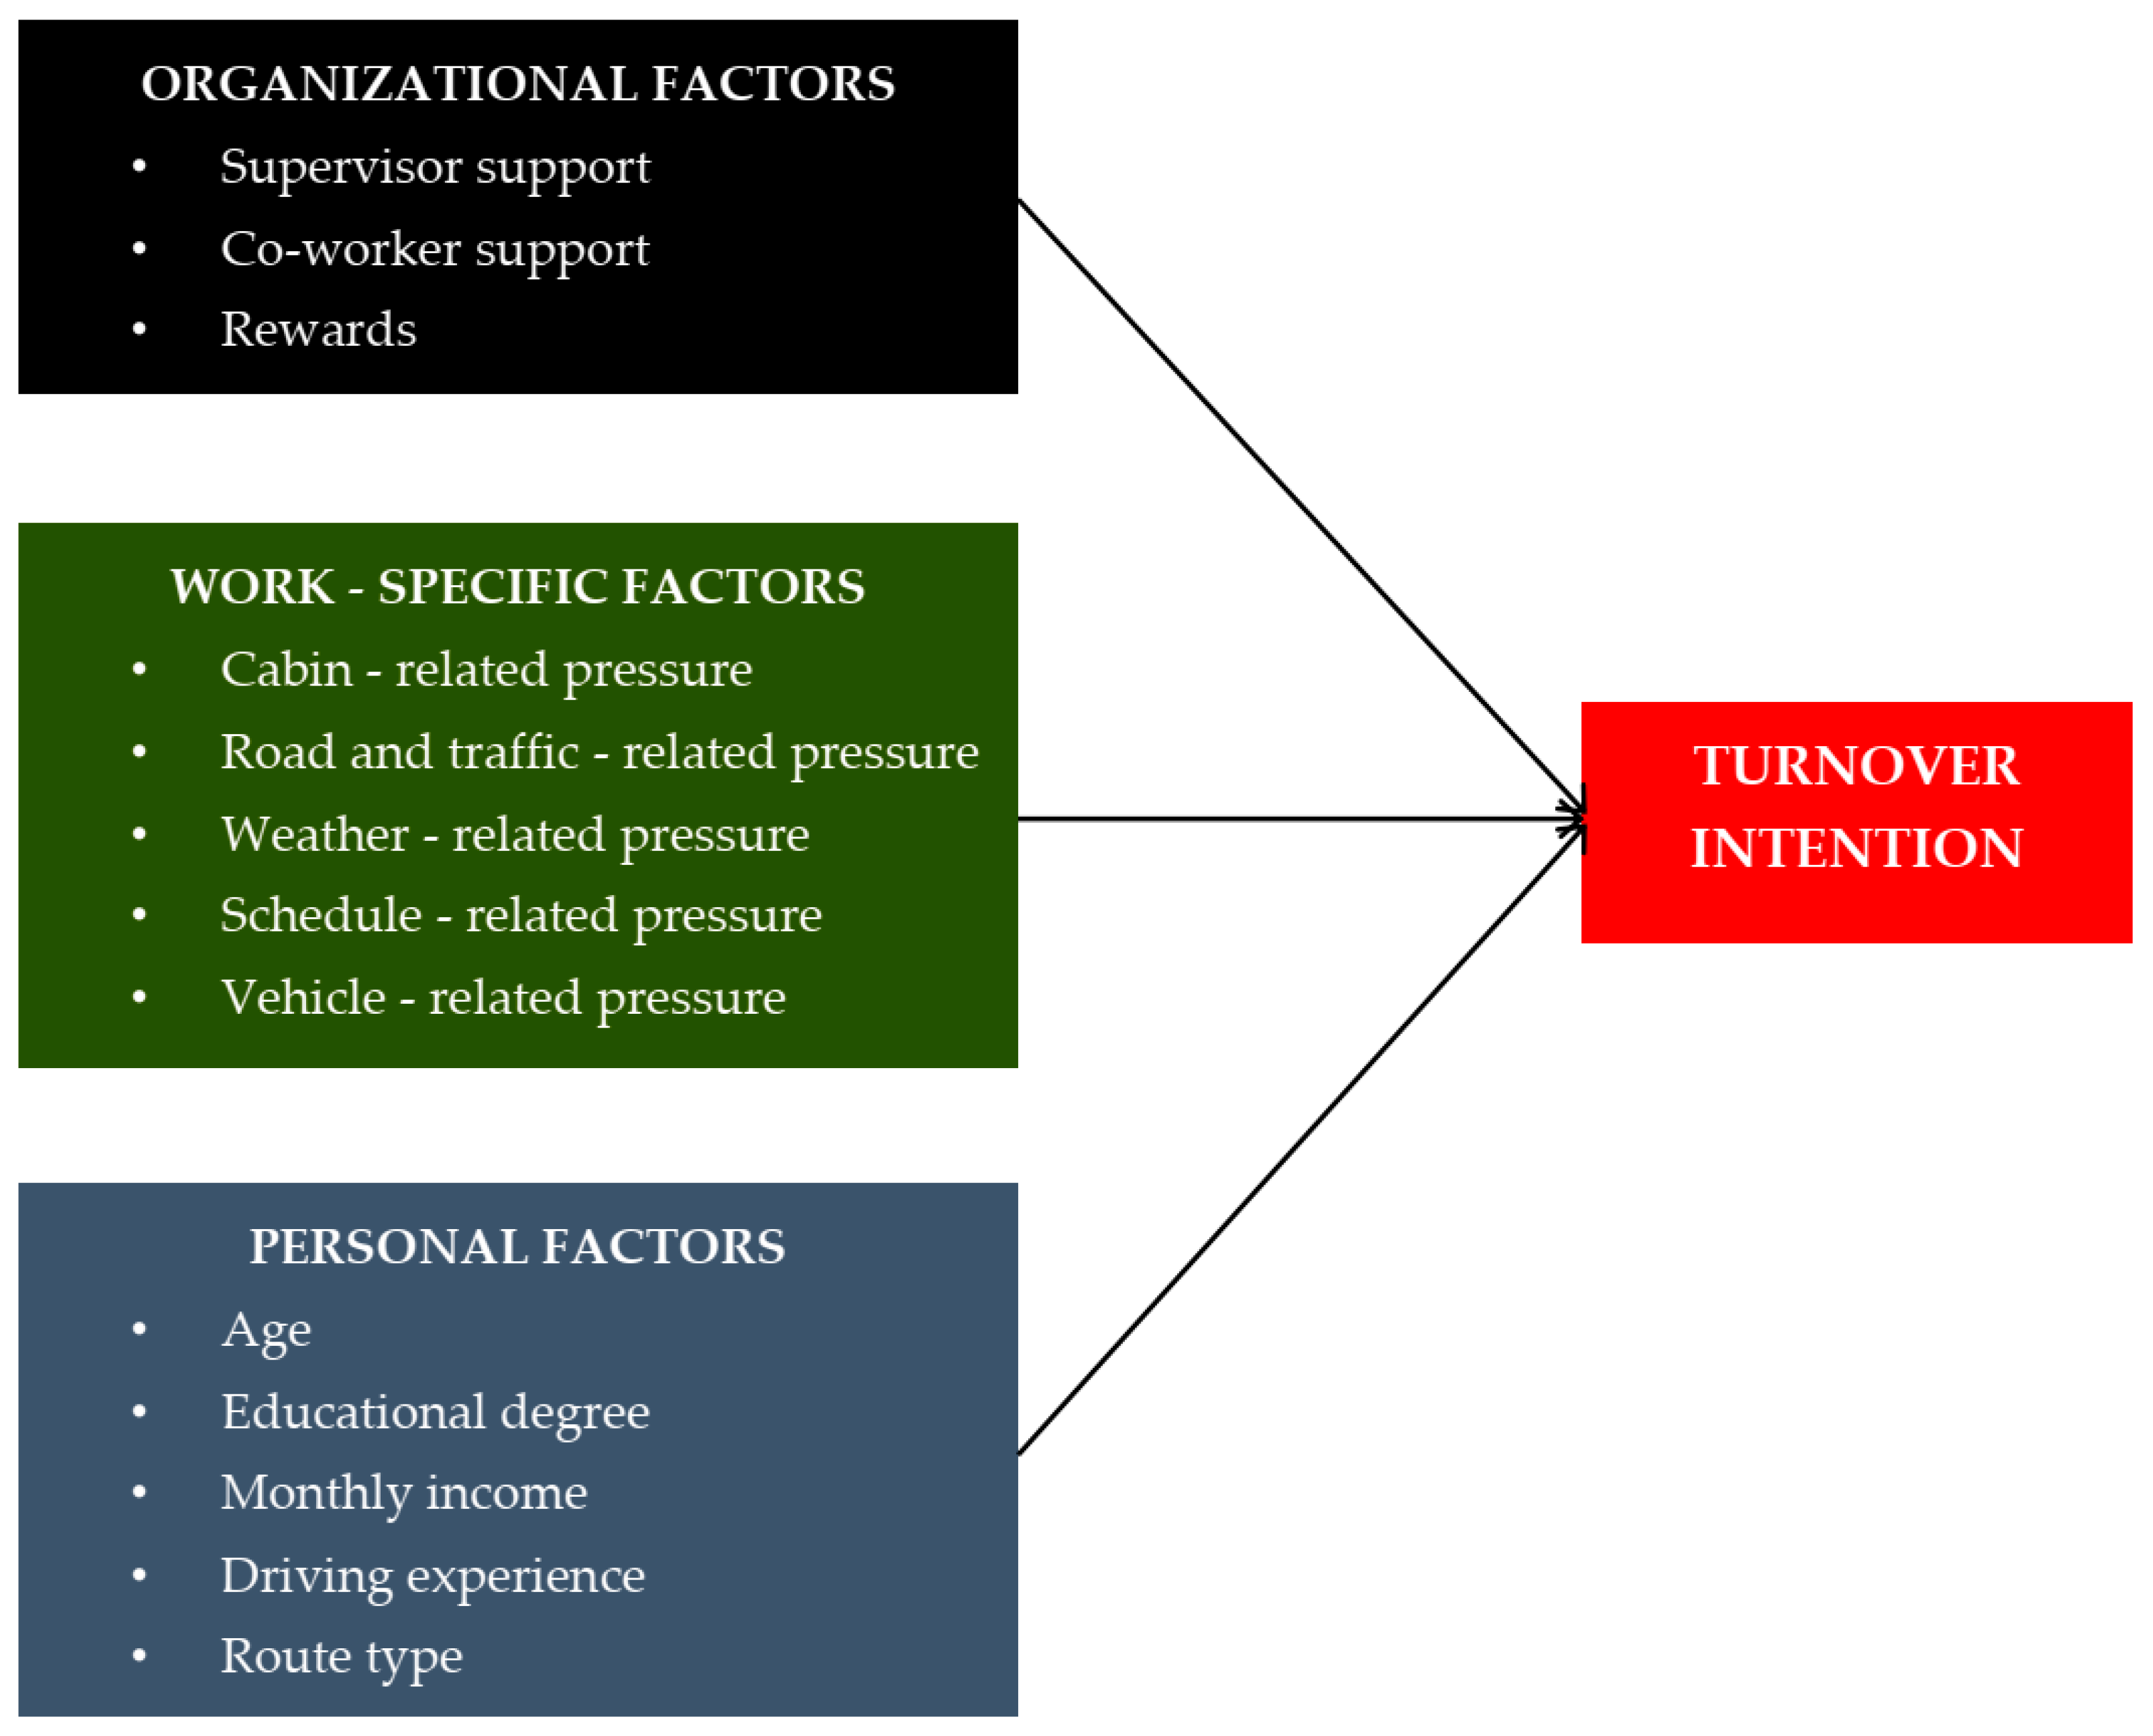
2.2. Research Model Formulation

The theoretical framework of the present paper is proposed based on the characteristics of the bus-driving occupation and the existing literature on turnover intention.
This article follows the framework of [22], including four main predictor groups: (1) organizational attributes, (2) work-specific factors, (3) employee-based factors, and (4) external factors. However, we only focused on the three first variable groups while ignoring the last group, which is difficult to measure and has much less frequently been considered [11].

2.2.1. Organizational Factors

Supervisor support is found to be an important element in organizational factors. Interpersonal interactions are helpful in creating a friendly and positive climate at the workplace. Co-workers’ support helps reduce stress and foster the perception of an encouraging work environment, thus enabling employees to achieve well-being and avoid negative outcomes [36,37]. Moreover, previous research suggests that a job is attractive owing to (job) rewards, which are given to workers based on their performance. Rewards can assist a worker in reaching achievement and growth, thus lessening the intention to change their occupation.
Hence, the current study considered the organizational factor’s dimensions: supervisor support, co-worker support, and rewards.

2.2.2. Work-Specific Factors

The working conditions of city bus drivers are well known to be demanding, unhealthy, and stressful, with high rates of morbidity and turnover [35]. Bus drivers have to face substantial stressors, including congestion, aggression of passengers, rotating timetables, and poor cabin ergonomics [38]. Thus, drivers are vulnerable to specific health problems and are more likely to seek other jobs. Unlike other drivers, such as truck drivers, bus drivers have to meet various objectives, such as traveling safely and satisfying passengers’ needs [39]. As such, three main work-related dimensions are considered in the current study: (1) the cabin, (2) road conditions, and (3) weather [40]. As regards the cabin, drivers usually work in a confined space shared with passengers, thus being impacted by noises and smells from this space [38]. In addition, passengers’ rude behavior can directly affect the driver, contributing to discomfort and fatigue. As regards road conditions, bus drivers must navigate through mixed traffic, creating pressure as they need to be constantly alert to other vehicles while also maneuvering the bus in and out of stops. The absence of dedicated or priority lanes has been shown to put additional pressure on drivers, especially from motorcycles in developing countries [41]. Factors such as the width of the road, the number of lanes, and the presence of a median strip can also affect stress levels [42]. Generally, wider roads with multiple lanes and a median strip can alleviate the pressure on drivers. Weather conditions also contribute to the stress experienced by drivers. High outdoor temperatures can increase the cabin temperature, even with air conditioning, causing fatigue. In colder weather, drivers might need to wear additional layers while working. Extreme hot and cold temperatures can be uncomfortable, especially when switching between being in and out of a bus. Rain is a common weather condition requiring greater attention and focus from drivers, increasing the likelihood of accidents [43,44].
Bus drivers are subject to pressure pertaining to the schedule and vehicle. One of the greatest stressors for bus drivers is time strain. Bus services are typically frequent, with tight schedules, particularly during peak hours. Consequently, drivers may have insufficient time to rest and are under constant pressure to complete their missions on time [45]. Buses typically operate from early morning (5:00 a.m.) until late at night (11:00 p.m.). In some cases, drivers may need to move the buses from the garage to the start point (a terminal) or from the endpoint (another terminal) back to the garage, requiring them to wake up early or finish late. Moreover, drivers often work every day of the week without weekends off, which increases stress, especially when their families or friends are free during those times. In terms of vehicle conditions, when buses are in good technical condition, drivers feel comfortable and secure in their work. However, older vehicles or those with inadequate maintenance can cause unexpected breakdowns during the route, adding further stress. Moreover, buses operate intensively (14–16 h per day), causing difficulty in arranging the maintenance plan [46].
Hence, the current study considered five types of work-based pressures: cabin-related pressure, road- and traffic-related pressure, weather-related pressure, schedule-related pressure, and vehicle-related pressure.

2.2.3. Personal Factors (Employee-Related Factors)

The present research considers three demographical characteristics (i.e., age, educational degree, and monthly income) and two working ones (i.e., route type and driving experience) of bus drivers. Gender is one of the most frequently considered variables when examining the intention to quit in prior analyses. However, it was ignored here since bus drivers are all male in the case of Hanoi. Previous studies have suggested that workers are less inclined to quit their occupations if they are older, less educated, and higher earners [24,47,48]. Yet, the relationships between demographics and turnover intention are not consistent. For example, the intention to quit among delivery riders in Vietnam is found to be independent of age and university education [2]. Moreover, work-related attributes such as working experience and working scope are highly recommended for accounting for organizational outcomes in the bus sector [40].
All of the variables posited to determine bus drivers’ turnover intention are shown in Figure 1.

3. Data and Methods

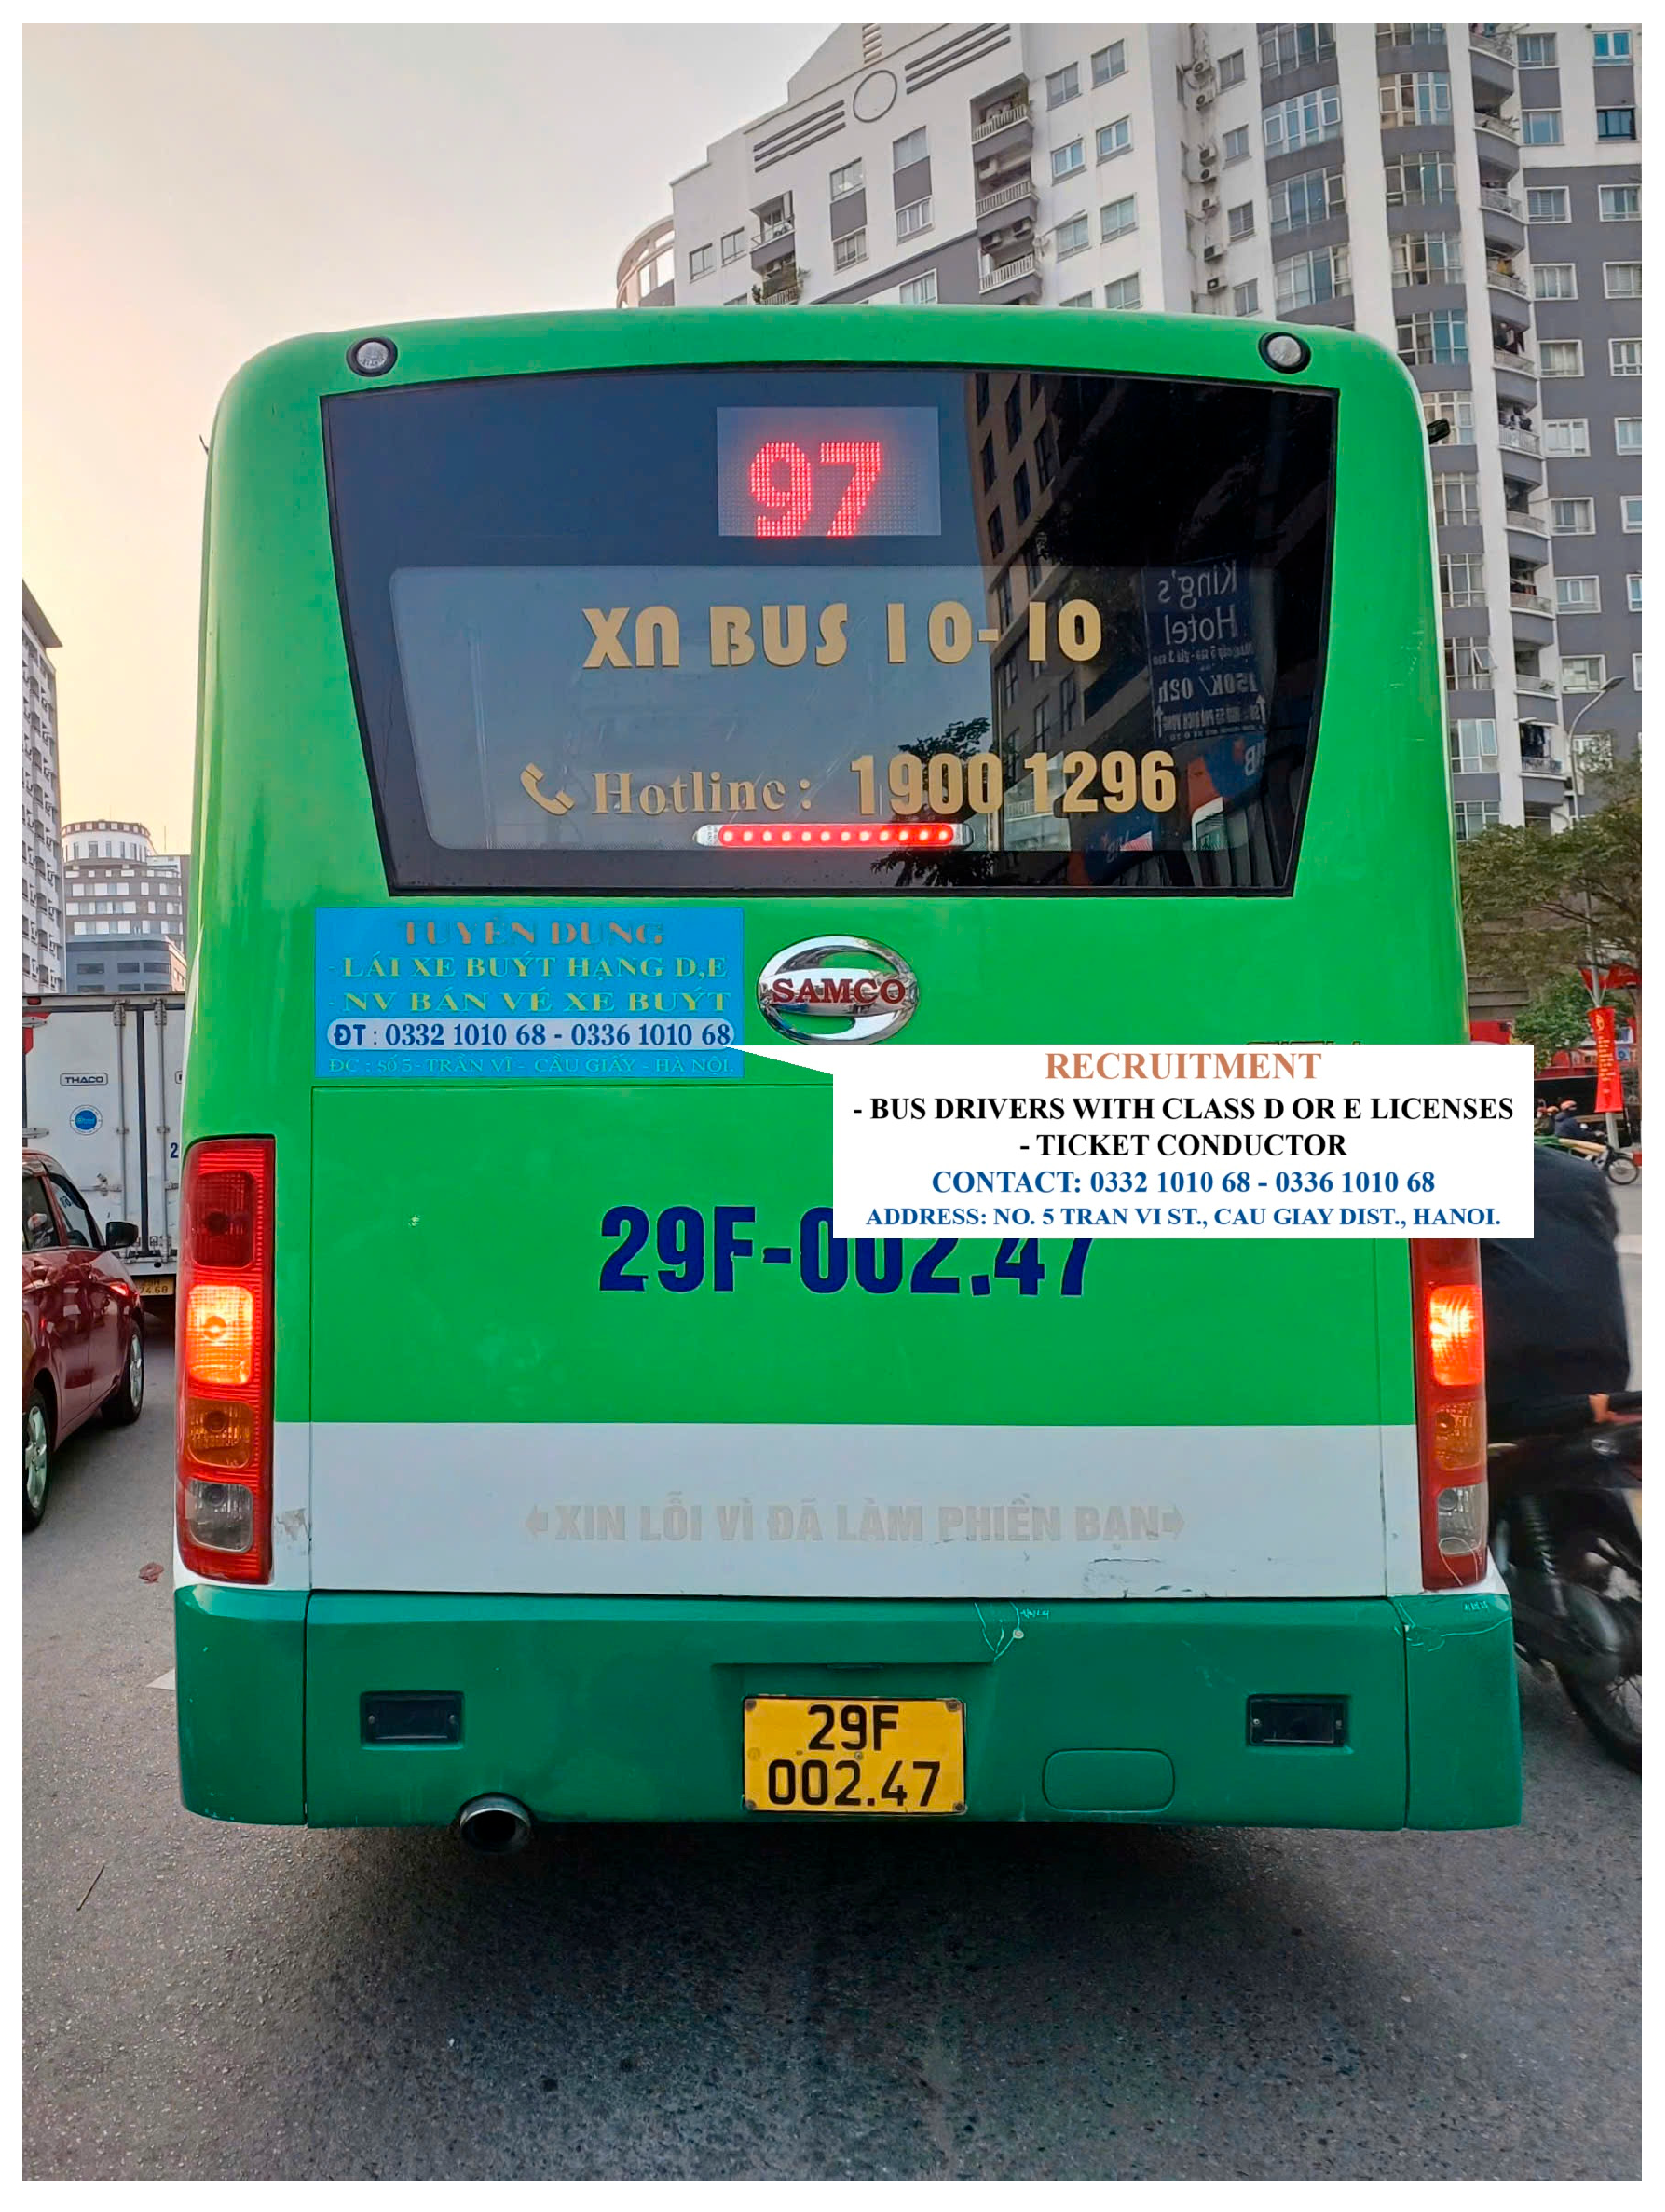
3.1. Research Setting

Hanoi is the capital of Vietnam and home to about 8.4 million people in an area of 3.35982 km2. The Hanoi public transport relies on the bus services that serve approximately 8% of daily travel demand, while the split of the whole public transport (i.e., the bus, one metro line, and one BRT corridor) is just under 10% [49]. Thanks to the local government’s subsidies, the Hanoi public transport system is Vietnam’s most developed and best organized. Table 1 shows the growth and fluctuations in Hanoi’s bus system between 2013 and 2023. The number of bus routes has steadily increased from 70 in 2013 to 132 in 2022 and 2023. This indicates an expansion of the bus network to cover more areas and serve a larger population. The current bus network has reached the following [50]:
  • 100% district coverage: 30 out of 30 districts, counties, and towns (100%);
  • 88.4% commune coverage: 512 out of 579 communes, wards, and townships (an increase of two communes compared to 2021);
  • 87% hospital coverage: 65 out of 75 hospitals;
  • 67% education coverage: 192 out of 286 universities, colleges, and high schools;
  • 100% industrial zone coverage: 27 out of 27 major industrial zones;
  • 89.2% urban area coverage: 33 out of 37 urban areas;
  • 95.8% craft village coverage: 23 out of 24 craft villages;
  • 92% cultural and tourism site coverage: 23 out of 25 historical and cultural relic sites and tourist areas.
The number of buses has also grown significantly, from 1189 in 2013 to 2024 in 2023. This reflects efforts to increase capacity and improve service frequency. Ridership peaked in 2014 at 463.5 million passengers. There was a noticeable decline in ridership between 2015 and 2017 due to an increased private vehicle ownership and growth in income among residents. Ridership dropped sharply in 2020 and 2021, likely due to the COVID-19 pandemic and associated restrictions. It has been recovering since 2022, although it has not yet reached pre-pandemic levels. Despite fluctuations, the Hanoi bus system has generally experienced growth in terms of routes, fleet size, and ridership over the past decade. Notwithstanding, the system has faced challenges in maintaining consistent ridership growth through improve service quality.
Currently, there are 4405 bus stops in the city, of which 1135 stops are located in the inner city (25.8%), and 3270 stops are in the suburbs (74.2%). There are 351 bus stops equipped with shelters (7.9%). In addition, there are 5 transfer hubs and 127 terminal points [50].
The Hanoi bus industry has 11 companies; the Hanoi Transportation Corporation (TRANSCO) is the largest operator. It is a state-owned enterprise that includes seven factories and is responsible for nearly half of the network (68/132 routes), 51% of the total number of buses, 56% of the length of the total bus routes, and about 45% of bus ridership. All of TRANSERCO’s buses use internal combustion engines [50].
TRANSERCO and other companies have confronted the serious matter of driver shortage (Figure 2). As an illustration, according to TRANSERCO, over 55% of canceled trips come from a lack of drivers, and the decrease in the number of driver has remained stable since 2020. Most existing studies on the bus sector in Vietnam are set in Hanoi [41,51,52,53,54,55,56,57,58]; therefore, the selection of Hanoi for the current study is reasonable. The bus routes operated by TRANSERCO are diverse, including newly launched routes and those that have been in operation for many years. As such, the findings from TRANSERCO’s routes can represent Hanoi’s bus network.

3.2. Data Collection

For collecting the data for testing the proposed theoretical framework, a structured questionnaire was developed with the following parts.
  • Part 1 offered the survey’s purpose and scope. Drivers were instructed that they should take part in the survey once and were requested to give signed consent before entering the next sections;
  • Part 2 comprised questions related to the drivers’ age, educational degree, monthly income, driving experience, and the types of routes on which respondents were working;
  • Part 3 included 25 attitudinal statements regarding drivers’ perceptions (i.e., cabin-related pressure, road- and traffic-related pressure, weather-related pressure, schedule-related pressure, vehicle-related pressure, supervisor support, co-worker support, rewards, and turnover intention) measured using a 5-point Likert scale, ranging from 1 (strongly disagree) to 5 (strongly agree) (Table 2).
After initially being developed in English, it was translated into Vietnamese and underwent review and revisions based on comments from three transportation researchers at University of Transport and Communications. Then, pilot surveys were carried out with five drivers to finalize the questionnaire that was used for the large-scale survey.
The data collection process was undertaken in March 2024 across 68 subsidized bus routes operated by TRANSERCO. We hired five students to collect the data. Interviews with the bus drivers were carried out during their breaks between shifts during off-peak hours. Each driver was only allowed to participate in the survey once. The completion of an interview was appreciated with an incentive of USD 1 for each respondent. The number of drivers asked for each route was at least 5 but not more than 10 to avoid a bias towards some routes.
Finally, 428 responses were successfully gathered and deemed eligible for further analysis. The utilized sample comprised drivers on all routes of TRANSERCO. Table 3 provides a useful snapshot of the demographics of bus drivers in Hanoi. The largest group of drivers (53.04%) fell within the 26–45-year age range. A smaller proportion of drivers were under 26 (29.91%) or above 45 years old (17.06%). A significant majority of drivers (79.21%) did not hold a university degree. The majority of drivers (65.65%) earned below VND 15 million per month, suggesting that bus driving may not be a high-paying profession in Hanoi. The data also indicated a mix of experience levels, with 22.66% having less than 2 years of experience and 36.45% having 2–5 years of experience. A marked portion of drivers had considerable experience, with 40.89% having driven for more than 5 years. Over a quarter (26.17%) of the driver sample operated on urban routes (i.e., the entire route lies within urban districts).

3.3. Analytical Methods

Because this research takes both observable (e.g., demographic factors) and unobservable variables (e.g., drivers’ perceptions) into consideration, exploratory factor analysis (EFA) was run to derive the underlying factors from items [67,68]. Principal component analysis with eigenvalue > 1 was selected to determine the number of retained factors. Any factors with eigenvalues less than one were disregarded since they explained less variance than a single variable. Rotation was utilized to make the structure of factors more interpretable through simplifying the pattern of factor loadings. The oblimin rotation with the Kaiser normalization was applied. The oblimin rotation, an oblique rotation method allowing factors to be correlated with one another, enables a more interpretable solution [69]. Some criteria were considered to evaluate EFA’s results, including the Kaiser–Meyer–Olkin (KMO) measure of sampling adequacy and the Bartlett’s test of sphericity [70]. The KMO statistic measures the adequacy of the utilized data for factor analysis. Its values range between 0 and 1, with values closer to 1 suggesting that factor analysis is more appropriate because the items are more inter-correlated. The recommended threshold is 0.7. The Bartlett’s test of sphericity checks the null hypothesis that the correlation matrix is an identity matrix (i.e., no relationships between items). A significant p-value of less than 0.05 suggests that the null hypothesis is rejected. As such, there are significant correlations between items. Thus, factor analysis is suitable for the considered data. The explained variance of found factors should be at least 50%, and the factor loading values should be over 0.7 [71].
The extracted factors were subsequently incorporated into a linear model with the following specific parameters:
-
Dependent variable: Turnover intention extracted from items using the EFA technique and treated as a continuous variable. The use of other logit methods such as logit regression was impossible, as there was no sound way of converting items of intention measurement into a binary one;
-
Independent variables: Observable variables treated as nominal ones and latent variables extracted from items using the EFA technique and treated as continuous variables.
Because EFA and linear regression are basic and widely used techniques, we do not provide a detailed description of these methods, but they can be found in the previous research [72]. All statistical computations were performed using STATA 15.0.

4. Results and Discussion

4.1. Results of Exploratory Factor Analysis

Table 4 presents the results of the EFA. The first run of the EFA was related to organizational and work-specific factors, while the second was related to turnover intention indicators. For the first run, the six factors were retained with all their items’ factor loadings of over 0.7. These underlying constructs were named as follows:
(1)
Pressure of cabin and vehicle;
(2)
Pressure of schedule;
(3)
Pressure of road and traffic;
(4)
Pressure of weather;
(5)
Organizational support;
(6)
Rewards.
The six extracted factors explained 64.69% of the variance in the data. The statistical significance of Bartlett’s test of sphericity suggested sufficient inter-correlations among the existing items. The KMO value of 0.7654 reached a mediocre level. Accordingly, utilization of the EFA was deemed suitable.
For the second run, as expected, one construct (i.e., turnover intention) was found from three items. All of the criteria were met, confirming the reliability of the derived factor.

4.2. Factors Associated with Turnover Intention Among Bus Drivers

The linear regression model suggested that its predictors accounted for 58.6% of the turnover intention data. This level of adjusted coefficient determination implied an acceptable prediction capacity of the estimated model. The estimated values of the variance inflation factor, which is used to detect the severity of multi-collinearity, all were below 2, suggesting the mitigation of the multi-collinearity risk [73].
As can be seen in Table 5, the oldest group (β = 0.337, p = 0.000) was more inclined to have a higher turnover intention compared to the youngest one. While the educational level and monthly income were irrelevant factors, the driving experience was significantly associated with the intention. Specifically, those with the most experience (>5 years) (β = 0.122, p = 0.034) had a higher likelihood of possessing greater intention to quit. Drivers working non-urban routes (β = −0.155, p = 0.085) were less likely to be intent to quit their job, albeit with a weak significance level (90%). All four pressure types (pressure of cabin and vehicle (β = 0.189, p = 0.004), pressure of schedule (β = 0.368, p = 0.000), pressure of road and traffic (β = 0.329, p = 0.004), and pressure of weather (β = 0.147, p = 0.010)) were found to contribute to the intention to stop driving buses, whereas rewards (β = −0.153, p = 0.004) and organizational support (β = −0.125, p = 0.009) played roles in relieving the intention.

4.3. Discussion

The literature teaches us that lower turnover intention is usually shown in older staff [24,47,74]. Notwithstanding, the findings of the present paper suggest that greater intention to leave their driving occupation was attached to drivers above 45 years old (β = 0.337, p = 0.000). It can be explained that drivers at a higher age perhaps experienced prolonged physical comfort and fatigue, thus having occupational diseases [75]. As well as this, the capacity of identifying and responding to situations on the road may be significantly reduced, causing more perception of safety risk [76]. Another possible explanation is the burden of applying information and communication technologies in the Hanoi bus industry. The Department of Hanoi Transportation (DOT) has set a detailed timeline for integrating new technologies (e.g., digital ticketing system and removal of ticket conductors, management, and supervision based on real-time information) between 2024 and 2025. As such, older drivers who may find it more difficult to keep up with and adapt to these changes may think more about quitting [77]. Additionally, financial burdens are often lessened for drivers at this age range; therefore, finding another job with less income and less pressure would be a nice choice for them.
Greater intention to have another job was found for the respondents who drove a bus for more than five years (β = 0.122, p = 0.034). This is bad news for TRANSERCO due to the possibility of losing their most experienced drivers. A possible explanation is that drivers with much experience become much more familiar with the transport conditions in Hanoi. Thus, they may desire to find a driving job with less pressure and possibly earn more money, such as ride-hailing services. Another probable reason may be the increased financial demand for well-experienced drivers (but not very old), leading to thoughts about other job (driving) opportunities. It is important to note that the difference in income between drivers in Hanoi relies mainly upon the types of bus capacities rather than the number of years of driving experience.
In line with a great deal of extant research confirming the contributions of working pressures on adverse outcomes [38,78,79], the four pressure factors were found to trigger the turnover intention among bus drivers. Interestingly, previous bus-related studies have suggested drivers’ harmful activities, such as aberrant driving behaviors, crash involvement, and impolite behaviors against passengers, but not their intention to quit. As such, our study extended the knowledge of the impacts of pressures on drivers’ actions. Among pressure types, those stemming from schedule and road/traffic were the most significant factors because bus drivers’ schedules are tight and strict. It is important to note that the schedule is defined when the company wins the bid for the right of a route operation. Following the schedule is a base for the DOT to evaluate the performance of companies and give subsidies. Companies cannot change the schedules by themselves; instead, they need to submit the changes and wait for the approval of the DOT. The schedule-specific strain becomes more and more serious due to the lack of drivers. The pressures of the road and of traffic exacerbate the pressure of schedule since traffic has increased, leading to a decreased traffic speed and thus a higher risk of arriving later than the timetable demands. Unfortunately, there is no solution to handle the pressure of roads and traffic. So far, Hanoi has only 12.9 km of bus lanes (12.6 km for BRT lanes and 0.3 km within the Long Bien transfer point). The pressure of the cabin and vehicle was found to be not as high as the two aforementioned pressures, possibly because the buses in TRANSERCO are maintained daily. Thus, their technical status is reasonable. Moreover, the average age of TRANSERCO’s fleet is about 4 years—younger than the average figure for all buses in Hanoi (approximately 5 years). There was an interesting finding related to the significant effect of weather-involved pressure. Prior studies indicated changes in temperature as a source of stressor for bus drivers; however, this is among only a few pieces of evidence to validate that statement [59]. It can be explained that the differences in temperature between summer and winter in Hanoi are substantial. Vehicles do not have a warming system, leading to the greatly unpleasant effect of cold temperatures (10–15 °C) on drivers.
The operational scope was found to be significant in terms of predicting turnover intention among Hanoi bus drivers. The road- and traffic-based pressure in urban districts would be more significant than that in non-urban areas because of the high traffic volume in the former. However, the significance level of the results for the route type was only weak (β = −0.155, p = 0.085). This may be owing to the fact that the pressure of the road and of traffic outweighed the effect exerted by the variable of route types.
The current study also found less turnover intention in parallel with more organizational support and rewards. Some previous research has reported the contributing effects of the support from supervisors and co-workers and rewards on the prevention of negative organizational outcomes among commercial riders or drivers [64,74,80,81]. The proper and timely support and appreciation of work can reduce prolonged stress and make missions less challenging. Employees may perceive a more supportive and friendly working environment, leading to more organizational commitment [35].

4.4. Policy Suggestions

The results of the influential factors lead to the suggestion of some policies to address the turnover challenges among drivers of city buses in developing countries. More focus on managerial implications should be placed on drivers aged over 45, those working more than 5 years, and those on urban routes. Managers may offer them more rewards and assistance. Changes in the routes would be advisable. After a long time (e.g., 3 years) working on urban routes, drivers should be offered an opportunity to shift to non-urban ones. Old drivers should not be placed on urban routes.
Bus enterprises should offer more supervisor support by creating an environment that actively listens to drivers’ concerns and promptly provides constructive feedback and assistance. Treating all drivers fairly and with respect is recommended. Managers also need to ensure the consistent application of rules and policies and encourage drivers’ (greater) involvement in decision-making processes that influence them.
Companies may provide more opportunities for professional growth among drivers through training programs, mentorship, and skill development initiatives. For enhancing the support among drivers, companies should have a role in organizing social events, team-building activities, and peer-to-peer recognition programs wherein drivers can acknowledge and appreciate each other’s contributions. It would be helpful to officially create online forums or groups where drivers can connect, communicate, and support each other.
Improving the perceived rewards among drivers is vital to retaining them. Companies may need to take action to ensure that drivers are paid fairly and receive competitive benefits packages (i.e., retirement plans, health insurance, and paid time off). Additionally, the implementation of performance-based bonus programs, rewards for safe driving, fuel efficiency, and customer satisfaction is needed. We recommend the use of estimating salary based on time and task simultaneously. Acknowledging and appreciating drivers’ efforts through public recognition, certificates of achievement, and personalized thank-you notes are promising solutions to enhance their perception of rewards.

5. Conclusions

The lack of drivers is a significant challenge to the bus industry in megacities of developing countries. The current study investigated the influential factors of drivers’ intention to quit in Hanoi as a case study. The results highlighted that drivers aged over 55 were more likely to have higher turnover intention. A worrying finding was that the most experienced drivers (>5 years) were more inclined to think about stopping driving buses. The respondents working in routes lying entirely in urban districts were more likely to quit their job, albeit with a weak significance level (90%). All four pressure types (i.e., traffic and road, schedule, cabin and vehicle, and weather) were found to contribute to the turnover intention. The facilitating effects of pressures related to schedule and road/traffic were much larger than those of the remaining pressures. Rewards and organizational support were found to play a role in relieving the intention. The present research is valuable to the literature, as it is one of the first investigations of the intention to stop working among bus drivers in emerging countries. Based on the findings of influential factors, managerial policies were proposed. The managerial implications proposed based on the quantitative empirical findings of influential factors can be useful for workforce management in the bus industry sector of developing countries.
The research is prone to some limitations. The collected data encompassed nearly half of the Hanoi bus routes, resulting in a diverse and large sample. Nevertheless, the sample cannot entirely represent the population of bus drivers in Hanoi, limiting the results’ generalization. For each route we only surveyed 5–10 drivers of over 20–30 drivers per route; therefore, as a comment from the reviewer, there would be a risk that those interviewed could not be all drivers working on a route. Additionally, the current paper only considered some variables previously demonstrated to be predictors of turnover intentions; meanwhile, some, such as personal demands and personal resources, were neglected [63,82]. The Hanoi bus has distinct characteristics that limit the applicable boundary of the findings. Companies have received financial assistance from the local government, and daily mobility is dominated by motorcycles [83,84,85]. Taken together, it is critical to replicate the current research in other areas with an improvement of the research model and data collection strategy to enrich the understanding of the antecedents of the intention to quit among bus drivers. As recommended by a reviewer, conducting quantitative studies to identify a comprehensive set of potential factors, particularly hidden ones in the existing knowledge, is necessary.

Funding

This research is funded by University of Transport and Communications (UTC) under grant number T2024-KT-009.

Institutional Review Board Statement

The need for Ethical Approval was waived off by the Ethical Committee of University of Transport and Communications (Vietnam) because the nature of the study of adults’ working conditions is not related to a significant risk of harming human rights.

Informed Consent Statement

Informed consent was obtained from all subjects involved in the study.

Data Availability Statement

No new data were created or analyzed in this study. Data sharing is not applicable to this article.

Conflicts of Interest

The author declares no conflicts of interest.

Abbreviations

The following abbreviations are used in this manuscript:
EFAExploratory factor analysis
TRANSERCOHanoi Transportation Corporation
DOTDepartment of Hanoi Transportation
KMOKaiser–Meyer–Olkin
VNDVietnam dong

References

  1. Alkahtani, A.H. Investigating Factors That Influence Employees’ Turnover Intention: A Review of Existing Empirical Works. Int. J. Bus. Manag. 2015, 10, 152. [Google Scholar] [CrossRef]
  2. Nguyen, M.H.; Pojani, D.; Nguyen-Phuoc, D.Q.; Nguyen Thi, B. What If Delivery Riders Quit? Challenges to Last-Mile Logistics during the COVID-19 Pandemic. Res. Transp. Bus. Manag. 2022, 47, 100941. [Google Scholar] [CrossRef] [PubMed]
  3. Heavey, A.L.; Holwerda, J.A.; Hausknecht, J.P. Causes and Consequences of Collective Turnover: A Meta-Analytic Review. J. Appl. Psychol. 2013, 98, 412–453. [Google Scholar] [CrossRef] [PubMed]
  4. Bigliardi, B.; Petroni, A.; Ivo Dormio, A. Organizational Socialization, Career Aspirations and Turnover Intentions among Design Engineers. Leadersh. Org. Dev. J. 2005, 26, 424–441. [Google Scholar] [CrossRef]
  5. Mobley, W.H.; Griffeth, R.W.; Hand, H.H.; Meglino, B.M. Review and Conceptual Analysis of the Employee Turnover Process. Psychol. Bull. 1979, 86, 493–522. [Google Scholar] [CrossRef]
  6. Cohen, G.; Blake, R.S.; Goodman, D. Does Turnover Intention Matter? Evaluating the Usefulness of Turnover Intention Rate as a Predictor of Actual Turnover Rate. Rev. Public Pers. Adm. 2016, 36, 240–263. [Google Scholar] [CrossRef]
  7. Tett, R.P.; Meyer, J.P. Job Satisfaction, Organizational Commitment, Turnover Intention, and Turnover: Path Analyses Based on Meta-Analytic Findings. Pers. Psychol. 1993, 46, 259–293. [Google Scholar] [CrossRef]
  8. de Moura, G.R.; Abrams, D.; Retter, C.; Gunnarsdottir, S.; Ando, K. Identification as an Organizational Anchor: How Identification and Job Satisfaction Combine to Predict Turnover Intention. Eur. J. Soc. Psychol. 2009, 39, 540–557. [Google Scholar] [CrossRef]
  9. Hurley, R.F.; Estelami, H. An Exploratory Study of Employee Turnover Indicators as Predictors of Customer Satisfaction. J. Serv. Mark. 2007, 21, 186–199. [Google Scholar] [CrossRef]
  10. Holtom, B.C.; Burch, T.C. A Model of Turnover-Based Disruption in Customer Services. Hum. Resour. Manag. Rev. 2016, 26, 25–36. [Google Scholar] [CrossRef]
  11. Li, R.; Yao, M. What Promotes Teachers’ Turnover Intention? Evidence from a Meta-Analysis. Educ. Res. Rev. 2022, 37, 100477. [Google Scholar] [CrossRef]
  12. Calisir, F.; Gumussoy, C.A.; Iskin, I. Factors Affecting Intention to Quit among IT Professionals in Turkey. Pers. Rev. 2011, 40, 514–533. [Google Scholar] [CrossRef]
  13. Carmeli, A.; Weisberg, J. Exploring Turnover Intentions among Three Professional Groups of Employees. Hum. Resour. Dev. Int. 2006, 9, 191–206. [Google Scholar] [CrossRef]
  14. Cho, Y.J.; Lewis, G.B. Turnover Intention and Turnover Behavior: Implications for Retaining Federal Employees. Rev. Public Pers. Adm. 2012, 32, 4–23. [Google Scholar] [CrossRef]
  15. Park, J.; Min, H. (Kelly) Turnover Intention in the Hospitality Industry: A Meta-Analysis. Int. J. Hosp. Manag. 2020, 90, 102599. [Google Scholar] [CrossRef]
  16. Räsänen, K.; Pietarinen, J.; Pyhältö, K.; Soini, T.; Väisänen, P. Why Leave the Teaching Profession? A Longitudinal Approach to the Prevalence and Persistence of Teacher Turnover Intentions. Soc. Psychol. Educ. 2020, 23, 837–859. [Google Scholar] [CrossRef]
  17. Seston, E.; Hassell, K.; Ferguson, J.; Hann, M. Exploring the Relationship between Pharmacists’ Job Satisfaction, Intention to Quit the Profession, and Actual Quitting. Res. Soc. Adm. Pharm. 2009, 5, 121–132. [Google Scholar] [CrossRef]
  18. Wu, W.; Rafiq, M.; Chin, T. Employee Well-Being and Turnover Intention: Evidence from a Developing Country with Muslim Culture. Career Dev. Int. 2017, 22, 797–815. [Google Scholar] [CrossRef]
  19. Zarei, E.; Nikkhah, A.; Farrokhi, P. Factors Influencing Healthcare Workers’ Intention to Leave during COVID-19: A Systematic Review in Middle- and Low-Income Countries. Int. J. Healthc. Manag. 2024, 1–12. [Google Scholar] [CrossRef]
  20. Cantor, D.E.; Macdonald, J.R.; Crum, M.R. The Influence of Workplace Justice Perceptions on Commercial Driver Turnover Intentions. J. Bus. Logist. 2011, 32, 274–286. [Google Scholar] [CrossRef]
  21. Hoang, A.-D. Pandemic and Teacher Retention: Empirical Evidence from Expat Teachers in Southeast Asia during COVID-19. Int. J. Sociol. Soc. Policy 2020, 40, 1141–1166. [Google Scholar] [CrossRef]
  22. Takase, M. A Concept Analysis of Turnover Intention: Implications for Nursing Management. Collegian 2010, 17, 3–12. [Google Scholar] [CrossRef] [PubMed]
  23. Tzeng, H.-M. The Influence of Nurses’ Working Motivation and Job Satisfaction on Intention to Quit: An Empirical Investigation in Taiwan. Int. J. Nurs. Stud. 2002, 39, 867–878. [Google Scholar] [CrossRef]
  24. Manlove, E.E.; Guzell, J.R. Intention to Leave, Anticipated Reasons for Leaving, and 12-Month Turnover of Child Care Center Staff. Early Child. Res. Q. 1997, 12, 145–167. [Google Scholar] [CrossRef]
  25. Brunetto, Y.; Rodwell, J.; Shacklock, K.; Farr-Wharton, R.; Demir, D. The Impact of Individual and Organizational Resources on Nurse Outcomes and Intent to Quit. J. Adv. Nurs. 2016, 72, 3093–3103. [Google Scholar] [CrossRef]
  26. Masum, A.K.M.; Azad, M.A.K.; Hoque, K.E.; Beh, L.-S.; Wanke, P.; Arslan, Ö. Job Satisfaction and Intention to Quit: An Empirical Analysis of Nurses in Turkey. PeerJ 2016, 4, e1896. [Google Scholar] [CrossRef]
  27. LeMay, S.; Keller, S.B. Fifty Years inside the Minds of Truck Drivers. Int. J. Phys. Distrib. Logist. Manag. 2019, 49, 626–643. [Google Scholar] [CrossRef]
  28. Paillé, P.; Fournier, P.; Lamontagne, S. Relationships between Commitments to the Organization, the Superior and the Colleagues, and the Intention to Leave among Truckers. Int. J. Organ. Anal. 2011, 19, 92–108. [Google Scholar] [CrossRef]
  29. Swartz, S.M.; Douglas, M.A.; Roberts, M.D.; Overstreet, R.E. Leavin’ on My Mind: Influence of Safety Climate on Truck Drivers’ Job Attitudes and Intentions to Leave. Transp. J. 2017, 56, 184–209. [Google Scholar] [CrossRef]
  30. LeMay, S.A.; Johnson, L.; Williams, Z.; Garver, M. The Causes of Truck Driver Intent-to-quit: A Best-fit Regression Model. Int. J. Commer. Manag. 2013, 23, 262–272. [Google Scholar] [CrossRef]
  31. Lemay, S.A.; Taylor, G.S.; Turner, G.B. Driver Turnover and Management Policy: A Survey of Truckload Irregular Route Motor Carriers. Transp. J. 1993, 33, 15–21. [Google Scholar]
  32. Bujold, A.; Parent-Rocheleau, X.; Gaudet, M.-C. Opacity behind the Wheel: The Relationship between Transparency of Algorithmic Management, Justice Perception, and Intention to Quit among Truck Drivers. Comput. Hum. Behav. Rep. 2022, 8, 100245. [Google Scholar] [CrossRef]
  33. Tanning, T.; Tanning, L. The Turnover of Transportation Companies in the European Countries of the Former Eastern Bloc before and after the Economic Crisis. TEM J. 2013, 2, 253–260. [Google Scholar] [CrossRef]
  34. Lannoo, S.; Verhofstadt, E. What Drives the Drivers? Predicting Turnover Intentions in the Belgian Bus and Coach Industry. Transp. Res. Part. A Policy Pract. 2016, 91, 251–259. [Google Scholar] [CrossRef]
  35. Chen, C.-F.; Hsu, Y.-C. Taking a Closer Look at Bus Driver Emotional Exhaustion and Well-Being: Evidence from Taiwanese Urban Bus Drivers. Saf. Health Work 2020, 11, 353–360. [Google Scholar] [CrossRef]
  36. Schwei, R.J.; Hetzel, S.; Kim, K.; Mahoney, J.; DeYoung, K.; Frumer, J.; Lanzafame, R.P.; Madlof, J.; Simpson, A.; Zambrano-Morales, E.; et al. Peer-to-Peer Support and Changes in Health and Well-Being in Older Adults Over Time. JAMA Netw. Open 2021, 4, e2112441. [Google Scholar] [CrossRef]
  37. Kim, D.; Moon, C.W.; Shin, J. Linkages between Empowering Leadership and Subjective Well-Being and Work Performance via Perceived Organizational and Co-Worker Support. Leadersh. Organ. Dev. J. 2018, 39, 844–858. [Google Scholar] [CrossRef]
  38. Batool, Z.; Younis, M.W.; Yasir, A.; Rehman, A.U.; Dilawar, M.; Yasin, M.; Hamza, M.; Shahzad, S.; Ali, M.S.; Jamil, A.; et al. Effects of Safety Pattern, Cabin Ergonomics, and Sleep on Work-Related Stress and Burnout of City and Transit Bus Drivers in Lahore, Pakistan. Ergonomics 2022, 65, 704–718. [Google Scholar] [CrossRef]
  39. Mallia, L.; Lazuras, L.; Violani, C.; Lucidi, F. Crash Risk and Aberrant Driving Behaviors among Bus Drivers: The Role of Personality and Attitudes towards Traffic Safety. Accid. Anal. Prev. 2015, 79, 145–151. [Google Scholar] [CrossRef]
  40. Tse, J.L.M.; Flin, R.; Mearns, K. Bus Driver Well-Being Review: 50 Years of Research. Transp. Res. Part F Traffic Psychol. Behav. 2006, 9, 89–114. [Google Scholar] [CrossRef]
  41. Van-Huy, V.; Hoang-Tung, N.; Kubota, H. Effects of Mixed Traffic Flow and Time Pressure on Violated Driving Behaviors of Bus Drivers. Ergonomics 2024, 67, 1958–1979. [Google Scholar] [CrossRef] [PubMed]
  42. Useche, S.A.; Gómez, V.; Cendales, B.; Alonso, F. Working Conditions, Job Strain, and Traffic Safety among Three Groups of Public Transport Drivers. Saf. Health Work 2018, 9, 454–461. [Google Scholar] [CrossRef] [PubMed]
  43. af Wåhlberg, A.E. Characteristics of Low Speed Accidents with Buses in Public Transport. Accid. Anal. Prev. 2002, 34, 637–647. [Google Scholar] [CrossRef]
  44. Feng, S.; Li, Z.; Ci, Y.; Zhang, G. Risk Factors Affecting Fatal Bus Accident Severity: Their Impact on Different Types of Bus Drivers. Accid. Anal. Prev. 2016, 86, 29–39. [Google Scholar] [CrossRef]
  45. Kompier, M.A.J.; Di Martino, V. Review of Bus Drivers’ Occupational Stress and Stress Prevention. Stress Med. 1995, 11, 253–262. [Google Scholar] [CrossRef]
  46. Vu Thi, H.; Nguyen Thanh, C.; Vu Trong, T. Analysis of Factors Affecting Vehicle Choice Behavior in Hanoi City. Tạp chí Khoa học Giao thông vận tải 2024, 75, 1125–1139. [Google Scholar] [CrossRef]
  47. Fakunmoju, S.; Woodruff, K.; Kim, H.H.; LeFevre, A.; Hong, M. Intention to Leave a Job: The Role of Individual Factors, Job Tension, and Supervisory Support. Adm. Soc. Work 2010, 34, 313–328. [Google Scholar] [CrossRef]
  48. Todd, C.M.; Deery-Schmitt, D.M. Factors Affecting Turnover among Family Child Care Providers: A Longitudinal Study. Early Child. Res. Q. 1996, 11, 351–376. [Google Scholar] [CrossRef]
  49. Nguyen, M.H.; Ha, T.T.; Tu, S.S.; Nguyen, T.C. Impediments to the Bus Rapid Transit Implementation in Developing Countries—A Typical Evidence from Hanoi. Int. J. Urban Sci. 2019, 4, 464–483. [Google Scholar] [CrossRef]
  50. Department for Transport. Restructuring the Hanoi Bus Network During the Period Between 2023–2030 and the Vision Towards 2045; Department of Transport: Hanoi, Vietnam, 2024.
  51. Nguyen, T.C.; Nguyen, M.H.; Armoogum, J.; Ha, T.T. Bus Crash Severity in Hanoi, Vietnam. Safety 2021, 7, 65. [Google Scholar] [CrossRef]
  52. Nguyen, M.H.; Pojani, D. Why Are Hanoi Students Giving up on Bus Ridership? Transportation 2022, 50, 811. [Google Scholar] [CrossRef] [PubMed]
  53. Nguyen, M.H.; Pojani, D. Can Electric Buses Entice More Public Transport Use? Empirical Evidence from Vietnam. Case Stud. Transp. Policy 2023, 13, 101040. [Google Scholar] [CrossRef]
  54. Nguyen, M.H.; Pojani, D. COVID-19 Need Not Spell the Death of Public Transport: Learning from Hanoi’s Safety Measures. J. Transp. Health 2021, 23, 101279. [Google Scholar] [CrossRef] [PubMed]
  55. Nguyen, M.H.; Pojani, D. Chapter Two—Why Do Some BRT Systems in the Global South Fail to Perform or Expand? In Preparing for the New Era of Transport Policies: Learning from Experience; Shiftan, Y., Kamargianni, M., Eds.; Advances in Transport Policy and Planning; Academic Press: Cambridge, MA, USA, 2018; Volume 1, pp. 35–61. [Google Scholar]
  56. Nguyen, M.H. Evaluating the Service Quality of the First Bus Rapid Transit Corridor in Hanoi City and Policy Implications. In Proceedings of the International Conference on Innovations for Sustainable and Responsible Mining, Hanoi, Vietnam, 15–17 October 2020; Tien Bui, D., Tran, H.T., Bui, X.-N., Eds.; Springer International Publishing: Cham, Switzerland, 2020; pp. 98–123. [Google Scholar]
  57. Nguyen, M.H.; Pojani, D. The Effect of Fuel Price Fluctuations on Utilitarian Cycling Rates: A Survey of Cyclists in Vietnam. J. Transp. Geogr. 2024, 115, 103793. [Google Scholar] [CrossRef]
  58. Nguyen, M.H.; Pojani, D.; Nguyen-Phuoc, D.Q. The Future of Personal Electric Mobility in Emerging Economies: A Survey of e-Moto Users in Vietnam. Res. Transp. Bus. Manag. 2024, 57, 101227. [Google Scholar] [CrossRef]
  59. Tse, J.L.M.; Flin, R.; Mearns, K. Facets of Job Effort in Bus Driver Health: Deconstructing “Effort” in the Effort-Reward Imbalance Model. J. Occup. Health Psychol. 2007, 12, 48–62. [Google Scholar] [CrossRef]
  60. Wang, L.; Wang, Y.; Shi, L.; Xu, H. Analysis of Risky Driving Behaviors among Bus Drivers in China: The Role of Enterprise Management, External Environment and Attitudes towards Traffic Safety. Accid. Anal. Prev. 2022, 168, 106589. [Google Scholar] [CrossRef]
  61. Quy Nguyen-Phuoc, D.; Ngoc Thi Nguyen, L.; Ngoc Su, D.; Nguyen, M.H.; Oviedo-Trespalacios, O. Deadly Meals: The Influence of Personal and Job Factors on Burnout and Risky Riding Behaviours of Food Delivery Motorcyclists. Saf. Sci. 2023, 159, 106007. [Google Scholar] [CrossRef]
  62. Caird, J.; Kline, T. The Relationships between Organizational and Individual Variables to On-the-Job Driver Accidents and Accident-Free Kilometres. Ergonomics 2004, 47, 1598–1613. [Google Scholar] [CrossRef]
  63. Kao, Y.-L. Applying the Job Demands-Resources Model to Reduce the Aberrant Behavior of Bus Drivers: Let Them Play a Good Social Role. J. Transp. Health 2023, 33, 101711. [Google Scholar] [CrossRef]
  64. Rosenbloom, T. Job Burnout, Effort-Reward Imbalance and Time Pressure as Predictors of Safety among Military Truck Drivers. J. Transp. Health 2022, 24, 101248. [Google Scholar] [CrossRef]
  65. Laczo, R.M.; Hanisch, K.A. An Examination of Behavioral Families of Organizational Withdrawal in Volunteer Workers and Paid Employees. Hum. Resour. Manag. Rev. 1999, 9, 453–477. [Google Scholar] [CrossRef]
  66. Mor Barak, M.E.; Nissly, J.A.; Levin, A. Antecedents to Retention and Turnover among Child Welfare, Social Work, and Other Human Service Employees: What Can We Learn from Past Research? A Review and Metanalysis. Soc. Serv. Rev. 2001, 75, 625–661. [Google Scholar] [CrossRef]
  67. Nguyen, M.H. Factors Influencing Home-Based Telework in Hanoi (Vietnam) during and after the COVID-19 Era. Transportation 2021, 48, 3207–3238. [Google Scholar] [CrossRef]
  68. Nguyen, M.H.; Armoogum, J. Perception and Preference for Home-Based Telework in the COVID-19 Era: A Gender-Based Analysis in Hanoi, Vietnam. Sustainability 2021, 13, 3179. [Google Scholar] [CrossRef]
  69. Williams, B.; Onsman, A.; Brown, T. Exploratory Factor Analysis: A Five-Step Guide for Novices. Australas. J. Paramed. 2010, 8, 1–13. [Google Scholar] [CrossRef]
  70. Cudeck, R. 10—Exploratory Factor Analysis. In Handbook of Applied Multivariate Statistics and Mathematical Modeling; Tinsley, H.E.A., Brown, S.D., Eds.; Academic Press: San Diego, CA, USA, 2000; pp. 265–296. ISBN 978-0-12-691360-6. [Google Scholar]
  71. Hair, J.F.; Black, W.C.; Babin, B.J.; Anderson, R.E. Multivariate Data Analysis, 7th ed.; Pearson: Upper Saddle River, NJ, USA, 2009; ISBN 978-0-13-813263-7. [Google Scholar]
  72. Hensher, D.A.; Rose, J.M.; Greene, W.H. Applied Choice Analysis, 2nd ed.; Cambridge University Press: Cambridge, UK, 2015; ISBN 978-1-107-09264-8. [Google Scholar]
  73. O’brien, R.M. A Caution Regarding Rules of Thumb for Variance Inflation Factors. Qual. Quant. 2007, 41, 673–690. [Google Scholar] [CrossRef]
  74. Karatepe, O.M.; Kilic, H. Relationships of Supervisor Support and Conflicts in the Work–Family Interface with the Selected Job Outcomes of Frontline Employees. Tour. Manag. 2007, 28, 238–252. [Google Scholar] [CrossRef]
  75. Golinko, V.; Cheberyachko, S.; Deryugin, O.; Tretyak, O.; Dusmatova, O. Assessment of the Risks of Occupational Diseases of the Passenger Bus Drivers. Saf. Health Work 2020, 11, 543–549. [Google Scholar] [CrossRef]
  76. Winkleby, M.A.; Ragland, D.R.; Fisher, J.M.; Syme, S.L. Excess Risk of Sickness and Disease in Bus Drivers: A Review and Synthesis of Epidemiological Studies. Int. J. Epidemiol. 1988, 17, 255–262. [Google Scholar] [CrossRef]
  77. Rosenberg, L.; Kottorp, A.; Winblad, B.; Nygård, L. Perceived Difficulty in Everyday Technology Use among Older Adults with or without Cognitive Deficits. Scand. J. Occup. Ther. 2009, 16, 216–226. [Google Scholar] [CrossRef]
  78. Shi, X.; Zhang, L. Effects of Altruism and Burnout on Driving Behavior of Bus Drivers. Accid. Anal. Prev. 2017, 102, 110–115. [Google Scholar] [CrossRef]
  79. Akinlotan, O.; Drewry, H. Factors That Influence the Mental Health of Bus Drivers: A Systematic Review. Ment. Health Prev. 2024, 35, 200355. [Google Scholar] [CrossRef]
  80. Nguyen-Phuoc, D.Q.; Mai, N.X.; Ho-Mai, N.T.; Nguyen, M.H.; Oviedo-Trespalacios, O. What Factors Contribute to In-Role and Extra-Role Safety Behavior among Food Delivery Riders? Transp. Res. Part F Traffic Psychol. Behav. 2024, 102, 177–198. [Google Scholar] [CrossRef]
  81. Nguyen, M.H.; Nguyen-Phuoc, D.Q.; Oviedo-Trespalacios, O. Non-Fatal Traffic Crashes among Food Delivery Riders in Vietnam: What Is the Problem? Traffic Inj. Prev. 2023, 24, 686–692. [Google Scholar] [CrossRef]
  82. Mayerl, H.; Stolz, E.; Großschädl, F.; Rásky, É.; Freidl, W. The Moderating Role of Personal Resources in the Relationship between Psychosocial Job Demands and Health: A Cross-Sectional Study. BMJ Open 2017, 7, e015710. [Google Scholar] [CrossRef]
  83. Le, T.L.; Pojani, D.; Nguyen, T.C.; Ha, T.T.; Nguyen, M.H. Why Is Vietnam a Motorcycle Nation? A Transport Psychology Study. Eur. Transp./Trasp. Eur. 2024, 1–17. [Google Scholar] [CrossRef]
  84. Ngoc, N.M.; Phuong, H.L.H.; Manh, N.D.; Duong, K.A.; Tung, T.T.; Hao, H.V.; Hieu, N.M. Exploring continuance intention to use electric motorcycles among students in Hanoi using expectation confirmation theory. Transp. Commun. Sci. J. 2023, 74, 58–71. [Google Scholar] [CrossRef]
  85. Ha, T.T.; Nguyen, M.H. Factors associated with bus subsidy in Hanoi—Using data of the whole network from 2011 to 2019. Transp. Commun. Sci. J. 2021, 72, 180–192. [Google Scholar] [CrossRef]
Figure 1. Research model.
Sustainability 17 02850 g001
Figure 2. TRANSERO’s buses on almost all routes show an advertisement recruiting bus drivers (Source: captured by the author).
Sustainability 17 02850 g002
Table 1. Statistics of the Hanoi bus [50].
YearNumber of Bus RoutesNumber of BusesRidership (Million Passengers)
2013701189458.8
2014721206463.5
2015721208431.7
2016791291394.9
2017911497392.3
20181001599404.4
20191041663430.1
20201041678343.4
20211211879194.2
20221322033333.9
20231322024365.1
Table 2. Attitudinal statements.
CodeItemsSupporting Literature
CrPCabin-related pressure[38,59]
CrP_1The passengers on the bus are often noisy, which makes me uncomfortable.
CrP_2Passengers often do not follow or listen to the instructions of the staff while traveling on the bus, which makes me feel irritated.
RrPRoad- and traffic-related pressure[60]
RrP_1Buses have to share the road with other vehicles, which makes my job more stressful and exhausting.
RrP_2Many routes have narrow widths and frequent congestion, which increases the pressure of my job.
RrP_3Traffic in Hanoi has kept increasing, making my job more stressful.
WrPWeather-related pressure[59]
WrP_1The summer weather in Hanoi is harsh with high temperatures, which adds more pressure to my job.
WrP_2The winter weather in Hanoi is harsh with deep temperature drops, which also increases the pressure on my job.
SrPSchedule-related pressure[41,59]
SrP_1The working hours each day are currently too long.
SrP_2The resting time between trips is too short.
SrP_3I often have to constantly switch shifts.
SrP_4During my shift, I rarely have enough time to go to the restroom.
SrP_5I’m always worried about the possibility of being fined for arriving at the terminals late.
VrPVehicle-related pressure[59]
VrP_1The bus I drive deteriorates quickly because it operates frequently, and the quality of maintenance and repairs is not good enough.
VrP_2The bus I drive does not have all the necessary features to support safe and smooth passenger pick-up, drop-off, and running.
SSSupervisor support[61,62]
SS_1My bus company is willing to invest money and effort to improve working conditions for bus drivers.
SS_2My bus company seems to care about my health.
SS_3My bus company seems to care about my safety.
CSCo-worker support[61,63]
CS_1Bus drivers who I know expect me to work well.
CS_2Bus drivers who I know are willing to listen to my working problems.
CS_3I frequently get help and support from my co-workers.
RRewards[61,64]
R_1My performance is rewarded properly.
R_2I receive the recognition I deserve for my the work I’ve done.
TITurnover intention[2,65,66]
TI_1I have a plan to stop my bus-driving occupation in a short time.
TI_2I am currently thinking of stopping this occpupation.
TI_3I have frequently thought about leaving this job for the last three months.
Table 3. Characteristics of drivers interviewed (N = 428).
VariablesFrequencyPercent
1Age
Under 26 years old12829.91%
26–45 years old22753.04%
Above 45 years old7317.06%
2Educational degree
Not holding a university degree33979.21%
Holding a university degree8920.79%
3Monthly income (million VND per month)
Below 1528165.65%
At least 1514734.35%
4Driving experience
Below 2 years9722.66%
2–5 years15636.45%
Above 5 years17540.89%
5Route type
Urban route11226.17%
Non-urban route31673.83%
Note: USD 1= VND 24,000.
Table 4. Results of EFA.
CodePressure of Cabin and VehiclePressure of SchedulePressure of Road and TrafficPressure of WeatherOrganizational SupportRewardsTurnover Intention
First run of EFA: For latent independent variables
CrP_10.7689
CrP_20.7853
RrP_1 0.8938
RrP_2 0.8721
RrP_3 0.8582
WrP_1 0.7485
WrP_2 0.8192
SrP_1 0.9012
SrP_2 0.8839
SrP_3 0.8742
SrP_4 0.9168
SrP_5 0.8674
VrP_10.8343
VrP_20.7924
SS_1 0.7382
SS_2 0.8372
SS_3 0.8213
CS_1 0.7849
CS_2 0.8138
CS_3 0.8452
R_1 0.9213
R_2 0.9058
Model parameters: Sample size: 428; Bartlett’s test of sphericity: p-value (0.000); Kaiser–Meyer–Olkin (KMO) measure of sampling adequacy: 0.7654; method: principal component factors with eigenvalue > 1; rotation: orthogonal oblimin (Kaiser on); number of extracted factors: 4; variance explained: 0.6469
Second run of EFA: For latent dependent variable (i.e., turnover intention)
TI_1 0.8927
TI_2 0.8863
TI_3 0.8659
Model parameters: Sample size: 428; Bartlett’s test of sphericity: p-value (0.000); Kaiser–Meyer–Olkin (KMO) measure of sampling adequacy: 0.8154; method: principal component factors with eigenvalue > 1; rotation: orthogonal oblimin (Kaiser on); number of extracted factors: 1; variance explained: 0.7142.
Table 5. Results of influential factors of turnover intention.
FactorsβStd. Err.p
1Age
Under 26 years old (reference)
26–45 years oldNot significant
Above 45 years old0.3370.0890.000
2Educational degree
Not holding a university degree (reference)
Holding a university degreeNot significant
3Monthly income (million VND permonth)
Below 15 (reference)
At least 15Not significant
4Driving experience
Below 2 years (reference)
2–5 yearsNot significant
Above 5 years0.1220.0730.034
5Route type
Urban route (reference)
Non-urban route−0.1550.1000.085
5Pressure of cabin and vehicle0.1890.0310.004
6Pressure of schedule0.3680.0310.000
7Pressure of road and traffic0.3290.0320.000
8Pressure of weather0.1470.0320.010
9Organizational support−0.1250.0310.009
10Rewards−0.1530.0310.004
Note: Dependent variable: Turnover intention. Adjusted R2: 58,6%. Std. Err.: standard error. Only significant relationships are presented in the table.
Disclaimer/Publisher’s Note: The statements, opinions and data contained in all publications are solely those of the individual author(s) and contributor(s) and not of MDPI and/or the editor(s). MDPI and/or the editor(s) disclaim responsibility for any injury to people or property resulting from any ideas, methods, instructions or products referred to in the content.

