Research on the Temporal and Spatial Distribution of Marginal Abatement Costs of Carbon Emissions in the Logistics Industry and Its Influencing Factors
Abstract
1. Introduction
2. Literature Review
2.1. Evolution of MCAC Measurement Methods
2.2. Spatial Effects of Carbon Reduction Costs
2.3. Research on MCAC Influencing Factors
2.4. Research Gaps and This Paper’s Positioning
3. Materials and Methods
3.1. Research Methods
3.1.1. Carbon Emission Measurement in the Logistics Industry
3.1.2. Measurement of MCAC in the Logistics Industry
3.1.3. Spatial Analysis Method for MCAC in the Logistics Industry
- (1)
- Spatial Dependence. Spatial dependence refers to the interdependence and mutual influence of a phenomenon across different spatial units [41,42]. It signifies the consistency between the target value and the region, also known as spatial autocorrelation. The intensity of spatial correlation is influenced by both absolute and relative positions. The methods used for its measurement involve both overall and regional autocorrelation. The Moran’s I statistic is commonly employed to assess overall autocorrelation, which examines the overall spatial distribution characteristics of a particular phenomenon. Local autocorrelation focuses on the clustered patterns of a phenomenon within local spaces, often represented by Moran’s I scatter plots and LISA maps.
- (2)
- Spatial Heterogeneity. Spatial heterogeneity refers to the differences in a phenomenon between different spatial units, such as the disparities between China’s eastern coastal and western regions or between economically developed and underdeveloped areas. These differences are caused by the uneven and non-random distribution of the spatial economy [43]. In this study, spatial heterogeneity is primarily driven by variations in energy consumption, economic inputs, and labor force distribution across different regions within the logistics industry.
- (3)
- Moran’s I Index. Moran’s I is a method used to assess spatial autocorrelation, taking into account the intricate nature of spatial sequences in its calculations [44]. The associated formula is given below:
- (4)
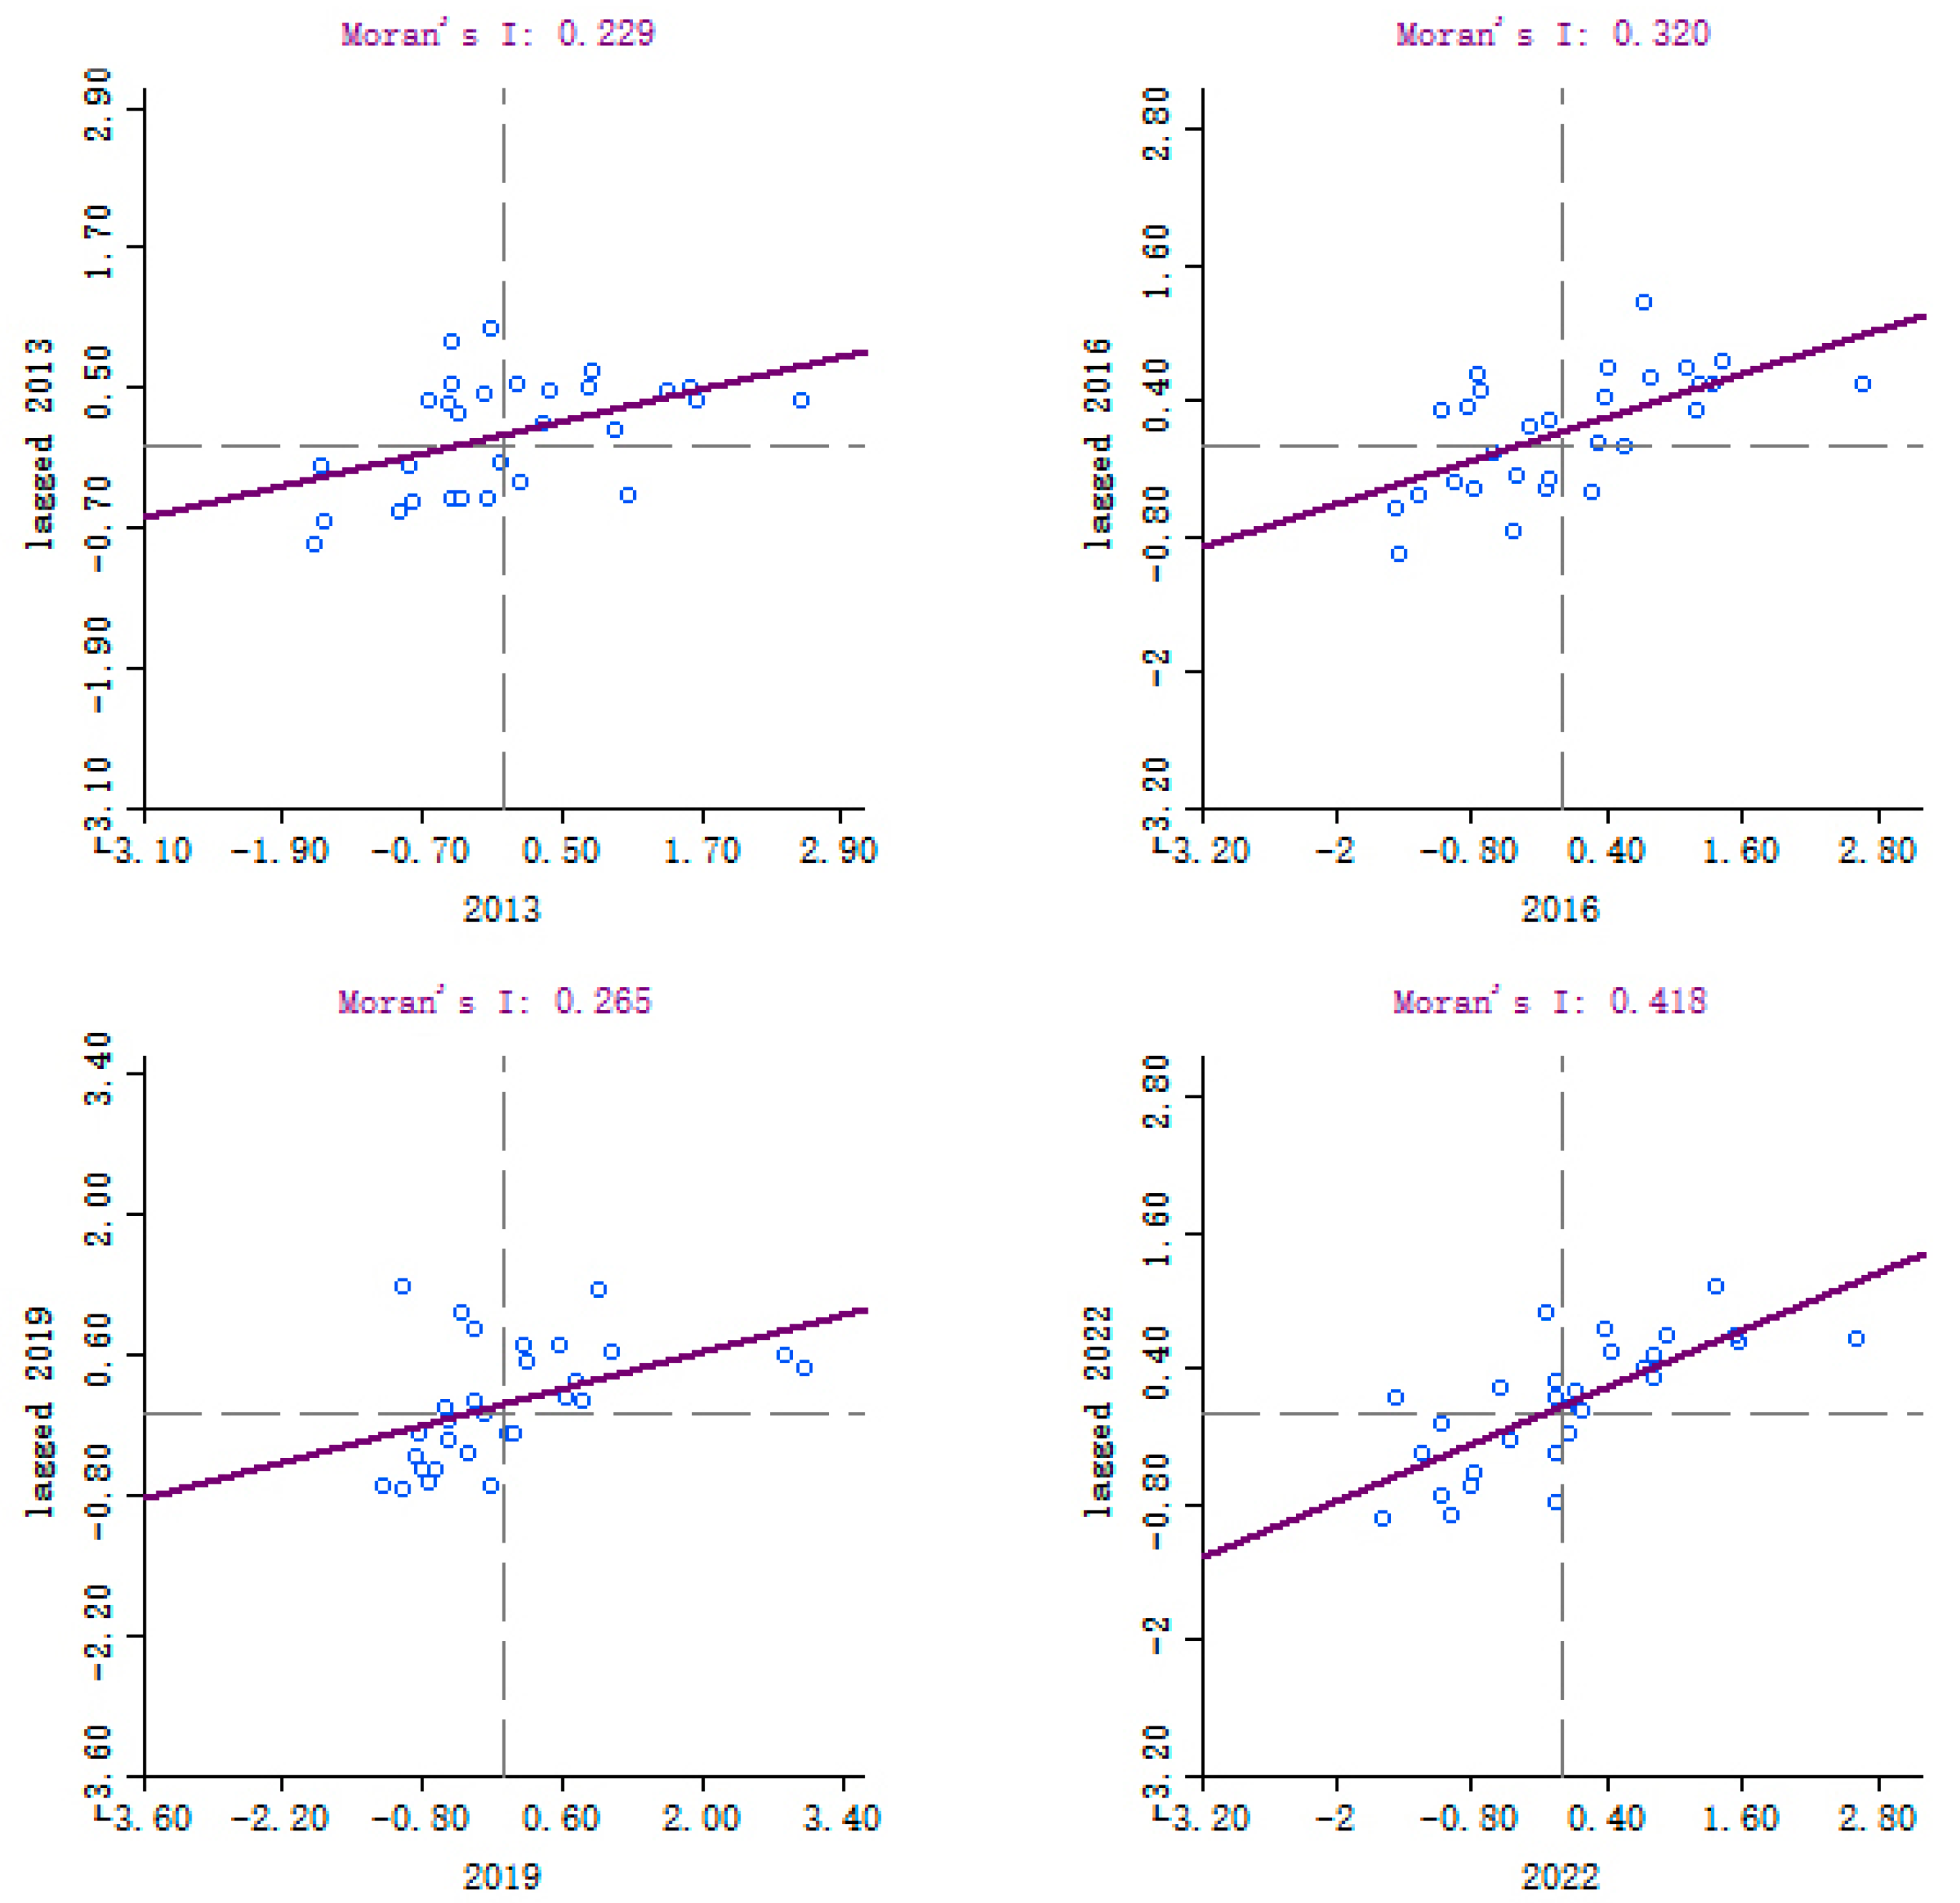
- Moran’s scatter plot is used to analyze spatial patterns within localized areas. This approach presents the data using a scatter plot, with the vertical axis depicting spatial lag values and the horizontal axis displaying deviation values for each region, effectively highlighting spatial lag influences [45]. The scatter plot consists of four quadrants, each representing a unique local spatial relationship. The first and third quadrants indicate positive spatial correlations, suggesting that the target region and its surrounding areas exhibit comparable levels. In contrast, the second and fourth quadrants reveal negative spatial correlations, reflecting differences in development levels between the target region and its surroundings. A detailed explanation is available in Table 3.
- (5)
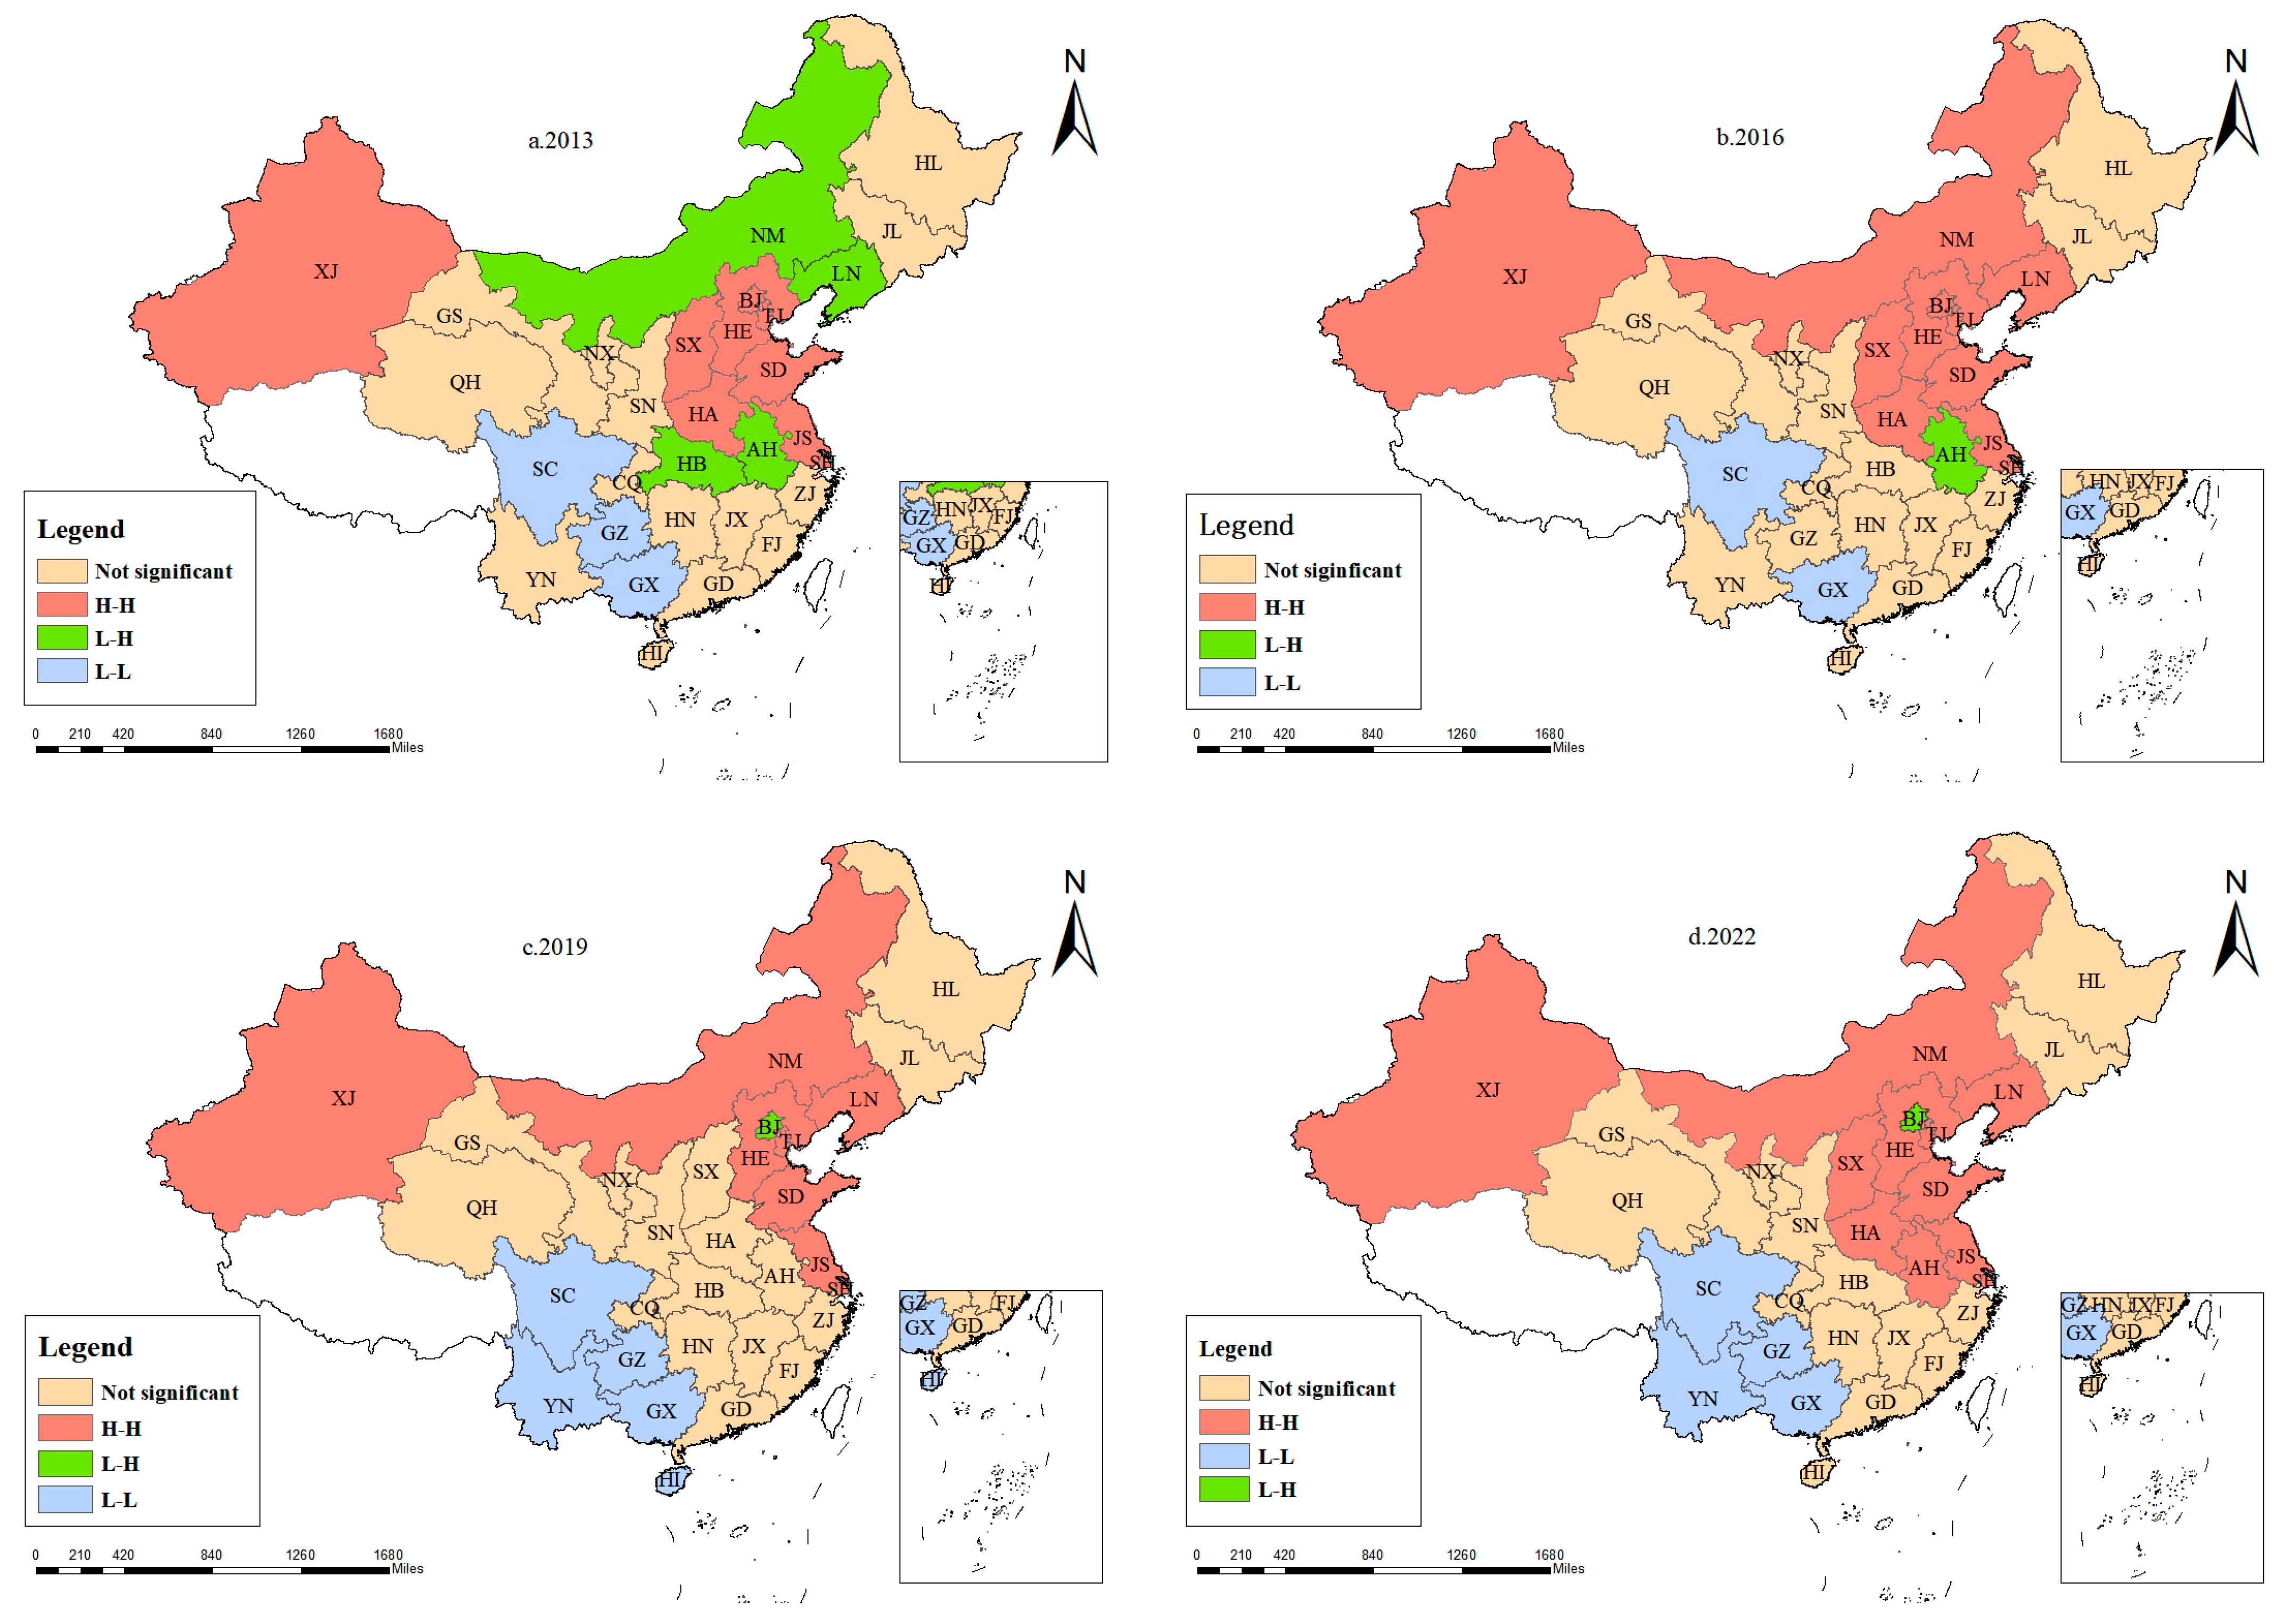
- LISA Cluster Map. While Moran’s scatter plot provides an intuitive view of the relationships between each target region and its surrounding areas, it does not clearly indicate the significance of spatial correlation in that region [46,47]. The LISA cluster map, however, not only visually displays the significance of spatial clustering around each region but also highlights the spatial units and patterns that influence the overall spatial distribution. By computing the local Moran’s I index and utilizing software packages such as StataMP 17 and ArcGIS 10.8, one can generate a LISA cluster map that illustrates the MCAC in China’s logistics industry.
3.1.4. Construction of Spatial Econometric Model
3.1.5. Selection of Influencing Factors
3.2. Data Sources
4. Results Analysis
4.1. Analysis of Carbon Emission Estimation Results for the Logistics Industry in Various Regions
4.2. Analysis of MCAC Calculation Results in the Logistics Industry
4.2.1. Temporal Dimension Analysis of MCAC in the Logistics Industry
4.2.2. Spatial Dimension Analysis of MCAC in the Logistics Industry
- (1)
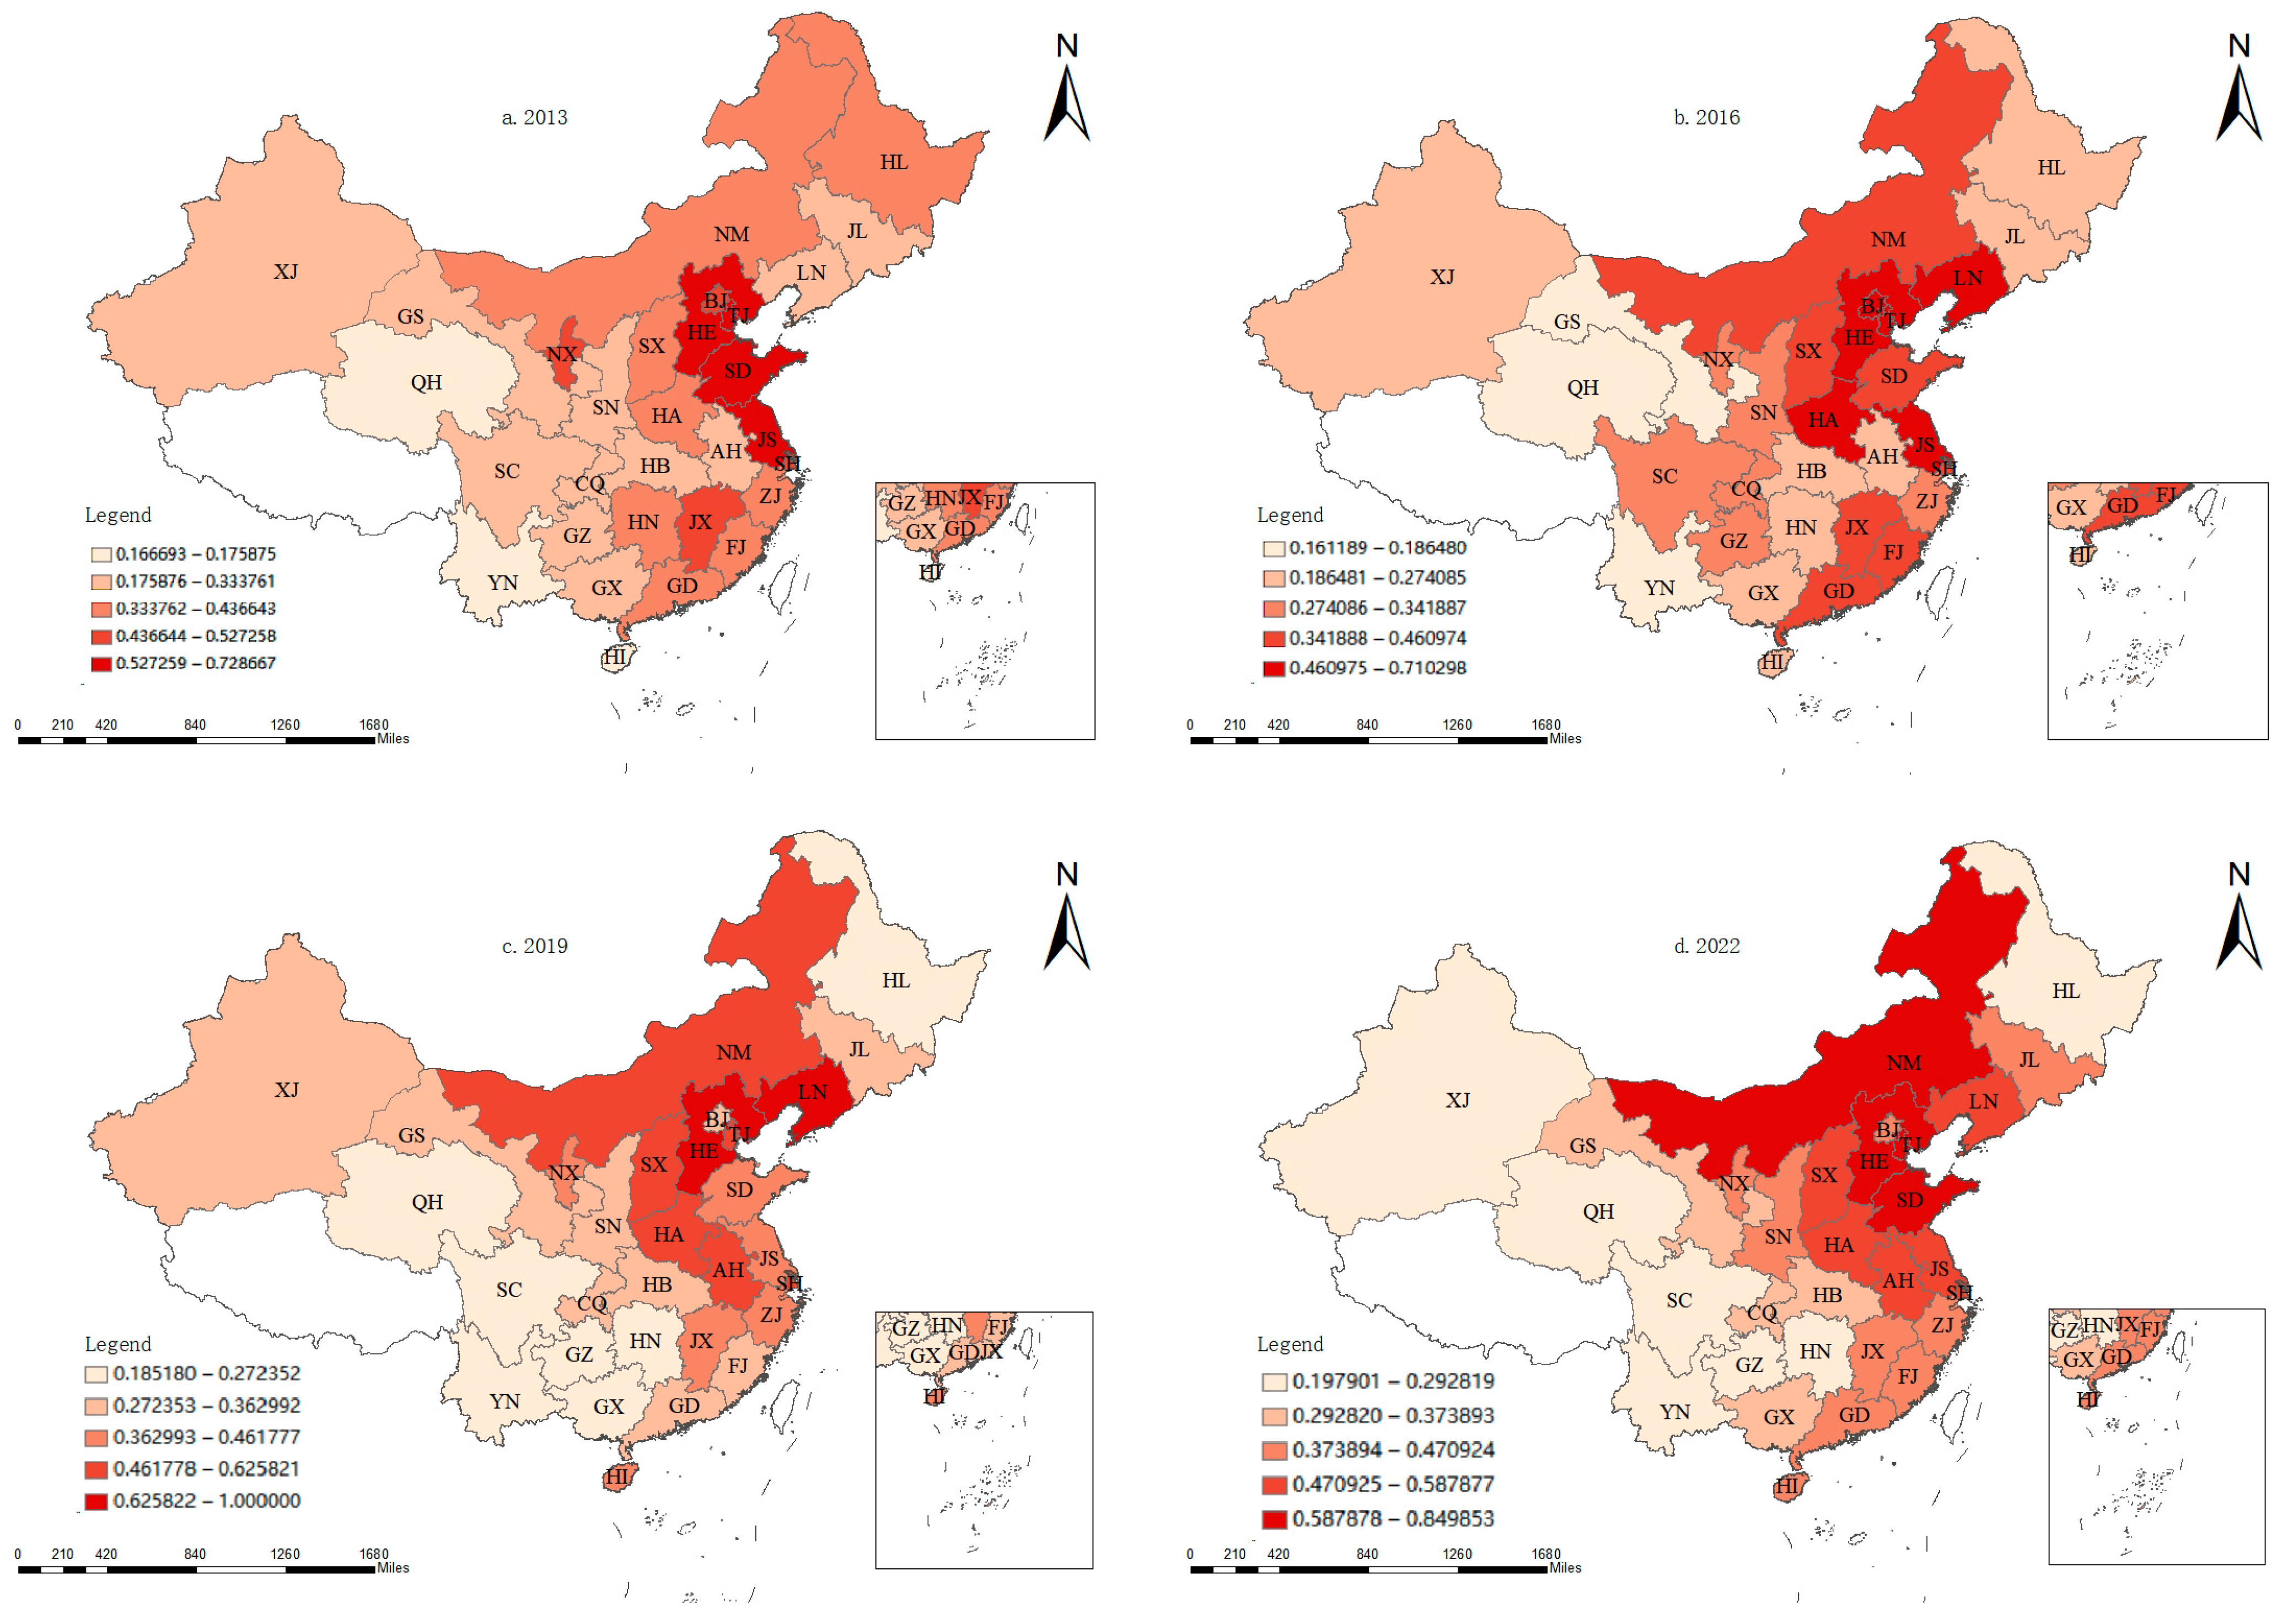
- Distribution Characteristics of Marginal Abatement Cost for Carbon Emissions within the Logistics Industry
- (2)
- Global Spatial Autocorrelation Analysis of MCAC in the Logistics Industry
- (3)
- Local Spatial Autocorrelation Analysis of MCAC in the Logistics Industry
4.3. Analysis of Influencing Factors on MCAC in the Logistics Industry
4.3.1. Descriptive Statistics
4.3.2. Correlation Tests
4.3.3. Empirical Analysis of Influencing Factors
5. Discussion
6. Recommendations
7. Conclusions
Author Contributions
Funding
Institutional Review Board Statement
Informed Consent Statement
Data Availability Statement
Conflicts of Interest
References
- Yang, J.; Tang, L.; Mi, Z.; Liu, S.; Li, L.; Zheng, J. Carbon emissions performance in logistics at the city level. J. Clean. Prod. 2019, 231, 1258–1266. [Google Scholar]
- Wang, X.; Dong, F. The dynamic relationships among growth in the logistics industry, energy consumption, and carbon emission: Recent evidence from China. J. Pet. Explor. Prod. Technol. 2023, 13, 487–502. [Google Scholar]
- Zhang, S.; Wang, J.; Zheng, W. Decomposition Analysis of Energy-Related CO2 Emissions and Decoupling Status in China’s Logistics Industry. Sustainability 2018, 10, 1340. [Google Scholar] [CrossRef]
- Wang, F.; Wang, R.; Nan, X. Marginal abatement costs of industrial CO2 emissions and their influence factors in China. Sustain. Prod. Consum. 2022, 30, 930–945. [Google Scholar]
- Cheng, J.; Xu, L.; Wang, H.; Geng, Z.; Wang, Y. How does the marginal abatement cost of CO2 emissions evolve in Chinese cities? An analysis from the perspective of urban agglomerations. Sustain. Prod. Consum. 2022, 32, 147–159. [Google Scholar]
- Wu, J.; Ma, C.; Tang, K. The static and dynamic heterogeneity and determinants of marginal abatement cost of CO2 emissions in Chinese cities. Energy 2019, 178, 685–694. [Google Scholar]
- Liu, J.; Feng, C. Marginal abatement costs of carbon dioxide emissions and its influencing factors: A global perspective. J. Clean. Prod. 2018, 170, 1433–1450. [Google Scholar]
- Li, S.; Liu, J.; Wu, J.; Hu, X. Spatial spillover effect of carbon emission trading policy on carbon emission reduction: Empirical data from transport industry in China. J. Clean. Prod. 2022, 371, 133529. [Google Scholar]
- Wang, Z.; He, W. CO2 emissions efficiency and marginal abatement costs of the regional transportation sectors in China. Transp. Res. Part D Transp. Environ. 2017, 50, 83–97. [Google Scholar] [CrossRef]
- Wu, L.; Chen, Y.; Feylizadeh, M.R. Study on the estimation, decomposition and application of China’s provincial carbon marginal abatement costs. J. Clean. Prod. 2019, 207, 1007–1022. [Google Scholar]
- Cristea, A.; Hummels, D.; Puzzello, L.; Avetisyan, M. Trade and the greenhouse gas emissions from international freight transport. J. Environ. Econ. Manag. 2013, 65, 153–171. [Google Scholar]
- Zhou, P.; Ang, B.W.; Wang, H. Energy and CO2 emission performance in electricity generation: A non-radial directional distance function approach. Eur. J. Oper. Res. 2012, 221, 625–635. [Google Scholar]
- Choi, Y.; Wang, H.; Yang, F.; Lee, H. Sustainable Governance of the Korean Freight Transportation Industry from an Environmental Perspective. Sustainability 2021, 13, 6429. [Google Scholar] [CrossRef]
- Tang, Z.; Liu, W.; Gong, P. The measurement of the spatial effects of Chinese regional carbon emissions caused by exports. J. Geogr. Sci. 2015, 25, 1328–1342. [Google Scholar]
- Du, Q.; Deng, Y.; Zhou, J.; Wu, J.; Pang, Q. Spatial spillover effect of carbon emission efficiency in the construction industry of China. Environ. Sci. Pollut. Res. Int. 2022, 29, 2466–2479. [Google Scholar]
- Wahab, S.; Imran, M.; Safi, A.; Wahab, Z.; Kirikkaleli, D. Role of financial stability, technological innovation, and renewable energy in achieving sustainable development goals in BRICS countries. Environ. Sci. Pollut. Res. Int. 2022, 29, 48827–48838. [Google Scholar] [PubMed]
- Chen, W.; Yang, R. Evolving Temporal–Spatial Trends, Spatial Association, and Influencing Factors of Carbon Emissions in Mainland China: Empirical Analysis Based on Provincial Panel Data from 2006 to 2015. Sustainability 2018, 10, 2809. [Google Scholar] [CrossRef]
- Jiang, Y.; Luo, T.; Wu, Z.; Xue, X. The driving factors in the corporate proactivity of carbon emissions abatement: Empirical evidence from China. J. Clean. Prod. 2021, 288, 125549. [Google Scholar]
- Guo, J.; Feng, P.; Xue, H.; Xue, S.; Fan, L. A framework of ecological security patterns in arid and semi-arid regions considering differences socioeconomic scenarios in ecological risk: Case of Loess Plateau, China. J. Environ. Manag. 2024, 373, 123923. [Google Scholar]
- Kang, X.; Chen, L.; Wang, Y.; Liu, W. Analysis on the spatial correlation network and driving factors of carbon emissions in China’s logistics industry. J. Environ. Manag. 2024, 366, 121916. [Google Scholar]
- Peng, C. Calculation of a building’s life cycle carbon emissions based on Ecotect and building information modeling. J. Clean. Prod. 2016, 112, 453–465. [Google Scholar]
- Shao, L.; Guan, D.; Zhang, N.; Shan, Y.; Chen, G.Q. Carbon emissions from fossil fuel consumption of Beijing in 2012. Environ. Res. Lett. 2016, 11, 114028. [Google Scholar]
- Wang, Z.; Geng, L. Carbon emissions calculation from municipal solid waste and the influencing factors analysis in China. J. Clean. Prod. 2015, 104, 177–184. [Google Scholar] [CrossRef]
- Chen, Z.; Wu, J. Evolution of Logistics Industry Carbon Emissions in Heilongjiang Province, China. Sustainability 2022, 14, 9758. [Google Scholar] [CrossRef]
- Cui, T.; Pan, K. An analysis and prediction of carbon emissions in the sphere of consumer lifestyles in Beijing. Environ. Sci. Pollut. Res. Int. 2024, 31, 9596–9613. [Google Scholar]
- Li, K.; Luo, Z.; Hong, L.; Wen, J.; Fang, L. The role of China’s carbon emission trading system in economic decarbonization: Evidence from Chinese prefecture-level cities. Heliyon 2024, 10, e23799. [Google Scholar]
- Liu, Z.; Xu, Z.; Zhu, X.; Yin, L.; Yin, Z.; Li, X.; Zheng, W. Calculation of carbon emissions in wastewater treatment and its neutralization measures: A review. Sci. Total Environ. 2024, 912, 169356. [Google Scholar]
- Xu, A.; Zhu, Y.; Wang, Z.; Zhao, Y. Carbon emission calculation of prefabricated concrete composite slabs during the production and construction stages. J. Build. Eng. 2023, 80, 107936. [Google Scholar]
- Zhang, N.; Zhang, G.; Li, Y. Does major agriculture production zone have higher carbon efficiency and abatement cost under climate change mitigation? Ecol. Indic. 2019, 105, 376–385. [Google Scholar]
- Choi, Y.; Zhang, N.; Zhou, P. Efficiency and abatement costs of energy-related CO2 emissions in China: A slacks-based efficiency measure. Appl. Energy 2012, 98, 198–208. [Google Scholar]
- Wang, S.; Chu, C.; Chen, G.; Peng, Z.; Li, F. Efficiency and reduction cost of carbon emissions in China: A non-radial directional distance function method. J. Clean. Prod. 2016, 113, 624–634. [Google Scholar] [CrossRef]
- Chen, L.; Jia, G. Environmental efficiency analysis of China’s regional industry: A data envelopment analysis (DEA) based approach. J. Clean. Prod. 2017, 142, 846–853. [Google Scholar] [CrossRef]
- Han, Y.; Long, C.; Geng, Z.; Zhang, K. Carbon emission analysis and evaluation of industrial departments in China: An improved environmental DEA cross model based on information entropy. J. Environ. Manag. 2018, 205, 298–307. [Google Scholar] [CrossRef]
- Vaninsky, A. Energy-environmental efficiency and optimal restructuring of the global economy. Energy 2018, 153, 338–348. [Google Scholar] [CrossRef]
- Zhang, J.; Zeng, W.; Shi, H. Regional environmental efficiency in China: Analysis based on a regional slack-based measure with environmental undesirable outputs. Ecol. Indic. 2016, 71, 218–228. [Google Scholar] [CrossRef]
- Chen, J.; Zhu, Y.; Yang, C.; Wang, H.; Wang, K. Evaluation and prediction of carbon emission from logistics at city scale for low-carbon development strategy. PLoS ONE 2024, 19, e0298206. [Google Scholar] [CrossRef] [PubMed]
- Zhang, C.; Zhang, W.; Luo, W.; Gao, X.; Zhang, B. Analysis of Influencing Factors of Carbon Emissions in China’s Logistics Industry: A GDIM-Based Indicator Decomposition. Energies 2021, 14, 5742. [Google Scholar] [CrossRef]
- Dai, X.; Kuosmanen, T. Best-practice benchmarking using clustering methods: Application to energy regulation. Omega 2014, 42, 179–188. [Google Scholar] [CrossRef]
- Chen, Y. An analytical process of spatial autocorrelation functions based on Moran’s index. PLoS ONE 2021, 16, e0249589. [Google Scholar] [CrossRef]
- Luo, Q.; Hu, K.; Liu, W.; Wu, H. Scientometric Analysis for Spatial Autocorrelation-Related Research from 1991 to 2021. ISPRS Int. J. Geo-Inf. 2022, 11, 309. [Google Scholar] [CrossRef]
- Degefu, M.A.; Argaw, M.; Feyisa, G.L.; Degefa, S. Dynamics of urban landscape nexus spatial dependence of ecosystem services in rapid agglomerate cities of Ethiopia. Sci. Total Environ. 2021, 798, 149192. [Google Scholar] [PubMed]
- Huo, X.N.; Zhang, W.W.; Sun, D.F.; Li, H.; Zhou, L.-D.; Li, B.-G. Spatial pattern analysis of heavy metals in Beijing agricultural soils based on spatial autocorrelation statistics. Int. J. Environ. Res. Public Health 2011, 8, 2074–2089. [Google Scholar] [CrossRef]
- Wang, D.; Wang, X.; Liu, L.; Wang, D.; Zeng, Z. Urban Signatures in the Spatial Clustering of Precipitation Extremes over Mainland China. J. Hydrometeorol. 2021, 22, 639–656. [Google Scholar]
- Huo, X.; Li, H.; Sun, D.; Zhou, L.-D.; Li, B.-G. Combining geostatistics with Moran’s I analysis for mapping soil heavy metals in Beijing, China. Int. J. Environ. Res. Public Health 2012, 9, 995–1017. [Google Scholar] [CrossRef]
- Yin, L.; Wang, L.; Huang, W.; Liu, S.; Yang, B.; Zheng, W. Spatiotemporal Analysis of Haze in Beijing Based on the Multi-Convolution Model. Atmosphere 2021, 12, 1408. [Google Scholar] [CrossRef]
- Jin, G.; Li, Z.; Deng, X.; Yang, J.; Chen, D.; Li, W. An analysis of spatiotemporal patterns in Chinese agricultural productivity between 2004 and 2014. Ecol. Indic. 2019, 105, 591–600. [Google Scholar]
- Zhang, M.; Wang, J.; Li, S. Tempo-spatial changes and main anthropogenic influence factors of vegetation fractional coverage in a large-scale opencast coal mine area from 1992 to 2015. J. Clean. Prod. 2019, 232, 940–952. [Google Scholar]
- Chen, S. Local regularization assisted orthogonal least squares regression. Neurocomputing 2006, 69, 559–585. [Google Scholar] [CrossRef]
- Yang, M.; Liu, H. Fuzzy least-squares algorithms for interactive fuzzy linear regression models. Fuzzy Sets Syst. 2003, 135, 305–316. [Google Scholar]
- Ji, D.J.; Zhou, P.; Wu, F. Do marginal abatement costs matter for improving air quality? Evidence from China’s major cities. J. Environ. Manag. 2021, 286, 112123. [Google Scholar]
- Su, Y.; Jiang, Q.; Khattak, S.I.; Ahmad, M.; Li, H. Do higher education research and development expenditures affect environmental sustainability? New evidence from Chinese provinces. Environ. Sci. Pollut. Res. Int. 2021, 28, 66656–66676. [Google Scholar] [PubMed]
- Liu, B.; Ding, C.J.; Ahmed, A.D.; Huang, Y.; Su, Y. Carbon emission allowances and green development efficiency. J. Clean. Prod. 2024, 463, 142246. [Google Scholar]
- Xin-Gang, Z.; Jin, Z. Impacts of two-way foreign direct investment on carbon emissions: From the perspective of environmental regulation. Environ. Sci. Pollut. Res. Int. 2022, 29, 52705–52723. [Google Scholar]
- Chen, Y.; Yao, Z.; Zhong, K. Do environmental regulations of carbon emissions and air pollution foster green technology innovation: Evidence from China’s prefecture-level cities. J. Clean. Prod. 2022, 350, 131537. [Google Scholar]
- Xie, R.; Fang, J.; Liu, C. The effects of transportation infrastructure on urban carbon emissions. Appl. Energy 2017, 196, 199–207. [Google Scholar]
- Duan, Z.; Wei, T.; Xie, P.; Lu, Y. Co-benefits and influencing factors exploration of air pollution and carbon reduction in China: Based on marginal abatement costs. Environ. Res. 2024, 252, 118742. [Google Scholar] [PubMed]
- Wang, P.P.; Li, Y.P.; Huang, G.H.; Wang, S.; Suo, C.; Ma, Y. A multi-scenario factorial analysis and multi-regional input-output model for analyzing CO2 emission reduction path in Jing-Jin-Ji region. J. Clean. Prod. 2021, 300, 126782. [Google Scholar]
- Zheng, X.; Wang, R.; He, Q. A city-scale decomposition and decoupling analysis of carbon dioxide emissions: A case study of China. J. Clean. Prod. 2019, 238, 117824. [Google Scholar]
- Dong, F.; Long, R.; Yu, B.; Wang, Y.; Li, J.; Wang, Y.; Dai, Y.; Yang, Q.; Chen, H. How can China allocate CO2 reduction targets at the provincial level considering both equity and efficiency? Evidence from its Copenhagen Accord pledge. Resour. Conserv. Recycl. 2018, 130, 31–43. [Google Scholar] [CrossRef]
- Ye, F.; You, R.; Lu, H.; Han, S.; Yang, L.-H. The Classification Impact of Different Types of Environmental Regulation on Chinese Provincial Carbon Emission Efficiency. Sustainability 2023, 15, 12092. [Google Scholar] [CrossRef]
- Li, Z.; Zhang, C.; Zhou, Y. Spatio-temporal evolution characteristics and influencing factors of carbon emission reduction potential in China. Environ. Sci. Pollut. Res. 2021, 28, 59925–59944. [Google Scholar]
- Tian, X.; Zhang, M. Research on Spatial Correlations and Influencing Factors of Logistics Industry Development Level. Sustainability 2019, 11, 1356. [Google Scholar] [CrossRef]
- Kumar, I.; Zhalnin, A.; Kim, A. Transportation and logistics cluster competitive advantages in the U.S. regions: A cross-sectional and spatio-temporal analysis. Res. Transp. Econ. 2016, 17, 16–22. [Google Scholar]
- Dubiea, M.; Kuob, K.C.; Giron-Valderramac, G.; Goodchild, A. An evaluation of logistics sprawl in Chicago and Phoenix. J. Transp. Geogr. 2020, 88, 102298. [Google Scholar]
- Caetano, R.V.; Marques, A.C.; Afonso, T.L.; Vieira, I. A sectoral analysis of the role of Foreign Direct Investment in pollution and energy transition in OECD countries. J. Environ. Manag. 2022, 302, 114018. [Google Scholar]
- Wang, Y.; Zhang, X.; Zhu, L.; Wang, X.; Zhou, L.; Yu, X. Synergetic effect evaluation of pollution and carbon emissions in an industrial park: An environmental impact perspective. J. Clean. Prod. 2024, 467, 142891. [Google Scholar]
- Wang, Y.; Chen, X. Impact Mechanism of Renewable Energy Technology Innovation on Carbon Productivity Based on Spatial Durbin Model. Sustainability 2024, 16, 2100. [Google Scholar] [CrossRef]
| Energy | Carbon Emission Coefficient | Unit |
|---|---|---|
| Raw Coal | 0.7559 | tons of carbon per ton of standard coal |
| Gasoline | 0.5538 | tons of carbon per ton of standard coal |
| Kerosene | 0.5714 | tons of carbon per ton of standard coal |
| Diesel | 0.5921 | tons of carbon per ton of standard coal |
| Fuel Oil | 0.6185 | tons of carbon per ton of standard coal |
| Liquefied Petroleum Gas (LPG) | 0.5042 | tons of carbon per ton of standard coal |
| Natural Gas | 0.4483 | tons of carbon per ton of standard coal |
| Electricity | 2.2132 | tons of carbon per ton of standard coal |
| Energy | Standard Coal Conversion Coefficient | Unit |
|---|---|---|
| Raw Coal | 0.7143 | kg of standard coal per kg |
| Gasoline | 1.4714 | kg of standard coal per kg |
| Kerosene | 1.4714 | kg of standard coal per kg |
| Diesel | 1.4571 | kg of standard coal per kg |
| Fuel Oil | 1.4286 | kg of standard coal per kg |
| Liquefied Petroleum Gas (LPG) | 1.7143 | kg of standard coal per kg |
| Natural Gas | 1.33 | kg of standard coal per kg |
| Electricity | 0.1229 | kg of standard coal per kg |
| Quadrant | Spatial Association Pattern | Specific Meaning |
|---|---|---|
| First Quadrant | High-High Clustering (H-H) | Spatial association where a region with a high observed value is surrounded by other regions with similarly high values. |
| Second Quadrant | Low-High Clustering (L-H) | Spatial association where a region with a low observed value is surrounded by regions with high values. |
| Third Quadrant | Low-Low Clustering (L-L) | Spatial association where a region with a low observed value is surrounded by other regions with similarly low values. |
| Fourth Quadrant | High-Low Clustering (H-L) | Spatial association where a region with a high observed value is surrounded by regions with low values. |
| Influencing Factors | Symbol Identification | Data Sources | Units |
|---|---|---|---|
| Economic Development Level [50] (a1) | PGDP | Regional GDP/Total Population at the End of the Year | Yuan |
| Education Investment Level [51] (a2) | EI | Rand D Expenditure | Ten thousand yuan |
| Innovation Development Level [52] (a3) | ID | Number of Valid Invention Patents | Pieces |
| Foreign Investment Level [53] (a4) | FI | Total Investment | Hundred million USD |
| Environmental Pollution [54] (a5) | EP | Total Emission of Waste Pollutants | Ten thousand tons |
| Infrastructure Development [55] (a6) | INF | Total Length of Postal Routes | Kilometers |
| Region | Specific Provinces | Abbreviation |
|---|---|---|
| Northeastern Region | Liaoning, Jilin, Heilongjiang | LN, JL, HL |
| Eastern Region | Beijing, Tianjin, Hebei, Shanghai, Jiangsu, Zhejiang, Fujian, Shandong, Guangdong, Hainan | BJ, TJ, HE, SH, JS, ZJ, FJ, SD, GD, HI |
| Central Region | Shanxi, Anhui, Jiangxi, Henan, Hubei, Hunan | SX, AH, JX, HA, HB, HN |
| Western Region | Inner Mongolia, Guangxi, Chongqing, Sichuan, Guizhou, Yunnan, Shaanxi, Gansu, Qinghai, Ningxia, Xinjiang | NM, GX, CQ, SC, GZ, YN, SN, GS, QH, NX, XJ |
| 2013 | 2014 | 2015 | 2016 | 2017 | 2018 | 2019 | 2020 | 2021 | 2022 | |
|---|---|---|---|---|---|---|---|---|---|---|
| China | 16,673.59 | 17,210.67 | 18,087.90 | 18,496.90 | 19,317.69 | 19,915.23 | 19,410.39 | 18,040.40 | 19,317.79 | 22,454.66 |
| AH | 485.65 | 532.92 | 539.03 | 546.95 | 584.62 | 601.03 | 577.84 | 578.99 | 584.64 | 515.54 |
| BJ | 568.66 | 598.09 | 618.05 | 648.69 | 687.37 | 729.54 | 746.11 | 487.16 | 529.17 | 383.95 |
| FJ | 490.01 | 531.99 | 560.74 | 597.70 | 631.04 | 671.55 | 724.45 | 659.63 | 699.88 | 665.18 |
| GS | 285.97 | 288.22 | 267.99 | 260.07 | 264.15 | 244.19 | 244.04 | 237.88 | 226.52 | 243.75 |
| GD | 1533.62 | 1605.38 | 1673.35 | 1819.22 | 1904.91 | 1945.27 | 1985.53 | 1752.40 | 1678.80 | 1329.93 |
| GX | 385.49 | 485.46 | 500.87 | 516.51 | 565.16 | 548.90 | 533.06 | 447.64 | 473.00 | 517.85 |
| GZ | 354.14 | 373.15 | 405.32 | 446.97 | 387.73 | 412.50 | 438.39 | 448.56 | 504.28 | 503.12 |
| HI | 161.45 | 155.66 | 160.95 | 154.15 | 163.78 | 158.98 | 162.18 | 164.23 | 175.31 | 157.43 |
| HE | 508.22 | 465.23 | 456.25 | 538.15 | 441.91 | 504.37 | 489.02 | 351.76 | 407.87 | 451.37 |
| HA | 662.97 | 659.84 | 709.77 | 702.46 | 735.31 | 845.36 | 837.44 | 860.67 | 931.75 | 997.18 |
| HL | 592.39 | 634.35 | 655.77 | 663.37 | 603.93 | 519.41 | 502.26 | 426.06 | 470.93 | 473.91 |
| HB | 729.95 | 782.66 | 798.01 | 978.35 | 990.69 | 1015.57 | 1126.44 | 950.83 | 1117.71 | 975.38 |
| HN | 613.51 | 670.01 | 755.47 | 790.24 | 836.92 | 895.89 | 929.29 | 908.43 | 940.43 | 926.56 |
| JL | 329.22 | 363.62 | 381.97 | 366.98 | 354.44 | 275.09 | 274.73 | 264.59 | 284.32 | 173.19 |
| JS | 946.22 | 1023.87 | 1055.19 | 1084.98 | 1137.20 | 1201.08 | 1245.24 | 1276.99 | 1240.62 | 1183.30 |
| JX | 351.68 | 360.68 | 394.39 | 401.08 | 417.80 | 473.97 | 512.97 | 507.10 | 513.07 | 495.96 |
| LN | 907.99 | 981.08 | 1019.24 | 1046.57 | 1050.70 | 1034.80 | 980.33 | 916.19 | 974.31 | 887.96 |
| NM | 660.59 | 658.09 | 674.26 | 436.68 | 416.83 | 399.81 | 411.71 | 382.88 | 378.25 | 396.52 |
| NX | 83.88 | 87.62 | 88.59 | 91.77 | 96.20 | 79.32 | 83.78 | 79.83 | 85.46 | 81.33 |
| QH | 66.84 | 74.07 | 76.27 | 88.00 | 98.78 | 109.80 | 111.55 | 93.73 | 103.60 | 116.61 |
| SD | 1004.54 | 1033.76 | 1050.57 | 1092.73 | 1217.47 | 1190.41 | 1210.61 | 938.74 | 988.96 | 1023.73 |
| SX | 471.81 | 465.27 | 487.56 | 500.78 | 520.93 | 487.24 | 474.22 | 375.03 | 350.31 | 357.27 |
| SN | 405.67 | 425.58 | 416.60 | 365.25 | 366.33 | 403.18 | 394.37 | 332.74 | 337.94 | 354.42 |
| SH | 1124.66 | 1119.70 | 1173.34 | 1306.02 | 1428.55 | 1397.92 | 1452.23 | 1209.27 | 1268.21 | 1051.72 |
| SC | 373.24 | 527.09 | 511.40 | 743.87 | 774.52 | 785.90 | 822.25 | 774.63 | 809.75 | 844.46 |
| TJ | 223.26 | 236.15 | 237.86 | 240.47 | 239.91 | 241.18 | 239.94 | 217.49 | 236.04 | 222.83 |
| XJ | 386.40 | 400.73 | 475.17 | 496.40 | 536.57 | 541.40 | 533.57 | 431.56 | 455.26 | 453.13 |
| YN | 527.18 | 596.71 | 577.87 | 605.26 | 617.99 | 695.16 | 757.11 | 722.08 | 745.65 | 695.45 |
| ZJ | 758.91 | 773.45 | 821.77 | 825.20 | 857.69 | 837.76 | 784.15 | 818.41 | 853.64 | 828.08 |
| CQ | 414.07 | 385.14 | 463.18 | 499.95 | 527.26 | 466.86 | 478.61 | 447.59 | 447.46 | 372.99 |
| Province | 2013 | 2014 | 2015 | 2016 | 2017 | 2018 | 2019 | 2020 | 2021 | 2022 |
|---|---|---|---|---|---|---|---|---|---|---|
| AH | 0.3224 | 0.2893 | 0.2709 | 0.2587 | 0.2601 | 0.5364 | 0.5389 | 0.5191 | 0.5365 | 0.5554 |
| BJ | 0.4823 | 0.4528 | 0.4942 | 0.5024 | 0.4109 | 0.3153 | 0.3630 | 0.3696 | 0.3996 | 0.4213 |
| FJ | 0.4301 | 0.4153 | 0.4208 | 0.4311 | 0.4567 | 0.3125 | 0.3125 | 0.3462 | 0.3863 | 0.4493 |
| GS | 0.2800 | 0.1755 | 0.1833 | 0.1612 | 0.1856 | 0.2866 | 0.2860 | 0.2551 | 0.2909 | 0.3211 |
| GD | 0.4043 | 0.4025 | 0.3882 | 0.3919 | 0.3914 | 0.3681 | 0.3505 | 0.3703 | 0.4411 | 0.4380 |
| GX | 0.3247 | 0.2755 | 0.2640 | 0.2526 | 0.2579 | 0.2409 | 0.2581 | 0.3096 | 0.3387 | 0.3234 |
| GZ | 0.3338 | 0.3387 | 0.3463 | 0.3369 | 0.4209 | 0.2422 | 0.2469 | 0.2466 | 0.2473 | 0.2541 |
| HI | 0.1731 | 0.2130 | 0.2090 | 0.2283 | 0.2643 | 0.2839 | 0.3934 | 0.3452 | 0.4253 | 0.4367 |
| HE | 0.7287 | 0.7640 | 0.7528 | 0.7103 | 1.0000 | 0.7881 | 0.9630 | 0.6100 | 1.0000 | 0.8499 |
| HA | 0.4366 | 0.5275 | 0.4817 | 0.5144 | 0.4956 | 0.5380 | 0.5695 | 0.5409 | 0.5529 | 0.5691 |
| HL | 0.3646 | 0.3166 | 0.2419 | 0.2445 | 0.2777 | 0.2162 | 0.2218 | 0.2309 | 0.2366 | 0.2154 |
| HB | 0.2974 | 0.2916 | 0.2756 | 0.2118 | 0.2257 | 0.3050 | 0.3024 | 0.2856 | 0.2975 | 0.3618 |
| HN | 0.3802 | 0.3560 | 0.2933 | 0.2741 | 0.2726 | 0.2581 | 0.2554 | 0.2620 | 0.2679 | 0.2793 |
| JL | 0.3188 | 0.2902 | 0.2611 | 0.2571 | 0.2840 | 0.3431 | 0.3367 | 0.4041 | 0.4137 | 0.4352 |
| JS | 0.5988 | 0.5335 | 0.5157 | 0.5178 | 0.5047 | 0.4523 | 0.4618 | 0.4777 | 0.5408 | 0.5133 |
| JX | 0.5118 | 0.4245 | 0.3925 | 0.3978 | 0.4629 | 0.4528 | 0.4218 | 0.4141 | 0.4413 | 0.4709 |
| LN | 0.3256 | 0.3084 | 0.3788 | 0.5442 | 0.6227 | 0.6956 | 1.0000 | 0.8069 | 0.7146 | 0.5039 |
| NM | 0.3695 | 0.3619 | 0.2975 | 0.4516 | 0.4697 | 0.6053 | 0.6034 | 0.6317 | 1.0000 | 0.6549 |
| NX | 0.5273 | 0.4367 | 0.3922 | 0.3419 | 0.3159 | 0.3700 | 0.4350 | 0.4676 | 0.4880 | 0.4523 |
| QH | 0.1667 | 0.1614 | 0.1725 | 0.1646 | 0.1601 | 0.1711 | 0.1852 | 0.1909 | 0.2072 | 0.1979 |
| SD | 0.5752 | 0.4715 | 0.4498 | 0.4610 | 0.4232 | 0.4429 | 0.4580 | 0.5772 | 0.6425 | 0.6884 |
| SX | 0.3990 | 0.3741 | 0.3961 | 0.4074 | 0.7908 | 0.6634 | 0.5603 | 0.6146 | 0.7823 | 0.5712 |
| SN | 0.3302 | 0.3181 | 0.2886 | 0.3179 | 0.3130 | 0.3495 | 0.3583 | 0.4346 | 0.4924 | 0.4647 |
| SH | 0.4875 | 0.5718 | 0.4370 | 0.4101 | 0.4277 | 0.4825 | 0.5244 | 0.6180 | 0.6762 | 0.5879 |
| SC | 0.2618 | 0.2651 | 0.3036 | 0.2991 | 0.3142 | 0.2720 | 0.2724 | 0.2898 | 0.2926 | 0.2798 |
| TJ | 0.6089 | 0.5322 | 0.5332 | 0.5347 | 0.6604 | 0.6507 | 0.6258 | 0.5899 | 0.5902 | 0.6804 |
| XJ | 0.2821 | 0.2532 | 0.2077 | 0.2283 | 0.1899 | 0.2313 | 0.3146 | 0.2334 | 0.2357 | 0.2879 |
| YN | 0.1759 | 0.1512 | 0.1717 | 0.1865 | 0.2191 | 0.2284 | 0.2218 | 0.2217 | 0.2552 | 0.2928 |
| ZJ | 0.3601 | 0.3854 | 0.3365 | 0.3414 | 0.3446 | 0.3373 | 0.3816 | 0.3667 | 0.4023 | 0.4355 |
| CQ | 0.2763 | 0.3262 | 0.2936 | 0.3008 | 0.3008 | 0.2938 | 0.3113 | 0.3246 | 0.3706 | 0.3739 |
| 0.3845 | 0.3661 | 0.3483 | 0.3560 | 0.3908 | 0.3911 | 0.4178 | 0.4118 | 0.4655 | 0.4455 |
| Year | Moran’s I | Z | p-Value |
|---|---|---|---|
| 2013 | 0.2287 | 3.5076 | 0.003 |
| 2014 | 0.2814 | 3.9887 | 0.001 |
| 2015 | 0.2367 | 3.4527 | 0.003 |
| 2016 | 0.3202 | 4.489 | 0.001 |
| 2017 | 0.2095 | 3.2247 | 0.006 |
| 2018 | 0.3429 | 4.9433 | 0.001 |
| 2019 | 0.2648 | 4.2614 | 0.003 |
| 2020 | 0.3647 | 4.8991 | 0.001 |
| 2021 | 0.3731 | 5.2891 | 0.001 |
| 2022 | 0.4181 | 5.6517 | 0.001 |
| Agglomeration Classification | 2013 | 2014 | 2015 | 2016 | 2017 |
| H-H | BJ, HE, JS, HA, SX, SD, SH, TJ, XJ | BJ, HE, HA, JS, SD, SX, SH, TJ, XJ | BJ, HE, HA, LN, JS, SD, SX, SH, TJ, XJ | BJ, HE, HA, LN, JS, NM, SD, SX, SH, TJ, XJ | BJ, HE, LN, JS, NM, SD, SH, TJ, XJ |
| H-L | GZ | ||||
| L-H | AH, HE, LN, NM | AH, HE, LN, NM | AH, HE, NM | AH | AH |
| L-L | GX, GZ, SC | QH, SC | SC | GX, SC | GS, SC |
| Agglomeration Classification | 2018 | 2019 | 2020 | 2021 | 2022 |
| H-H | HE, JS, LN, NM, SD, SX, SH, TJ, XJ | HE, JS, LN, NM, SD, SH, TJ, XJ | HE, JS, LN, NM, SD, SH, TJ, XJ | HE, LN, NM, SD, SX, TJ, XJ | AH, HE, HA, JS, LN, NM, SD, SX, SH, TJ, XJ |
| H-L | |||||
| L-H | BJ | BJ | BJ | BJ | BJ |
| L-L | GX, GZ, SC, YN | GX, GZ, HI, SC, YN | GD, GX, SC, YN, GZ | GD, GX, SC, YN, GZ | GX, GZ, SC, YN |
| Indicators | Average | Standard Deviation | Minimum | Maximum |
|---|---|---|---|---|
| Marginal emission reduction cost (y) | 0.398 | 0.163 | 0.151 | 1 |
| Economic development level (a1) | 63,838.89 | 29,241.89 | 23,151 | 190,000 |
| Education investment level (a2) | 4,530,000 | 6,110,000 | 65,029 | 3,417,485 |
| Innovation development level (a3) | 37,560.08 | 77,935.5 | 205 | 573,000 |
| Foreign investment level (a4) | 3240.03 | 6230.584 | 30 | 56,704 |
| Environmental pollution (a5) | 116.643 | 90.253 | 4.6 | 450.01 |
| Infrastructure construction (a6) | 296,000 | 425,000 | 12,208 | 3,420,000 |
| Test | Moran’s I | LM-Lag | Robust LM-Lag | LM-Error | Robust LM-Error | Hausman |
|---|---|---|---|---|---|---|
| Statistic | 3.031 | 28.954 | 28.645 | 7.293 | 6.984 | 28.72 |
| p-value | 0.002 | 0.000 | 0.000 | 0.007 | 0.008 | 0.0072 |
| LR Chi2 | Prob > Chi2 | |
|---|---|---|
| SAR | 77.49 | 0.0000 |
| SEM | 89.42 | 0.0000 |
| Chi2 | Prob > Chi2 |
|---|---|
| 13.07 | 0.0227 |
| 12.54 | 0.0510 |
| Time-Fixed | Individual-Fixed | Dual Fixed Effects | OLS Regression | |
|---|---|---|---|---|
| a1 | 0.0605 * | 0.3306 * | −0.1827 *** | 0.1192 *** |
| (1.7634) | (1.9361) | (−2.6850) | (3.4839) | |
| a2 | 0.0055 | −0.1253 | −0.0215 | 0.0476 ** |
| (0.2201) | (−1.2785) | (−0.5329) | (2.0156) | |
| a3 | −0.0400 * | −0.0305 | −0.0206 | −0.0542 *** |
| (−1.7494) | (−0.6170) | (−0.5929) | (−2.6938) | |
| a4 | 0.0701 *** | 0.0565 * | 0.0060 | 0.0553 *** |
| (6.4187) | (1.6927) | (0.5570) | (5.3821) | |
| a5 | 0.0753 *** | −0.1170 *** | 0.0240 | 0.0735 *** |
| (4.5123) | (−3.2749) | (0.8496) | (3.8199) | |
| a6 | −0.0692 *** | 0.0128 | −0.0146 | −0.0823 *** |
| (−5.6821) | (0.3760) | (−1.2866) | (−7.1806) | |
| _cons | −0.8338 *** | |||
| (−2.5985) | ||||
| wx | ||||
| w × a1 | 0.4606 *** | 0.1826 | 0.0385 | |
| (4.7245) | (1.0277) | (0.2248) | ||
| w × a2 | −0.1213 | −0.1571 | −0.0985 | |
| (−1.3566) | (−1.5660) | (−0.9363) | ||
| w × a3 | 0.2408 *** | −0.0453 | −0.0709 | |
| (3.0408) | (−1.3263) | (−0.7853) | ||
| w × a4 | −0.0886 ** | 0.0644 ** | 0.0141 | |
| (−2.3889) | (2.0530) | (0.3422) | ||
| w × a5 | 0.0050 | −0.0577 ** | −0.2957 *** | |
| (0.0979) | (−2.3465) | (−3.4270) | ||
| w × a6 | −0.2424 *** | 0.0010 | −0.0065 | |
| (−5.7749) | (0.0263) | (−0.1705) | ||
| sigma2_e | 0.0124 *** | 0.0055 *** | 0.0047 *** | |
| (12.2451) | (12.2471) | (12.1492) | ||
| R-sq | 0.4283 | 0.0262 | 0.0781 | 0.3940 |
| Log-likelihood | 232.3453 | 355.1706 | 376.6624 |
Disclaimer/Publisher’s Note: The statements, opinions and data contained in all publications are solely those of the individual author(s) and contributor(s) and not of MDPI and/or the editor(s). MDPI and/or the editor(s) disclaim responsibility for any injury to people or property resulting from any ideas, methods, instructions or products referred to in the content. |
© 2025 by the authors. Licensee MDPI, Basel, Switzerland. This article is an open access article distributed under the terms and conditions of the Creative Commons Attribution (CC BY) license (https://creativecommons.org/licenses/by/4.0/).
Share and Cite
Wu, Y.; Du, B.; Xu, C.; Wei, S.; Yang, J.; Zhao, Y. Research on the Temporal and Spatial Distribution of Marginal Abatement Costs of Carbon Emissions in the Logistics Industry and Its Influencing Factors. Sustainability 2025, 17, 2839. https://doi.org/10.3390/su17072839
Wu Y, Du B, Xu C, Wei S, Yang J, Zhao Y. Research on the Temporal and Spatial Distribution of Marginal Abatement Costs of Carbon Emissions in the Logistics Industry and Its Influencing Factors. Sustainability. 2025; 17(7):2839. https://doi.org/10.3390/su17072839
Chicago/Turabian StyleWu, Yuping, Bohui Du, Chuanyang Xu, Shibo Wei, Jinghua Yang, and Yipeng Zhao. 2025. "Research on the Temporal and Spatial Distribution of Marginal Abatement Costs of Carbon Emissions in the Logistics Industry and Its Influencing Factors" Sustainability 17, no. 7: 2839. https://doi.org/10.3390/su17072839
APA StyleWu, Y., Du, B., Xu, C., Wei, S., Yang, J., & Zhao, Y. (2025). Research on the Temporal and Spatial Distribution of Marginal Abatement Costs of Carbon Emissions in the Logistics Industry and Its Influencing Factors. Sustainability, 17(7), 2839. https://doi.org/10.3390/su17072839


