Abstract
The Kuye River Basin, as an extremely important tributary of the Yellow River Basin, assessing its ecological environment’s response to human activities and natural environmental changes is of utmost importance. This can provide a critical reference for the protection of the ecological environment and sustainable development. This study selected major ecological and environmental issues in the study area, including soil erosion, water resources, and biodiversity, and constructed a comprehensive ecological sensitivity index using the spatial distance index model. Analyze the fluctuation intensity and trend of ecological sensitivity in the Kuye River Basin using grid coding models; use the Geodetector to analyze the main driving factors of its ecological sensitivity; and finally, adopt a method combining the “static” current state of ecological sensitivity with the “dynamic” trend of ecological sensitivity changes for ecological governance zoning. The results indicate the following: (1) the ecological sensitivity of the Kuye River Basin at different periods shows significant spatial differentiation, with a distribution pattern of low in the northwest and high in the central and southwestern areas in 2005, and a distribution pattern of low at both ends and high in the central area in 2020; (2) from 2005 to 2020, the overall ecological sensitivity showed a decreasing trend, with the area proportion of continuously declining regions accounting for 50.91%; (3) biodiversity is the main driving factor for the comprehensive ecological sensitivity of the Kuye River Basin; (4) the Kuye River Basin can be divided into four ecological zones: ecological environment protection area, ecological environment optimization area, ecological environment management area, and ecological environment governance area. Based on the characteristics of each region, it is recommended to adopt a differentiated ecological management plan to enhance the sustainability of its green development.
1. Introduction
Sustainable development is the foundation for human survival. From the beginning of the 21st century, with the continuous expansion of human production and living spaces, land development has entered a stage of high intensity [1]. The rapid transformation of land use that follows has led to the continuous compression of ecological space [2]. Moreover, due to the high-intensity human activities, the quality of the ecological environment has also been greatly affected, resulting in various ecological and environmental issues that affect human survival and development, such as global warming, land desertification, and the reduction in water resources and biodiversity [3,4]. This poses a greater challenge to the sustainable development of the ecological environment. Ecological sensitivity assessment is one of the important reference indicators for ecological environment governance and protection [5,6]. It can reflect the sensitivity of ecosystems to human activities and natural changes, providing an important reference for sustainable development in the region [7].
Research on ecological sensitivity first emerged in the 1960s [8], with early studies primarily focusing on larger scales such as national levels [9]. With the advancement of technology and the development of geographic information systems in recent years, the scope of research has expanded. Currently, studies on ecological sensitivity mainly concentrate on smaller scales, including provinces [10,11], cities [12,13], counties [14], and basins [15], wetlands [16,17], and tidal flats [13]. The content of these studies includes research on single ecological sensitivities such as soil erosion sensitivity [18,19] and desertification sensitivity [20,21], as well as research on comprehensive ecological sensitivity. For instance, Zhengyuan, Zhao et al. [22] conducted a comprehensive study on the ecological sensitivity of the Qinghai-Tibet Plateau region, starting from four single ecological sensitivities: land desertification, soil erosion, landslide disasters, and freeze–thaw erosion; Jing, Zhang et al. [23] carried out research on the comprehensive ecological sensitivity of the Qinling-Daba Mountains area, starting from three single ecological sensitivities: soil erosion, rocky desertification, and human activities. Ecological sensitivity has a variety of research methods, including mainly subjective weight determination methods such as the Analytic Hierarchy Process (AHP) and expert scoring method, as well as objective weighting methods such as the Entropy Method and Mean Square Deviation Decision Method [24,25]. Although there has been a wealth of achievements in research on ecological sensitivity, these achievements have provided some assistance in the restoration and protection of regional ecological environmental quality; there are still certain limitations and significant room for improvement. Currently, ecological sensitivity research is primarily focused on the status quo of a single year, with a lack of studies on the evolutionary characteristics over time scales [5]. In terms of research methods, although subjective weighting methods can take into account the specific conditions of the study area, they are prone to interference from human subjectivity. On the other hand, objective weighting methods are more objective but may lead to distorted weights due to their inability to consider the specific conditions of the study area. In recent years, the spatial distance index method, which has evolved from Euclidean principles, has become a new approach for calculating ecological sensitivity due to its objectivity, scientific nature, and comprehensiveness [26,27].
A watershed is a complex system composed of natural and socio-economic components, and its biological processes exhibit a certain degree of independence and systematicness [28]. Furthermore, using watersheds as research boundaries can better ensure the integrity of ecosystems compared to using administrative divisions as research boundaries. Although the area of the Kuye River Basin is not large, it is a typical representative among the basins in the Loess Plateau region and an extremely important tributary of the Yellow River Basin. It contributes a significant amount of sediment to the Yellow River Basin, and the region is also an important area for the ecological security barrier in northern China [29]. However, due to the rich resources in the Kuye River Basin, a large amount of human activities have emerged. Coupled with its complex terrain and naturally sparse vegetation, the probability of soil erosion occurring is relatively high, leading to poor stability and balance of the local ecosystem [30,31]. Although at present, there have been certain achievements in the study of ecological sensitivity in the Kuye River Basin; most of them are research studies on single ecological sensitivity [32,33]. There is less evaluation of comprehensive ecological sensitivity, and there is a lack of analysis on a long-term scale. Moreover, in terms of zoning management for ecological sensitivity, the delineation of protected areas is mainly based on a single “static” status quo or “dynamic” evolution, while there is relatively little research on the delineation of sensitive protected areas that combine “static” and “dynamic” aspects [9]. Based on this, this paper takes the Kuye River Basin as the study area, selects three indicators: soil erosion sensitivity, water resource sensitivity, and biodiversity sensitivity, adopts the spatial distance index method and grid coding model to comprehensively assess its ecological sensitivity from the perspectives of spatial distribution differentiation and temporal evolution characteristics, and adopts a method that combines the “static” current state of ecological sensitivity with the “dynamic” trend of ecological sensitivity changes to delineate sensitive areas for ecological management. Moreover, it proposes differentiated and reasonable ecological restoration strategies. The purpose is to understand the ecological conditions of the Kuye River Basin through the analysis of its ecological sensitivity, to provide a basis for the green and sustainable development of the basin, and at the same time, to offer significant reference and value for the prevention and management of ecological and environmental issues in the entire Loess Plateau region.
2. Overview of the Study Area and Data Sources
2.1. Overview of the Study Area
The Kuye River Basin is located between latitude of 38°23′ and 39°52′ N and longitude of 109°28′ and 110°52′ E (Figure 1). It is a tributary of the middle reaches of the Yellow River, originating from Bading Gully in Dongsheng, Ordos, Inner Mongolia Autonomous Region. The river flows southeastward through the regions of Ejin Horo and Fugu in Shaanxi and empties into the Yellow River at Shachatou Village in Shenmu. The main stream of the river is 242 km long with a basin area of 8706 km2. Economically, the basin is predominantly reliant on the secondary industry, particularly coal resources, which have led to the development of many large-scale coal mines and processing enterprises with high production and superior quality. However, these industries have also had a significant impact on the ecological and environmental quality of the Kuye River Basin [34].
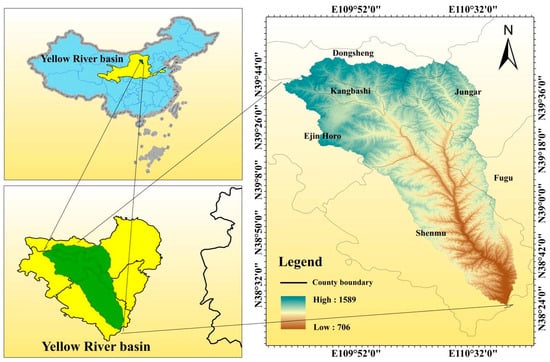
Figure 1.
Location map of the research area.
2.2. Data Sources and Processing
The administrative boundary data used in Figure 1 are derived from the National Geographic Information Resources Catalog Service System (http://www.webmap.cn) (visited on 24 October 2024); time is 2024. The boundary data of the Kuye River Basin are extracted by the ArcGIS 10.8 hydrological analysis module. The remaining data sources and their uses can be found in Table 1.

Table 1.
Data source and processing.
The above data can be obtained directly from the data source itself, except that the monthly potential evapotranspiration data are nc data, which need to be transformed into annual-scale data by an iterative model in ArcGIS software. For the convenience of subsequent calculations and analyses, all the above data have undergone pre-processing, including mask extraction, projection, and resampling. The projection coordinate system is uniformly set to WGS_1984_UTM_Zone_49N, and the spatial resolution is uniformly set to 100 m × 100 m.
3. Research Methodology
3.1. Basis for Selection of Indicators
The Kuye River Basin suffers from severe soil erosion [32], and due to its rich mineral resources and frequent human activities, there is a significant amount of construction land, especially industrial land, which has also led to increased pressure on water resources [31,35] and a decline in biodiversity, among other major ecological and environmental issues [36]. Based on the national standards such as “Technical Specifications for Ecological Environment Condition Assessment” (2015) and “Technical Specifications for Ecological Function Zoning (Draft for Comments)” (2014), combined with relevant literature [37], the ecological sensitivity assessment was conducted by selecting soil erosion sensitivity, water resource sensitivity, and biodiversity sensitivity, and an evaluation index system was constructed. Because this article mainly considers the current major ecological and environmental issues manifested in the study area when selecting the ecological sensitivity index, and human activities cannot be directly considered as an ecological and environmental issue, human activity data were excluded from the ecological sensitivity index assessment. The purpose of using the geographical detector in subsequent studies is to determine the main factors affecting the ecological sensitivity of the study area; therefore, human activity data were included when studying the driving factors of ecological sensitivity. The calculation results are evenly taken with sufficient sample points (a total of 4038 sample points) at 1.5 km × 1.5 km, and the multicollinearity test is carried out in SPSS 26 software. The results show that there is no multicollinearity in the single ecological sensitivity selected in this paper, and the construction of the ecological sensitivity index system is scientific and reasonable.
3.2. Indicator Factor Standardization Processing
Due to the different dimensions of each evaluation factor, which makes it impossible to directly participate in calculations, this study has conducted standardization processing on different evaluation factors [9] and applied the natural breakpoint method to grade and assign values to the sensitivity of each indicator after standardization processing (Table 2).
Table 2.
Statistical table for standardization and grading assignment of indicator factors.
Positive indicator standardization:
Negative indicator standardization:
In the above formula, represents the standardized value of the ith factor; is the original value of the ith factor; is the maximum value of ; and is the minimum value of .
3.3. Calculation of Single Ecological Sensitivity Index
The geometric mean method is a common mathematical method for calculating geometric mean values. By adopting this method, it is possible to comprehensively reflect the differences in regional ecological sensitivity based on the sensitivity levels of different factors of a single ecological sensitivity [38]. Therefore, this article employs this method to calculate the comprehensive index of soil erosion sensitivity, water resource sensitivity, and biodiversity sensitivity in the Kuye River Basin. The specific formula is as follows:
In the formula, represents the comprehensive index of single ecological sensitivity, and , , , are the classification values for each sensitivity factor. To facilitate the observation of sensitivity characteristics changing over time, the single ecological sensitivity results calculated for the years 2005, 2010, 2015, and 2020 were classified according to the natural breakpoint classification method of the initial study year 2005 into non-sensitivity, low sensitivity, medium sensitivity, high sensitivity, and extremely high sensitivity and were, respectively, assigned values of 1, 3, 5, 7, and 9. The higher the assigned numerical value, the higher the sensitivity it represents. The natural breakpoint classification method was adopted for classification primarily because of the various differences across the study area, which led to the selection of different ecological sensitivity indicator data. This resulted in there being no unified standard for the classification of ecological sensitivity. Moreover, the natural breakpoint classification method ensures the highest data similarity within the same category and maximizes the data difference between different categories. In the secondary indicator data of the above single ecological sensitivity data, the data on water source distance within the water resource data need to be obtained through a nearest neighbor analysis of the DEM data, while the water pollution risk data and the biodiversity richness index within the biodiversity sensitivity require separate calculations. The rest of the data can be obtained directly from the data sources themselves.
The formula for calculating water pollution risk is as follows:
In the formula, represents the degree of water pollution risk; is the type of land use within the project area; is the area of land use type ; and is the water pollution risk level of land use type (with 5 for construction land > 4 for cultivated land > 3 for unused land > 2 for grassland > 1 for forest land).
The formula for calculating the biological richness index is as follows [39]:
In which stands for biological richness index; is the normalization coefficient for biological richness; , , , , , and represent the areas of forest, grassland, water bodies, cropland, built-up land, and unused land, respectively; and Area refers to the sum of the areas being measured.
3.4. Comprehensive Ecological Sensitivity Calculation Method
According to relevant research [40], although the spatial distance index model is sensitive to outliers and computationally intensive, it has the advantages of wide applicability and low data requirements. Furthermore, its objectivity and scientific nature are very strong. Therefore, this study applied the spatial distance index model to create a comprehensive ecological sensitivity index for the Kuye River Basin. The spatial distance index method, based on Euclidean distance, is a way to calculate a composite index. It takes the minimum value of each individual ecological sensitivity index as the reference point and then calculates the distance between other points and this reference point. A shorter distance indicates a lower comprehensive ecological sensitivity index, meaning weaker ecological sensitivity; whereas a longer distance indicates a higher comprehensive ecological sensitivity index, meaning stronger ecological sensitivity. The formula for calculating the comprehensive ecological sensitivity index is as follows [40]:
where represents the comprehensive ecological sensitivity index; , , and were soil erosion sensitivity index, water resources sensitivity index, and biodiversity sensitivity index, respectively; and , , and are their minimum values, respectively. Due to the differences in many aspects of the study area, the selected ecological sensitivity indicator data are also different, which leads to the lack of a unified standard in the classification of comprehensive ecological sensitivity. Therefore, this article divides the comprehensive ecological sensitivity index calculated for the years 2005, 2010, 2015, and 2020 based on the results of the natural breakpoint classification method [1–4], [5–6], [6–7], [7–8], and [8–9] into five categories corresponding to five ecological sensitivity levels: non-sensitivity, low sensitivity, medium sensitivity, high sensitivity, and extremely high sensitivity.
3.5. Grid Coding Analysis
Grid coding models can not only effectively monitor changes in ecological sensitivity over long time series but also spatially visualize the status of these changes. Since it is achieved by assigning values to the data through gridding each year and then determining the changes by calculating the addition and subtraction of the data from the subsequent year to the previous year, the resulting data outcomes are very reliable. Therefore, this article adopts grid coding analysis based on related research [38] to study the temporal evolution characteristics of the Kuye River Basin. This study analyzed the comprehensive ecological sensitivity of the Kuye River Basin in the years 2005, 2010, 2015, and 2020, assigning codes from 1 to 5 to five levels of sensitivity from low to high and incorporating these data into the calculation model for the number and trend of changes in ecological sensitivity.
The formula for calculating the number of changes in ecological sensitivity is as follows:
In the formula, represents the number of changes in comprehensive ecological sensitivity from 2005 to 2020; represents the number of years; is the coding of the previous year, and is the coding of the following year. When = 0, it indicates no change has occurred; when ≠ 0, it signifies a change has taken place. Based on the intensity of ecological sensitivity fluctuations, the intensity of fluctuations is divided into three levels. Areas where = 0 are regions where ecological sensitivity has never changed, known as stable areas; areas where = 1 are regions where ecological sensitivity has changed once, known as low fluctuation areas; and areas where > 1 are regions where ecological sensitivity has changed multiple times, known as high fluctuation areas.
The formula for calculating the trend of ecological sensitivity changes is as follows:
where represents the coding for the comprehensive ecological sensitivity change trend from 2005 to 2020; , , , and refer to the comprehensive ecological sensitivity coding for the years 2005, 2010, 2015, and 2020, respectively.
3.6. Geographical Detector
Due to the wide applicability, ease of operation, lack of linear assumptions, and multi-domain applications of the Geodetector, it can be used as a statistical method for detecting spatial heterogeneity and exploring the driving effects of various factors, effectively calculating the driving contribution of each subsystem [41,42]. Therefore, this study employs the factor detector in the geographical detector to analyze the spatial differentiation drivers of the comprehensive ecological sensitivity in the Kuye River Basin using data on soil erosion, water resources, biodiversity, and human activities from the year 2020. The human activity data selected include population density and GDP raster data to construct indicators. The value in the factor detector represents the strength of the driving force, with a higher indicating a stronger driving force and vice versa.
3.7. Sensitive Control Zone
Adopt a method that combines “static” and “dynamic” approaches to delineate the ecological sensitivity protection areas in the Kuye River Basin. Assign values of 1, 3, 5, 7, 9, and 11 to the current comprehensive ecological sensitivity status and sensitivity change trends of the Kuye River Basin in 2020 for different types. The numerical values assigned to the current state of ecological sensitivity reflect its current sensitivity level, with higher numbers indicating a stronger sensitivity. The magnitude of the numerical values assigned to the trend of ecological sensitivity represents the direction of sensitivity change, with higher numbers indicating that the sensitivity is changing towards a more severe direction. Obtain the spatial management calculation results for ecological sensitivity through the overlay method of spatial raster data, and then use the natural breakpoint method to divide them into zones. The calculation formula is as follows [9]:
In this formula, represents the results of sensitivity zoning; is the current assignment of comprehensive ecological sensitivity; and is the assignment of the trend of ecological sensitivity change.
4. Result Analysis
4.1. Temporal and Spatial Variation Characteristics of Ecological Sensitivity
From a spatial perspective (Figure 2a), the ecological sensitivity of the Kuye River Basin in 2005 shows a distribution characteristic of being low in the northwest and higher in the central and southwestern areas. Non-sensitive regions in 2005 were mainly concentrated in the eastern part of Yijin Holo and the western part of Dongsheng, with slight distribution in the western part of Shenmu. Extremely high sensitivity was mainly concentrated in the central and southwestern areas of the Kuye River Basin. As time progressed to 2020, the ecological sensitivity in the northern and southern parts of the Kuye River Basin significantly decreased, showing a distribution characteristic with low sensitivity at both ends and higher sensitivity in the central area. The non-sensitive area in Shenmu, Fugu, and Kangbashi has significantly increased. In 2005, the non-sensitive area proportion of the Shenmu section of the Kuye River basin was only 3.91%, but by 2020, it had increased to 32.23%, making it the administrative region with the highest proportion increase in non-sensitive areas.

Figure 2.
(a) Spatial and temporal evolution of ecological sensitivity from 2005 to 2020. (b) The change in different sensitivity areas from 2005 to 2020. (c) The chord diagram of ecological sensitive area transfer at all levels from 2005 to 2020.
From the perspective of temporal changes (Figure 2b), the ecological sensitivity in 2020 was less than that in 2005, showing a continuous downward trend overall. The average value of ecological sensitivity decreased by 1.11, indicating that with the implementation of soil and water conservation measures and ecological restoration work in the Kuye River Basin, there has been an overall improvement in vegetation coverage within the basin. The structure of vegetation has been enhanced, effectively addressing issues such as soil erosion and the decline in biodiversity. Moreover, due to the significant increase in average precipitation from 260.637 mm in 2005 to 488.914 mm in 2020, the improvement in climatic conditions has also contributed to the enhancement of the ecological environment quality in the Kuye River Basin. Overall, the decrease in ecological sensitivity in the Kuye River Basin is the result of a combination of human and natural factors.
From the perspective of area proportion (Figure 2b), the areas of non-sensitivity and low sensitivity have shown a continuous upward trend and a significant increase in area from 2005 to 2020. The proportion of non-sensitive area increased from 8.79% in the initial year of the study to 31.59% in 2020, with the highest growth rate of 22.8%. In contrast, the areas of medium sensitivity, high sensitivity, and extremely high sensitivity have shown a continuous decline from 2005 to 2020, decreasing by 11.51%, 14.32%, and 7.38%, respectively. The conversion directions of areas with different sensitivity levels vary (Figure 2c); the area of non-sensitive regions in 2020 mainly came from the conversion of low- and medium-sensitivity areas in 2005, with conversions of 35.41% and 31.75%, respectively. The extremely sensitive areas in 2005 mainly converted into high- and medium-sensitivity areas in 2020, with conversions of 31.40% and 31.58%, respectively.
4.2. Ecological Sensitivity Fluctuations and Trend Characteristics
According to the grid coding model, the ecological sensitivity level was analyzed by the map, and the change intensity (Figure 3a), change trend (Figure 3b), and change intensity-change trend (Figure 3c) of the ecological sensitivity of the Kuye River Basin were obtained. The area with the highest proportion of high fluctuation in the Kuye River Basin is 59.79%, and most of the changing areas are regions where ecological sensitivity is decreasing. The area with continuous decreasing changes accounts for 41.47% of the high fluctuation area and is widely distributed within the basin. However, the reasons for the decline in these areas vary due to differences in natural and geographical environments. The decrease in ecological sensitivity in the northern part of the Kuye River Basin is mainly due to its good vegetation conditions, flat terrain, and the implementation of soil and water conservation measures over the years, which have led to a decrease in soil erosion sensitivity. In contrast, the decrease in ecological sensitivity in the southern part of the Kuye River Basin is due to increased precipitation and a reduction in the area of land use types with high water demand, such as cultivated land and construction land, resulting in a decrease in water resource sensitivity.
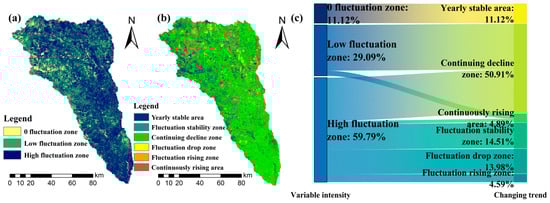
Figure 3.
(a) Ecological sensitivity fluctuation intensity. (b) The changing trend of ecological sensitivity. (c) Intensity-trend transition Sankey plot.
The area with no changes and those that have been stable for years accounts for the smallest proportion at 10.74%, mainly concentrated in the western part of Yijinhuoluo and the southern part of Dongsheng. Due to the different ecological conditions in various regions, the level of ecological sensitivity that remains stable throughout the year also varies. In the mid-west and southwest regions of the Kuye River Basin, there is a higher amount of precipitation, steep terrain, lower vegetation coverage, poor soil resistance to erosion, and not high biodiversity, which results in the ecological sensitivity remaining at a severe sensitivity level all year round. In contrast, the northwest region of the Kuye River Basin, due to its flat terrain and a larger area of high-coverage grasslands and forests, has an ecological sensitivity that remains at a mild sensitivity level all year round. The area with low variability accounts for 29.09%, but most of these areas show a continuous decline in variability, with only 10.22% of the low variability areas experiencing a continuous increase in ecological sensitivity. Overall, although the ecological sensitivity of the Kuye River Basin changes quite dramatically, most of the changes are downward. The areas with fluctuating increases and continuous increases only account for 9.48% of the total area of the basin, mainly distributed in the central-eastern part of Yijinhuoluo, the northwestern part of Kangbashi, and the western part of Zhungeer. These areas are rich in coal resources and have more industrial land, which has led to a decline in the quality of the ecological environment.
4.3. Comprehensive Analysis of Ecological Sensitivity Driving Factors
Using the Geodetector to analyze the driving capacity (q value) of different influencing factors on the comprehensive ecological sensitivity of the Kuye River Basin, the primary indicators are shown in Table 3, and the secondary indicators are shown in Table 4. The p-value for all factors is 0, and all have passed the significance test. Among them, human activity data selected population density and GDP raster data to construct the indicator system, and Formula (3) was used for calculation. The results show that the driving capacity q value of the primary indicators is biodiversity > soil erosion > water resources > human activities. Therefore, the main factor driving the spatial differences in comprehensive ecological sensitivity in the Kuye River Basin is biodiversity sensitivity. Meanwhile, in the secondary indicator driving capacity q-value, the biodiversity richness index and vegetation coverage index q-value rank among the top two. This indicates that vegetation coverage and biodiversity richness index not only directly affect biodiversity sensitivity but also indirectly influence the comprehensive ecological sensitivity. Over the years, the increase in vegetation coverage and biodiversity richness index in the Kuye River Basin has actively promoted the reduction in its comprehensive ecological sensitivity. In contrast, human activities have a relatively smaller impact on the comprehensive ecological sensitivity of the Kuye River Basin, mainly because the Kuye River Basin is vast and sparsely populated, and the limited human activities have not yet been sufficient to produce a significant impact on the comprehensive ecological sensitivity.
Table 3.
Geographic detector results of primary indicators in the Kuye River Basin.
Table 4.
Geographic detector results of secondary indicators in the Kuye River Basin.
4.4. Ecological Sensitivity Zoning
The results of the sensitivity control and management zones for the Kuye River Basin were obtained by combining the “static” status of ecological sensitivity in 2020 (Figure 4a) with the “dynamic” trends of ecological sensitivity changes (Figure 4b). The sensitivity zoning results for the Kuye River Basin are shown in Figure 4c, and the current status—zoning—trend transfer results are shown in Figure 4d. The results are divided into four categories: ecological environment protection areas, ecological environment optimization areas, ecological environment control areas, and ecological environment management areas, with area proportions of 8.95%, 52.75%, 31.02%, and 7.28%, respectively. Ecological and environmental protection areas are mainly concentrated in the northwest of the Yijinholo territory along the Kuye River Basin. Their “dynamic–static” scores are relatively low (2~4), as can be seen from Figure 4d; their current state of ecological sensitivity is basically non-sensitive and has been in a stable state for many years, with the overall quality of the ecological environment being relatively high. The natural restoration capacity of their ecosystem is strong, which is suitable for maintaining the current ecological environment policies. Priority should be given to nature conservation and appropriate monitoring work. Moreover, due to the high vegetation coverage and biodiversity in these areas, such regions should, in subsequent development, rely as much as possible on the natural resource conditions of the area and reasonably control the intensity of development. The ecological environment optimization area refers to regions with a score ranging from 6 to 8. These areas have the largest coverage and the widest distribution in the Kuye River Basin. Their current level of ecological sensitivity is relatively low, mainly consisting of non-sensitivity and low sensitivity. Although there is a certain risk of an increase in the trend of change, the proportion of areas with an increased risk is low. For these areas, it is necessary to strengthen monitoring efforts and, when necessary, implement some human interventions, while also paying attention to preventing issues such as soil erosion that could affect the quality of the ecological environment. The ecological environment control area, with a score range of 10~14, is mainly concentrated in the central and western, as well as the southwestern regions of the Kuye River Basin. The current ecological environment quality is poor, and the current state of ecological sensitivity is mainly composed of medium sensitivity and high sensitivity, with a certain trend of increasing risk. Therefore, it is essential to first stabilize its ecological sensitivity and strengthen the construction of the protection forest system, as well as enhance the restoration of grassland degradation. Moreover, due to the relatively scarce water resources in these areas, it is necessary to promote water-saving irrigation technologies to prevent further deterioration of the ecological environment quality due to a lack of water. The ecological environment management area refers to the region with a score range of 16~20. Such areas account for a small proportion, but the current ecological environment quality is very poor, with the current state of ecological sensitivity being generally high sensitivity and extremely high sensitivity, and the risk of further deterioration is very high. The vegetation coverage in these areas is poor, the vegetation structure is simple, biodiversity is low, and water resources are even scarcer. Moreover, due to the abundant resources in these areas, the environmental damage caused by irrational human development is severe. Therefore, it is essential to first address the ecological and environmental issues caused by human activities while optimizing the vegetation structure and strengthening afforestation, especially the planting of drought-resistant vegetation.

Figure 4.
(a) Current status of ecological sensitivity in 2020. (b) Trends in changes of ecological sensitivity. (c) Results of ecological sensitivity zoning. (d) Current status of ecological sensitivity—change trend—zoning results Sankey diagram.
5. Discussion
From the perspective of spatial distribution, the ecological sensitivity of the Kuye River Basin shows significant differences in different periods. In the initial year of the study, the areas with low ecological sensitivity were mainly concentrated in the northwest region. However, with changes in land use patterns [43] and an increase in precipitation, by 2020, the ecological sensitivity of the Kuye River Basin exhibited a spatial distribution characterized by low sensitivity at both ends and high sensitivity in the middle [44]. Nevertheless, the main factors influencing the ecological sensitivity at the northern and southern ends are quite different. The negative factors affecting the ecological sensitivity in the south are mainly natural ones, such as steep terrain, heavy rainfall, and surface runoff that more easily leads to soil erosion [45,46]. However, fortunately, the southern construction land is less, the original water resources are abundant, the vegetation coverage is high, and the water retention capacity is strong, so its water resource sensitivity and biodiversity sensitivity are relatively low. The negative factors affecting the ecological sensitivity in the northern region are mainly anthropogenic. Due to flat terrain and abundant coal resources, the northern area has a large amount of industrial land use and human activities, which further increases the pressure on water resources. The sensitivity of water resources is relatively high [47]. Moreover, due to the impact of human industrial activities, the sensitivity of biodiversity is also high [29,33]. However, fortunately, its gentle slopes, small topographic undulations, low precipitation, and high vegetation coverage make soil erosion relatively difficult [48,49].
From a temporal perspective, the ecological sensitivity of the Kuye River Basin from 2005 to 2020 generally showed a decreasing trend, which is consistent with the research in the literature [29]. This is mainly due to a series of ecological governance and restoration projects implemented in the last century, including comprehensive management of small watersheds, returning farmland to forests and grasslands, and afforestation. These measures have significantly increased the vegetation coverage of the Kuye River Basin, effectively restored the ecosystem, and effectively alleviated environmental issues such as soil erosion and the rapid decline in biodiversity in the region [37,50]. Although the overall trend of integrated ecological sensitivity in the Kuye River Basin showed a decline during the study period, there was still an increasing trend in the integrated ecological sensitivity in some areas in the northwest and northeast of the Kuye River Basin. This is mainly due to the concentration of population and more industrial activities in these areas. To meet the growing land needs for population growth and industrial exploitation, the expansion of construction land has further increased the pressure on the ecological environment, leading to vegetation degradation in these regions [51,52]. Given this, future ecological governance and conservation efforts need to focus on the land use and construction conditions in these areas to avoid causing more severe damage to the ecological environment due to economic development.
From the results of the geographical detector, the main factor influencing the ecological sensitivity of the Kuye River Basin is biodiversity sensitivity, which is quite similar to the findings of studies [53,54]. Moreover, the spatial differences and temporal variations of biodiversity sensitivity and comprehensive ecological sensitivity are quite consistent. The data on biodiversity sensitivity are calculated based on vegetation coverage and biological richness index; hence, the distribution and changes in vegetation coverage and biological richness index have a significant impact on the distribution and changes in ecological sensitivity. Areas with lower ecological sensitivity typically have higher vegetation coverage and biological richness. This is because as vegetation coverage increases, it plays a role in inhibiting soil erosion, alleviating soil and water loss, and land desertification [55]. Furthermore, the increase in vegetation coverage and biological richness index not only optimizes the ecosystem but also promotes the development of biodiversity, thereby enhancing the stability of the ecosystem and reducing its ecological sensitivity [56,57]. In human activities, whether it is a primary or secondary indicator, the q-value in the factor detection results being less than 0.1 indicates a smaller impact on the comprehensive ecological sensitivity of the Kuye River Basin. In fact, the impact of human activities on ecological sensitivity is not directly reflected in the significant effects of population density and gross domestic product (GDP), but rather more through indirectly exerting influence by changing the coverage of surface vegetation and the ways land is used.
From the partition results, most areas of the Kuye River Basin are located within the ecological environment protection areas and ecological environment optimization areas. The vegetation coverage in these areas is relatively high, and the water resources are quite abundant. Moreover, the risk of soil erosion in these places is relatively low. This results in a lower current state of ecological sensitivity in the region, and they basically maintain a stable state. Therefore, the main governance measures for these areas do not need to be overly complex. The main focus of work can be placed on the continuous monitoring of these areas. Monitoring work includes regular assessments of vegetation coverage, water quality testing, and tracking of soil erosion conditions [58]. Through these monitoring activities, potential ecological problems can be identified in a timely manner, and corresponding preventive measures can be taken. In addition, the accumulation of monitoring data is crucial for assessing the long-term ecological health of the protected and optimized zones. They provide a scientific basis for the development of more effective protection strategies [59].
For the ecological environment control area, due to its relatively poor current ecological environment status and certain risks of deterioration, the main governance lies in control. First and foremost, it is necessary to stabilize the current ecological sensitivity status and prevent it from further increasing. This requires the implementation of a series of strict ecological protection measures. For instance, restricting development activities within the area to reduce human disturbances to the ecological environment while strengthening ecological restoration projects such as afforestation and wetland restoration to enhance the regional ecological service functions. Moreover, it is essential to establish a more rigorous monitoring network to conduct real-time surveillance of ecological environment changes, ensuring timely detection and management at the early stages of ecological issues.
Although the area of the ecological environment management area is not large, the sensitivity of its ecological environment is very poor, and the degree of deterioration is still increasing. Due to the abundance of resources in these areas and the frequent human industrial activities, the environmental damage in these areas is severe, and the difficulty of management is great. Therefore, comprehensive management should be carried out, long-term management plans should be formulated, and the focus of ecological risk prevention and control should be placed on controlling the spread of high ecological sensitivity areas to avoid adverse effects on human production and living areas. First of all, pollution sources must be controlled, and penalties for pollution violations should be increased. Secondly, the promotion of eco-friendly agriculture and forestry should be carried out to reduce over-exploitation of resources and promote ecological self-repair. In addition, increasing investment in science and technology should be used to carry out ecological restoration and pollution control with modern technology, improving management efficiency. At the same time, the vegetation structure should be improved, and natural grassland degradation and grassland management projects should be built in the agro-pastoral ecotone. Through scientific and reasonable vegetation restoration and improvement measures, the ability of soil to retain water and nutrients should be enhanced, and the stability and biodiversity of the ecosystem should be improved. This can not only effectively prevent land degradation and desertification but also provide high-quality forage resources for local animal husbandry, promoting the coordinated development of agriculture and the ecological environment [60].
Although this study has constructed a comprehensive ecological sensitivity spatial visualization assessment model based on GIS from the perspectives of land resources, water resources, and biological resources to evaluate the ecological sensitivity of regional “static” spatial differences and “dynamic” temporal differences and has adopted a combined “static and dynamic” method to delineate sensitivity control areas for the Kuye River Basin, there are still deficiencies in analyzing spatial differences at the micro detail level. Due to the complexity of ecological sensitivity itself, as well as the interactions between assessment factors and the interplay among processes, which involves multiple fields such as ecology, environmental science, agriculture, economics, and society, it requires the integration of different fields, disciplines, and methods and a careful study of every detail to seek solutions. Furthermore, our research on the spatiotemporal evolution characteristics of the Kuye River Basin remains superficial, lacking studies on internal driving factors. Therefore, future research should pay more attention to interdisciplinary integration, collect more comprehensive data, build a more comprehensive indicator system, understand and predict the dynamic transitions of these systems, and establish a model that can fully consider various influencing factors. This will help improve our understanding of complex systems, thereby better providing new insights for building an ecological civilization in China under the guidance of the concept of ecological priority and green development. Through the analysis of its differentiated laws, it will provide a scientific basis for formulating territorial spatial planning and macro-ecological comprehensive improvement policies.
6. Conclusions
- (1)
- The ecological sensitivity of the Kuye River Basin shows significant spatial differentiation in different periods. Specifically, in 2005, the sensitivity was lower in the northwest and higher in the central and southwestern parts. By 2020, the spatial distribution of ecological sensitivity was characterized by lower values at both the northern and southern ends and higher values in the central part. From 2005 to 2020, the average ecological sensitivity of the Kuye River Basin decreased by 1.11, indicating that the ecological environment quality within the basin has been effectively improved, while greatly enhancing the possibility of its sustainable development.
- (2)
- Most areas of the Kuye River Basin are in the ecological sensitivity fluctuation zone, with low fluctuation and high fluctuation areas accounting for 29.09% and 59.79%, respectively. However, the majority of fluctuations are downward fluctuations, with only 9.48% of the area experiencing upward fluctuations. The area of perennial stable zones accounts for 11.12%, but due to differences in the ecological environment, the ecological sensitivity of the stable zones still varies significantly.
- (3)
- From the results of Geodetector, biodiversity is the main influencing factor of spatial differences and sustainable development in the Kuye River Basin. In the future ecological protection and management of the Kuye River Basin, attention should be paid to the coverage of vegetation growth and the variety of species, but at the same time, soil erosion and water resource conditions should not be neglected.
- (4)
- The Kuye River Basin ecological environment protection area, ecological environment optimization area, ecological environment control area, and ecological environment management area account for 8.95%, 52.75%, 31.02%, and 7.28% of the area, respectively. Different regions have distinct ecological and environmental issues, leading to various zoning characteristics. To achieve sustainable development in the area, targeted ecological governance strategies should be implemented in subsequent management.
Author Contributions
Y.Y. is responsible for conceptualization; X.D. is responsible for the methodology; Y.W. (Yihan Wu) is responsible for verification; F.Q. is responsible for resources; Y.W. (Yang Wang) is responsible for processing data visualization and data analysis and writing the original draft. All authors have read and agreed to the published version of the manuscript.
Funding
The funds mainly come from the following projects. The title of the project is “Evolution of Ecosystem Structure and Function and its Impact on Water and Sediment Processes in Watersheds”. (Funding Number: 2022EEDSKJXM005-01., Funder: Agricultural, Livestock and Water Resources Business Development Centre, Kangbashi District, Ordos City, China).
Institutional Review Board Statement
Not applicable.
Informed Consent Statement
Not applicable.
Data Availability Statement
Data are contained within the article.
Conflicts of Interest
The authors declare no conflicts of interest.
References
- Lisetskii, F.N.; Buryak, Z.A. Runoff of water and its quality under the combined impact of agricultural activities and urban development in a small river basin. Water 2023, 15, 2443. [Google Scholar] [CrossRef]
- Cochran, F.; Daniel, J.; Jackson, L.; Neale, A. Earth observation-based ecosystem services indicators for national and subnational reporting of the sustainable development goals. Remote Sens. Environ. 2020, 244, 111796. [Google Scholar] [CrossRef]
- Ahmed, Z.; Ahmad, M.; Rjoub, H.; Kalugina, O.A.; Hussain, N. Economic growth, renewable energy consumption, and ecological footprint: Exploring the role of environmental regulations and democracy in sustainable development. Sustain. Dev. 2022, 30, 595–605. [Google Scholar] [CrossRef]
- Ligate, E.J.; Chen, C.; Wu, C. Evaluation of tropical coastal land cover and land use changes and their impacts on ecosystem service values. Ecosyst. Health Sustain. 2018, 4, 188–204. [Google Scholar] [CrossRef]
- Bergengren, J.C.; Waliser, D.E.; Yung, Y.L. Ecological sensitivity: A biospheric view of climate change. Clim. Change 2011, 107, 433–457. [Google Scholar] [CrossRef]
- Jin, X.; Wei, L.; Wang, Y.; Lu, Y. Construction of ecological security pattern based on the importance of ecosystem service functions and ecological sensitivity assessment: A case study in fengxian county of jiangsu province, china. Environ. Dev. Sustain. 2021, 23, 563–590. [Google Scholar] [CrossRef]
- Marcos-Martinez, R.; Bryan, B.A.; Connor, J.D.; King, D. Agricultural land-use dynamics: Assessing the relative importance of socioeconomic and biophysical drivers for more targeted policy. Land. Use Policy 2017, 63, 53–66. [Google Scholar] [CrossRef]
- Kumar, K.K.; Parikh, J. Indian agriculture and climate sensitivity. Glob. Environ. Change 2001, 11, 147–154. [Google Scholar]
- Li, Z.Y.; Wei, W.; Zhou, L.; Liu, C.F.; Guo, Z.C.; Pang, S.F.; Zhang, J. Spatio-temporal evolution characteristies of terrestrial ecological sensitivity in China. Acta Geogr. Sin. 2022, 77, 150–163. [Google Scholar]
- Dai, X.; Li, Z.; Lin, S.; Xu, W. Assessment and zoning of eco-environmental sensitivity for a typical developing province in china. Stoch. Environ. Res. Risk Assess. 2012, 26, 1095–1107. [Google Scholar]
- Yilmaz, F.C.; Zengin, M.; Tekin Cure, C. Determination of ecologically sensitive areas in denizli province using geographic information systems (gis) and analytical hierarchy process (ahp). Environ. Monit. Assess. 2020, 192. [Google Scholar] [CrossRef]
- Zhang, Q.; Wu, Y.; Zhao, Z. Identification of harbin ecological function degradation areas based on ecological importance assessment and ecological sensitivity. Sustainability 2024, 16, 6763. [Google Scholar] [CrossRef]
- Shi, Y.; Li, J.; Xie, M. Evaluation of the ecological sensitivity and security of tidal flats in shanghai. Ecol. Indic. 2018, 85, 729–741. [Google Scholar] [CrossRef]
- Huang, F.M.; Yang, G.Z.; Su, C.X.; Liu, B.C.; Li, Y.J.; Peng, B. Ecological sensitivity assessment based on gis and analytichierarchy process:case study of longnan county in jiangxi province. J. Nanchang Univ. (Nat. Sci.) 2019, 43, 599–605. [Google Scholar] [CrossRef]
- McCluney, K.E.; Poff, N.L.; Palmer, M.A.; Thorp, J.H.; Poole, G.C.; Williams, B.S.; Williams, M.R.; Baron, J.S. Riverine macrosystems ecology: Sensitivity, resistance, and resilience of whole river basins with human alterations. Front. Ecol. Environ. 2014, 12, 48–58. [Google Scholar] [CrossRef]
- Xu, Q.W. Research on wetland management based on ecological sensitivity evaluation: A case study of xixi national wetland park. Chin. Landsc. Archit. 2024, 40, 11–14. [Google Scholar] [CrossRef]
- Lu, M.; Mu, H.G.; Tan, L.; Yi, Z.K.; Wang, H.; Li, W.Y.; Kong, Y.F. Ecological sensitivity assessment of jixi national wetland park based on gls. Period. Ocean. Univ. China 2022, 52, 95–103. [Google Scholar] [CrossRef]
- Choudhury, B.U.; Nengzouzam, G.; Islam, A. Evaluation of climate change impact on soil erosion in the integrated farming system based hilly micro-watersheds using revised universal soil loss equation. Catena 2022, 214, 106306. [Google Scholar]
- Prashanth, M.; Kumar, A.; Dhar, S.; Verma, O.; Rai, S.K.; Kouser, B. Land use/land cover change and its implication on soil erosion in an ecologically sensitive himachal himalayan watershed, northern india. Front. For. Glob. Change 2023, 6, 1124677. [Google Scholar] [CrossRef]
- Salvati, L.; Bajocco, S. Land sensitivity to desertification across italy: Past, present, and future. Appl. Geogr. 2011, 31, 223–231. [Google Scholar] [CrossRef]
- Ait Lamqadem, A.; Pradhan, B.; Saber, H.; Rahimi, A. Desertification sensitivity analysis using medalus model and gis: A case study of the oases of middle draa valley, morocco. Sensors 2018, 18, 2230. [Google Scholar] [CrossRef]
- Zhao, Z.Y.; Zhang, Y.L.; Li, T.; Lv, Y.H.; Wang, C.; Wu, X. Comprehensive evaluation and spatio-temporal variations of ecological sensitivity on the oinghai-tibet plateau based on spatial distance index. Acta Ecol. Sin. 2022, 42, 7403–7416. [Google Scholar]
- Zhang, J.; Qin, G.W.; Su, X.M.; Xu, Z.R.; Cheng, S.K. Evaluation of ecological sensitivity and its topographic gradient characteristics in qinling-bashan mountains. J. Soil. Water Conserv. 2024, 38, 332–342, 352. [Google Scholar] [CrossRef]
- Yazdani, H.; Baneshi, M.; Yaghoubi, M. Techno-economic and environmental design of hybrid energy systems using multi-objective optimization and multi-criteria decision making methods. Energy Convers. Manag. 2023, 282, 116873. [Google Scholar] [CrossRef]
- Kumar, M.; Kalra, N.; Singh, H.; Sharma, S.; Rawat, P.S.; Singh, R.K.; Gupta, A.K.; Kumar, P.; Ravindranath, N.H. Indicator-based vulnerability assessment of forest ecosystem in the indian western himalayas: An analytical hierarchy process integrated approach. Ecol. Indic. 2021, 125, 107568. [Google Scholar]
- Wei, W.; Li, Z.; Xie, B.; Zhou, J.; Guo, Z. Spatial distance-based integrated evaluation of environmentally sensitivity for ecological management in northwest china. Ecol. Indic. 2020, 118, 106753. [Google Scholar] [CrossRef]
- Wei, W.; Zhang, H.; Ma, L.; Wang, X.; Guo, Z.; Xie, B.; Zhou, J.; Wang, J. Reconstruction and application of the temperature-vegetation-precipitation drought index in mainland china based on remote sensing datasets and a spatial distance model. J. Environ. Manag. 2022, 323, 116208. [Google Scholar] [CrossRef]
- Shekar, P.R.; Mathew, A. Morphometric analysis of watersheds: A comprehensive review of data sources, quality, and geospatial techniques. Watershed Ecol. Environ. 2024, 6, 13–25. [Google Scholar]
- Yan, S.; Yuan, Y.; Liu, L.; Wang, S.; Li, M. A study of the coupling relationship between industry–economy–population and habitat quality in the kuye river basin. Sustainability 2024, 16, 9495. [Google Scholar] [CrossRef]
- He, Y.; Mu, X.; Jiang, X.; Song, J. Runoff variation and influencing factors in the kuye river basin of the middle yellow river. Front. Environ. Sci. 2022, 10, 877535. [Google Scholar]
- Zhang, M.; Wang, J.; Zhou, R. Sustainable effect of coal mining on hydrological drought risk: A case study on kuye river basin, china. Nat. Hazards 2020, 103, 2929–2943. [Google Scholar] [CrossRef]
- He, Y.; Chen, Y.C.; Ehab, T.A.; Wang, J.; Zhao, G.J.; Jiang, T. Spatio-temporal pattern and trend prediction of soil erosion in kuve river basin. J. Soil. Water Conserv. 2024, 38, 10–19. [Google Scholar] [CrossRef]
- Wu, Y.; Qin, F.; Li, L.; Dong, X. Exploring landscape ecological risk with human activity intensity and correlation in the kuye river basin. Front. Ecol. Evol. 2024, 12, 1409515. [Google Scholar] [CrossRef]
- Xie, X.; Bai, X. Ecological security assessment and driving factor analysis of kuye river basin based on structural equation model. J. Ecol. Rural Environ. 2023, 39, 864–873. [Google Scholar]
- Zhang, Z.; Chen, L.; Zhang, F.; Qian, J.; Feng, Y.; Han, S.; Dai, F. Evolution characteristics and attribution analysis of runoff in the coal mining area in northwest china: A case study of the kuye river basin. Water Sci. Technol. Water Supply 2024, 24, 2999–3014. [Google Scholar]
- Wei, L.H.B.; Shi, P.; Wei, Y.; Li, N.; Chen, A.; Li, S.L.; Sun, W.Y. Analysis of ecosystem service function changes and their driving factors in the kuye river basin. J. Soil. Water Conserv. 2024, 38, 222–235. [Google Scholar] [CrossRef]
- Liu, Q.; Yu, F.; Mu, X. Evaluation of the ecological environment quality of the kuye river source basin using the remote sensing ecological index. Int. J. Environ. Res. Public Health 2022, 19, 12500. [Google Scholar] [CrossRef]
- Deng, X.H.; Song, Y.L.; Li, Z.X.; Zhao, T.T. Evolution pattern of terrestrial ecological sensitivity in the hexi region and its zoning governance. J. Desert Res. 2023, 43, 232–240. [Google Scholar]
- Makar-Limanov, L. Centralizers of rank one in the first weyl algebra. SIGMA 2021, 17, 052. [Google Scholar] [CrossRef]
- Qu, Y.; Rao, L.Y. Spatio-temporal differentiation characteristics of ecological sensitivity in the middle reaches of the yellow river. Environ. Sci. 2024, 1–16. [Google Scholar] [CrossRef]
- Zhang, Z.; Song, Y.; Wu, P. Robust geographical detector. Int. J. Appl. Earth Obs. Geoinf. 2022, 109, 102782. [Google Scholar] [CrossRef]
- Ngabire, M.; Wang, T.; Liao, J.; Sahbeni, G. Quantitative analysis of desertification-driving mechanisms in the shiyang river basin: Examining interactive effects of key factors through the geographic detector model. Remote Sens. 2023, 15, 2960. [Google Scholar] [CrossRef]
- Yang, Z.Y.; Niu, J.Z.; Fan, D.X.; Zhang, Z.P.; Du, Z.; Zhao, C.G. Response and prediction of runoff to land use change in kuye river basin based on swat and plus models. J. Soil Water Conserv. 2024, 38, 289–299. [Google Scholar] [CrossRef]
- An, M.; Wei, Y.Q.; He, W.J.; Huang, J.; Fang, X.; Song, M.F.; Wang, B. Impact of climate change and human activities on the ecological sensitivity of the yangtze river economic belt. Environ. Sci. 2024, 45, 5833–5843. [Google Scholar] [CrossRef]
- Gao, H.Y.; Wang, X.; Yang, Z.Q.; Xue, Z.H. Research progress on soil erosion and ecological restoration in kuye river basin of the middle yellow river. J. Inn. Mong. Univ. (Nat. Sci. Ed.) 2024, 55, 329–336. [Google Scholar] [CrossRef]
- Wang, X.; Liu, G.; Xiang, A.; Xiao, S.; Lin, D.; Lin, Y.; Lu, Y. Terrain gradient response of landscape ecological environment to land use and land cover change in the hilly watershed in south china. Ecol. Indic. 2023, 146, 109797. [Google Scholar] [CrossRef]
- Zhang, J.K.; Wang, J.P.; Shi, J.S. Attribution analysis of water-sediment variation under the influence of climate change and human activities in the kuye river basin. Hydrogeol. Eng. Geol. 2024, 51, 47–59. [Google Scholar] [CrossRef]
- Zhang, J.; Ren, Z.Y. Spatiotemporal pattern and terrain gradient effect of land use change in qinling-bashan mountains. Trans. Chin. Soc. Agric. Eng. 2016, 32, 250–257. [Google Scholar] [CrossRef]
- Appels, W.M.; Bogaart, P.W.; van der Zee, S.E.A.T. Surface runoff in flat terrain; How field topography and runoff generating processes control hydrological connectivity. J. Hydrol. 2016, 534, 493–504. [Google Scholar] [CrossRef]
- Wu, Y.; Qin, F.; Li, L.; Dong, X. Construction and optimisation of watershed scale ecological network: A case study of kuye river basin. Front. Environ. Sci. 2024, 12, 1364568. [Google Scholar] [CrossRef]
- Mei, Y.S.; Tao, Z.L.; Min, Z.Y. Base flow change and its climatic lmpact factors analysis in hanjiang river basin. Water Resour. Power 2022, 40, 14–18. [Google Scholar] [CrossRef]
- Gou, M.M.; Liu, C.F.; Li, L.; Xiao, W.F.; Ouyang, S.; Wang, N.; Hu, J.W. Spatiotemporal variations and scenario simulation of habitat quality in a typical basin of the three gorges reservoir area. Chin. J. Ecol. 2023, 42, 180–189. [Google Scholar] [CrossRef]
- Li, F.; Jia, X.; Zhao, Y.H.; Ao, Y.; Han, L.; Liu, Z.; Ding, S.Y. Evolutionary pattern and driving forces of ecological sensitivity in the loess plateau using dpslr model. Trans. Chin. Soc. Agric. Eng. 2023, 39, 241–251. [Google Scholar]
- Zhang, L.X.; Fan, J.W.; Zhang, H.Y.; Zhou, D.C. Spatial-temporal variations and their driving forces of the ecological vulnerability in the loess plateau. Environ. Sci. 2022, 43, 4902–4910. [Google Scholar] [CrossRef]
- Li, Y.Z.; Feng, Z.Z.; Li, L.; An, D.; Wang, W.J.; Liu, M. Assessment of ecological sensitivity of terrestrial ecosystemin the yellow river basin based on GIS. Environ. Sci. Technol. 2021, 44, 219–225. [Google Scholar] [CrossRef]
- Yang, Y.; Tian, Y.; Zhang, Q.; Tao, J.; Huang, Y.; Gao, C.; Lin, J.; Wang, D. Impact of current and future land use change on biodiversity in nanliu river basin, beibu gulf of south china. Ecol. Indic. 2022, 141, 109093. [Google Scholar]
- Gould, W. Remote sensing of vegetation, plant species richness, and regional biodiversity hotspots. Ecol. Appl. 2000, 10, 1861–1870. [Google Scholar]
- Mehta, L.; Leach, M.; Scoones, I. Environmental governance in an uncertain world. IDS Bull. 2025, 56, 68–76. [Google Scholar]
- Tokunaga, M. Environmental governance in russia: The ‘closed’pathway to ecological modernization. Environ. Plan. A 2010, 42, 1686–1704. [Google Scholar] [CrossRef]
- Bennett, N.J.; Satterfield, T. Environmental governance: A practical framework to guide design, evaluation, and analysis. Conserv. Lett. 2018, 11, e12600. [Google Scholar]
Disclaimer/Publisher’s Note: The statements, opinions and data contained in all publications are solely those of the individual author(s) and contributor(s) and not of MDPI and/or the editor(s). MDPI and/or the editor(s) disclaim responsibility for any injury to people or property resulting from any ideas, methods, instructions or products referred to in the content. |
© 2025 by the authors. Licensee MDPI, Basel, Switzerland. This article is an open access article distributed under the terms and conditions of the Creative Commons Attribution (CC BY) license (https://creativecommons.org/licenses/by/4.0/).