1. Introduction
The concept of Product-as-a-Service (PaaS) represents a paradigm shift in traditional product consumption, transitioning from ownership-based models to service-oriented leasing models [
1,
2]. This shift aligns with broader trends in the circular economy and sustainability, emphasizing the reuse and/or repair of products, collecting end-of-life products, recycling resulting in the minimization of waste, and responsible resource management [
3].
The supply–demand balance in PaaS markets necessitates managing risks and uncertainties arising from variability, economic fluctuations, and equipment failures, all of which significantly impact both providers and customers [
4]. Providers face the dual challenge of ensuring profitability while maintaining the lifecycle of leased products, whereas customers need to minimize their costs without compromising access to essential equipment. In such an environment, achieving an equilibrium between leasing offers and requests for quotations becomes a critical objective [
5,
6].
This paper addresses the need for a comprehensive framework to balance supply and demand in PaaS markets, with a focus on three key pillars:
Profitability—ensuring providers achieve sustainable margins by optimizing pricing strategies and operating costs.
Cost optimization—enabling customers to effectively manage expenses while maintaining access to the required equipment.
Sustainability—promoting practices that extend product life cycles, increase material efficiency, and reduce environmental impact.
The first two of these pillars, focusing on the provider and customer perspectives, emphasize their efforts to achieve the highest profit and lowest cost, respectively. The third pillar, focusing on win-win conditions in the solution space that satisfies the provider and customer, accentuates efforts to develop models of their market to enable the reduction in environmental impact. Studies addressing issues in the field of financial performance of the PaaS market perceived from the perspective of the provider and the user (customer), collected in the results of our previous research [
7,
8], highlighted the need to develop an easy-to-use and flexible financial assessment model helping practitioners generate profitable solution scenarios for potential PaaS configurations and the financial profitability factors that determine them. In this context, this article fills the gap related to the lack of a model (framework) enabling the assessment of the financial performance and viability of PaaS leading to the supply–demand balance in this market. In other words, the adopted framework aims to model the interrelationships between providers and consumers, implementing a declarative modeling formalism that facilitates the exploration of different leasing scenarios, helping interested parties to define optimal strategies balancing the three main pillars: profitability, costs, and sustainability.
The contribution of this paper is three-fold: (1) a prototype of a declarative model for assessing PaaS market balance, (2) an algorithm for determining leasing offers and requests for quotation balancing the PaaS market, and (3) an assessment of the scalability of the proposed approach on the example of a selected case (evaluation of applicability in real-world scenarios).
Achieving the above objectives enables answering, among others, the following research questions: What impact does the development of new technologies implemented in leased devices have on the PaaS market balance? What compatibility conditions should leasing offers and requests for quotation meet? What are the strategies for finding a trade-off between the providers’ profit and the customers’ costs?
Integration of the providers’ and customers’ business goals into a unified decision-making structure ensures a more comprehensive reflection of real-world scenarios taking into account various factors and conditions. Hence, the necessity of adopting a holistic approach to the problem becomes evident. This paper restricts the factors influencing the trade-off to the providers’ equipment acquisition costs, maintenance costs for leased equipment, rental costs incurred by the customer, costs associated with outsourcing equipment outside the agreed leasing offer, and the scenario in which equilibrium applies to a market with a single provider and customer [
9]. This does not mean, however, that the proposed approach cannot be extended to a more complex model involving several providers and several customers and additional costs incurred by the provider (purchasing, holding, ordering, screening and repairing, and recycling costs) and the customer (employment, staff training, allocation of storage areas, and ongoing maintenance of leased equipment).
To validate the framework’s practical applicability, a case study was conducted involving a selection of devices characterized by their rental prices and failure rates. The study also incorporated customer expectations regarding the types and quantities of devices needed, as well as their budget constraints. Computational experiments were performed to evaluate the framework’s effectiveness in real-world scenarios, demonstrating its potential to guide decision making in PaaS markets.
The remainder of this study is structured as follows:
Section 2 provides a review of related work in PaaS markets, supply–demand management, and sustainability.
Section 3 introduces the proposed framework, including its key components and modeling methodology.
Section 4 describes the case study setup and presents the results of the computational experiments.
Section 5 discusses the implications of the findings and concludes the paper with future research directions.
3. Framework and Modeling Methodology
3.1. Problem Formulation
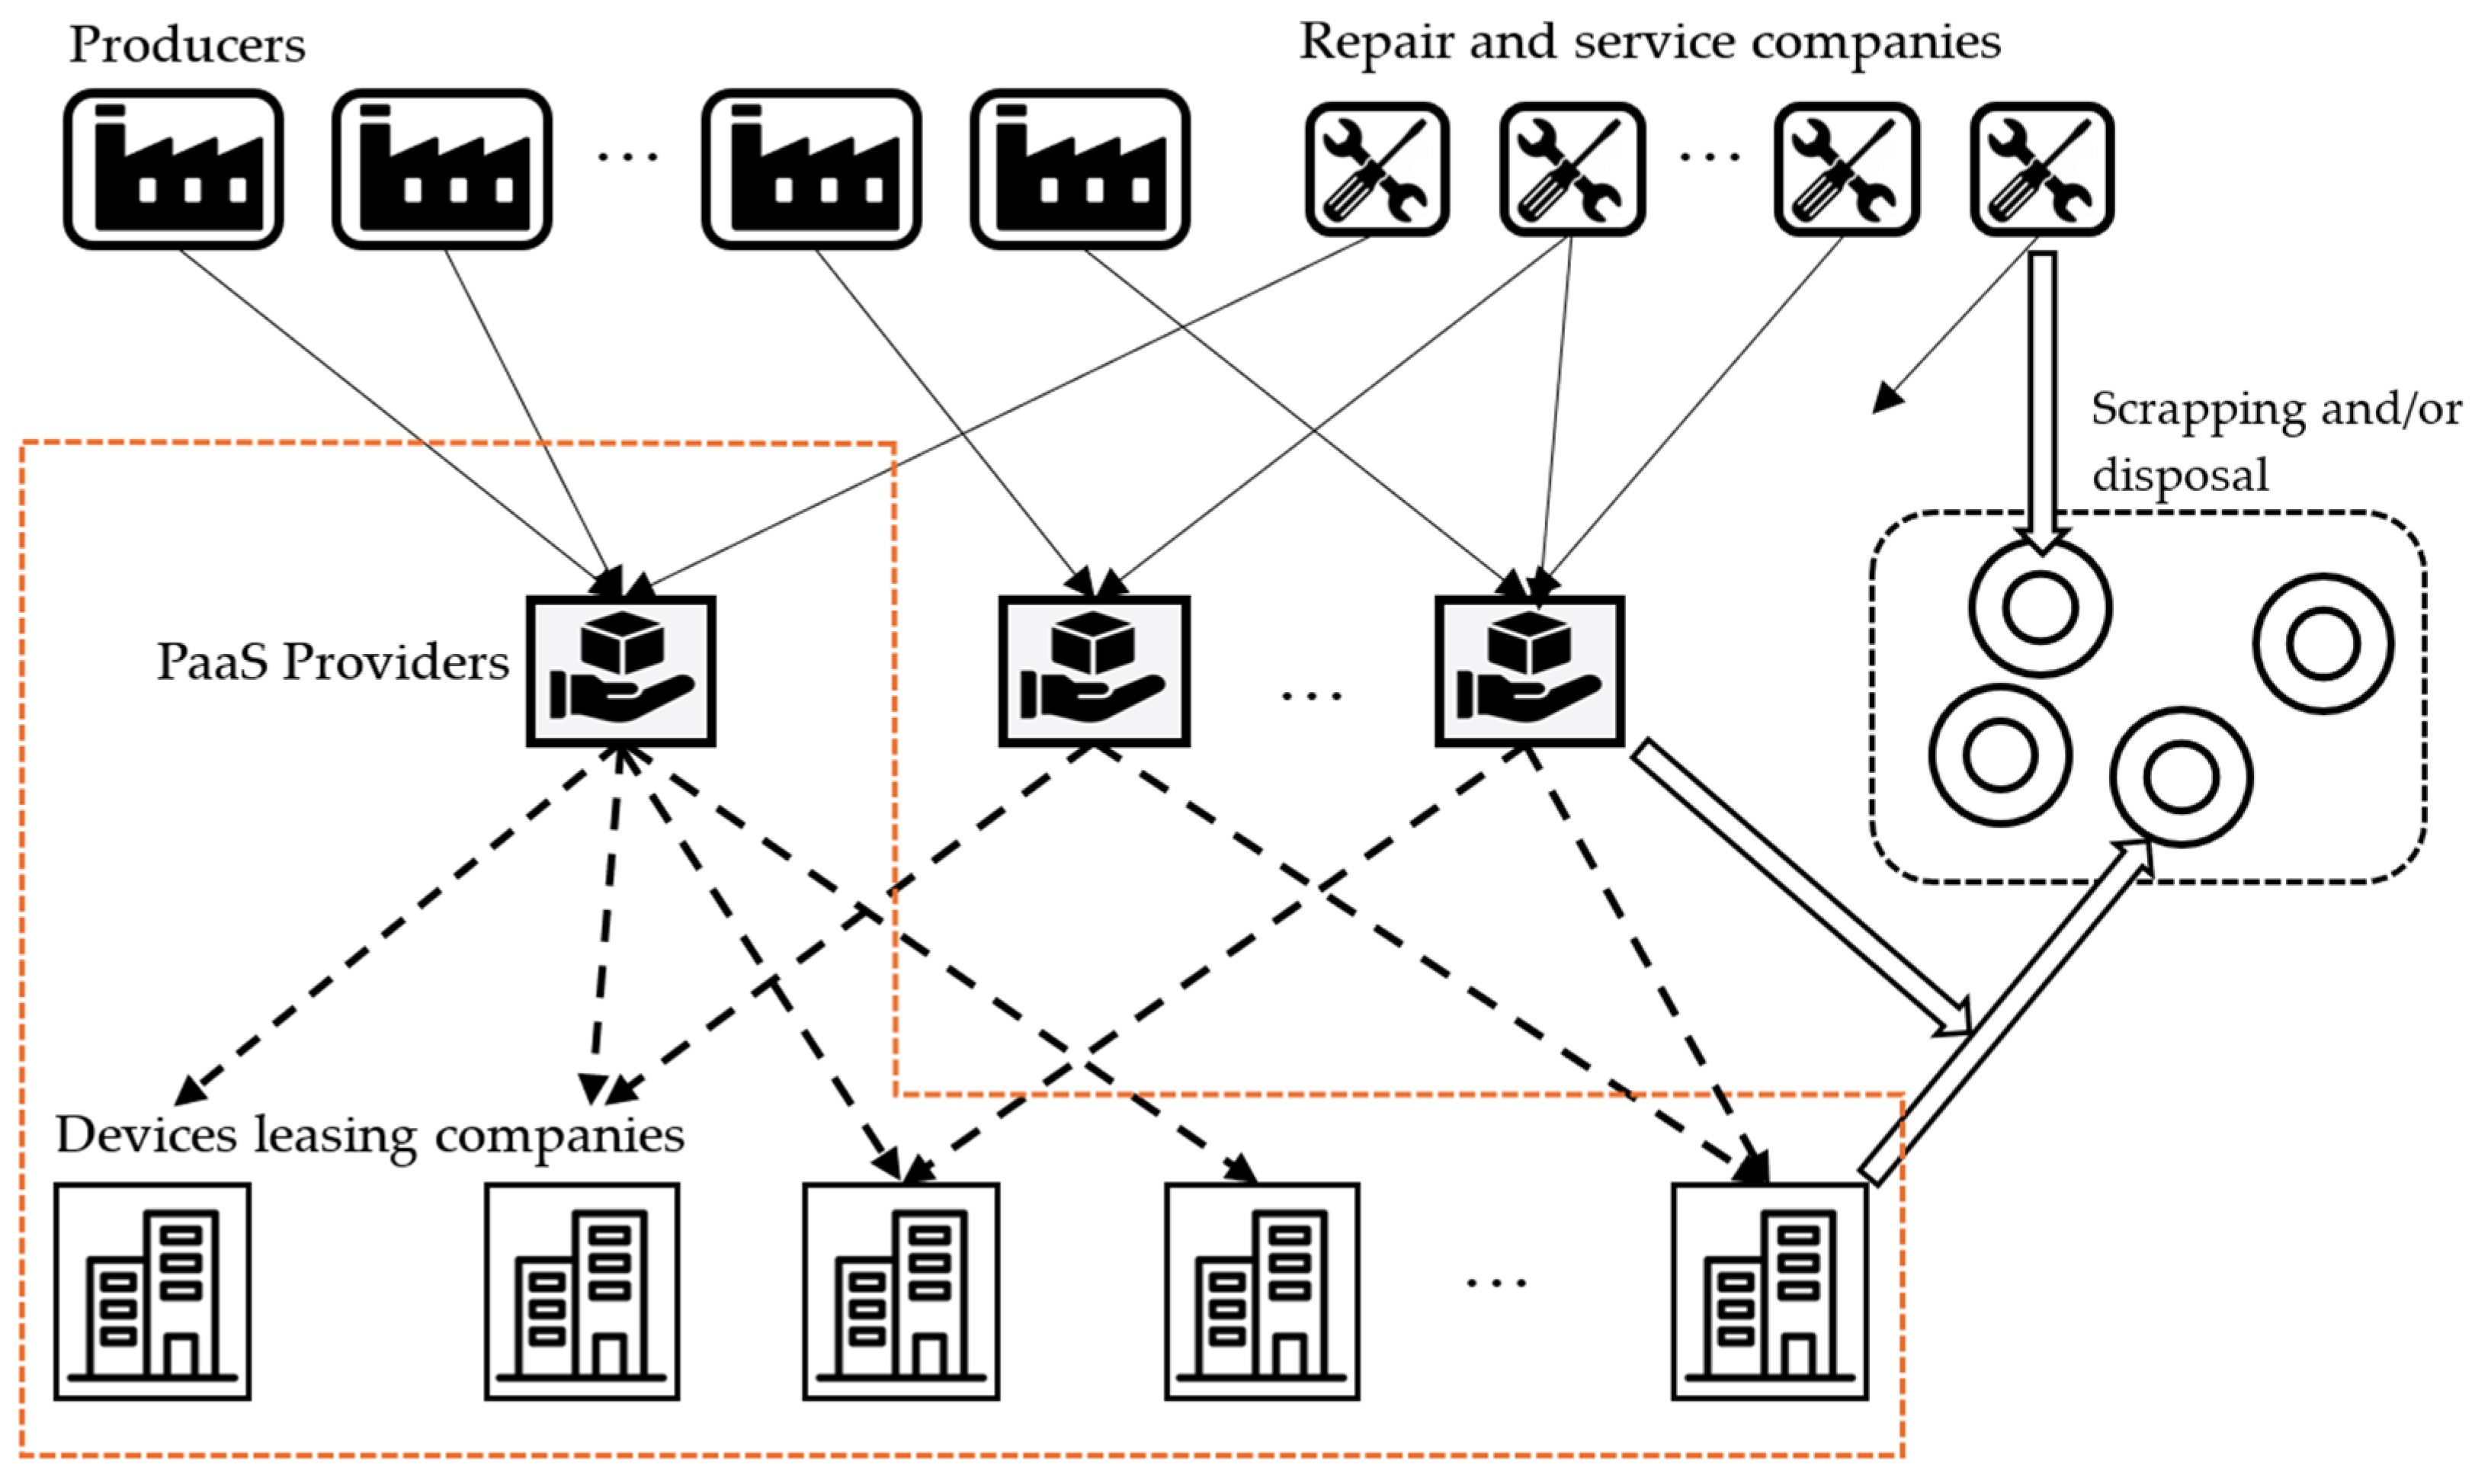
The following considerations are limited only to a certain fragment of the distributed supply chain network structure from
Figure 1 (the scope of services provided is shown as an orange dashed line) which includes one PaaS provider with leased devices cooperating with the provider service companies and supported end-users (companies renting devices). A graphical abstract of the idea of determining leasing contracts is presented in
Figure 2.
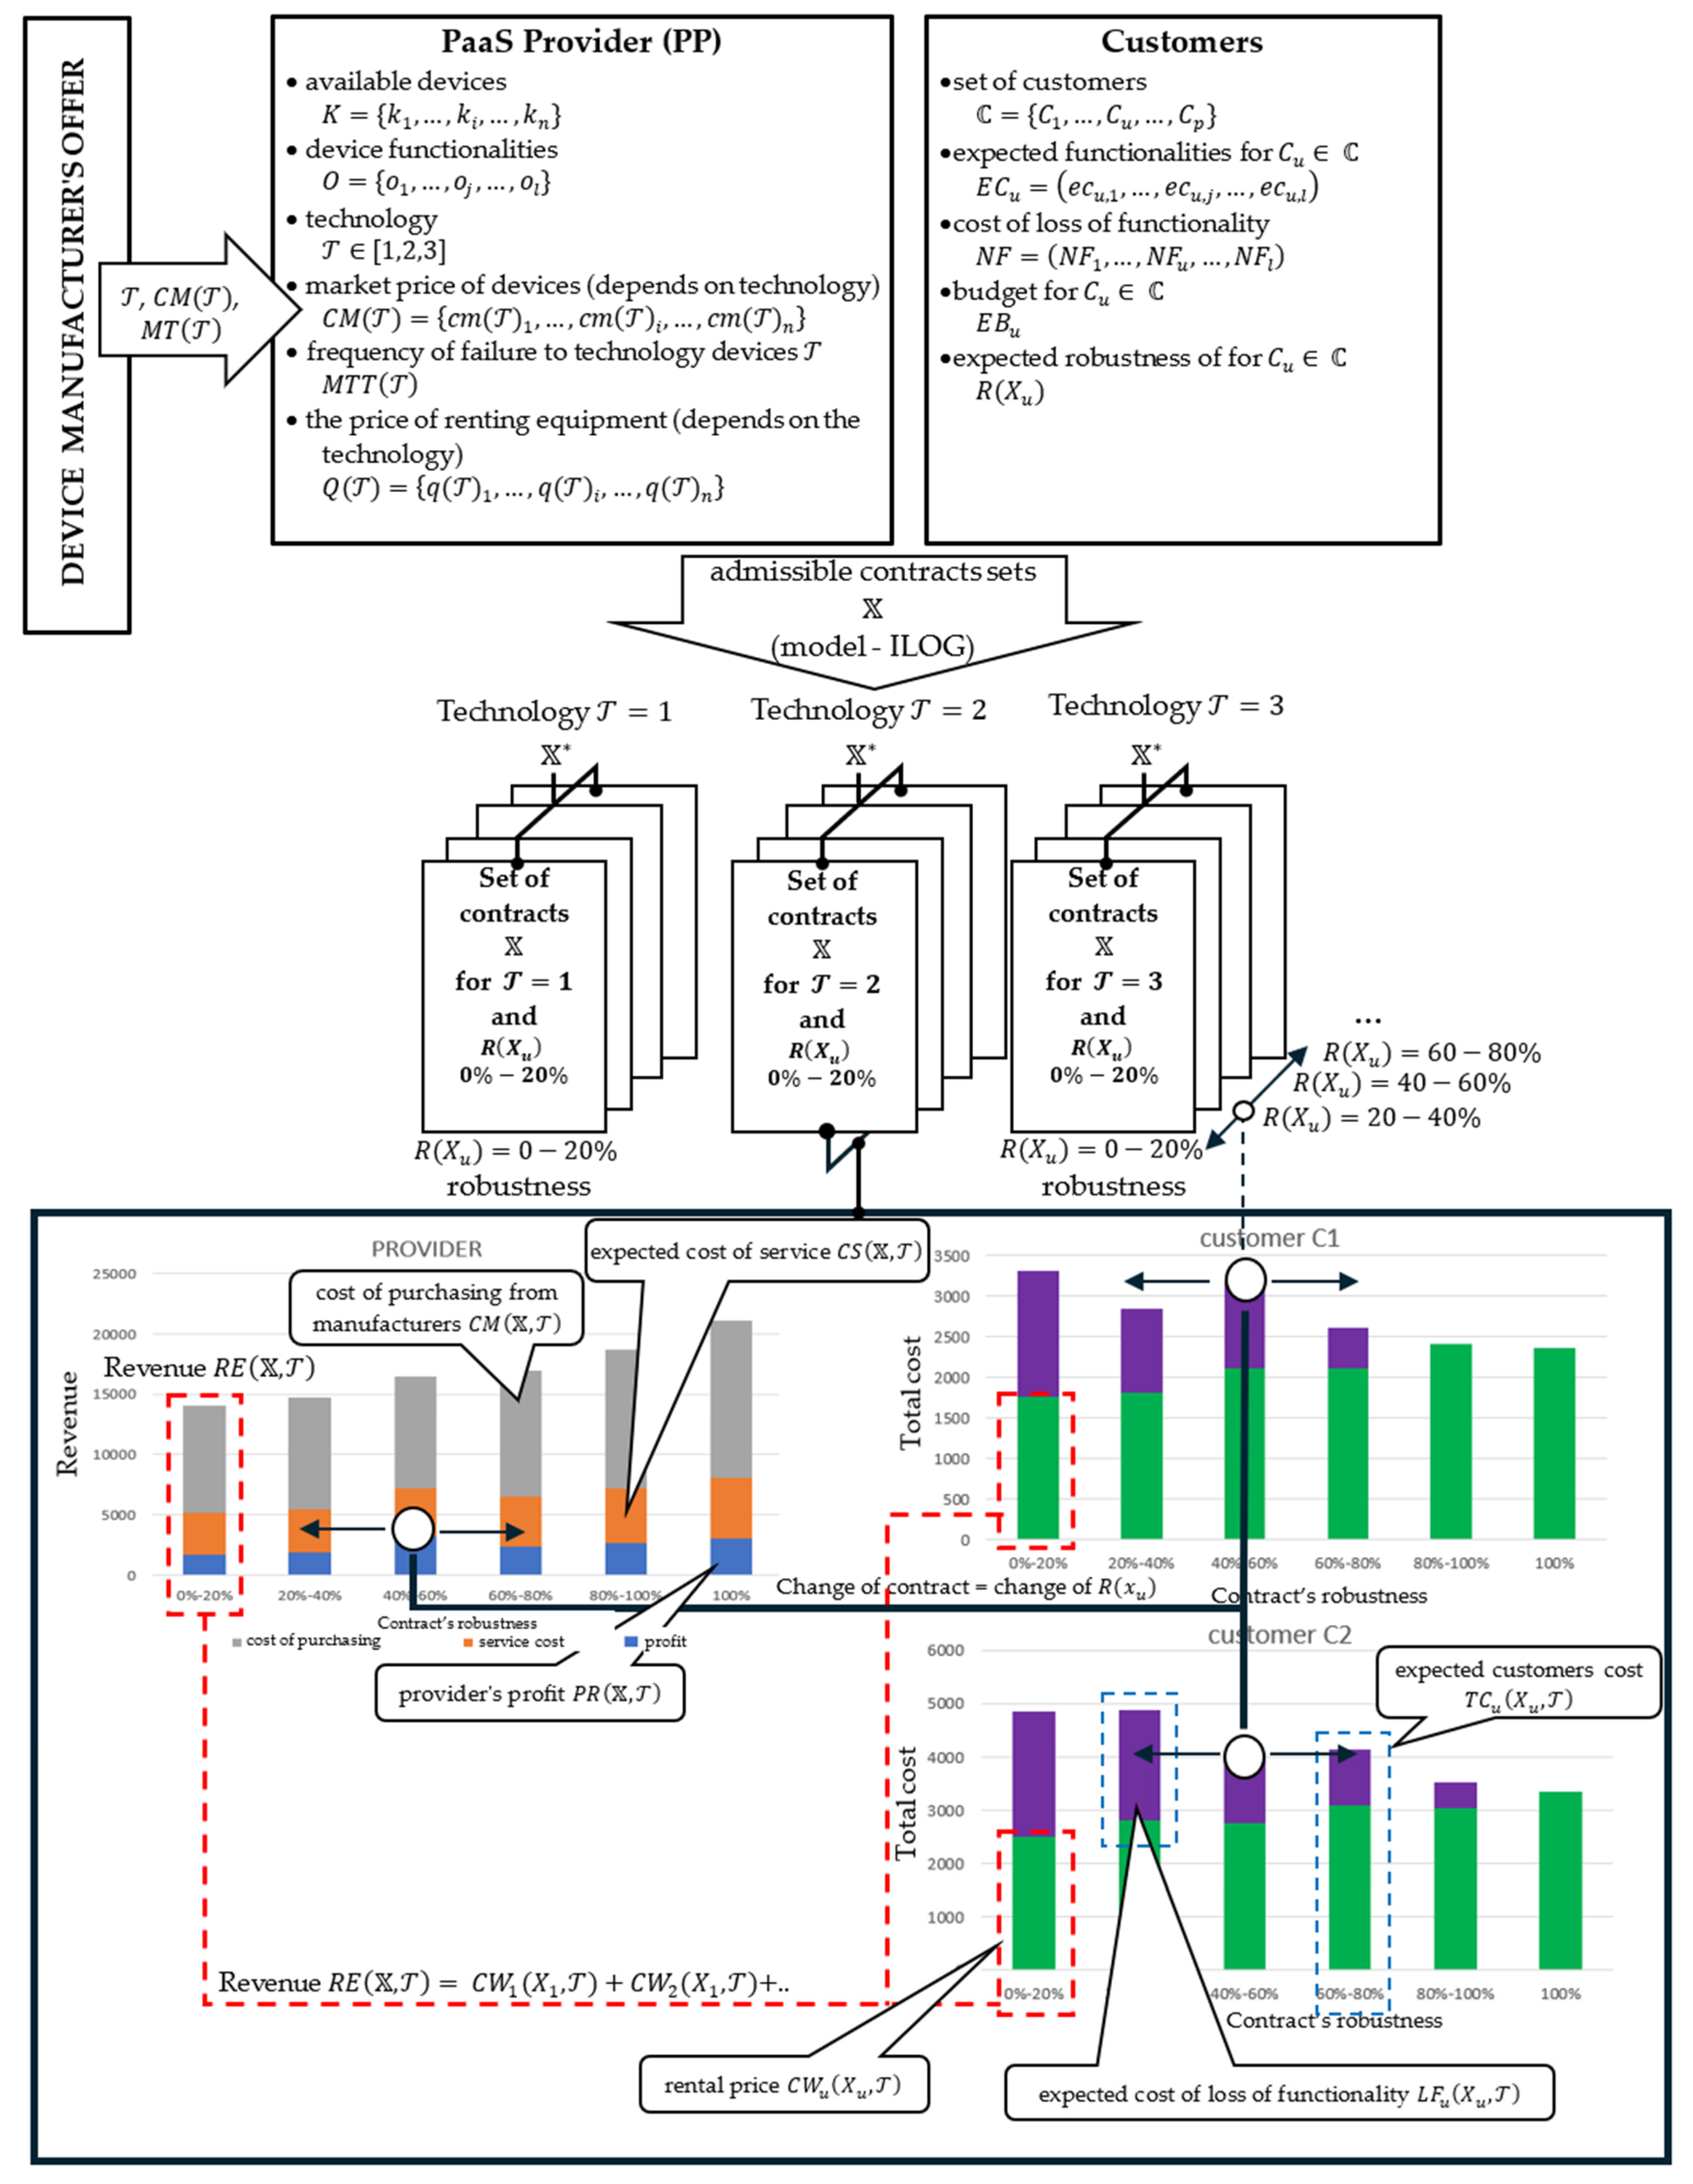
According to the adopted approach, the idea of which is illustrated in
Figure 2, the target lease contract is the result of the balance between the PaaS provider (PP) leasing offer and the customers’ purchase offer. In other words, each variant of the lease contract represents a compromise between the PP’s potential to provide specific functionalities and the needs and financial possibilities of the customer resulting from his business. In the analyzed case, they are described as follows:
PP leasing offer: It is assumed that PP has a set of types of devices: . Each type of device is characterized by a subset of the functionalities from the set (i.e., ). The functionalities of device can be represented by the sequence , where determines whether the device type has functionality () or not (). The number of devices of a given type is determined by the sequence , where means the number of devices of type . The offered devices are manufactured using various technologies which influence the price of the devices and their reliability. Advanced production technologies (that utilize innovative technologies to improve production processes) are high technology; the classification of technology as low, medium, or high tech can be subjective and context-dependent.
For the purposes of the constructed model, it is represented by the variable , the value of which conventionally denotes the technological level of devices (the higher the value of , the higher the technological level: 1—“low”, 2—“medium”, 3—“high”). The cost of renting each type of device is determined by the sequence , where is the cost of the device type which depends on the technology in which the device was made. The costs of purchasing/renting devices by PP from the market are determined by the sequence , where determines the cost of purchasing the device by PP which depends on the technology in which the device was made.
In turn, the costs of servicing the devices are determined by the sequence where determines the cost of servicing the device which depends on the technology in which the device was made.
Customer purchase offer: There is a set of potential customers looking for a family of sets of devices that meet their expected assumptions. Each customer expects access to a family of subsets of devices that fulfill the functionalities specified by the sequence , where specifies the number of functionalities of type expected by customer . Each customer has a budget , which cannot be exceeded (i.e., the sum of the costs of devices cannot exceed this value). In addition to knowing the leasing costs, the customer wants to be sure that in the event of a failure one or more of the expected functionalities can be replaced by the remaining functional ones.
A device functionality failure is understood as a situation in which one of its functionality fails and it is no longer available to the customer. As a consequence of this assumption, it becomes possible to introduce the concept of robustness of the proposed lease contract , understood as the ratio of failure scenarios in which the customer still has the full set of required functionalities () to all the considered failure scenarios (): , where means lack of robustness, i.e., for each failure scenario of a single functionality cannot be replaced by another functionality; means full robustness, i.e., for each failure scenario of a single functionality, other rented devices offer it. Each customer determines the minimum robustness level of their purchase offer.
Taking into account the above assumptions, the lease contract, which meets both the sales offer of PP and the purchase offer of the customer , consists of a list of devices represented by the sequence , where means number of type devices offered to customer . The functionalities offered as part of the contract, described with the sequence , can be defined as follows: , where is the number of functionalities made available to customer by the PaaS provider as part of the contract. For a given set of customers , is it possible to prepare a set of contracts for which it is required that each offer guarantees the expected:
Functionality, i.e., ;
Budget, i.e., ;
Number of available devices, i.e., ;
Robustness level, i.e., .
Meeting the above constraints allows for the designation of a family of admissible lease contracts , which are further assessed in terms of the PaaS provider’s profit and the costs incurred by customers:
It is assumed that it is determined as follows:
where
—revenue from the implementation of contracts : ;
—service costs for the devices offered (under contracts ) depending on the technology adopted ;
—costs of purchasing/renting devices by PP from the manufacturer.
In this approach,
is defined as follows:
where
,
—nominal costs of loss of functionality, and
—frequency of failure to technology devices
.
This means that the provider’s profit and the costs incurred by customers are influenced by the structure of accepted contracts , determined by the level of technological advancement of the devices offered by the provider, and the level of robustness (where for the customer’s purchase offer.
3.2. Illustrative Example
To illustrate the introduced parameters, let us consider the following example: The provider PP has six types of devices
, respectively, in number of units
. The device offers six functionalities
(
Table 1).
The rental costs
of one piece of a specific device
(depending on the technology level
) are known (
Table 2) as well as the service costs
of one piece of device
dependent on technology
(
Table 3). The costs of purchasing
one piece of device
by PP from the manufacturer’s market, depending on the technology
, are also known (
Table 4). For each device
, the frequency of failures is known
, depending on the adopted technology:
,
, and
.
Customer expects offers that include devices that fulfill the functionalities specified by the sequence , which means that customers want to guarantee two functionalities , three functionalities
, and three functionalities . The cost of purchasing the devices listed in the request for proposal should not exceed the budget allocated for this purpose. Furthermore, as part of the efforts to improve the quality of services provided by customer , the average cost of losing a single functionality has been determined.
Additionally, the budget EUR of the customer is known, and the cost of loss of functionality EUR as a result of the loss of one functionality.
Lease contracts are being sought that align with customer expectations, as the desired functionalities dictate the specifications of the offered devices. At the same time, these contracts must ensure varying levels of robustness (, 33%, 40%, 72%, 90%, and 100%) without exceeding the available budget for the different technological levels }.
The prepared offers
are collected in
Table 5. For example, an offer with robustness:
consists of three pcs of device , one pc of device , and three pc of device , this means that the customer will receive three functionalities , two functionalities , three functionalities , three functionalities , no functionalities , and three functionalities . While this meets the customer’s requirements (two functionalities , three functionalities , and three functionalities ), it also implies that in any failure scenario involving one of the functionalities required by the customer, the remaining available functionalities will not be able to substitute for the missing one.
consist of three pcs of device , and three pc of device , this means that the customer will receive three functionalities , three functionalities , three functionalities , three functionalities , no functionalities , and three functionalities . While this setup meets the customer’s requirements, it also implies that in three out of nine failure scenarios involving one of the functionalities required by the customer, the remaining available functionalities will be able to substitute for the missing one.
Etc.
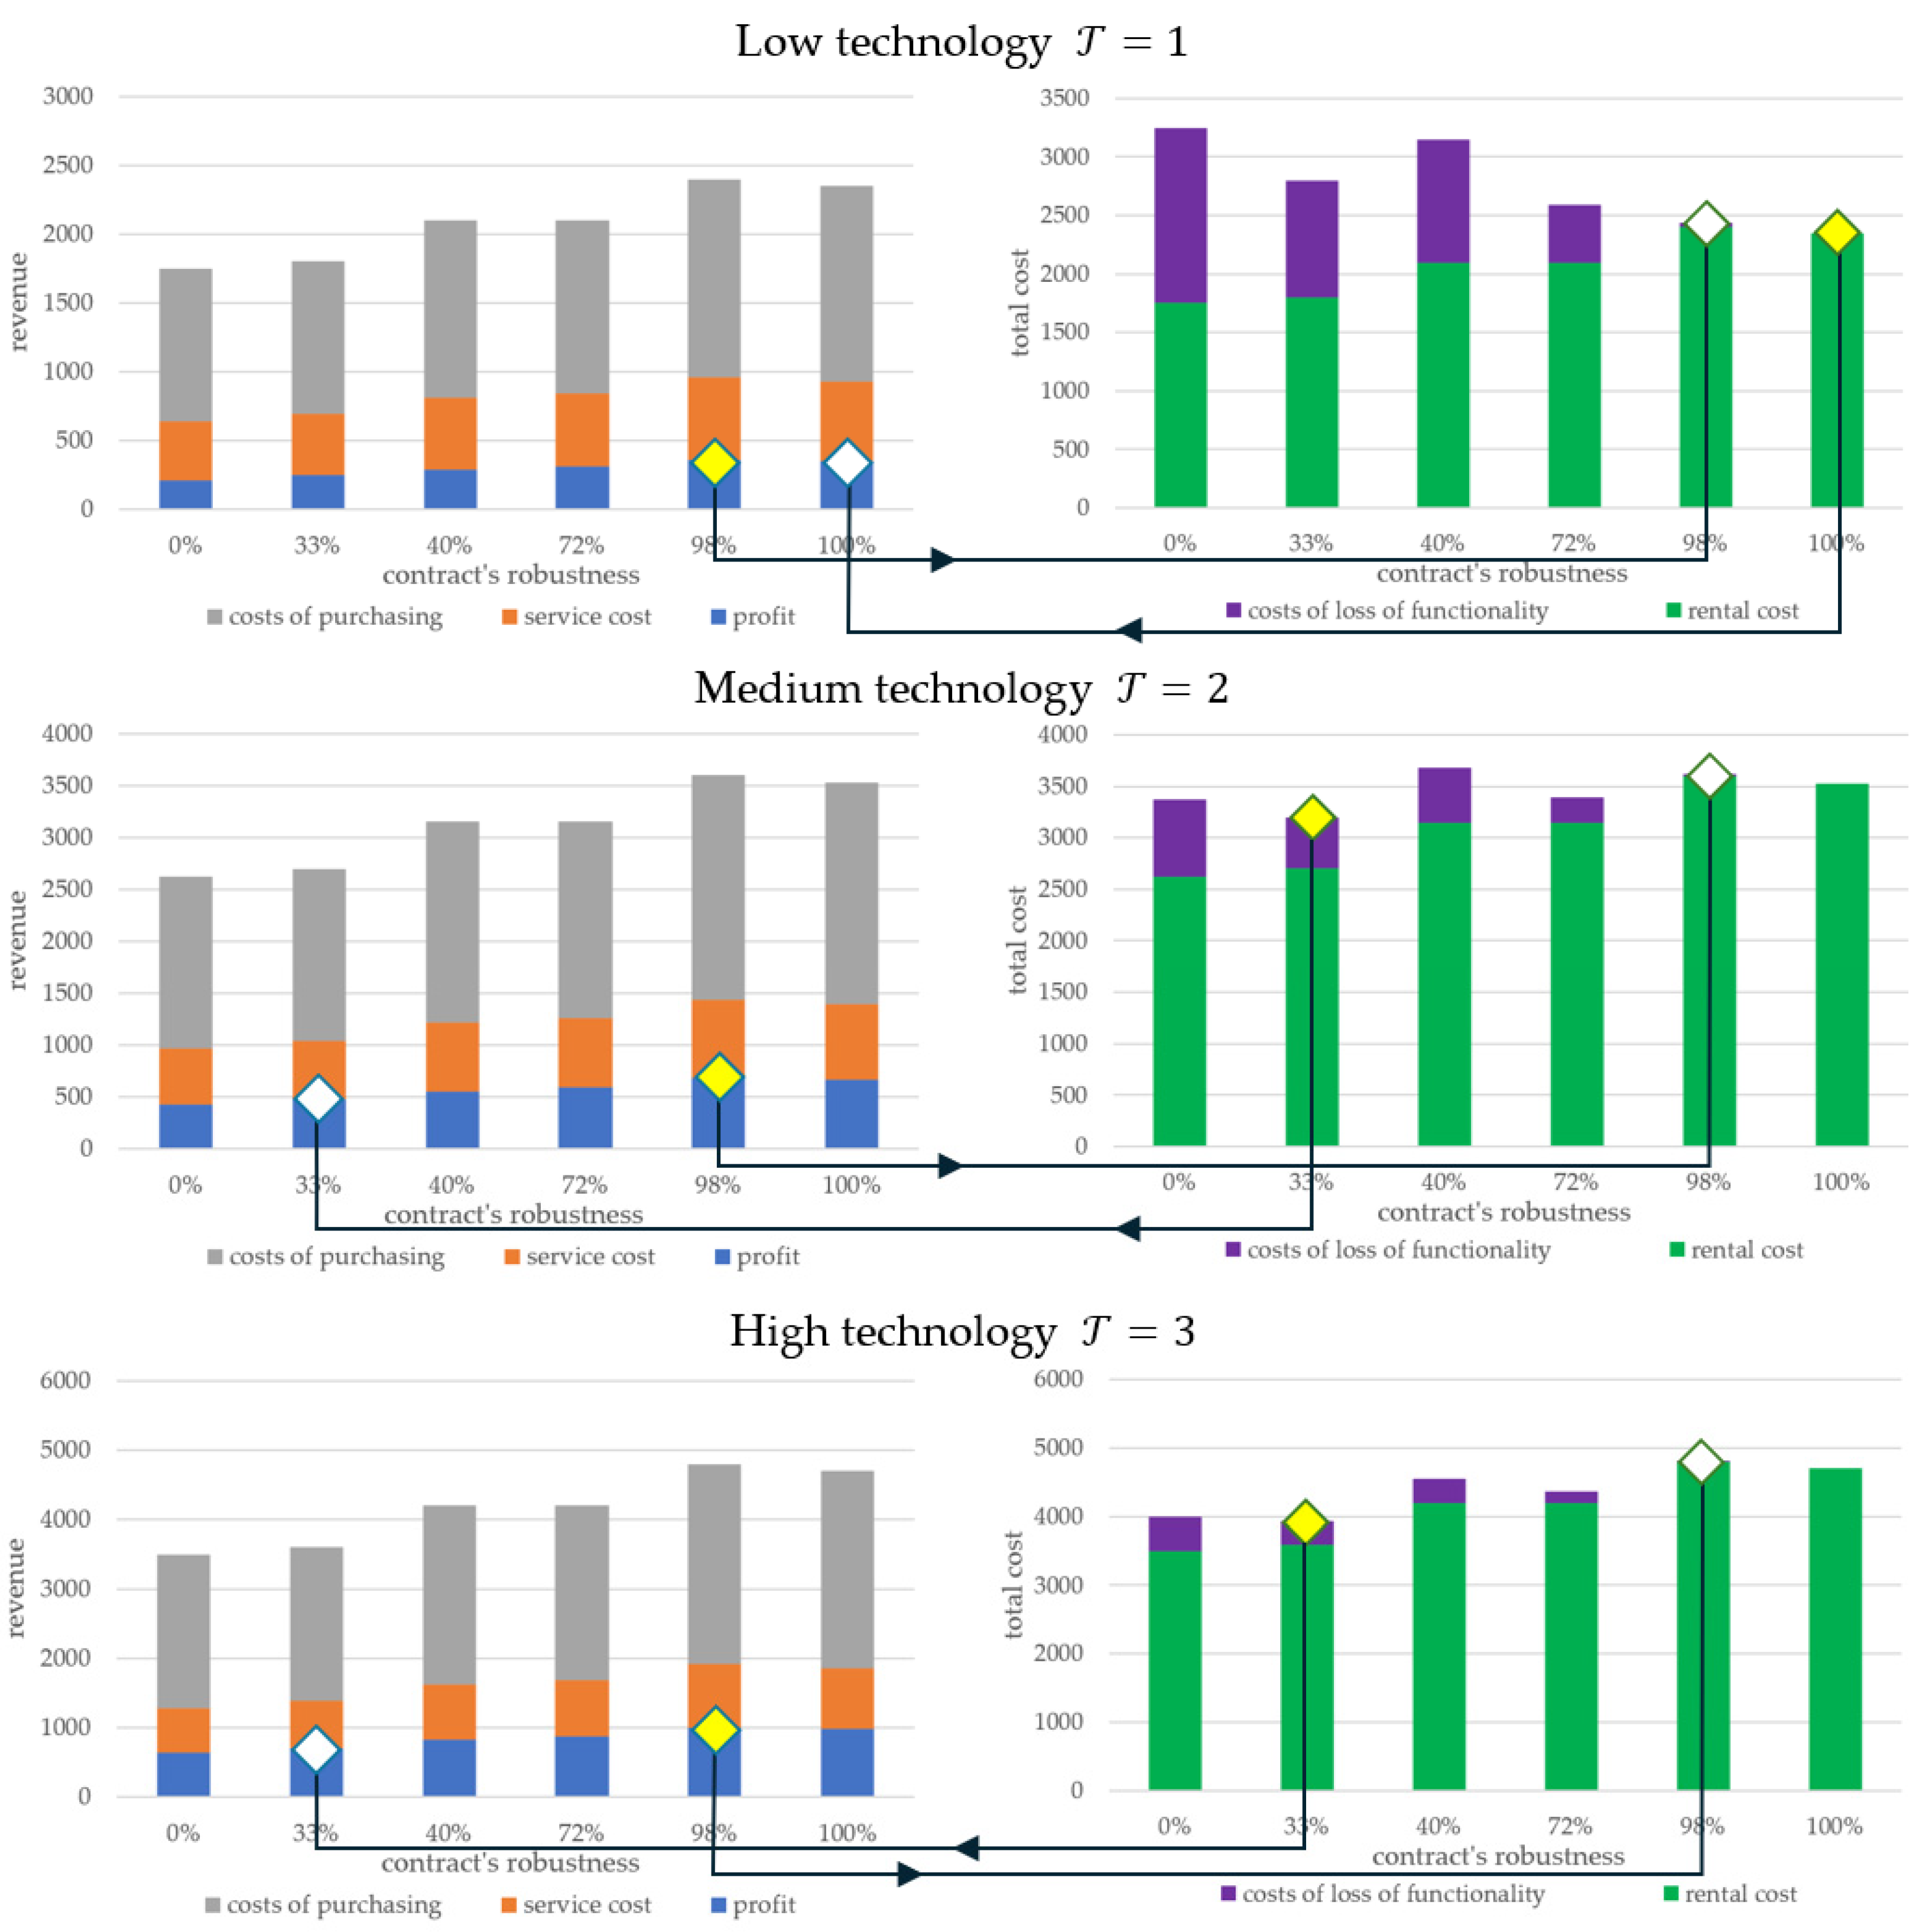
The balance of costs and benefits incurred by the PP and the customer’s expenses is illustrated in
Figure 3.
The left side of
Figure 3 depicts the revenue
of the PP. For various technology levels (
) and contracts
(with robustness
, 33%, 40%, 72%, 98%, and 100%), it highlights the cost of device acquisition
(gray bars), service costs
(orange bars), and provider profit
(blue bars). For instance, in the chart corresponding to technology level
, the highest revenue for the provider is achieved with an offering of
robustness (represented by the yellow diamond). The right side of the figure illustrates the customer’s total costs
, which comprise the average loss of functionality cost
(purple bars) and the device rental cost
(green bars). From the customer’s perspective, the most cost-effective option (yellow diamond) corresponds to the contract with robustness
.
Similar discrepancies between the contracts preferred by the PP and the customer are also evident in cases with higher technology levels
Specifically, the optimal solution for the provider (highest profit
) is not the optimal solution (lowest cost
) for the customer, and vice versa. This example demonstrates that in practice, it is rarely possible to achieve scenarios that provide the best outcomes for both parties (the provider and the customer) simultaneously. The search for a trade-off between the PP and the customer, thus, focuses on identifying a contract that is closest to their respective partial optimal solutions. This trade-off can be described by the following function:
where
—provider’s profit from the implementation of the contract (in technology );
—the highest possible profit of the provider for contracts of set implemented in technology ;
—customer costs for contract implemented in technology ;
—the lowest possible customer costs , for contracts of set implemented in technology .
The function
describes how the PP’s profit and the customer’s costs resulting from the contract
deviate from their respective optimal solutions. In this context, the problem reduces to identifying a contract
that ensures the minimum value of the function
. For instance, in the scenario depicted in
Figure 3, the optimal solution is the contract
implemented using technology
, which guarantees the robustness
This contract ensures the lowest value of
.
3.3. Declarative Framework
The PP’s planning of a market offer that promises to sign a contract with the customer comes down to determining a compromise (i.e., the trade-off point) between the provider’s capabilities (determined by the number of -th devices at its disposal and the costs of renting individual -th devices) and the customer’s expectations limited by the available budget.
The objective function aims to minimize the value of function representing deviations between both provider and customer from optimum offer , formulated as . When preparing the offers, it is assumed that:
Each customer’s requirements (such as functionalities and robustness level) and budget constraints are predetermined;
Each provider’s capabilities (both the type and number of devices for a specific technology ) are predetermined;
Costs of purchasing of -th type of device by the provider depends on the number of devices ordered;
Rental prices depend on the technology () in which they are manufactured;
Prices of the service support include costs related to the transportation as well as the disposal of broken components;
Loss of functionality does not affect other functionalities within the same -th device.
A mathematical model was developed to determine an optimal contract that balances the provider’s technical capabilities with the customer’s needs and budget. The model includes a defined set of parameters, decision variables, and business constraints that interconnect these variables with the parameters.
| : | number of devices, where ; |
| number of customers, where ; |
| : | number of functionalities, where ; |
| : | set of devices, where ; |
| : | set of functionalities, where ; |
| : | set of customers, where ; |
| : | sequence of device availability, where and ; |
| : | sequence of renting costs of -th device depending on the technology , where ; |
| : | set of customers functionalities orders, where ; |
| : | sequence of -th customer’s functionalities order, where and ; |
| : | set of customers budget limitations, where ; |
| : | -th customer’s budget limitation; |
| : | set of customers minimum level of robustness requirements, where ; |
| : | -th customer’s minimum level of robustness requirement, where ; |
| : | sequence of purchasing costs of -th device depending on the technology , where ; |
| : | sequence of service costs of -th device depending on the technology , where ; |
| : | frequency of failure to technology devices ; |
| : | nominal cost of loss the functionality for -th customer. |
Decision variables:
| : | set of lease contracts ; |
| : | lease contract of customer , ; |
| : | number of -type devices assigned to the -th customer for given contract ; |
| : | technology level ; |
| : | number of -th functionalites available for -th customer for given contract ; |
| : | cost of contract ; |
| : | robustness of contract ; |
| : | sum of all functionalities in the ; |
| : | additional value to describe the sum of -th functionality redundancy for -th customer; |
| provider’s PP profit from adopted contracts for given technology ; |
| : | provider’s PP profit from adopted set of contracts for given technology ; |
| : | revenue from the implementation of contracts for given technology ; |
| : | revenue from the implementation of set of contracts ; |
| service costs for the devices offered (under contract ) depending on the technology adopted ; |
| : | service costs for the devices offered (under contracts ) depending on the technology adopted ; |
| : | costs of purchasing/renting devices by PP from the manufacturer; |
| : | cost of functionality loss for -th customer for given contract and technology ; |
| cost of renting devices; |
| customer -th costs of contract in technology . |
Each lease contract must satisfy customer’s expectations (e.g., expected functionalities , budget , and expected robustness ) and provider’s limitation (e.g., available number of devices ):
The provider’s profit depends on the revenues obtained (which are influenced by the assumed rental costs ), the costs incurred for servicing the devices (which are influenced by the assumed cost of service ), and their purchase prices (which are influenced by the assumed cost of purchasing devices ):
The costs of customers depends on the cost of renting devices (which are influenced by the assumed rental costs ), costs of loss of functionality (which are influenced by the assumed frequency of failure devices ), and nominal costs of loss of functionality:
The adopted objective function assumes minimization of the value representing the trade-off between provider and customers. The components of this function are the values , which represent the degree to which the local extremes are achieved by the provider PP (profit) as well as the customer (costs):
The presented model allows us to answer the following question: what set of lease contracts
and technological level
guarantees a trade-off (according to the adopted
function (23)) between the provider and the customers of set ℂ? The above problem can be formulated as the following
(constraint optimization problem):
where
, a set of decision variables representing, among others, lease contracts
, technology
, and determined by the robustness
provider’s profits
, and customer cost
;
is a finite set of domains of decision variables;
is a set of constraints specified in Formulas (4)–(22); and
is the objective function (23).
To solve the problem (24), one should determine the values of decision variables , for which all the constraints given in the set are satisfied and objective function is minimal. Solving means determining the set of contracts (and technology ) which guarantees a trade-off between the provider and the customers. The example of using the proposed approach is presented in the next section.
The solution of the considered problem (24) was obtained by implementing it in declarative programming environments such as ILOG or Gurobi. Leasing contracts are determined in the process of multiple pruning of the space of admissible solutions (using the mechanisms of constraints propagation and decision variables distribution). The method used is a generalization of the well-known branch and bound approach.
4. Case Study
The developed approach was used to define contracts that were a trade-off (according to the
function (3)) between the capabilities of the one PaaS provider (PP) and the requirements of ten customers
. The capabilities of PP are the same as in the example from
Section 3.2—it has six types of devices
with the parameters described in
Table 1,
Table 2,
Table 3 and
Table 4.
The provider considers purchase offers from ten customers specifying their expectations by the number of functionalities provided by devices (see
Table 6). For example, customer
expects that the rented devices will have two functionalities
, three functionalities
, and three functionalities
.
The cost of purchasing the devices should not exceed the customer budget (in euro): , , , , , , , , , and . Furthermore, for each customer, cost of losing a single functionality is EUR.
The answer to the following question is sought: what set of lease contracts and technological level guarantees a trade-off (according to the adopted function (3)) between the provider and the customers of set ?
For this purpose, for the different technological levels () contracts for each customer with robustness in six ranges: , , , , , and were sought.
Using the developed model implemented in the IBM ILOG CPLEX (version: 22.1.1, Intel Core i7-M4800MQ 2.7 GHz and 32 GB RAM), calculations were performed for the given data. The presented solutions of negotiated contracts meet the constraints given in the model. To determine them, a generalized branch and bound approach implemented in the IBM ILOG CPLEX environment was used.
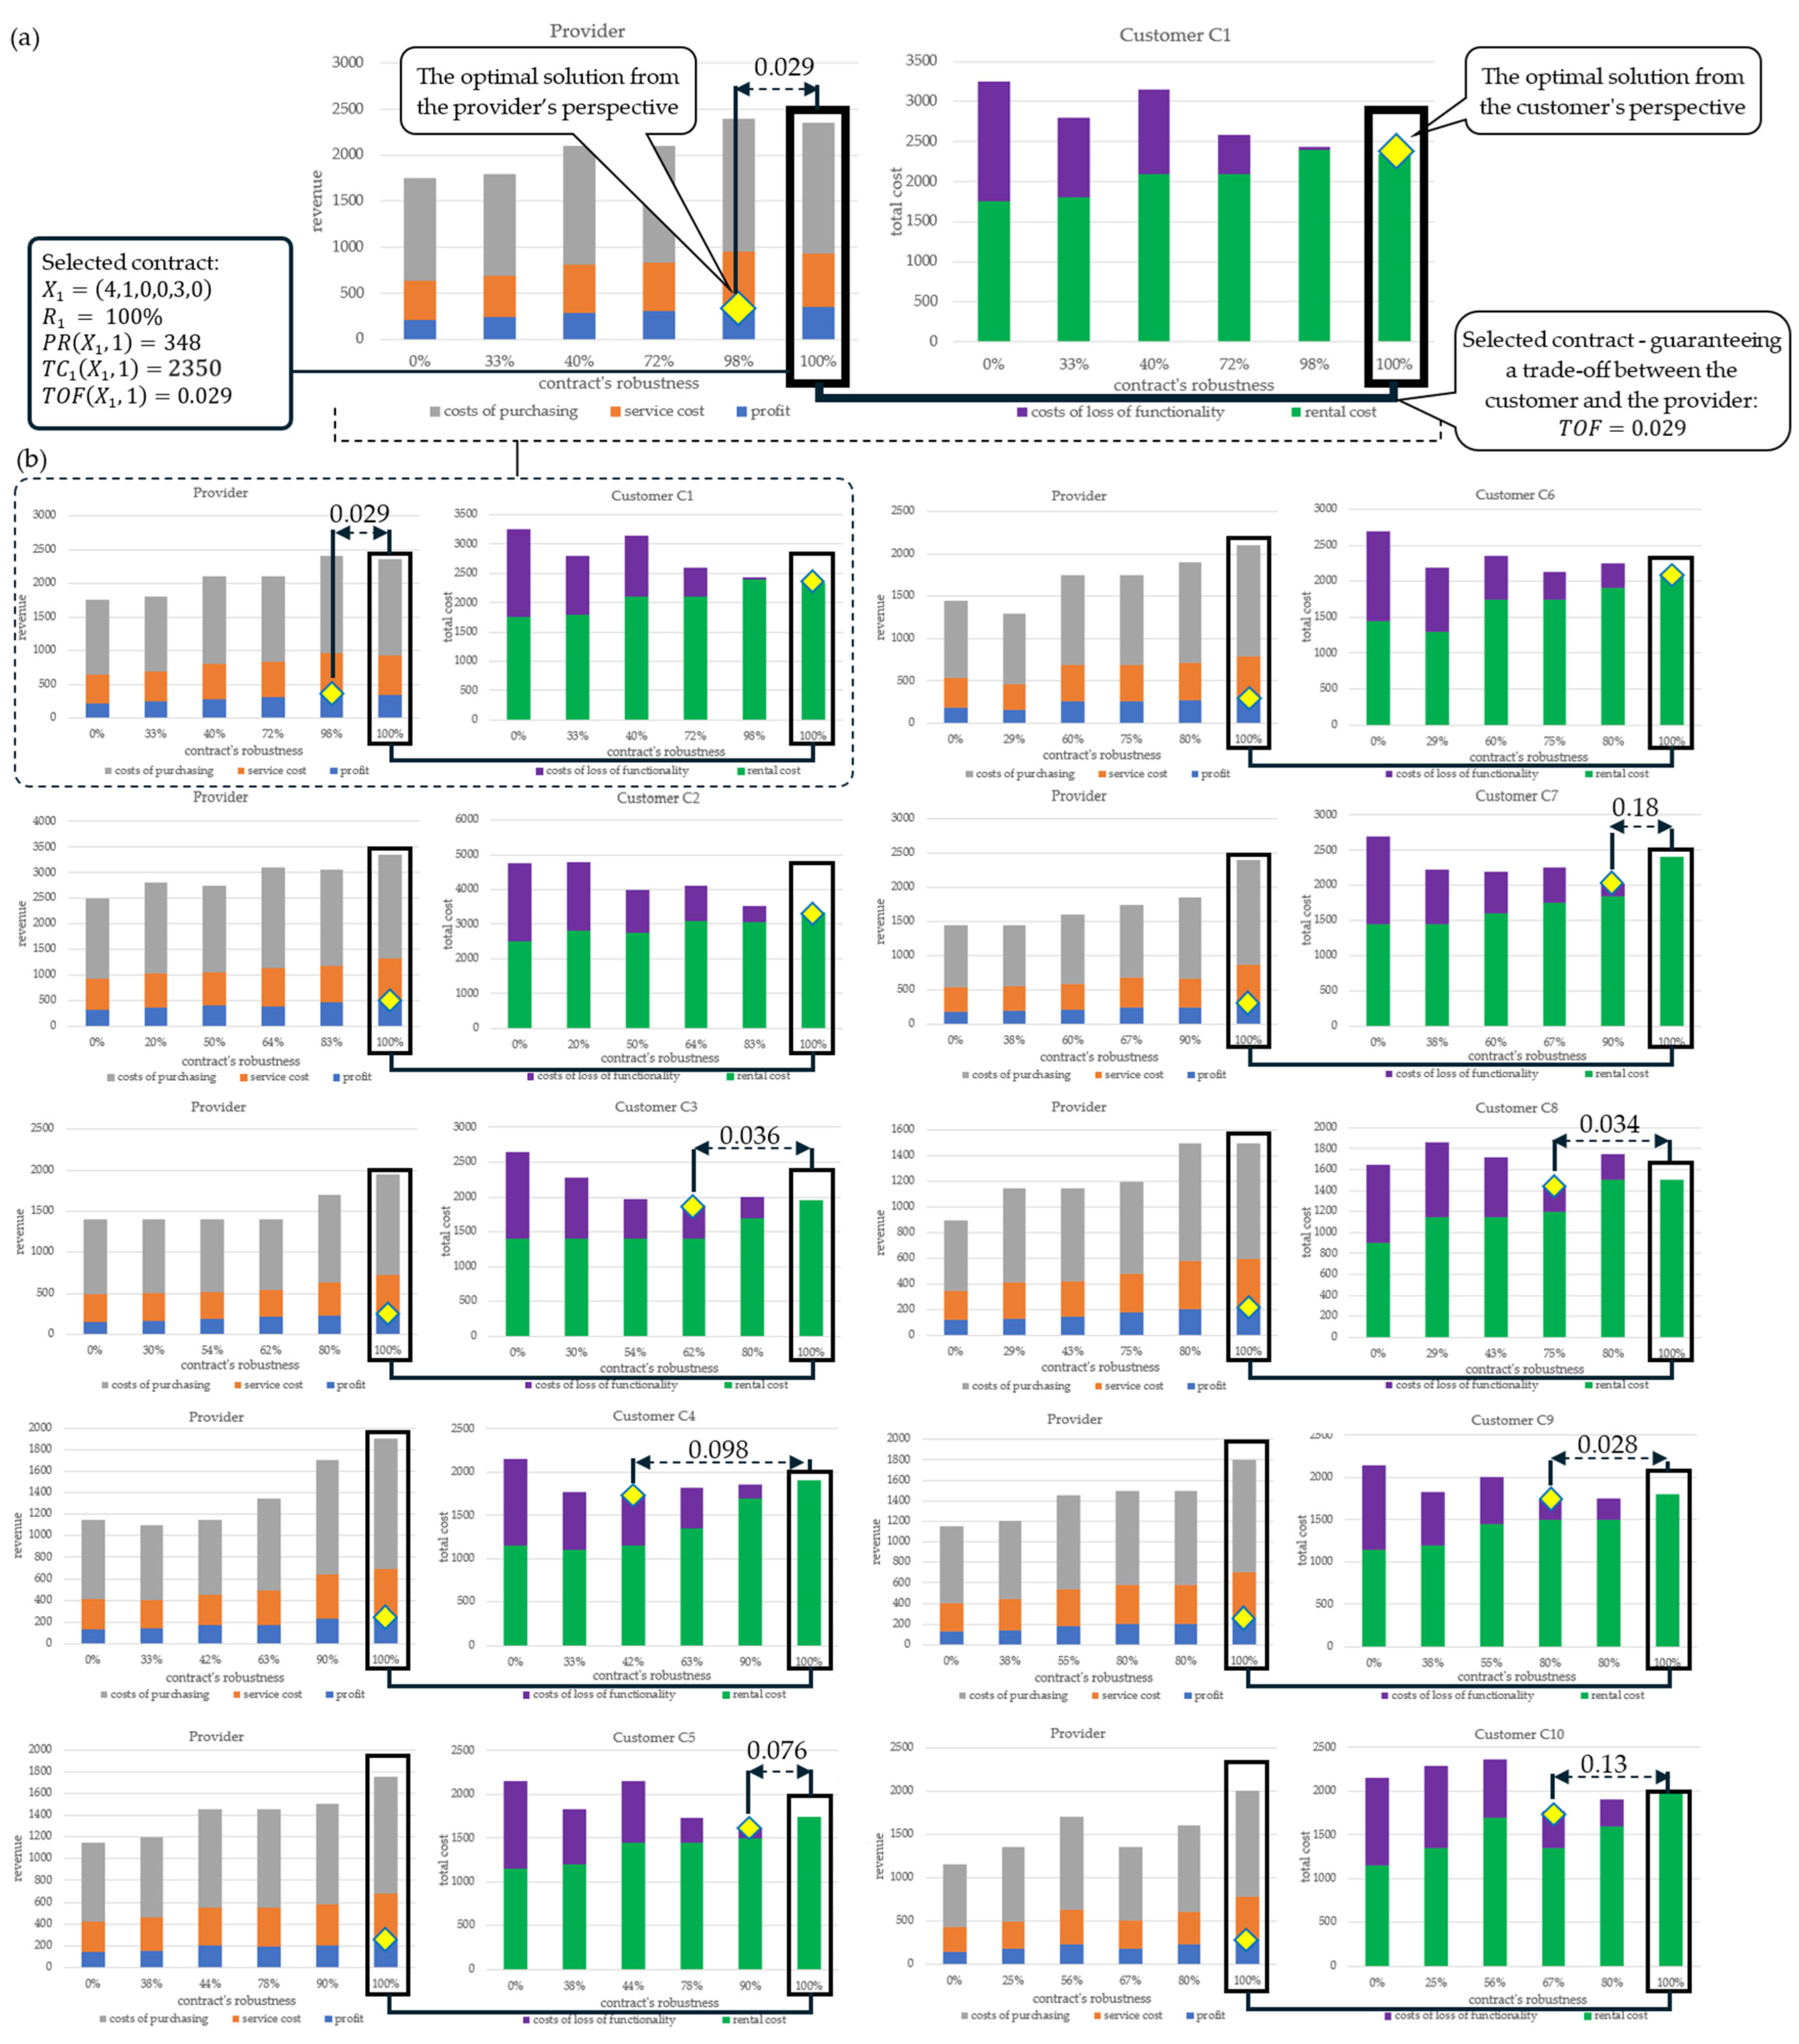
Table 7 summarizes the results of
customer contracts corresponding to the
-function trade-off points and the assumed technological level
of the leased devices. For example, in the case of customer
, the trade-off (
), minimizing the difference between the local extremes of the customer and PP, is the robustness of eight leased devices at the level of
. The determined equilibrium point determines the PP’s profit at the level of 348 EUR with leasing costs at the level of 2350 EUR.
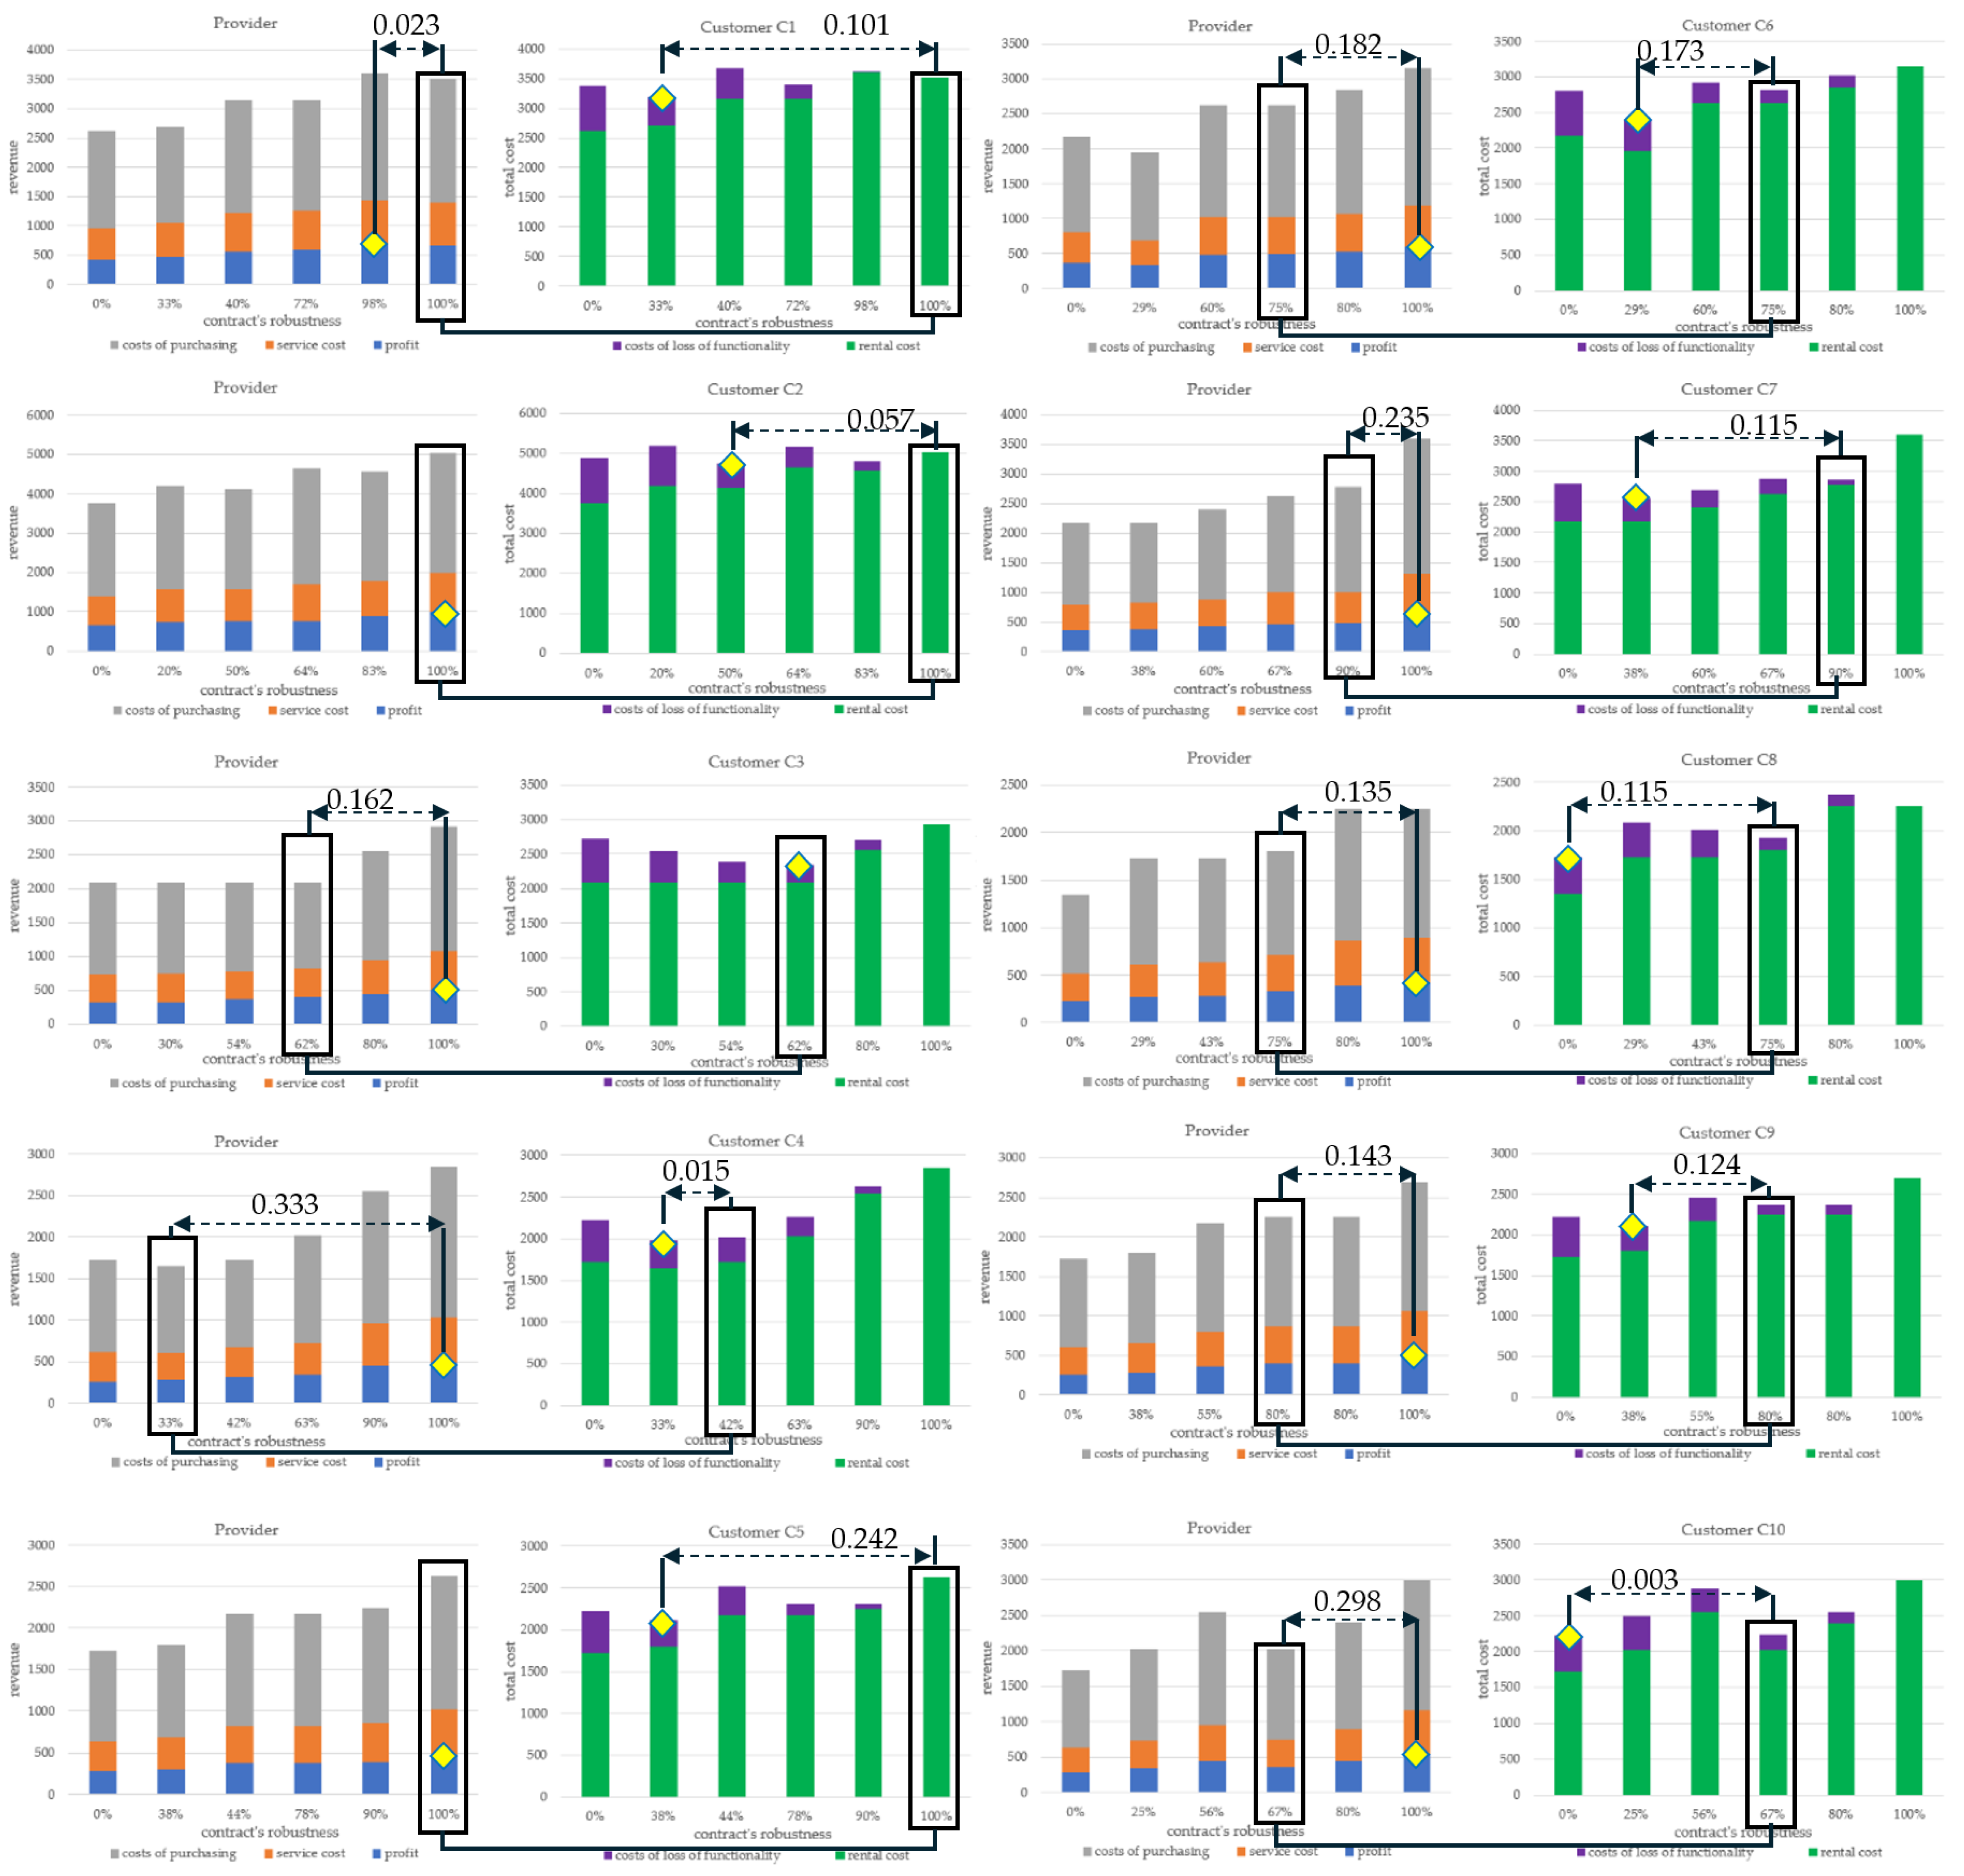
The trade-off contract relating to customer
is illustrated in
Figure 4a, see the points marked with yellow diamonds designating optimal solutions for the
(
) and PP (
). It can be seen that the best (i.e., guaranteeing a trade-off) contract for
is in the case of robustness
(see the designated
). The rest of the figure, i.e.,
Figure 4b, illustrates the trade-off in contracts with other customers
.
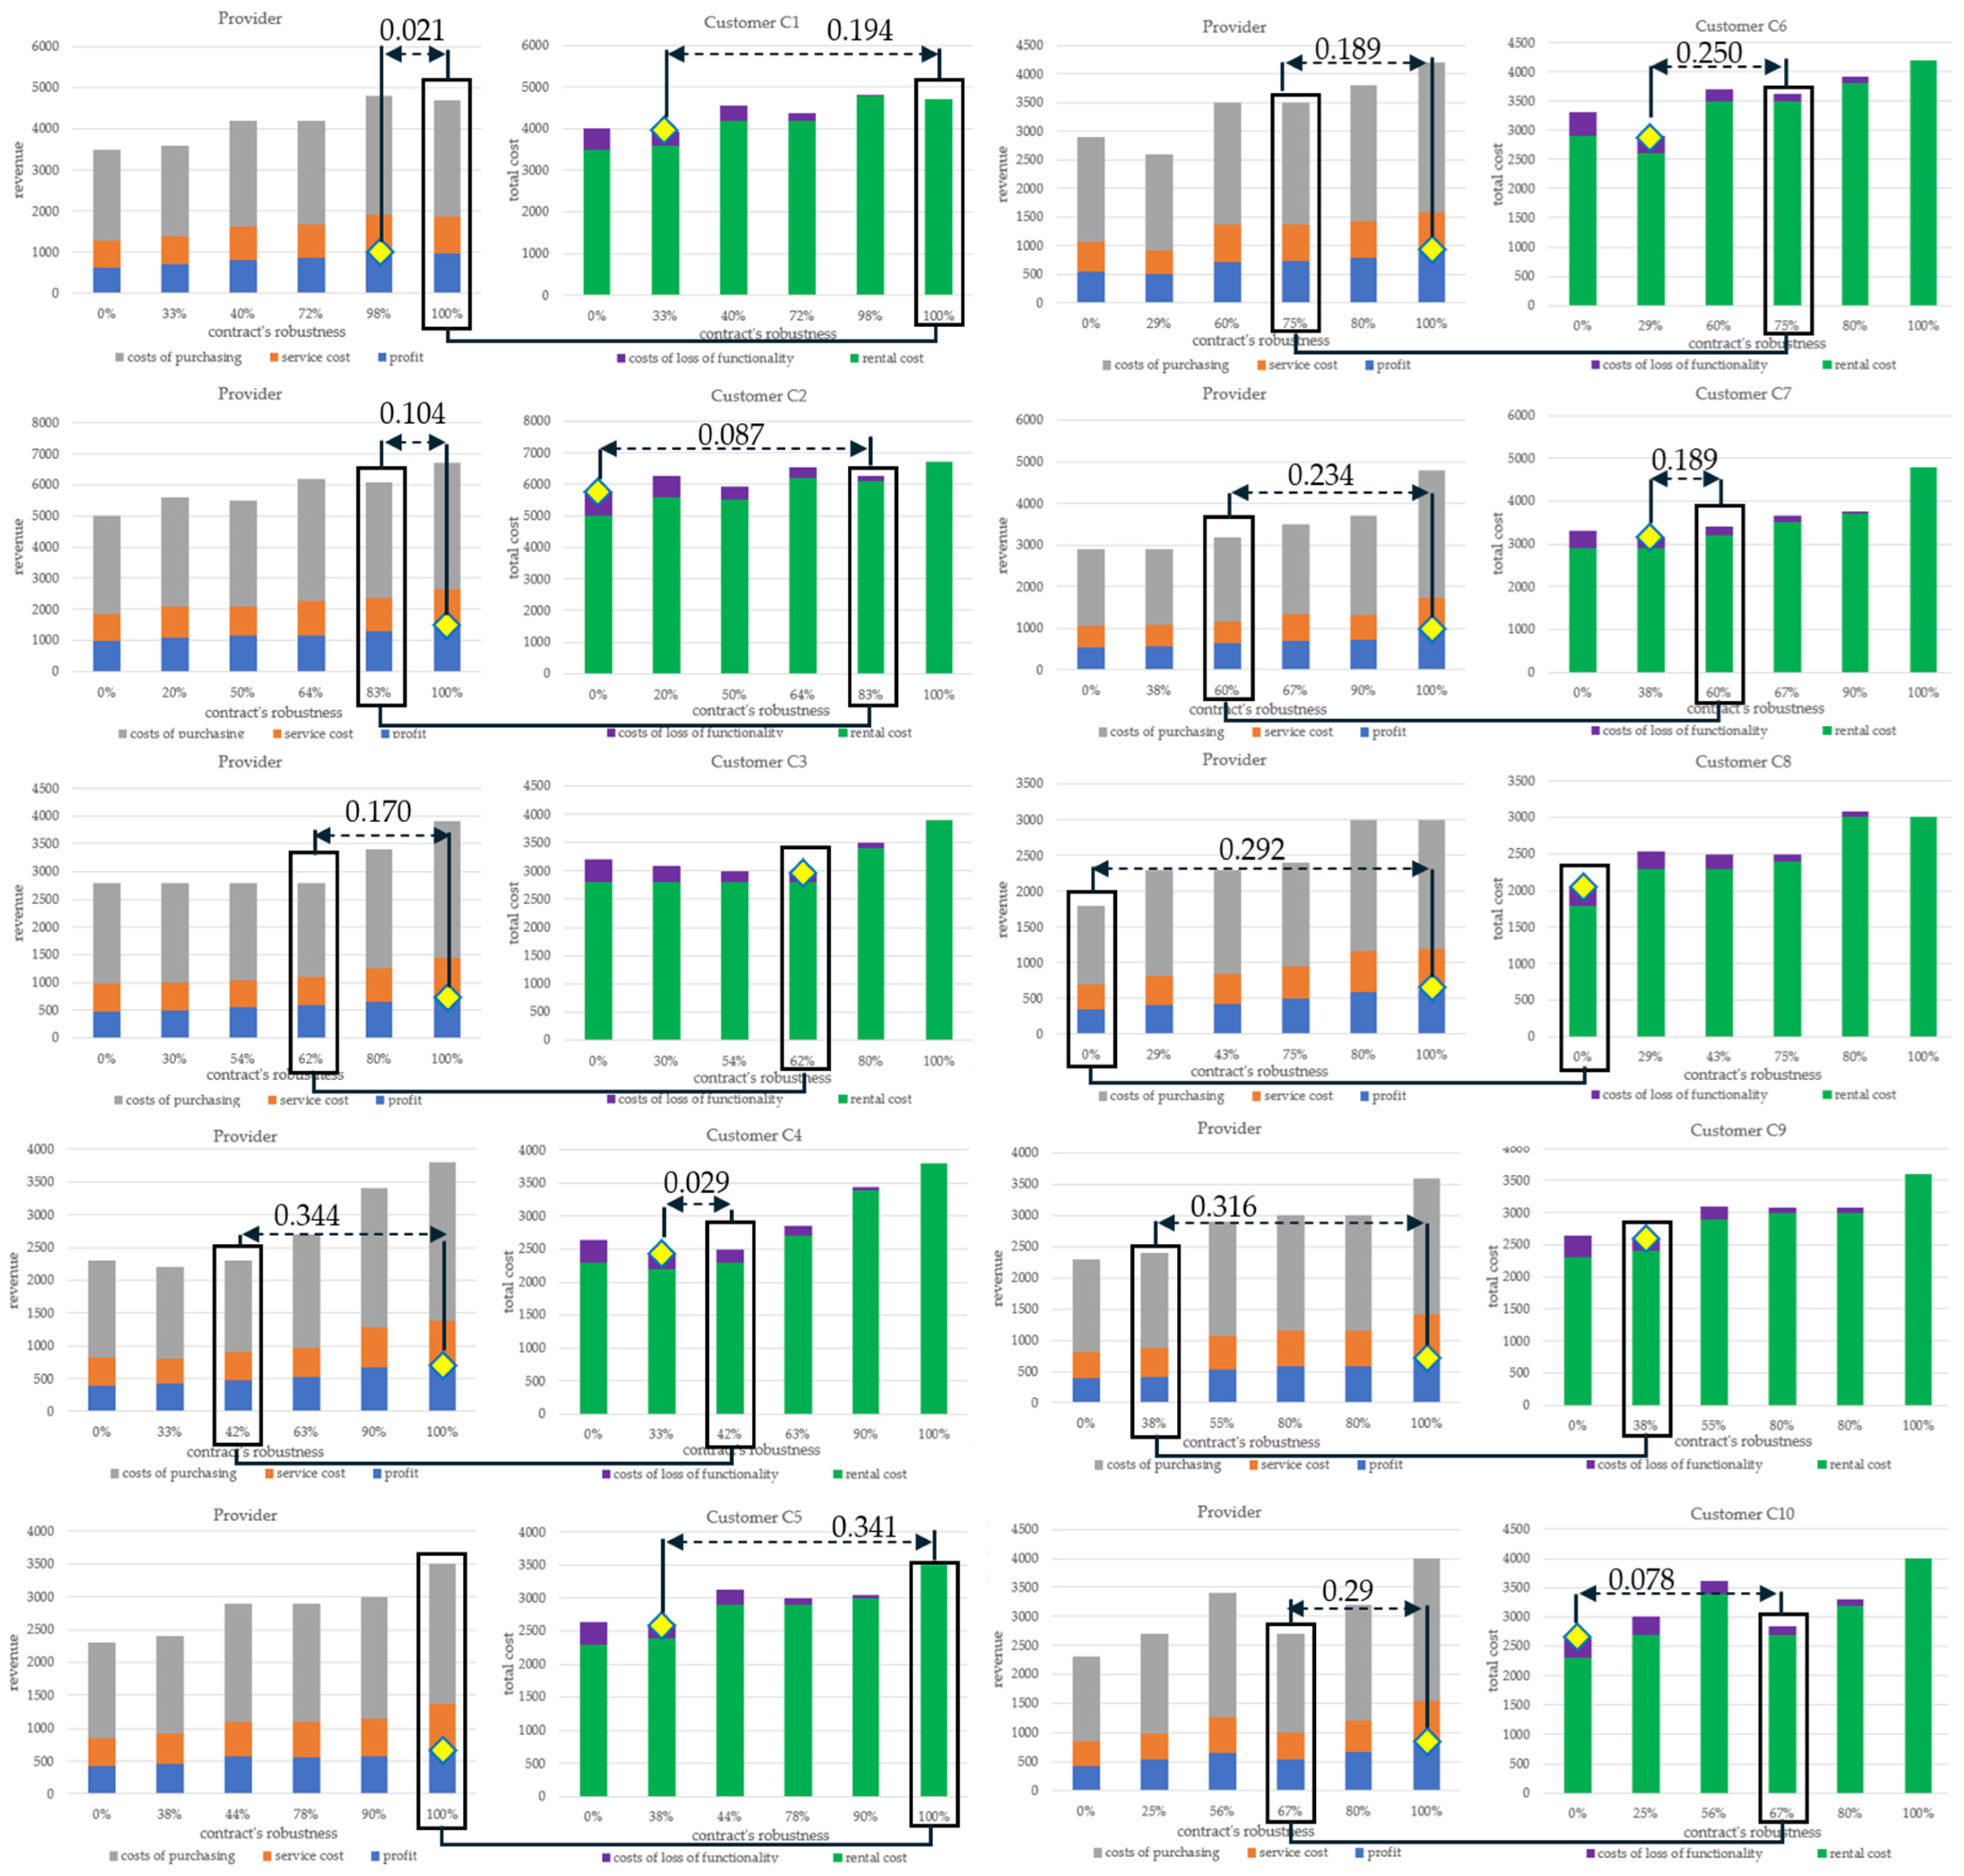
Analogously to the above-described case of the
technological level of rented devices, experiments were carried out and the results are summarized in
Table 8 and
Table 9 and illustrated in
Figure 5 and
Figure 6, respectively, for the
and
technology levels.
The analysis of the cases presented above shows that the adoption of a higher level of technology results in a lower level of redundancy (robustness of the structure of rented devices) of orders. Comparing, for example, contracts for technology and technology , it turns out that in the case of , for all customers, selected contracts have the robustness of , while in the case of only two contracts have such robustness (customers and ). In other cases, they remain at different levels, even for customer . This means that higher technology replaces the redundancy of rented devices.
Summarizing the experiments carried out, the results obtained (collected in
Table 7,
Table 8 and
Table 9) constitute a recommendation for contracts guaranteeing a compromise, i.e., each party obtains a variant of the contract in which it loses the least compared to the local optimal solution (relative to the
function (3)). Both the PaaS provider’s capabilities (expressed by the PP leasing offer) and the customer’s needs (expressed by the customer purchase offer) are taken into account. They also allow us to take into account the impact of the external market (cost of purchasing
(
)) related to access to various technologies
.
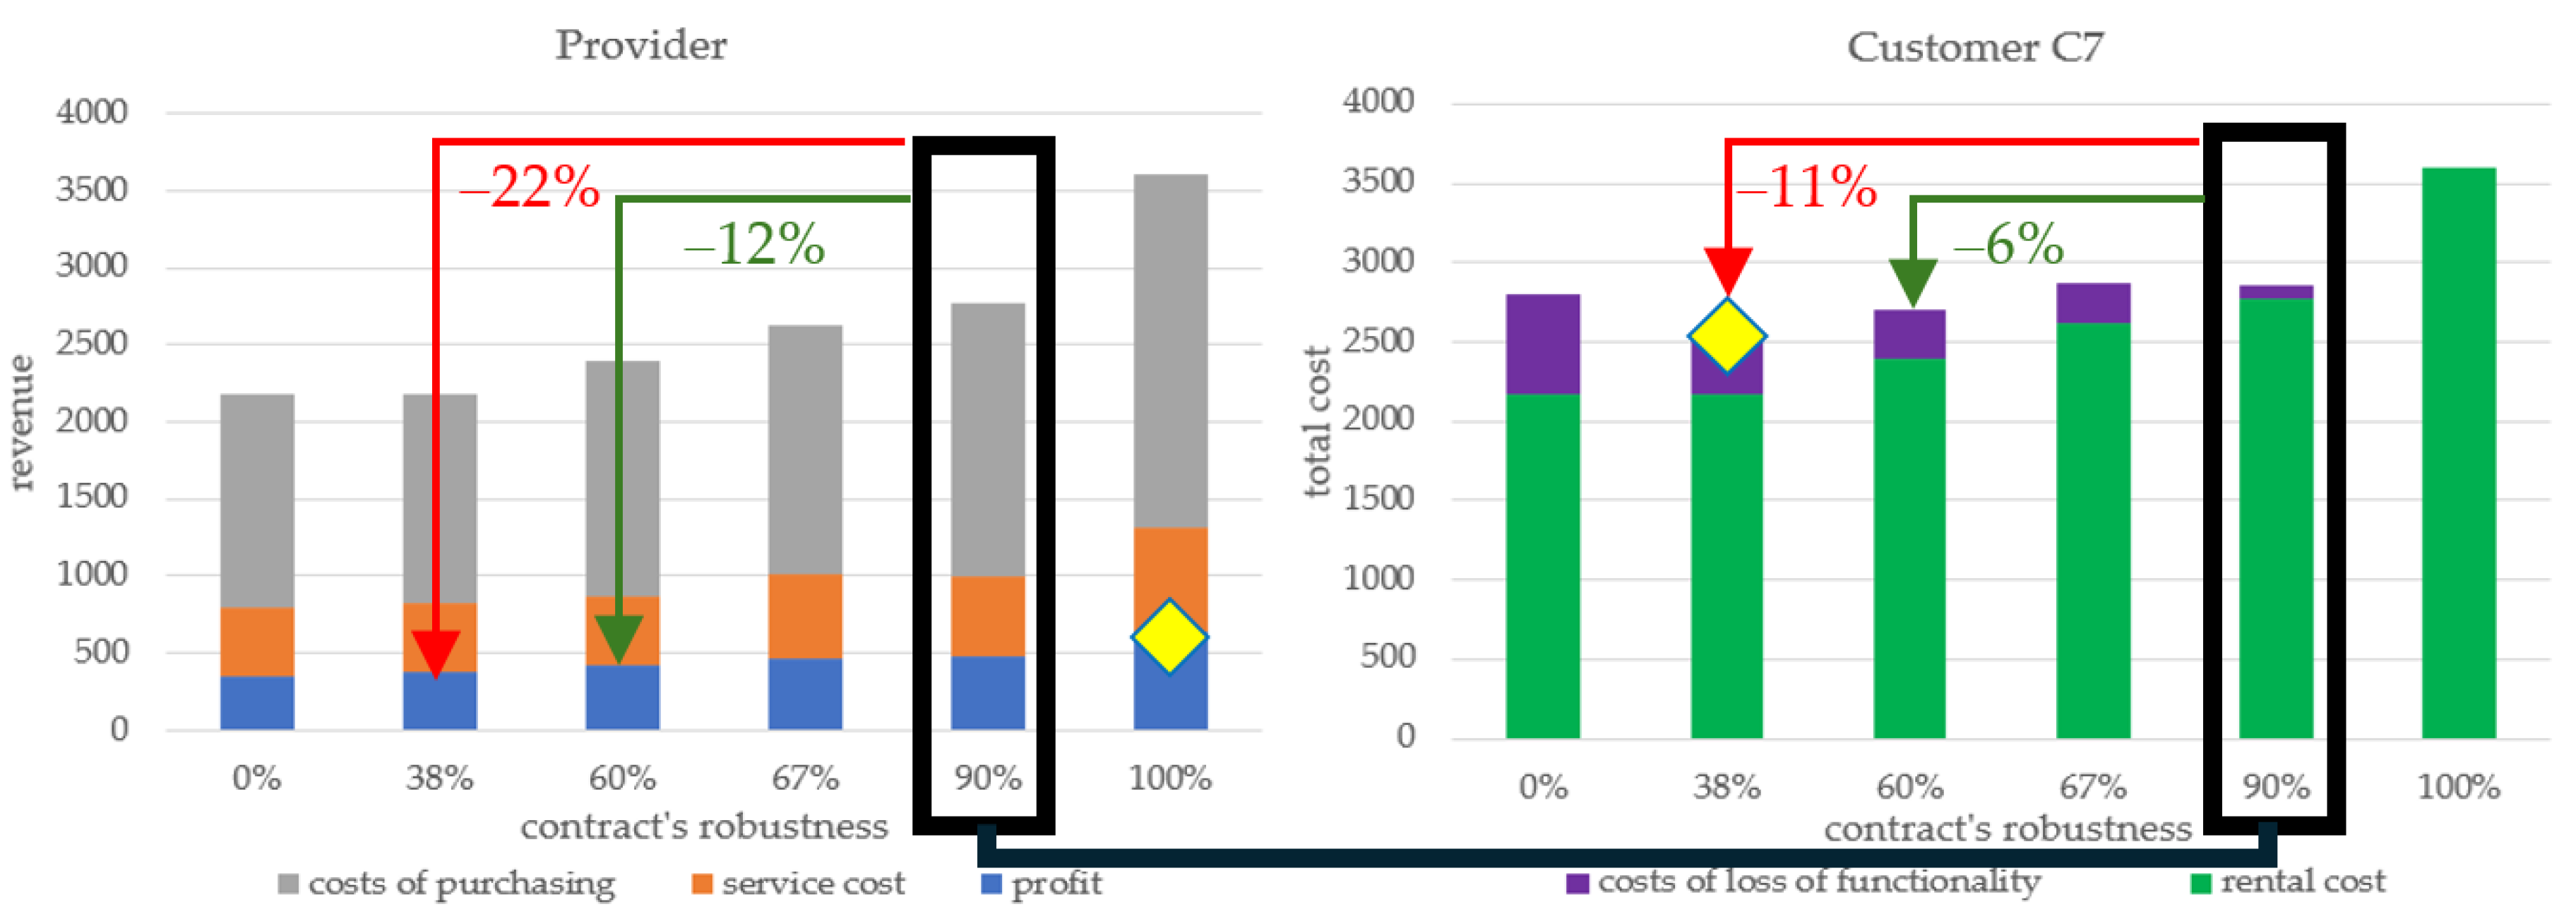
It is worth noting that the developed model can be used to assess sensitivity to changes in negotiated contracts. As an example, let us consider customer
: when using technology
, they obtained a contract
with robustness
(see
Table 8). Let us assume that this customer does not accept such a contract and is considering a variant in which the costs incurred by them are closer to the estimated minimum, see contracts with robustness
or
. Accepting these contracts would allow it to reduce costs by 6% and 11%, respectively—see
Figure 7. However, it turns out that for the provider, changing the proposed contract also results in a significant change in his profit, amounting to 12% and 22%, respectively. A change exceeding 15% is not acceptable to the provider, so only the first proposal can be the subject of further negotiations. The example presented is just one of many examples of the use of the developed model in the process of establishing leasing contracts.
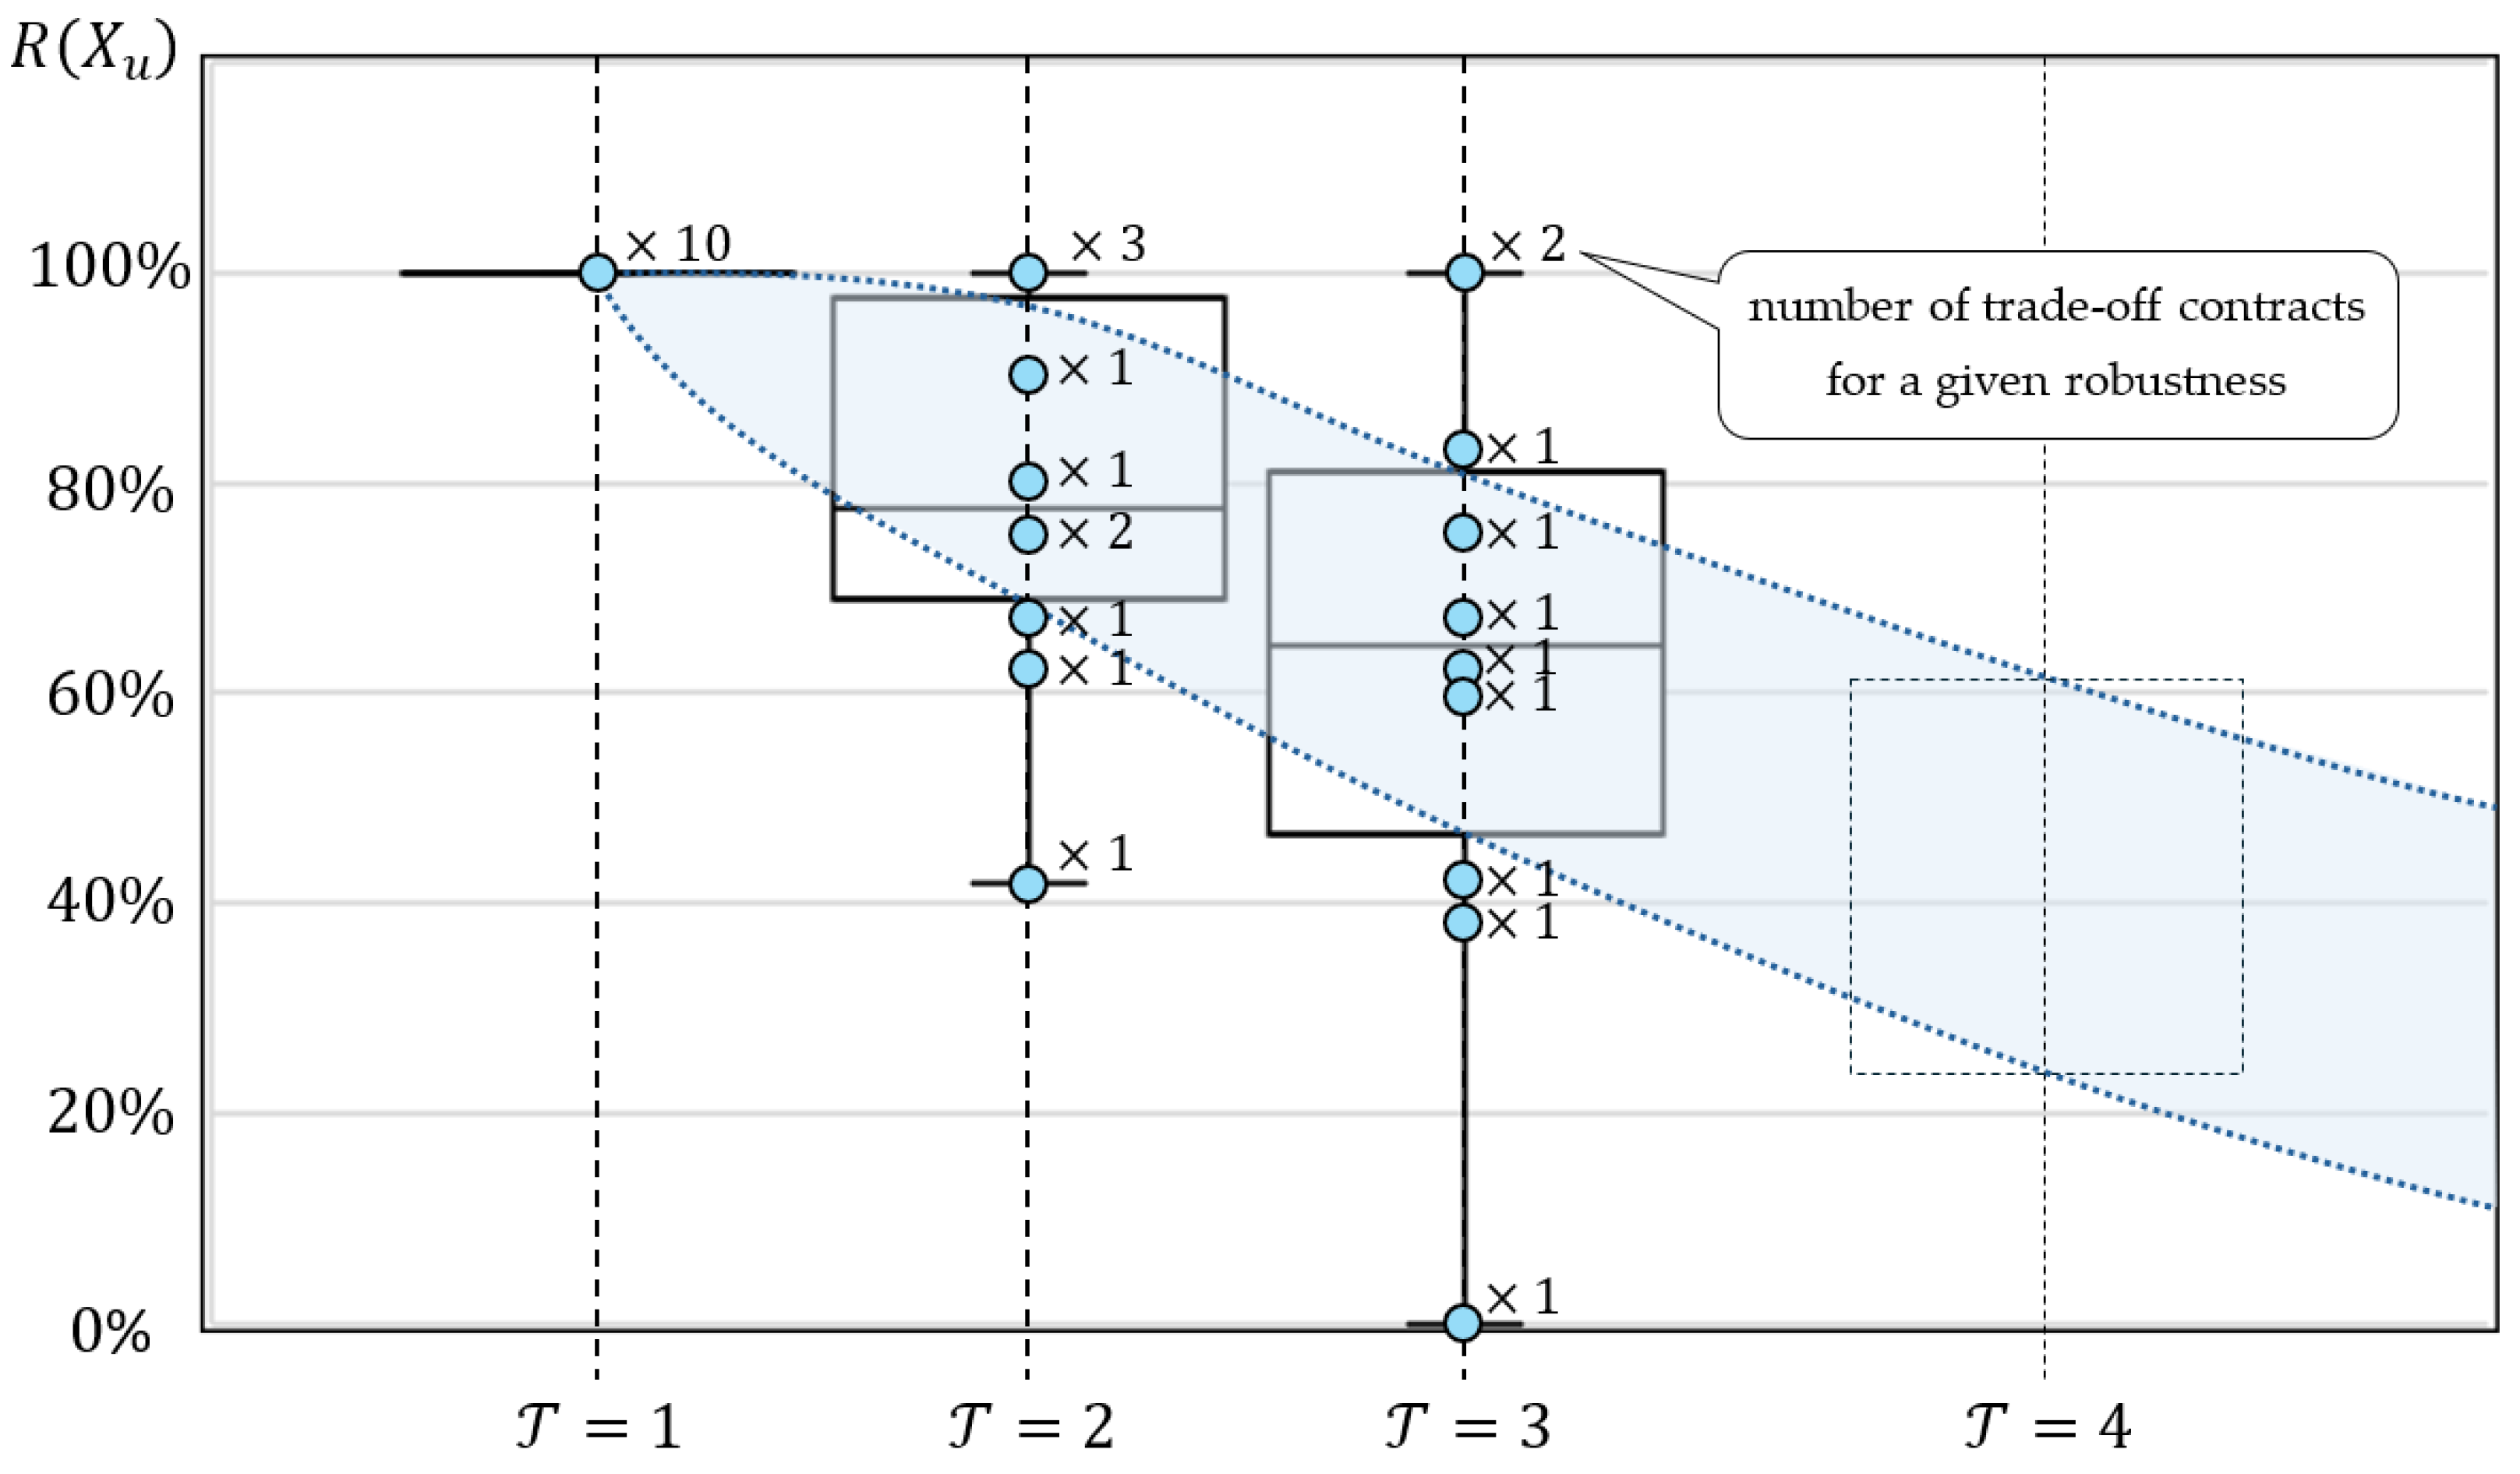
The observed trend (see
Figure 8) of decreasing redundancy (and therefore, the robustness of the ordered set of devices) of the selected contracts
with increasing technology level
is consistent with common practice.
This coincides with the observation that as the quality of leased devices increases, the user’s involvement in maintaining them decreases (reduction in maintenance costs). Moreover, in the general case, another trade-off takes place, this time between the outlays/costs related to redundancy (guaranteeing the assumed robustness of the offer) and the quality (guaranteeing reduced failure rate) of the leased devices. However, due to the limited volume of the work, examples illustrating this phenomenon were omitted, as well as an analysis of the convergence of the compromise points of the discussed case with the case between the expenses and the costs incurred in connection with the rental of the necessary devices. These threads will be developed in our next work.
The developed model enables a quantitative analysis of the aforementioned findings and facilities tracking their trends. Of course, the discussed above observations depend on the adopted values of parameters such as nominal costs of loss of functionality , frequency of failure to technology devices , service costs for the devices offered , etc. This means that there is no guarantee that this trend will be preserved as well with other values of these parameters. It is also worth noting that the declarative nature of the developed model (characterized by an open structure of the set of constraints) enables the so-called reverse process to be carried out, i.e., the synthesis process in which the values of the above parameters can be determined in such a way that they ensure a specific compromise between the PaaS provider and customers. In such a case, the answer to the following question is sought: are there such parameter values: , , , …, that will guarantee the existence of contracts with specific customer costs and the provider’s profit.
5. Conclusions
This study presents a declarative modeling framework designed to balance supply and demand in PaaS markets by optimizing three key pillars: profitability, cost efficiency, and sustainability. The developed approach integrates financial viability with operational efficiency, allowing both providers and customers to identify trade-offs between leasing offers and requests for quotations. By considering device lifecycle costs, technological advancements, and consumer constraints, the proposed model provides a comprehensive tool for decision making in PaaS environments.
The computational experiments conducted in this study demonstrate the practical applicability of the framework in real-world scenarios. The results confirm that achieving equilibrium between provider and customers requires an adaptive pricing strategy that accounts for device maintenance, failure rates, and redundancy. Furthermore, the findings highlight the importance of balancing technological investment with cost-saving mechanisms to ensure sustainable and profitable PaaS operations. The case study analysis reinforces the notion that optimal contracts rarely align perfectly with the interests of both parties, necessitating structured negotiations guided by trade-off functions.
Due to its declarative nature, the framework remains highly adaptable, allowing enterprises to tailor their parameters and constraints to their specific needs. Organizations operating in dynamic, service-oriented environments—such as mobility services, industrial leasing, or renewable energy systems—are particularly well suited for its application, as they can leverage its flexibility to balance cost, performance, and sustainability. For instance, manufacturing enterprises can use the framework to optimize spare parts logistics and equipment servicing, ensuring a balance between cost efficiency and uptime reliability. Similarly, technology companies offering cloud-based services or subscription-based hardware (e.g., SaaS or Hardware-as-a-Service) can leverage the framework to fine-tune service contracts, dynamically adjusting pricing based on resource usage and infrastructure costs.
A critical contribution of this research is the ability to model and assess sensitivity to changes in contract parameters. By exploring different leasing scenarios, the framework allows stakeholders to evaluate the impact of alternative pricing and redundancy strategies on both profitability and affordability. The observed trends suggest that increasing technology levels lead to decreased redundancy requirements, which aligns with industry practices of prioritizing higher-quality devices to reduce maintenance costs and enhance customer satisfaction.
Future research directions include expanding the framework to accommodate multiple providers and customers, integrating dynamic market conditions, and considering additional cost factors such as logistics, storage, and regulatory compliance. Further refinement of the model could also explore predictive analytics and machine learning techniques to enhance demand forecasting and pricing optimization. Additionally, incorporating real-time data streams could improve decision making by providing more responsive and adaptive pricing mechanisms.
Overall, this study advances the understanding of PaaS market dynamics by providing a structured, data-driven approach to achieving supply–demand balance while promoting financial sustainability and environmental responsibility. The proposed framework serves as a foundation for further exploration of equilibrium models in circular economy-based business models, contributing to the ongoing transformation of traditional ownership-based consumption toward service-oriented solutions.


