Article

Impact of Ozone Exposure on Chlorophyll Fluorescence, Pigment Content and Leaf Gas Exchange on Lonicera caerulea var. kamtschatica and Lonicera caerulea var. emphyllocalyx

Department of Food and Agriculture Production Engineering, University of Rzeszów, St. Zelwerowicza 4, 35 601 Rzeszow, Poland
*
Author to whom correspondence should be addressed.
Sustainability 2025, 17(7), 2820; https://doi.org/10.3390/su17072820
Submission received: 24 February 2025 / Revised: 20 March 2025 / Accepted: 21 March 2025 / Published: 22 March 2025

Abstract

:
Lonicera caerulea is a species known for its fruit with a rich health-promoting composition and the high frost resistance of its bushes. The increase in the popularity of this species and the number and area of plantations increases the risk of diseases and pests. However, the use of ozone gas may involve the risk of physiological damage to the plant. In this experiment, in 2022–2023, the physiological response of six varieties of Lonicera caerulea L. to gaseous ozone at a concentration of 5 ppm·1 min, 5 ppm·3 min and 5 ppm·5 min was determined. The flavonoid–nitrogen index (NFI) remained unchanged at 0.33 in both non-ozonated leaves and those exposed to a 5 ppm·3 min dose of ozone. In general, ozonation did not lead to significant changes in the physiological parameters observed for most of the varieties studied. The mean performance index (Pitotal) value of the ozonated leaves decreased by 23.1% for LE ‘Lori’ and 23.8% for ‘139-24’, after applying an ozone dose of 5 ppm·5 min in 2022. A significant decrease of 34.3% in the average transpiration rate (E) was observed after the use of 5 ppm·5 min ozone in plants of the variety ‘21-17’ across both years of cultivation. The different effects of the ozone doses used may indicate different reactions depending on the variety used and the year of cultivation. Overall, the study found that ozone does not have a phytotoxic effect on most varieties, which may indicate different reactions and differences between varieties. The use of an appropriate dose of ozone did not cause any disruption in the selected physiological parameters of Lonicera caerulea L. plants. The absence of phytotoxicity in some varieties may allow the use of ozonation treatments in agriculture; however, further research on the long-term effects on plants is required.

1. Introduction

Genus Lonicera is one of 200 species belonging to family Capirfoliace. An important species from Central Asia and Eastern Europe is the blue honeysuckle—Lonicera caerluea [1]. This species contains several botanical varieties, such as L. caerulea var. kamtschatica, altaica, edulis, emphyllocalyx and boczkarnikovae, found in regions of Russia and Japan. Lonicera caerulea L. has a well-known botanical variety, L. kamtschatica, which is commonly referred to in Poland as the ’Kamchatka berry’. It is recognized as one of the first fruit-bearing plants to mature in Poland [2,3]. Referred to as the ’haskap berry’, L. caerulea var. emphyllocalyx Nakai, which originated from Hokkaido, is a lesser-known botanical variety of Lonicera caerulea L., which thrives in the cold intermountain areas from central to northern regions of Japan [4]. L. caerulea varieties are well known for their rich content of compounds such as cyanidin-3-glucoside and chlorogenic acid, which have a wide range of health-promoting effects [5,6]. Lonicera caerulea can reach heights of 0.8 to 3.0 m, has a lifespan of 25 to 30 years and is well adapted to adverse environmental conditions that induce plant growth [7]. The phytochemical composition of Lonicera caerulea L. provides various advantages for its growth, development and resistance to environmental stresses. These compounds also play a key role in improving the plant’s ability to interact effectively with its environment [8,9].
Ozone (O3) is a broad-spectrum, high-efficiency and rapid bactericidal compound known for its strong oxidant effect [9]. Its application in suitable doses can influence the levels of bioactive compounds and positively impact storage possibilities by minimizing water loss, reducing microbial contamination and lowering ethylene emissions from treated fruits [10,11,12]. Due to its wide range of applications, apart from food processing, ozonation is increasingly used in agriculture [13]. The effective use of ozonation in agricultural practices requires determining the appropriate dose of ozone, which may vary depending on the plant species, variety and propagation season. Long-term exposure to ozone gas can cause a number of disorders in plant growth and development, thereby reducing plant growth, disturbing its gas exchange and the synthesis of biochemical compounds and reducing yield [14]. Numerous scientific studies have documented a decline in net photosynthesis (PN) as a result of exposure to elevated ozone levels. Photosynthesis is the primary physiological process impacted by excessive ozone in the troposphere, particularly in sensitive plants [15,16]. Physiological damage that may occur after the use of ozone gas requires the determination of an appropriate ozone dose, which may prevent a decrease in plant health [17,18]. Ozone eliminates agricultural pests through multiple mechanisms. It can penetrate cell walls and disrupt the enzyme metabolism of insects [13,19]. Ozone treatment, along with its ability to remove pesticide residues, has made it a widely adopted, residue-free method for improving soil quality, sanitizing food and purifying water [20]. The use of ozonation in plant production can be an effective means of reducing fungal diseases, reducing the microbial load and eliminating plant pests that transmit diseases [15,21]. When ozone is applied to soil or nutrient solutions, it boosts oxygen levels, which subsequently improves root respiration [22]. The European Green Deal’s regulations, which seek to drastically cut the application of agricultural pesticide products in agriculture, are accelerating the lookout for sustainable alternatives. The search for eco-friendly alternatives that enhance plant protection while ensuring crop quality, safety and production profitability is being driven by initiatives aimed at drastically reducing the use of plant protection products in agriculture [23]. Due to the growing popularity of Lonicera caerulea var. kamtschatica and Lonicera caerulea var. emphyllocalyx, along with the large scale of their cultivation, using an appropriate dose of gaseous ozone could be beneficial in agrotechnical treatments for these species [24].
This study analyzes the main physiological characteristics of two botanical varieties of Lonicera caerulea after ozonation, such as the content of chlorophyl, flavanols and anthocyanins; chlorophyll fluorescence properties; and leaf gas exchange parameters. This study may reveal the effect of gaseous ozone on the physiological properties of plants and the possibility of using ozone treatments during cultivation. The research results are of great significance for improving the ozonation technology used on Lonicera caerulea.

2. Materials and Methods

2.1. Plant Material

The experiment was conducted in a potted plant nursery located in Tyczyn (49°57′52″ N 22°2′47″ E, Subcarpathian Voivodship, Poland), during years of 2021–2023. Plants of Lonicera caerulea var. kamtschatica cultivars ‘Vostorg’, ‘Jugana’ and ‘Aurora’, later referred to as LK, and Lonicera caerulea var. emphyllocalyx ‘Lori’, ‘21-17’ and ‘139-24’, later referred to as LE, were used in this study. The research material consisted of 3-year-old plants with a height of 1.40 cm to 1.50 cm in the early stage of fruit development. Growth conditions, fertilization method and weather conditions prevailing during this experiment are mentioned in our previous study [25].

2.2. Ozone Treatments

In each year of the experiment, ozonation was performed three times: during fruit setting, greening and ripening. Gaseous ozone was used at a concentration of 5 ppm for 1 min, 3 min and 5 min (flow 40 g O3·h−1). The concentrations used in the experiment were selected based on preliminary experiments, the results of which are not published in this experiment. Preliminary studies were carried out in 2021, on the same group of plants, at different times, to determine the optimal ozone dose and the appropriate time of day for ozonation. Based on preliminary research, it was determined that doses of gaseous ozone higher than 5 ppm·5 min caused visible symptoms of physiological damage in half of the ozonated plants. The optimal time of day for ozonation was the evening; ozonation performed in the morning when the plants were covered with dew or during the day when the sun was shining intensely resulted in increased symptoms of phytotoxicity [Figure 1].
Ozone was produced with KORONA A 40 Standard (Korona, Piotrków Trybunalski, Poland) with the UV-106-M ozone solution detector (Ozone Solution, Hull, MA, USA). The ozonation treatment was performed in a chamber with dimensions of 1.50 × 1.20 × 1 m, created for the purposes of the study. Temperature and relative humidity inside and outside the chamber during ozonation were measured using BRESSER ClimaTemp IO (Bresser, Rhede, Germany). The plants taking part in the experiment were randomly divided; ten plants were used in the treatment and control groups. Plants were ozonated in batches of 10, and each variety was ozonated individually. Immediately after the ozonation treatment, the generator was turned off and the chamber was opened and the plants removed. An even distribution of ozone was possible thanks to two pipes that supplied ozone from two sides and a fan that allowed for the even injection of ozone into the cubicle of the entire chamber. Before taking measurements of physiological traits, several young upper shoots with young leaves were marked on each plant. Each measurement of physiological traits (pigment content, chlorophyll fluorescence and gas exchange) was taken from young leaves located on these shoots; measurements were taken from each of the ozone-exposed plants. The parameters studied during the experiment were measured in accordance with the order established during ozonation.

2.3. Content of Chlorophyl, Flavanols and Anthocyanins

The content of chlorophyll (ChlM; T850 nm/T720 nm), flavonols (FlvM, F660 nm/F325 nm) and anthocyanins (AnthM; F660 nm/F525 nm) in Lonicera caerulea L. plants was determined using an MPM-100 multi-pigment meter (ADC Bioscientific Ltd., Hoddesdon, UK), based on the methodologies in study of Cerovic et al., 2008 [26]. The analysis was repeated in each year of the study, at the same time interval. Pigment content was measured on the 1st, 3rd and 5th day after ozonation. For each measurement, one leaf per plant was selected. Data were analyzed from 10 measurements each (one per plant), for both treatment and control groups. Using the initial data regarding content of chlorophyll and flavonols, the nitrogen–flavonol index (NFI; (T850/T720)/(F660/F3)) was calculated.

2.4. Chlorophyll Fluorescence

The OJIP fluorescence transient analysis was conducted using OS30p Chlorophyll Fluorometer (Opti-Sciences, Hudson, NH, USA). Fully developed young leaves were used for analysis. Before measurement, leaves were dark adapted for 20 min. The analysis was repeated in each year of the study, at the same time interval. Fluorescence analyses were performed on the 1st, 3rd and 5th day after ozonation. For each measurement, one leaf per plant was selected. Data were analyzed from 10 measurements each (one per plant) for both treatment and control groups. The OJIP fluorescence parameters were calculated based on the formulas shown in Table 1.
The study evaluated the initial parameters of minimum fluorescence (Fo) measured at 50 µs, F0—O step measured at 20 µs, FJ—J step measured at 2 ms, FI—I step measured at 60 ms and maximum fluorescence (Fm) and variable fluorescence (Fv) according to Baker et al., 2004 [27]. The Fv/Fm ratio represents the maximum quantum yield of photosystem II (PS II) and serves as an indicator of the maximum efficiency of excitation energy transfer. The potential activity of PSII (Fv/Fo), sensitive stress detecting parameters, were measured. The JIP test translates the initial parameters to biophysical parameters, used to calculate fluorescence required for calculation of the initial slope (Mo) and total fluorescence performance index (PItotal) [28,29].

2.5. Gas Exchange Parameters of Lonicera caeruelea L.

Gas exchange parameters of Lonicera caerulea L. were measured using LCi T (ADC BioScientific Ltd., Hoddesdon, UK). The study evaluated the following gas exchange parameters: CO2 assimilation rate—A (µmol·mol−1), stomatal conductance—Gs (mol·m−2s−1), transpiration rate—E (mol·m−2s−1) and sub-stomatal CO2 concentration—Ci (µmol·mol−1), based on the methodologies in study of Joshi et al., 2020 [30]. The analysis was repeated in each year of the study, at the same time interval. Gas exchange parameters were measured on the 1st, 3rd and 5th day after ozonation. For each measurement, one leaf per plant was selected. Data were analyzed from 10 measurements each (one per plant), for both treatment and control groups.

2.6. Statistical Analysis

The Statistica 13.3. program (TIBCO Software Inc., Tulsa, OK, USA) was used to calculate results of a statistical evaluation, which included analysis of variance (ANOVA) and the significance LSD test at a significance level of α = 0.05. The Kolmogorov–Smirnov test was used to check whether the data followed a normal distribution, while the Brown–Forsythe test was employed to evaluate the homogeneity of variances.

3. Results and Discussion

3.1. The Value of Individual Pigments and the Nitrogen–Flavonol Index of Leaves

Pigments contained in leaves have a significant impact on plant biological processes. Plant stress caused through external factors can disrupt the biosynthesis of pigments in leaves and also accelerate their degradation. The extent of variation in chlorophyll levels is often regarded as an indicator of a plant’s sensitivity [31]. The content of individual pigments and the nitrogen–flavonol index (NFI) depending on the year of the experiment and the tested botanical variety is presented in Table 2.
In the analyzed plants, the average values of individual pigments and the average nitrogen–flavonol index (NFI) were determined to be as follows: ChlM—0.45, FlvM—1.41, AnthM—0.11 and NFI—0.33. The LK plants exhibited a higher average content of the tested pigments, with LK leaves having an 11.2% higher ChlvM compared to the LE plants. The nitrogen–flavonol index coefficient varied significantly between varieties within the LE group. The average NFI value in the tested botanical varieties was the same—0.33. The pigment values in the LK and LE leaves did not differ significantly depending on the year of cultivation. Chlorophyll levels serve as reliable indicators of a plant’s nitrogen status. In nitrogen deficit, plants generate increased amounts of flavonoids or carbon-based compounds. Since nitrogen is essential in the composition of chlorophyll in leaves, assessing chlorophyll levels can help determine the plant’s nutritional status in relation to this element and the potential negative impact of external factors on the plant [32,33].
Quantitative indicators of plant health can be assessed either during or immediately after abiotic and biotic stresses. Increased ozone content in the atmosphere can be a stress factor, causing a loss of chlorophyll in plant leaves, thereby reducing photosynthetic power [14]. The effect of gaseous ozone on LK and LE leaves was different depending on the applied dose and the day of measurement (Table 3).
The effect of gaseous ozone doses applied to the botanical varieties was similar. Significant differences between the tested plants occurred only after the dose of 5 ppm·5 min was applied. In our experience, a decrease in the tested parameters was observed in most variants on the 3rd day after ozonation. Despite the lack of visible plant damage by gaseous ozone, the use of ozone for 5 min significantly reduced the average value of the ChlM parameter, and consequently, the nitrogen–flavonol index. The use of an ozone dose of 5 ppm·5 min, compared to the control sample, resulted in a decrease in the average ChlM and NFI parameters by 6.8% and 8.8%, respectively. A similar relationship can be observed in the study of Boublin et al., 2022 [34], where ozonation caused a decrease in the chlorophyll content in Arabidopsis thaliana; however, the response varied depending on the variety. Plant response to ozone may vary depending on plant species, variety, weather and ozone concentration. In study of Brazaitytė et al., 2009 [35], the use of gas had an effect depending on the plant species tested; however, it led to a reduction in the levels of chlorophyll and carotenoids.
The application of ozone gas at a dose of 5 ppm for 3 min did not significantly affect the tested parameters, compared to the control sample. This may indicate that ozone at this dose does not induce plant stress in Lonicera caerulea L. Similarly, in a study conducted by Fujiwara et al., 2009 [36], the application of lower doses of ozone did not cause stress reactions in cucumber leaves; while having the ability to disinfect powdery mildew, higher doses of ozone spray showed visible physiological disorder. The use of an appropriate dose of ozone to eliminate pests and reduce residues of plant protection products is consistent with the assumptions of sustainable agriculture, which encourages a decrease in pesticide use [10,37,38].
Based on the analysis of individual pigments of the LK and LE plants, it is concluded that the appropriate dose of gaseous ozone, 5 ppm for 3 min in our experiment, does not cause significant changes in the pigment content in leaves, thus not causing any disturbances in plant photosynthesis. The use of a longer time or a higher concentration of gaseous ozone may cause changes in the ChlM content and the nitrogen–flavonol index parameter. Applying an ozone dose of 5 ppm for 5 min significantly reduced the ChlM and NFI values in the tested plants, suggesting a potential negative impact of ozone.

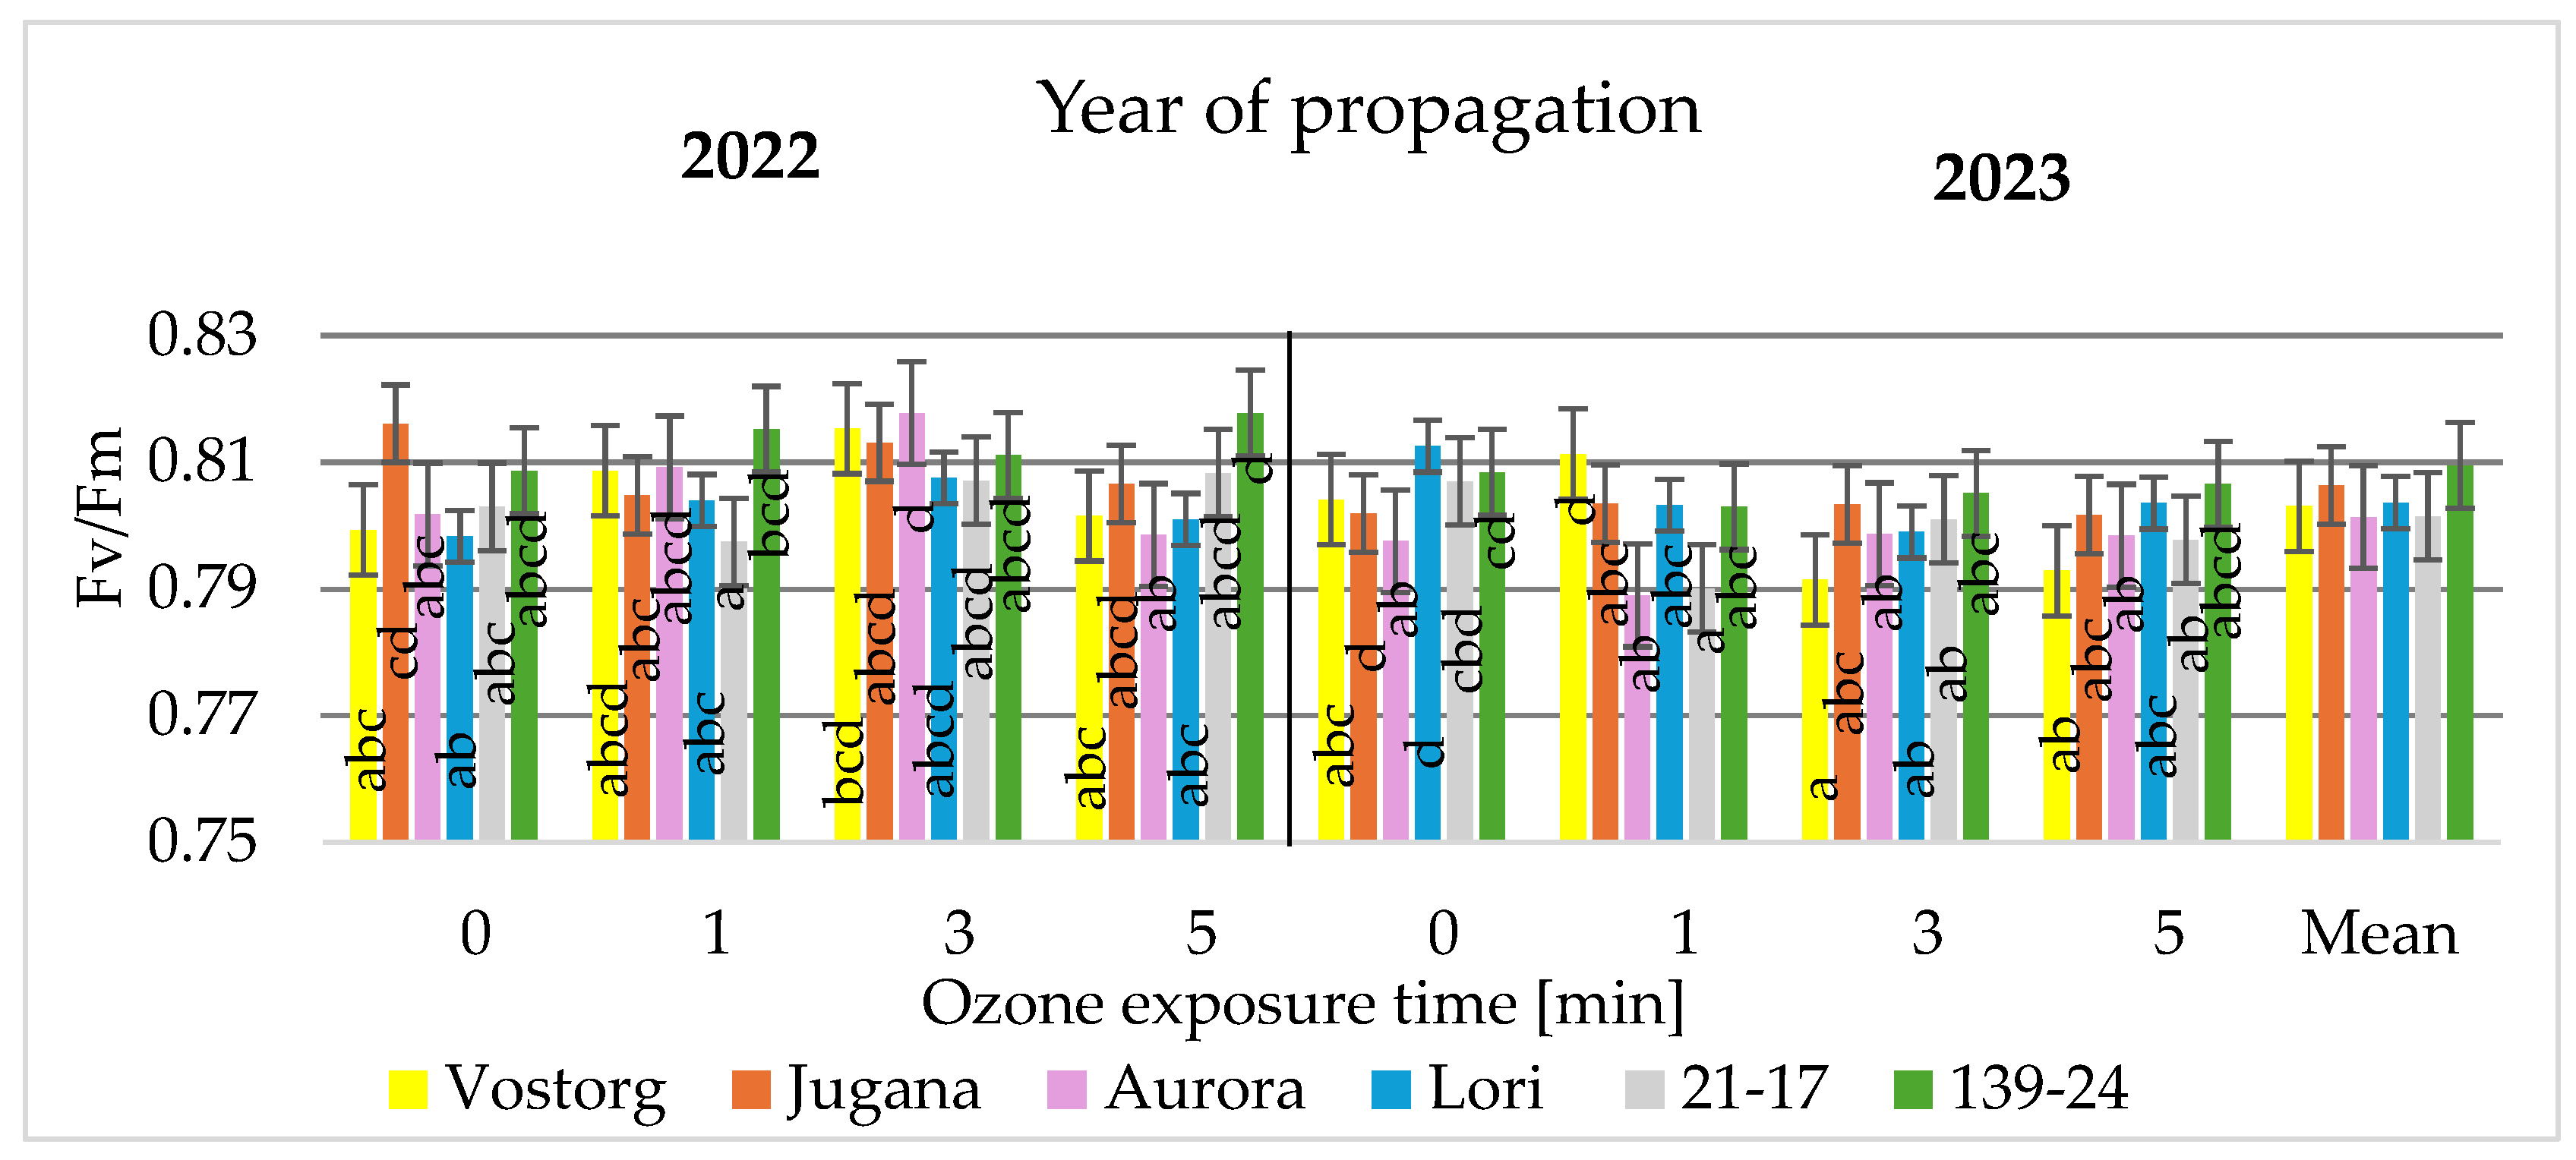
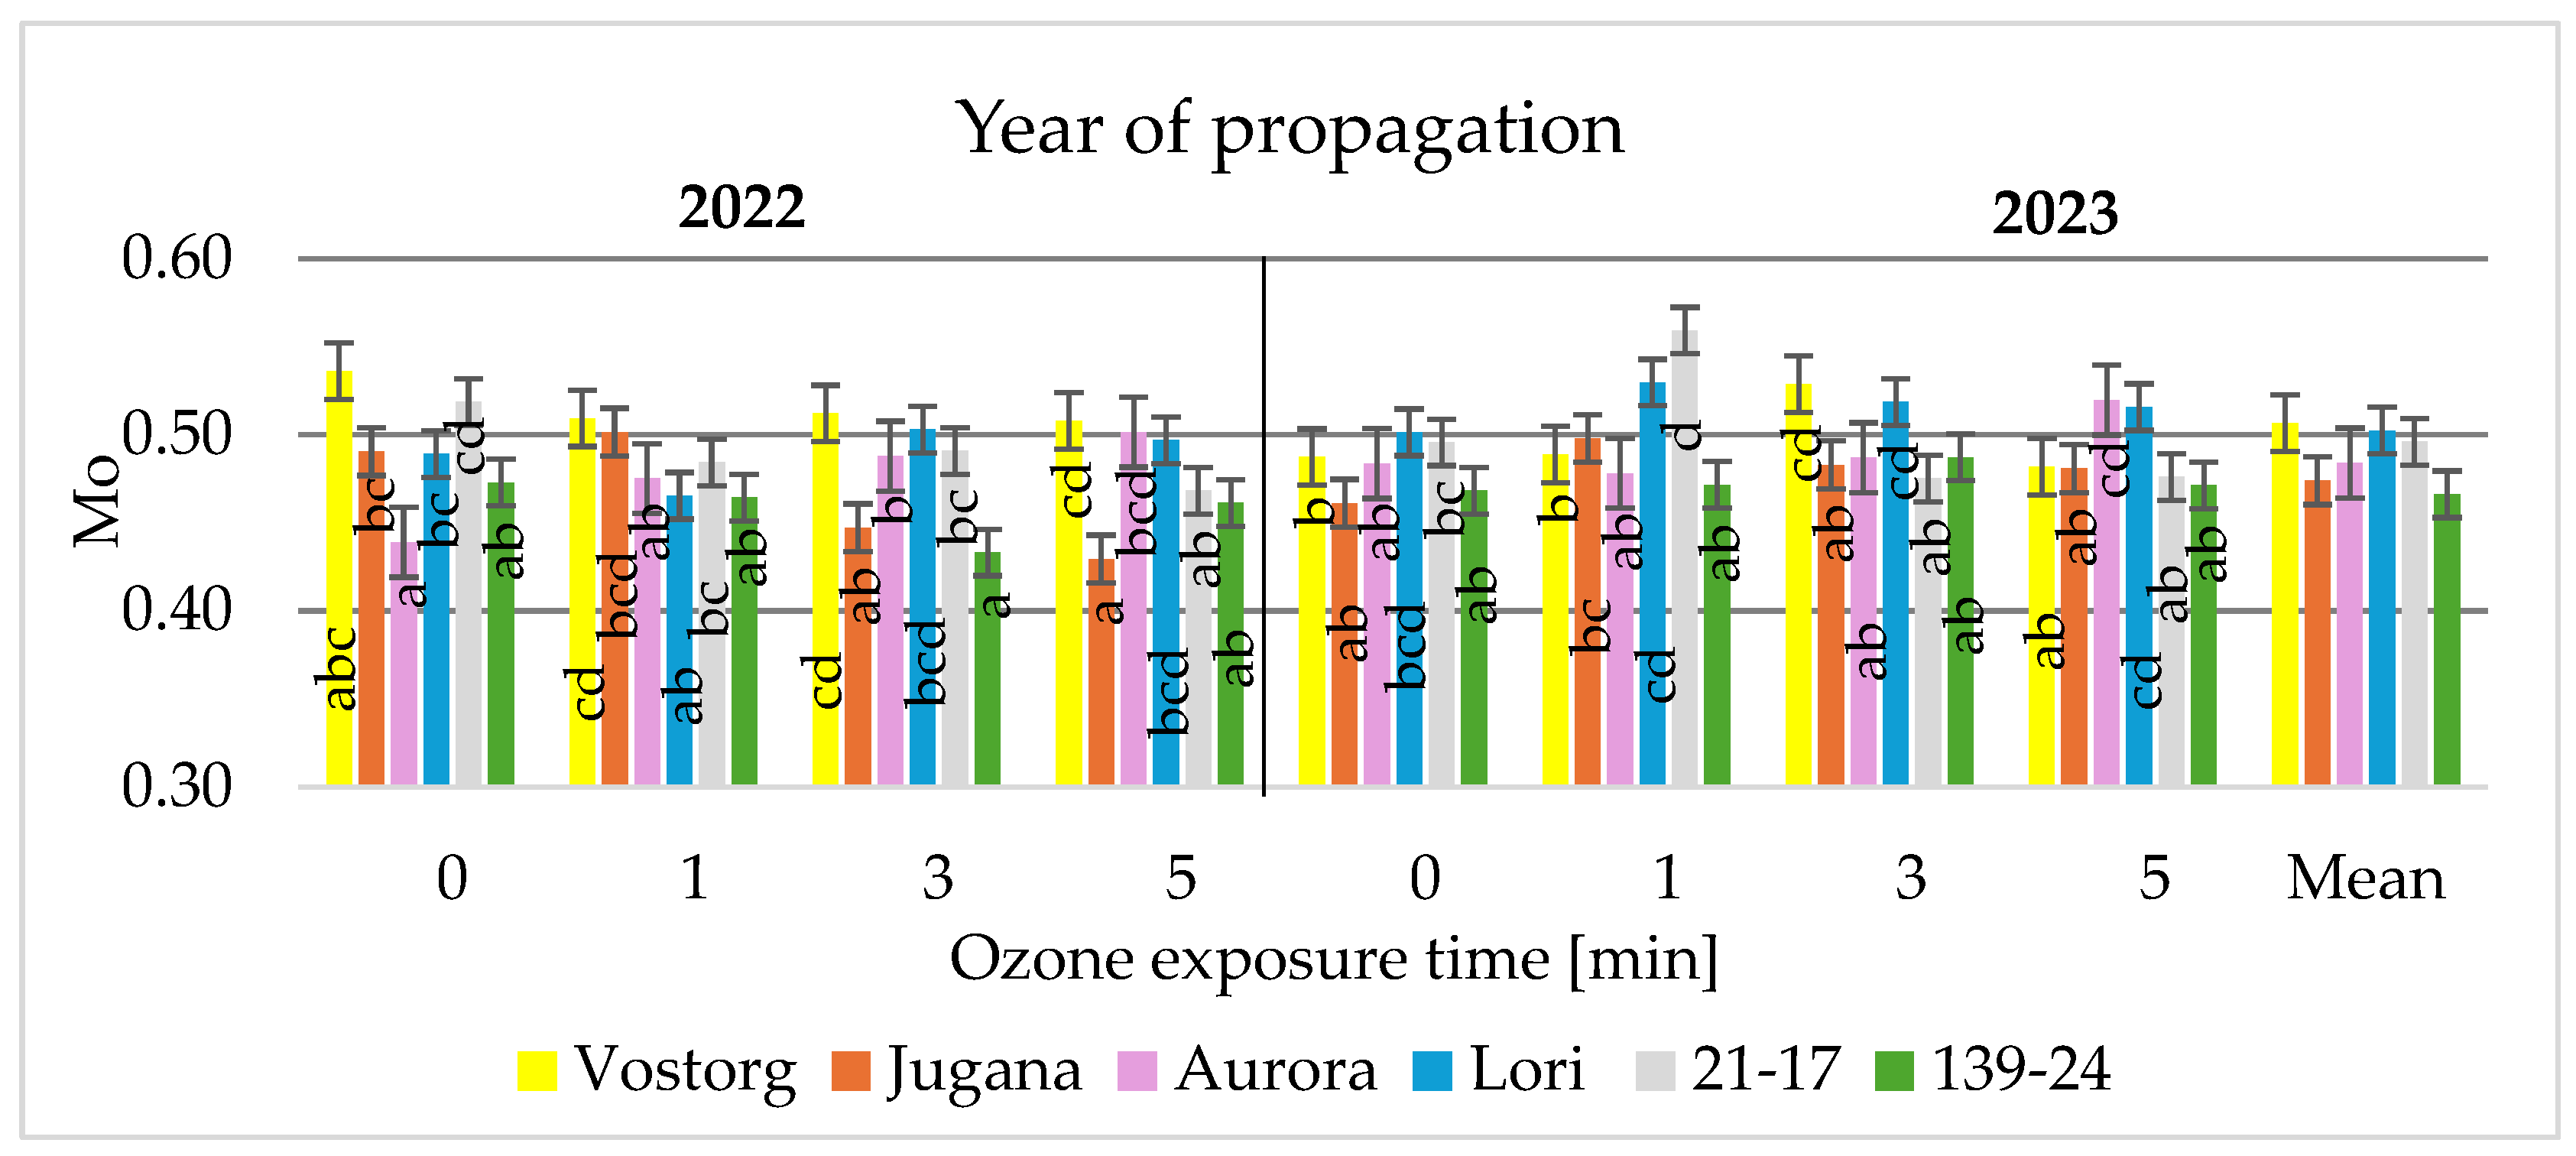
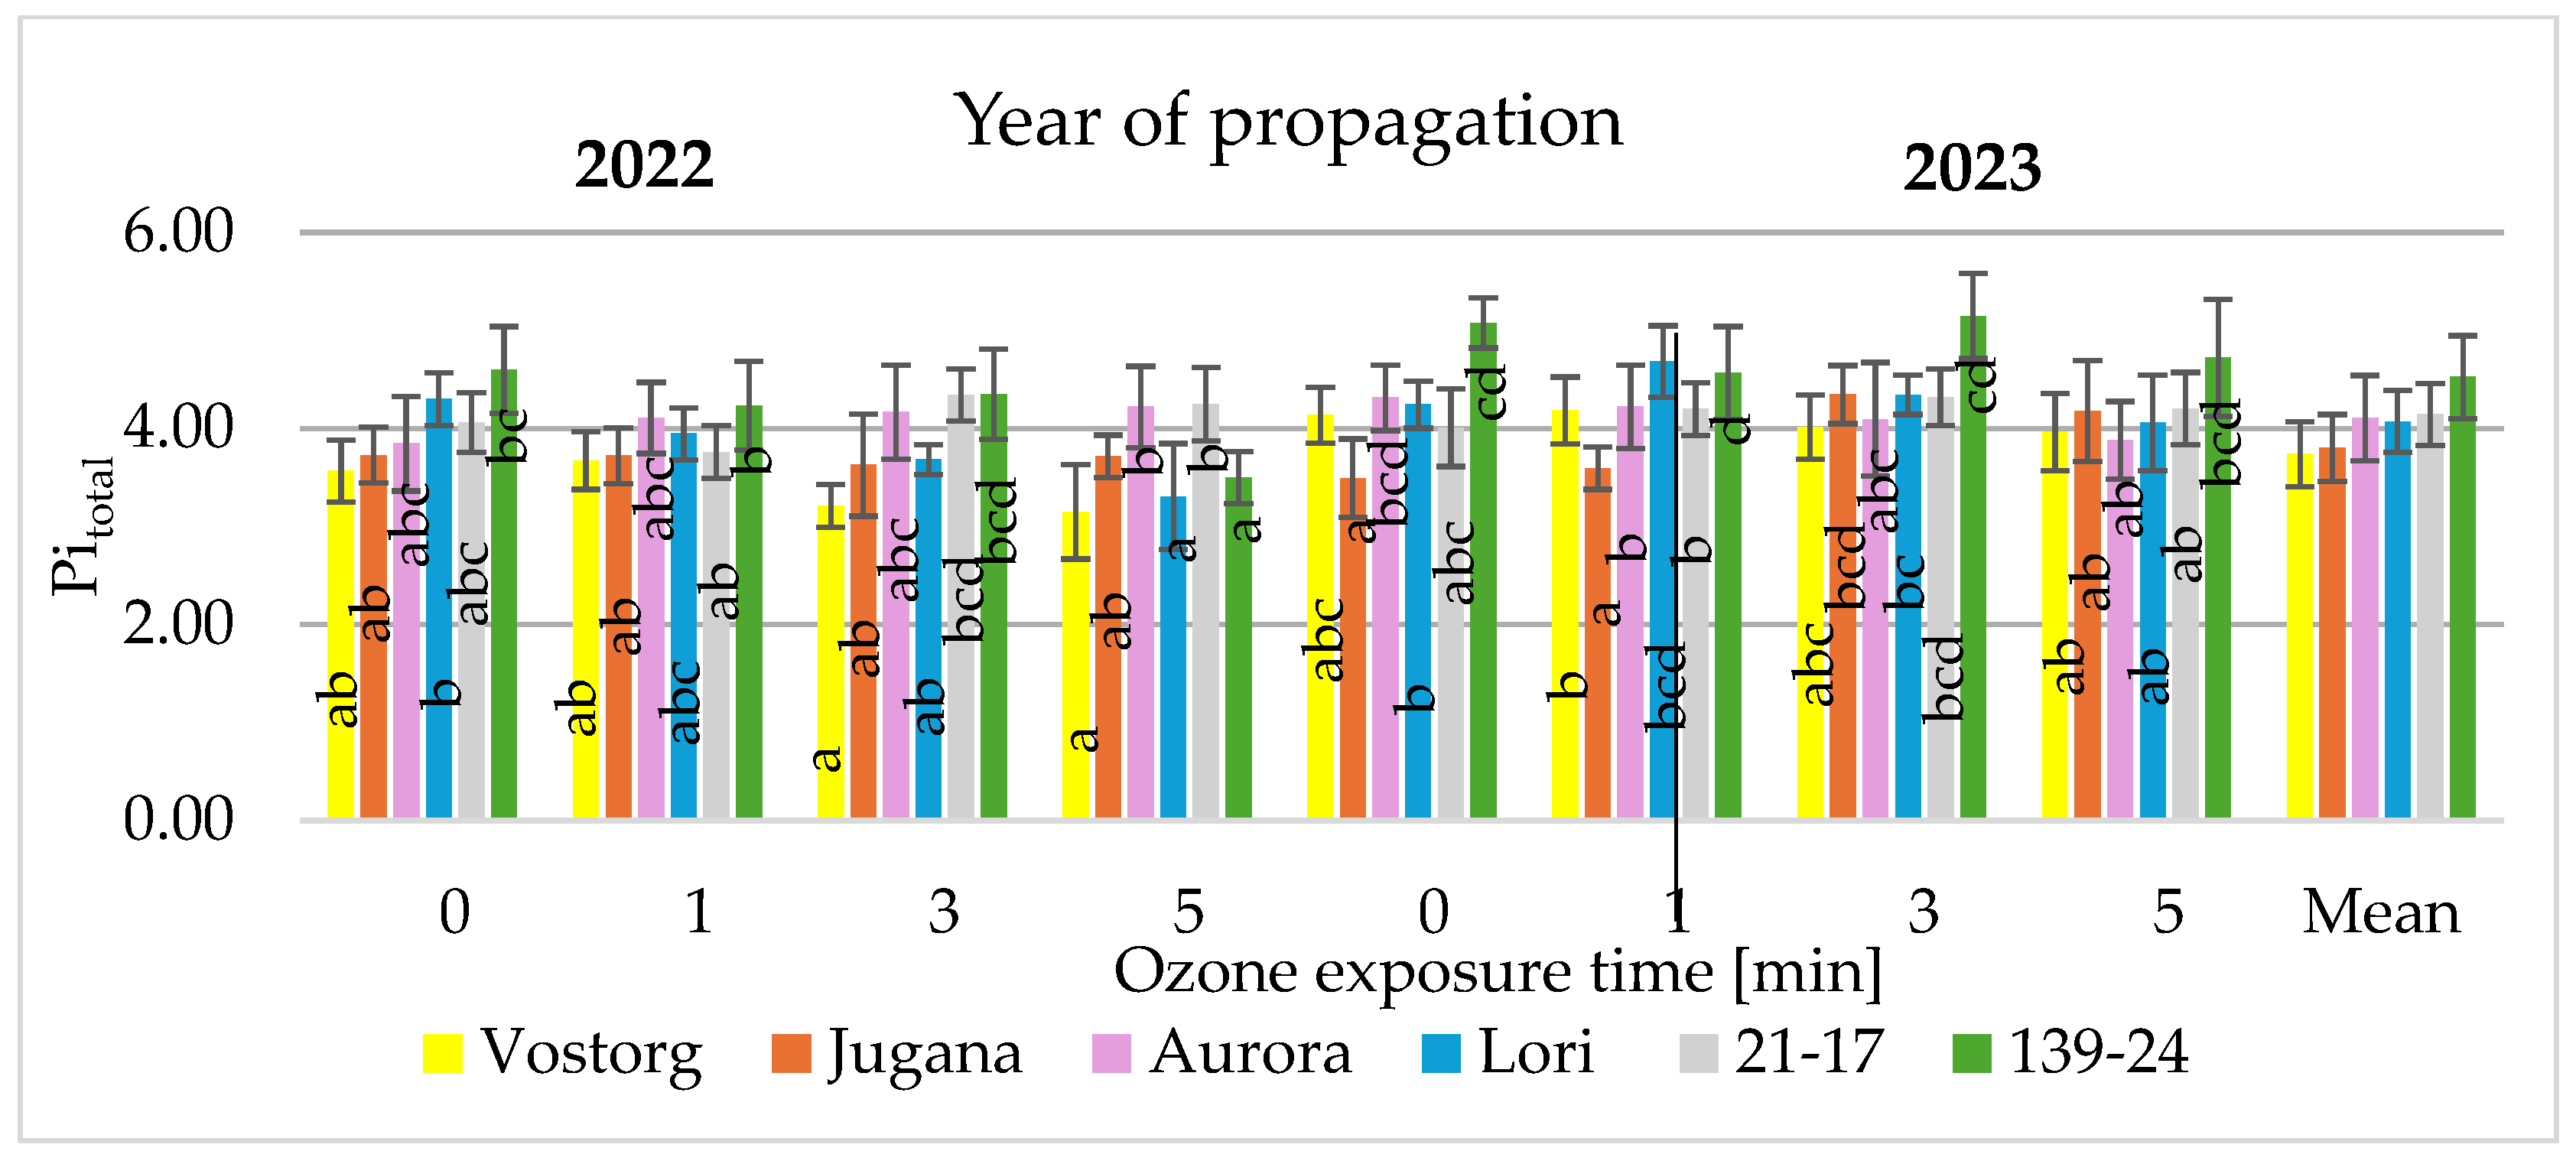
3.2. Physiological Parameters of Leaves

Stress occurring in the growing environment of the selected plants leads to a reduction in the maximum quantum efficiency of the photosystem. The maximum quantum efficiency of the photosystem II (Fv/Fm) serves as a commonly used measure to evaluate the condition of photosynthesis in plants [39]. The influence of ozone gas on Fv/Fm of LK and LE is presented in Figure 2. The Fm/Fv value in LK and LE leaves ranges from 0.79–0.81, regardless of the year of cultivation and the dose of gaseous ozone. The most favorable Fv/Fm range is from 0.79 to 0.84 for many species of plants. Reduced values may indicate the occurrence of plant stress [40].
The use of gaseous ozone does not have a significant effect on the tested parameter in any of the tested varieties. The average Fv/Fm value of the leaves not subjected to ozonation was 0.80, and that of the leaves ozonated at any dose was 0.81. Conducting the Fv/Fm test on plants allows for an easy assessment of whether the applied biotic and abiotic factors have a stressful impact on the tested plants [39]. A similar relationship can be observed in the study of Zardzewiały et al., 2024 [41], where the gaseous ozone did not significantly impact the Fv/Fm parameter of tomato leaves.
The net rate of PS II closure (Mo) is one of the important physiological parameters defining the rate of primary photochemistry [41]. The impact of ozone gas on the Mo of the LK and LE varieties is presented in Figure 3.
The value of the Mo parameter depends on the year of the experiment, the plant variety and the dose of ozone used. The Mo value in LK and LE leaves ranges from 0.43–0.56, regardless of the year of cultivation and the dose of gaseous ozone. The use of gaseous ozone had no significant effect on the average value of the Mo parameter in most of the LK and LE leaves. However, in 2022, the LK variety ‘Jugana’ responded differently, showing a 12.5% decrease in the Mo value of ozonated leaves compared to the control sample. In the study of Thwe et al., 2014 [42], the authors observed an increase in the Mo parameter in ozonated plants by 26%. In our experience, a similar relationship can be observed in the LK ‘Aurora’ variety, which was characterized by an increase in Mo in 2022 and 2023 in ozonated leaves by 14.3% and 7.5%, respectively. Fluctuations in the Mo parameter of ozonated leaves may cause alteration of the photosynthesis processes during growth [43]. Deviations in the Mo value of ozonated LK and LE leaves may cause disturbances in plant photosynthesis.
The performance index of absorption basis (Pitotal) is a multi-parametric expression of these three independent steps contributing to photosynthesis [44]. The performance index is utilized in multiple studies to measure the impact of environmental factors like cold stress, heat, drought and ozone on photosynthesis [45,46]. The influence of ozone gas on the Pitotal of the LK and LE varieties is presented in Figure 4.
The Pitotal parameter value is influenced by the year of the experiment, the plant variety and the dose of ozone used. The use of an ozone dose of 5 ppm·5 min in 2022, compared to the control sample, resulted in a decrease in the average Pitotal value of the LE varieties ‘Lori’ and ‘139-24’. The mean Pitotal value of the leaves of ‘Lori’ and ‘139-24’, ozonated for 5 min, was lower by 23.1% and 23.8%, respectively. For the remaining tested varieties, the Pitotal value in the ozonated leaves did not differ significantly from the control sample, regardless of the propagation year. According to study of Bussotti et al., 2007 [16], the use of leaf ozonation resulted in a decrease in the performance index (Pitotal). In the study of Ballarin-Denti et al., 2005 [47], ozonation increased the Pitotal value, thus increasing the photosynthetic efficiency of Quercus robur and Pulus nigra. The susceptibility of plants to gaseous ozone is a species characteristic; some species may not react in the same way as others. The results obtained in the experiment indicate a different effect of ozone on varieties within one species. The lack of significant differences between the non-ozonated and ozonated plants indicates the good physiological condition of the plants.

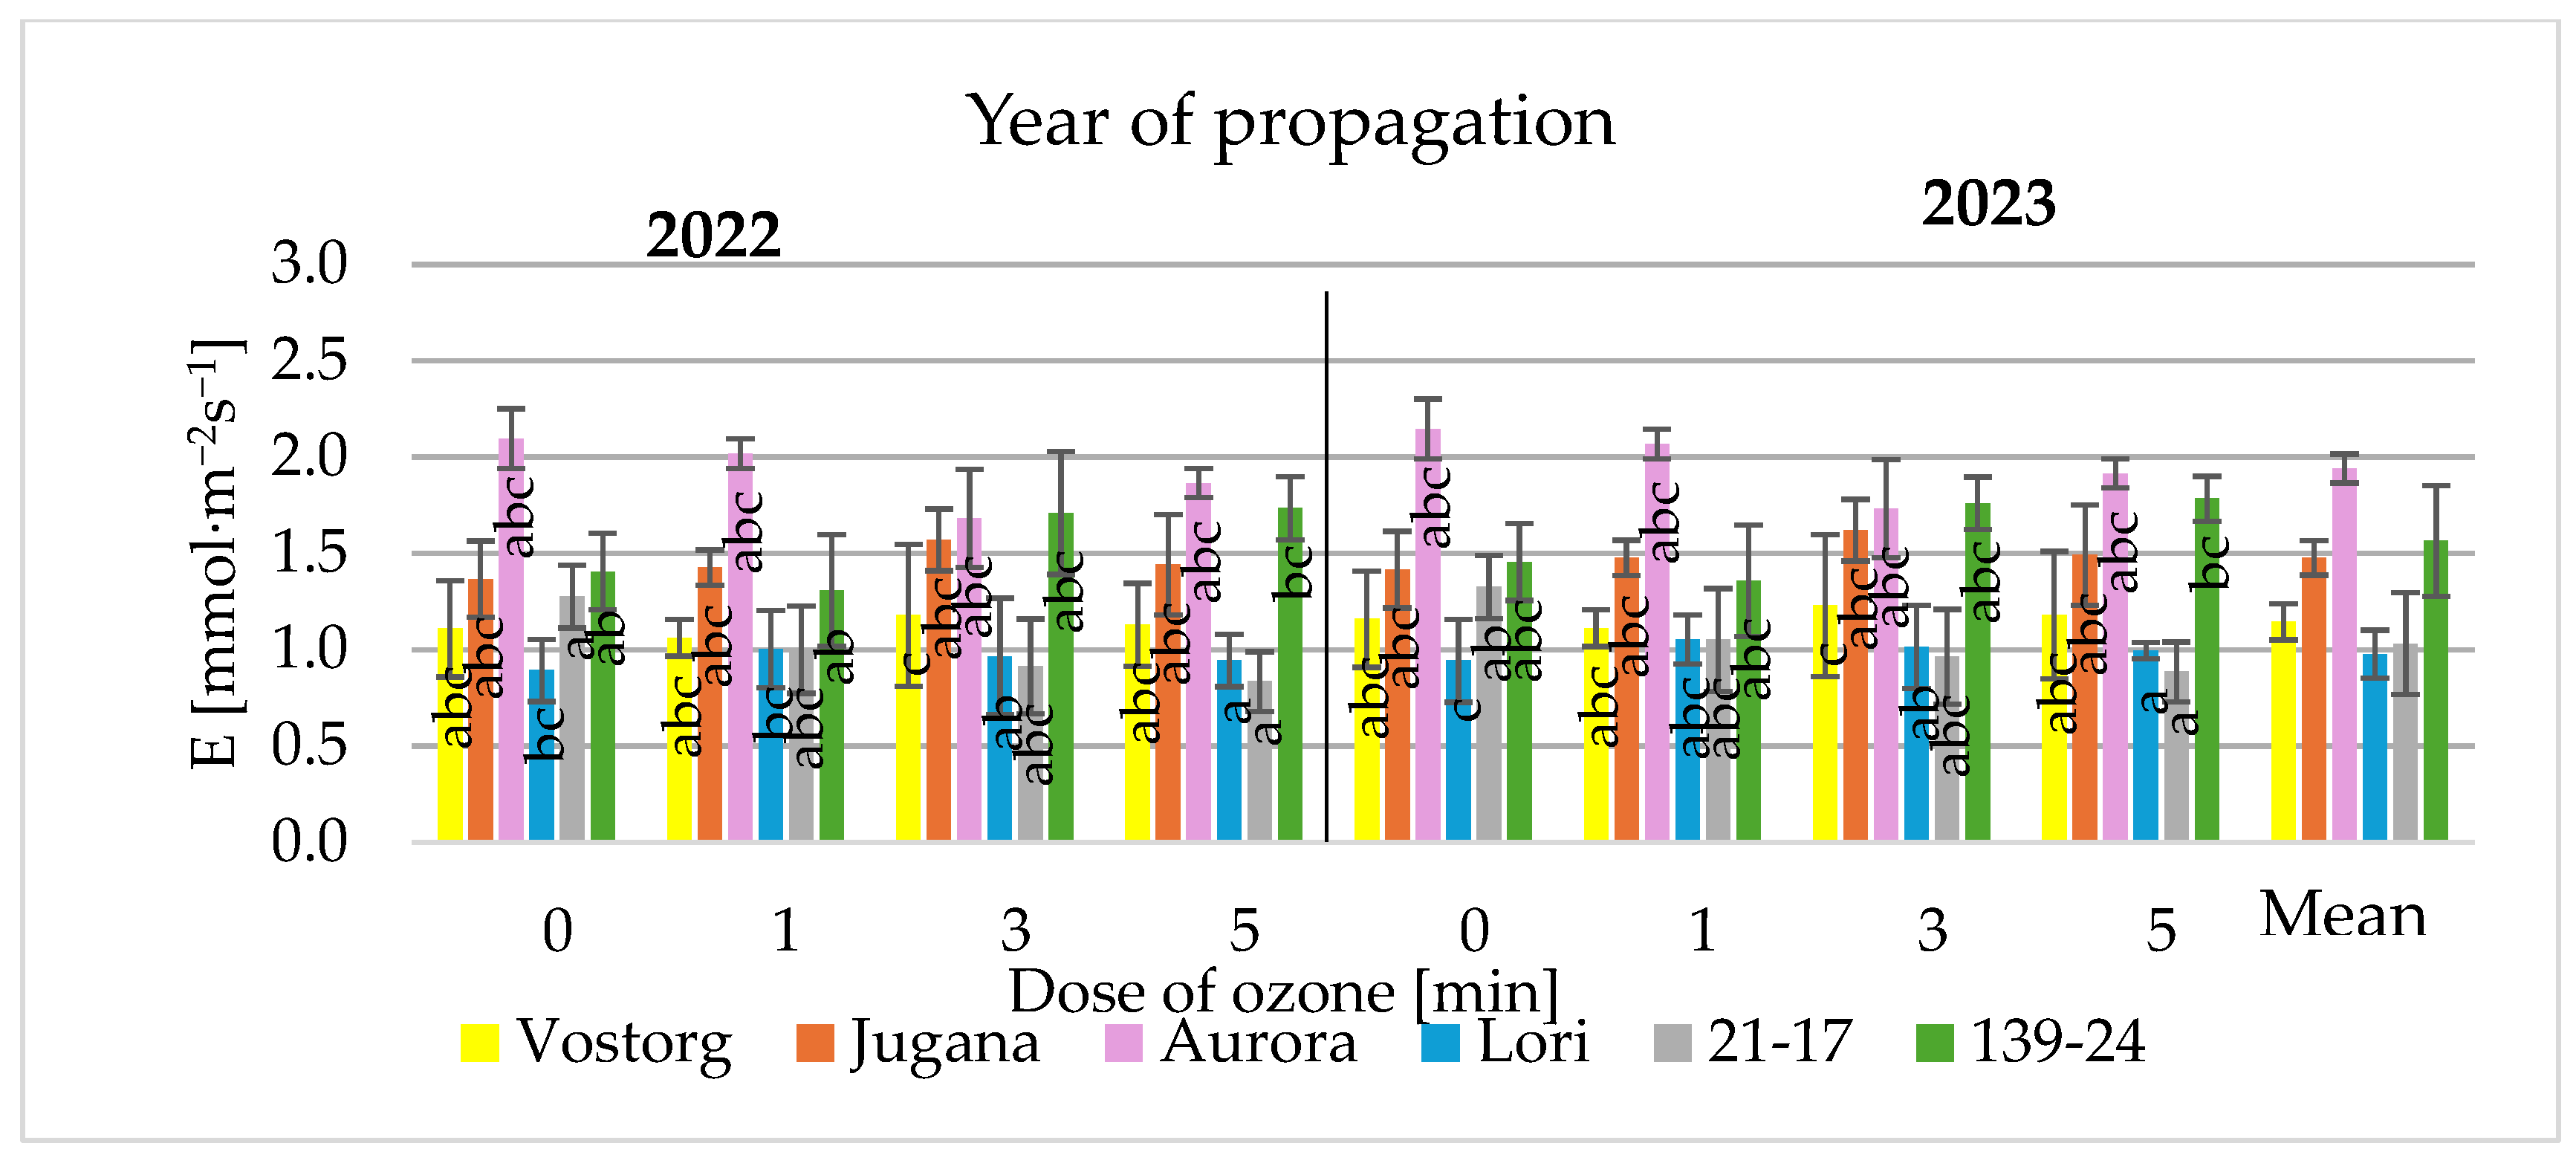
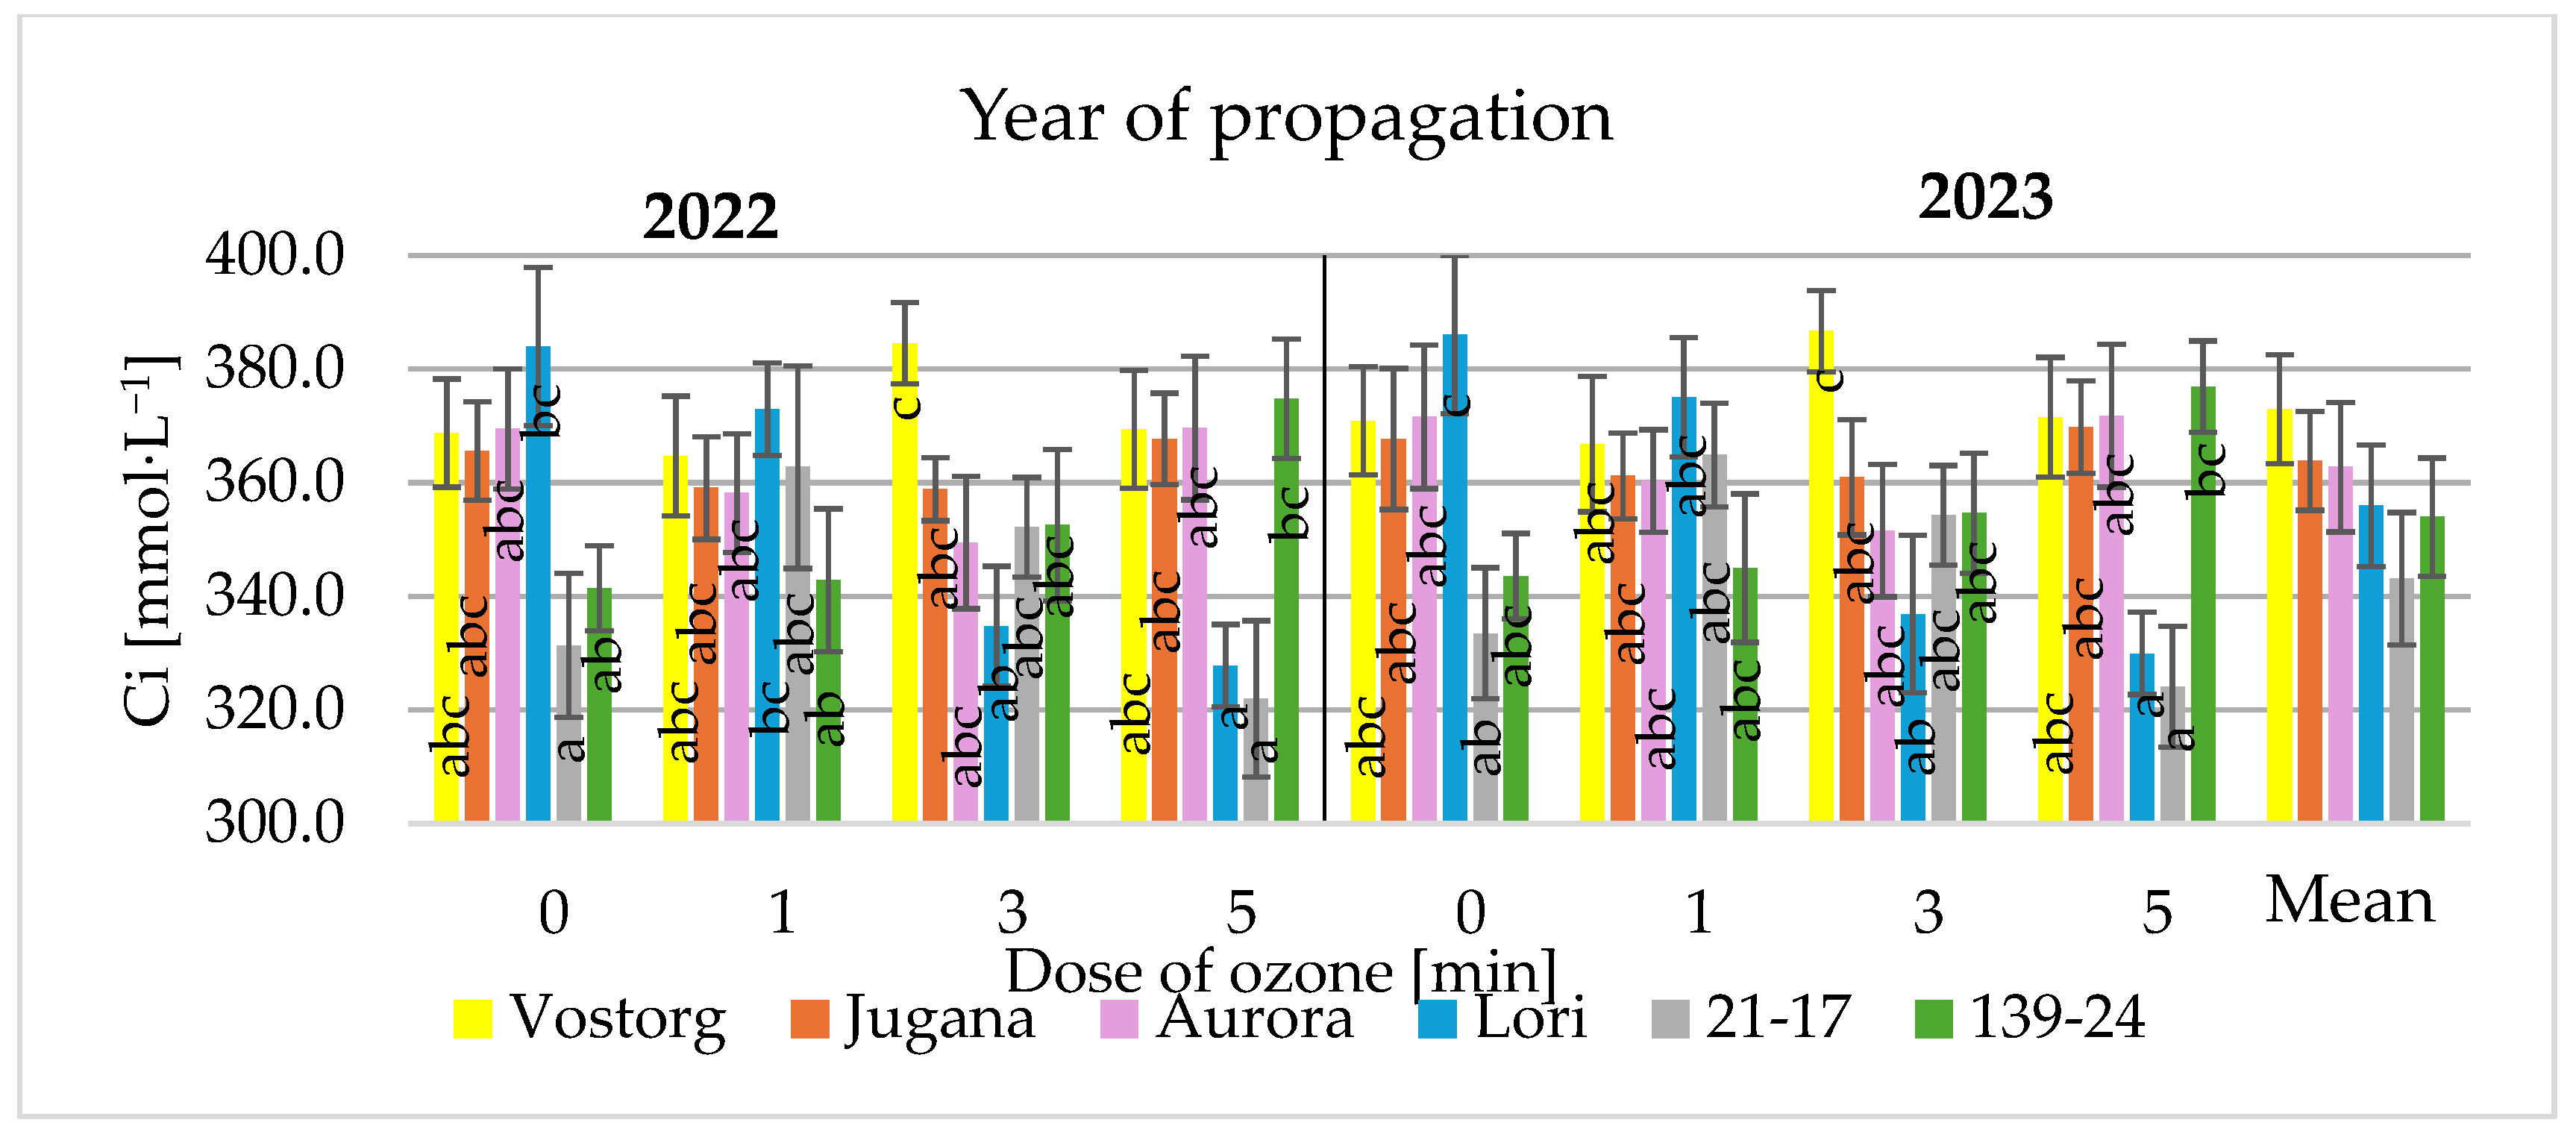
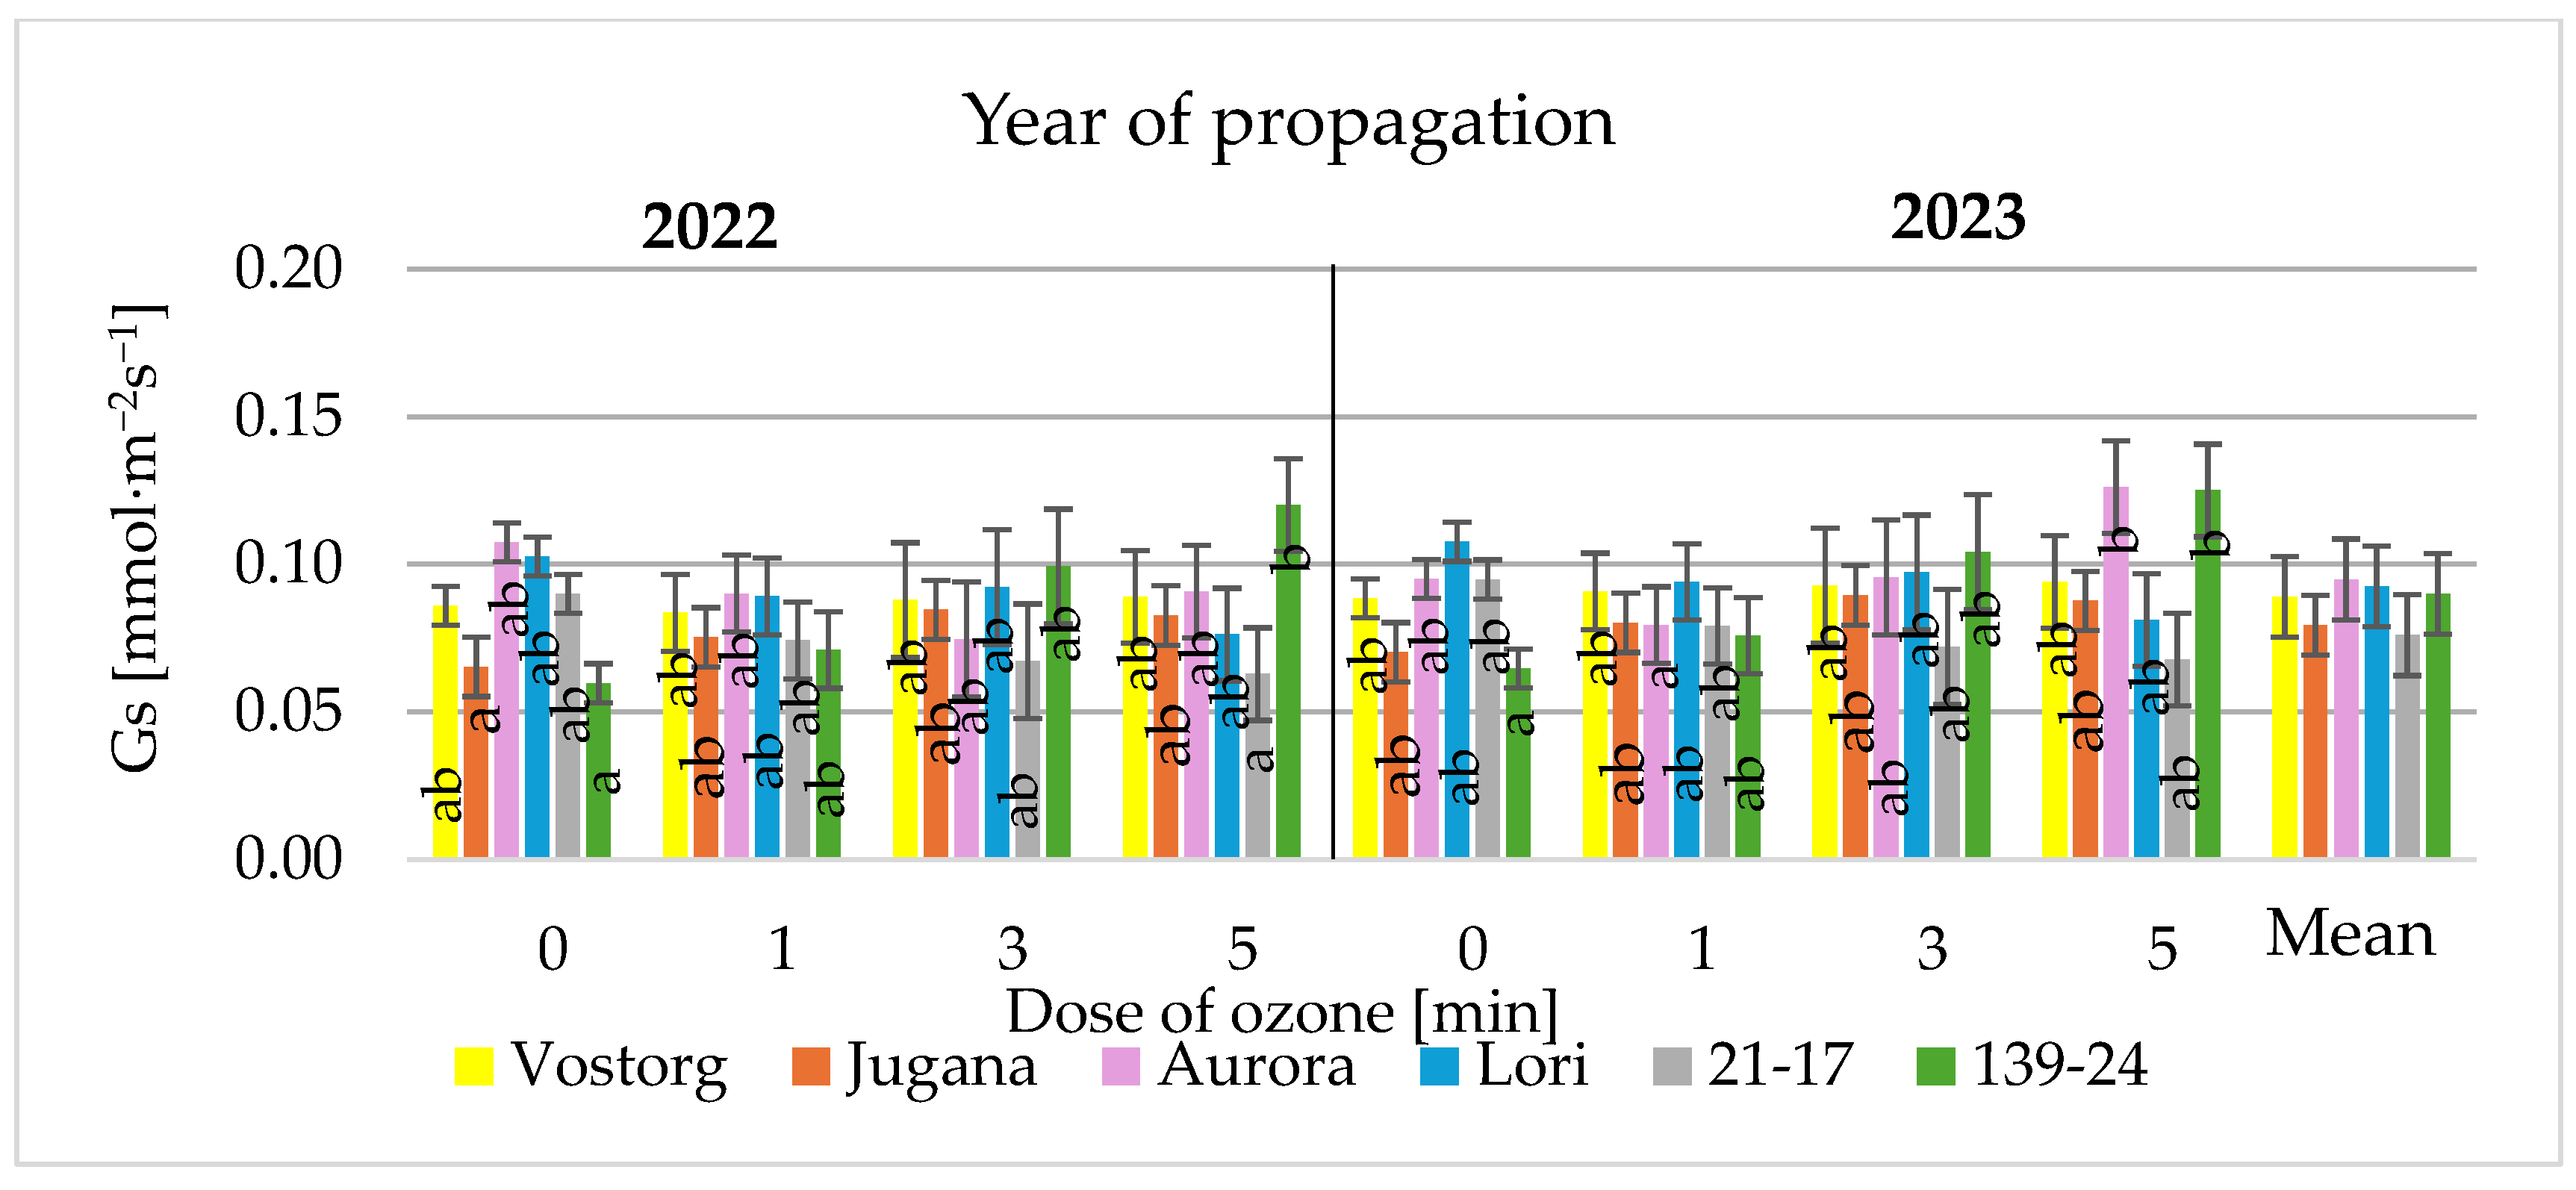
3.3. Gas Exchange Parameters of Leaves

During cultivation, various factors impact plant development, inducing stress and disrupting physiological functions, which can ultimately restrict development and harvest. An early response to environmental stress is the alteration in gas exchange, occurring before the redistribution of biomass [48]. The gas exchange parameters E—transpiration rate, Gs—stomatal conductance and Ci—intercellular CO2 concentration may reflect the actual physiological state of the plant and the influence of ozone. Higher ozone contents in the atmosphere cause a reduction in stomatal conductance and thus transpiration in plants [49,50]. The effect of ozone gas on the transpiration parameters of Lonicera caerluea L. varieties is shown in Figure 5, Figure 6 and Figure 7.
The value of the gas exchange parameters depends on the year of the experiment, the plant variety and the dose of ozone used. Regardless of the year of production, the average value of the gas exchange parameters did not change significantly in most varieties after ozonation. A significant decrease of 34.3% in the transpiration rate, E, was observed in both years of cultivation in ozonated plants of the LE variety ‘21-17’. In 2022, a significant decrease of 29.1% in stomatal conductance (Gs) was observed in the LE variety ‘21-17’ after applying an ozone dose of 5 ppm for 5 min. In the study of Hoshika et al., 2022 [51], researchers point to the negative impact of ozone on stomatal conductance and transpiration rate. In study of Matłok et al., 2024 [52], the use of an appropriate dose of ozone gas did not cause any significant decline in the health of raspberry leaves. Chlorophyll fluorescence and gas exchange measurements that deviate from the norm in the case of ozonated plants indicate a decrease in the plant’s health. For the remaining varieties of LK and LE, the registered gas exchange measurement corresponded with the established values of the nitrogen–flavonol index and chlorophyll fluorescence parameter. The lack of significant deviations between the ozonated plants and non-ozonated plants indicates that the plants were in good physiological condition. The different reaction of the ‘21-17’ LE variety indicates the possibility of differences between varieties within a single species.
In our experience, it has been determined that gaseous ozone can be used in agrotechnical treatments of Lonicera caerulea L. plants because it does not cause disturbances in the physiological parameters tested in most varieties. Apart from changes in the physiological parameters of the plants, no visible symptoms of growth disorders such as a significant reduction in the size of the bushes were observed. However, when using ozone, it is necessary to take into account possible differences between varieties, which will force the use of a different concentration, the determination of which is difficult due to the unstable nature of ozone.

4. Conclusions

According to this study, changes in the chlorophyll fluorescence, contents of individual pigments and gas exchange parameters in leaves were found in different LK and LE varieties. The use of an appropriate dose of gaseous ozone does not cause significant deviations in the tested parameters, indicating a lack of phytotoxic effects in most varieties. The nitrogen–flavonol index (NFI) in the non-ozonated leaves and those ozonated for 3 min was the same—0.33. The mean Pitotal value of the leaves of the ‘Lori’ and ‘139-24’ varieties decreased by 23.1% and 23.8%, respectively, after 5 min of ozonation. In the other tested varieties, the Pitotal value in ozonated leaves showed no significant difference in comparison to the control group, irrespective of the propagation year. The average gas exchange parameters did not change significantly in most varieties after ozonation, although a significant decrease of 34.3% in the transpiration rate, E, was observed in both years of cultivation in ozonated plants of the LE variety ‘21-17’. This may indicate different reactions within the same species. On the basis of this study, ozone does not have a phytotoxic effect on most varieties. It was determined that ozone at a dose of no more than 5 ppm·5 min can be used for agrotechnical treatments without a significant effect on some physiological parameters. The use of ozonation for plant protection may contribute to the development of cultivation technology for Lonicera caerulea L. Further development of ozonation technology for Lonicera plants may contribute to the development of cultivation technology for this species. Further research on this species should focus on the long-term effects of ozone on plants and its impact on biochemical and molecular properties.

Author Contributions

Conceptualization, O.B. and J.G.; methodology, O.B. and J.G.; software, O.B.; validation, O.B. and J.G.; formal analysis, O.B.; investigation, O.B.; resources, J.G.; data curation, O.B.; writing—original draft preparation, O.B.; writing—review and editing, O.B. and J.G.; visualization, O.B.; supervision, O.B. and J.G.; project administration, O.B. and J.G.; funding acquisition, J.G. All authors have read and agreed to the published version of the manuscript.

Funding

This research received no external funding.

Institutional Review Board Statement

Not applicable.

Informed Consent Statement

Not applicable.

Data Availability Statement

Data are contained within the article.

Conflicts of Interest

The authors declare no conflicts of interest.

References

  1. Bieniek, A.A.; Grygorieva, O.; Bielska, N. Biological Properties of Honeysuckle (Lonicera caerulea L.): A Review: The Nutrition, Health Properties of Honeysuckle. Agrobiodivers. Improv. Nutr. Health Life Qual. 2021, 5. [Google Scholar] [CrossRef]
  2. Gawronski, J.; Hortynski, J.; Kaczmarska, E.; Dyduch-Sieminska, M.; Marecki, W.; Witorozec, A. Evaluation of phenotypic and genotypic diversity of some Polish and Russian blue honeysuckle (Lonicera caerulea L.) cultivars and clones. Acta Sci. Polonorum. Hortorum Cultus 2014, 13, 157–169. [Google Scholar]
  3. Kucharska, A.Z.; Sokół-Łętowska, A.; Oszmiański, J.; Piórecki, N.; Fecka, I. Iridoids, Phenolic Compounds and Antioxidant Activity of Edible Honeysuckle Berries (Lonicera caerulea var. kamtschatica Sevast.). Molecules 2017, 22, 405. [Google Scholar] [CrossRef]
  4. Thompson, M.M.; Barney, D.L. Evaluation and breeding of haskap in North America. J. Am. Pomol. Soc. 2007, 1, 25. [Google Scholar]
  5. Ochmian, I.D.; Skupień, K.; Grajkowski, J.; Smolik, M.; Ostrowska, K. Chemical Composition and Physical Characteristics of Fruits of Two Cultivars of Blue Honeysuckle (Lonicera caerulea L.) in Relation to their Degree of Maturity and Harvest Date. Not. Bot. Horti Agrobot. Cluj-Napoca 2012, 40, 155–162. [Google Scholar]
  6. Kula, M.; Krauze-Baranowska, M. Blue Honeysuckle (Lonicera caerulea L.)—The current state of phytochemical research and biological activity. Post. Fitoter. 2016, 17, 111–118. [Google Scholar]
  7. Jia, L.; He, X.; Chen, W.; Liu, Z.; Huang, Y.; Yu, S. Hormesis phenomena under Cd stress in a hyperaccumulator—Lonicera japonica Thunb. Ecotoxicology 2013, 22, 476–485. [Google Scholar]
  8. Nawaz, M.A.; Razaganova, M.P.; Rusakova, E.A.; Petrusha, E.N.; Sabitov, A.S.; Chunikhina, O.A.; Ercisli, S.; Tikhonova, N.G.; Golokhvast, K.S. Global metabolome profiles of Lonicera caerulea L. and Lonicera caerulea ssp. kamtschatica (Sevast.) Gladkova. Turk. J. Agric. For. 2024, 48, 745–759. [Google Scholar]
  9. Miller, F.A.; Silva, C.L.M.; Brandão, T.R.S. A review on ozone-based treatments for fruit and vegetables preservation. Food Eng. Rev. 2013, 5, 77–106. [Google Scholar]
  10. Fan, X. Gaseous ozone to preserve quality and enhance microbial safety of fresh produce: Recent developments and research needs. Compr. Rev. Food Sci. Food Saf. 2021, 20, 4993–5014. [Google Scholar] [CrossRef]
  11. Kuźniar, P.; Belcar, J.; Zardzewiały, M.; Basara, O.; Gorzelany, J. Effect of Ozonation on the Mechanical, Chemical, and Microbiological Properties of Organically Grown Red Currant (Ribes rubrum L.) Fruit. Molecules 2022, 27, 8231. [Google Scholar] [CrossRef]
  12. Fan, X.; Shang, D.L.; Lan, Y.B.; Bai, J.B.; Han, X. Application of ozone technology and ozone plant protection devices in agriculture. J. Agric. Sci. Technol. 2020, 22, 71–77. [Google Scholar]
  13. Msayleb, N.; Ibrahim, S. Treatment of nematodes with ozone gas: A sustainable alternative to nematicides. Phys. Procedia 2011, 21, 187–192. [Google Scholar] [CrossRef]
  14. Grulke, N.E.; Heath, R.L. Ozone effects on plants in natural ecosystems. Plant Biol. 2020, 22, 12–37. [Google Scholar] [CrossRef]
  15. Afsah-Hejri, L.; Hajeb, P.; Ehsani, R.J. Application of ozone for degradation of mycotoxins in food: A review. Compr. Rev. Food Sci. Food Saf. 2020, 19, 1777–1808. [Google Scholar] [CrossRef]
  16. Bussotti, F.; Strasser, R.J.; Schaub, M. Photosynthetic behavior of woody species under high ozone exposure probed with the JIP-test: A review. Environ. Pollut. 2007, 147, 430–437. [Google Scholar] [CrossRef]
  17. Díaz-López, M.; Siles, J.A.; Ros, C.; Bastida, F.; Nicolás, E. The effects of ozone treatments on the agro-physiological parameters of tomato plants and the soil microbial community. Sci. Total Environ. 2022, 812, 151429. [Google Scholar] [CrossRef]
  18. Zardzewiały, M.; Matłok, N.; Piechowiak, T.; Saletnik, B.; Balawejder, M.; Gorzelany, J. Preliminary Tests of Tomato Plant Protection Method with Ozone Gas Fumigation Supported with Hydrogen Peroxide Solution and Its Effect on Some Fruit Parameters. Sustainability 2024, 16, 3481. [Google Scholar] [CrossRef]
  19. Baskakov, I.V.; Orobinsky, V.I.; Gievsky, A.M.; Gulevsky, V.A.; Chernyshov, A.V. Ozone pest control of grain. IOP Conf. Ser. Earth Environ. Sci. 2023, 1138, 012026. [Google Scholar] [CrossRef]
  20. Aidoo, O.F.; Osei-Owusu, J.; Chia, S.Y.; Dofuor, A.K.; Antwi-Agyakwa, A.K.; Okyere, H.; Gyan, M.; Edusei, G.; Ninsin, K.D.; Duker, R.Q.; et al. Remediation of pesticide residues using ozone: A comprehensive overview. Sci. Total Environ. 2023, 894, 164933. [Google Scholar] [CrossRef]
  21. Di Vittori, L.; Mazzoni, L.; Battino, M.; Mezzetti, B. Pre-harvest factors influencing the quality of berries. Sci. Hortic. 2018, 233, 310–322. [Google Scholar]
  22. Remondino, M.; Valdenassi, L. Different Uses of Ozone: Environmental and Corporate Sustainability. Literature Review and Case Study. Sustainability 2018, 10, 4783. [Google Scholar] [CrossRef]
  23. Cheng, S.; Wang, Y.; Sun, M.; Zheng, J.; Zhu, X.; Zhao, T. Effects of Elevated Surface Ozone Concentration on Photosynthetic Fluorescence Characteristics and Yield of Soybean Parents and Offspring. Atmosphere 2023, 14, 1368. [Google Scholar] [CrossRef]
  24. Cheng, Z.; Bao, Y.; Li, Z.; Wang, J.; Wang, M.; Wang, S.; Li, B. Lonicera caerulea (Haskap berries): A review of development traceability, functional value, product development status, future opportunities, and challenges. Crit. Rev. Food Sci. Nutr. 2023, 63, 8992–9016. [Google Scholar] [CrossRef]
  25. Basara, O.; Gorzelany, J. Assessment of Selected Chemical and Morphological Properties of Lonicera var. kamtschatica and Lonicera var. emphyllocalyx Treated with Gaseous Ozone. Molecules 2024, 29, 3616. [Google Scholar] [CrossRef]
  26. Cerovic, Z.; Moise, N.; Agati, G.; Latouche, G.; Ben Ghozlen, N.; Meyer, S. New portable optical sensors for the assessment of winegrape phenolic maturity based on berry fluorescence. J. Food Compos. Anal. 2008, 21, 650–654. [Google Scholar] [CrossRef]
  27. Baker Neil, R.; Oxborough, K. Chlorophyll fluorescence as a probe of photosynthetic productivity. In Chlorophyll a Fluorescence: A Signature of Photosynthesis; Springer: Dordrecht, The Netherlands, 2004; pp. 65–82. [Google Scholar]
  28. Maxwell, K.; Johnson, G.N. Chlorophyll fluorescence—A practical guide. J. Exp. Bot. 2000, 51, 659–668. [Google Scholar]
  29. Strasser, B.J.; Strasser, R.J. Measuring fast fluorescence transients to address environmental questions: The JIP-test. In Photosynthesis: From Light to Biosphere; Springer: Berlin/Heidelberg, Germany, 1995; pp. 977–980. [Google Scholar]
  30. Joshi, N.C.; Yadav, D.; Ratner, K.; Kamara, I.; Aviv-Sharon, E.; Irihimovitch, V.; Charuvi, D. Sodium hydrosulfide priming improves the response of photosynthesis to overnight frost and day high light in avocado (Persea americana Mill, cv. ‘Hass’). Physiol. Plant. 2020, 168, 394–405. [Google Scholar] [PubMed]
  31. Sulkiewicz, M.; Ciereszko, I. Fluorescencja chlorofilu a-historia odkrycia i zastosowanie w badaniach roślin. Kosmos 2016, 65, 103–115. [Google Scholar]
  32. Muñoz-Huerta, F.R.; Guevara-Gonzalez, G.R.; Contreras-Medina, M.L.; Torres-Pacheco, I.; Prado-Olivarez, J.; Ocampo-Velazquez, R.V. A Review of Methods for Sensing the Nitrogen Status in Plants: Advantages, Disadvantages and Recent Advances. Sensors 2013, 13, 10823–10843. [Google Scholar] [CrossRef]
  33. Hu, H.; Zhang, G.; Zheng, K. Modeling Leaf Image, Chlorophyll Fluorescence, Reflectance from SPAD Readings. IEEE J. Sel. Top. Appl. Earth Obs. Remote Sens. 2014, 7, 4368–4373. [Google Scholar]
  34. Boublin, F.; Cabassa-Hourton, C.; Leymarie, J.; Leitao, L. Potential involvement of proline and flavonols in plant responses to ozone. Environ. Res. 2022, 207, 112214. [Google Scholar] [CrossRef]
  35. Brazaitytė, A.; Duchovskis, P.; Urbonavičiūtė, A.; Samuolienė, G.; Jankauskienė, J.; Kasiulevičiūtė-Bonakėrė, A.; Bliznikas, Z.; Novičkovas, A.; Breivė, K.; Žukauskas, A. The effect of light-emitting diodes lighting on cucumber transplants and after-effect on yield. Zemdirb.-Agric. 2009, 96, 102–118. [Google Scholar]
  36. Fujiwara, K.; Fujii, T.; Park, J.-S. Comparison of Foliar Spray Efficacy of Electrolytically Ozonated Water and Acidic Electrolyzed Oxidizing Water for Controlling Powdery Mildew Infection on Cucumber Leaves. Ozone Sci. Eng. 2009, 31, 10–14. [Google Scholar] [CrossRef]
  37. Antos, P.; Piechowicz, B.; Gorzelany, J.; Matlok, N.; Migut, D.; Jozefczyk, R.; Balawejder, M. Effect of Ozone on Fruit Quality and Fungicide Residue Degradation in Apples during Cold Storage. Ozone Sci. Eng. 2009, 40, 482–486. [Google Scholar] [CrossRef]
  38. Heleno, F.F.; Queiroz, M.E.L.R.D.; Neves, A.A.; Freitas, R.S.; Faroni, L.R.A.; Oliveira, A.F.D. Effects of ozone fumigation treatment on the removal of residual difenoconazole from strawberries and on their quality. J. Environ. Sci. Health Part B 2014, 49, 94–101. [Google Scholar] [CrossRef] [PubMed]
  39. Wu, Q.; Zhang, Y.; Xie, M.; Zhao, Z.; Yang, L.; Liu, J.; Hou, D. Estimation of Fv/Fm in Spring Wheat Using UAV-Based Multispectral and RGB Imagery with Multiple Machine Learning Methods. Agronomy 2023, 13, 1003. [Google Scholar] [CrossRef]
  40. Kalaji, H.M.; Schansker, G.; Brestic, M.; Bussotti, F.; Calatayud, A.; Ferroni, L.; Goltsev, V.; Guidi, L.; Jajoo, A.; Li, P.; et al. Frequently asked questions about chlorophyll fluorescence, the sequel. Photosynth. Res. 2017, 132, 13–66. [Google Scholar] [CrossRef]
  41. Zardzewiały, M.; Matłok, N.; Turan, J.; Balawejder, M.; Gorzelany, J. Yeast solution spray and ozone gas fumigation as methods of protecting tomato plants against diseases. Agric. Eng. 2024, 28, 215–233. [Google Scholar] [CrossRef]
  42. Thwe, A.A.; Kasemsap, P. Quantification of OJIP fluorescence transient in tomato plants under acute ozone stress. Agric. Nat. Resour. 2014, 48, 665–675. [Google Scholar]
  43. Strasser, R.J.; Srivastava, A.; Tsimilli-Michael, M. The fluorescence transient as a tool to characterize and screen photosynthetic samples. Probing Photosynth. Mech. Regul. Adapt. 2000, 25, 445–483. [Google Scholar]
  44. Strasser, R.J.; Srivastava, A.; Tsimilli-Michael, M. Analysis of the fluorescence transient. In Chlorophyll a Fluorescence: A Signature of Photosynthesis; Papageogiou, G., Govindjee, Eds.; Springer: Dordrecht, The Netherlands, 2000; Volume 19, pp. 321–362. [Google Scholar]
  45. Hermans, C.; Smeyers, M.; Rodriguez, R.M.; Eyletters, M.; Strasser, R.; Dehaye, J.P. Quality assessment of urban’s trees: A comparative study of physiological characterisation, airborne imaging and on site fluorescence monitoring by the OJIP test. J. Plant Physiol. 2003, 160, 81–90. [Google Scholar] [PubMed]
  46. Strauss, A.; Krüger, G.; Strasser, R.; Van Heerden, P. Ranking of dark chilling tolerance in soybean genotypes probed by the chlorophyll a fluorescence transient O-J-I-P. Environ. Exp. Bot. 2006, 56, 147–157. [Google Scholar]
  47. Ballarin-Denti, A.; Bussotti, F.; Cascio, C.; Desotgiu, R.; Gerosa, G.; Marzuoli, R.; Strasser, R.J.; Tagliaferri, A. An open-top chamber experiment at Curno (Northern Italy): Results of the first year of activity. Workshop: Critical levels of ozone: Further applying and developing the flux-based concept. In Proceedings of the Background Document of the ICP Vegetation Meeting, Obergurgl, Austria, 15–19 November 2005. [Google Scholar]
  48. Hasanuzzaman, M.; Hossain, M.A.; da Silva, J.A.T.; Fujita, M. Plant response and tolerance to abiotic oxidative stress: Antioxidant defense is a key factor. In Crop Stress and Its Management: Perspectives and Strategies; Springer: Dordrecht, The Netherlands, 2012; pp. 261–315. [Google Scholar]
  49. Lombardozzi, D.; Levis, S.; Bonan, G.; Sparks, J.P. Predicting photosynthesis and transpiration responses to ozone: Decoupling modeled photosynthesis and stomatal conductance. Biogeosciences 2012, 9, 3113–3130. [Google Scholar] [CrossRef]
  50. Yu, H.; Blande, J.D. A potential ozone defense in intercellular air space: Clues from intercellular BVOC concentrations and stomatal conductance. Sci. Total Environ. 2022, 852, 158456. [Google Scholar]
  51. Hoshika, Y.; Paoletti, E.; Centritto, M.; Gomes, M.T.G.; Puértolas, J.; Haworth, M. Species-specific variation of photosynthesis and mesophyll conductance to ozone and drought in three Mediterranean oaks. Physiol. Plant. 2022, 174, e13639. [Google Scholar]
  52. Matłok, N.; Piechowiak, T.; Szostek, M.; Kuboń, M.; Neuberger, P.; Kapusta, I.; Balawejder, M. Modification of Fungicide Treatment Needs and Antioxidant Content as a Result of Real-Time Ozonation of Raspberry Plants. Molecules 2024, 29, 3949. [Google Scholar] [CrossRef]
Figure 1. Plant damage during preliminary tests. (A) Healthy LE plants; (B) physiological damage on LE caused by ozone exposure.
Sustainability 17 02820 g001
Figure 2. The effect of gaseous ozone on the maximum quantum efficiency of photosystem II (Fv/Fm) of the leaves of LK and LE varieties in 2022–2023. The values represent the mean (n = 10) ± SD, where SD represents the standard deviation. The alphabetical letters represent significant differences at the level of p < 0.05.
Sustainability 17 02820 g002
Figure 3. The effect of gaseous ozone on the net rate of PS II closure (Mo) of the leaves of LK and LE varieties in 2022–2023. The values represent the mean (n = 10) ± SD, where SD represents the standard deviation. The alphabetical letters represent significant differences at the level of p < 0.05.
Sustainability 17 02820 g003
Figure 4. The effect of gaseous ozone on the performance index (Pitotal) of the leaves of LK and LE varieties in 2022–2023. The values represent the mean (n = 10) ± SD, where SD represents the standard deviation. The alphabetical letters represent significant differences at the level of p < 0.05.
Sustainability 17 02820 g004
Figure 5. The effect of ozone gas on the transpiration rate (E) of LK and LE varieties in 2022–2023. The values represent the mean (n = 10) ± SD, where SD represents the standard deviation. The alphabetical letters represent significant differences at the level of p < 0.05.
Sustainability 17 02820 g005
Figure 6. The effect of ozone gas on the intercellular CO2 concentration (Ci) of LK and LE varieties in 2022–2023. The values represent the mean (n = 10) ± SD, where SD represents the standard deviation. The alphabetical letters represent significant differences at the level of p < 0.05.
Sustainability 17 02820 g006
Figure 7. The effect of ozone gas on the stomatal conductance (Gs) of LK and LE varieties in 2022–2023. The values represent the mean (n = 10) ± SD, where SD represents the standard deviation. The alphabetical letters represent significant differences at the level of p < 0.05.
Sustainability 17 02820 g007
Table 1. Explanation of formulas of the steps of fluorescence induction.
ParameterFormula Explanation
FoMinimum fluorescence intensity (50 µs)
F0Fluorescense intensity on O step (20 µs)
FJFluorescense intensity on J step (2 ms)
FIFluorescense intensity on I step (60 ms)
FmMaximal fluorescence also known as P step
Fv (Fm/Fo)Variable fluorescence of PSII (Fv = Fm − Fo)
Fv/FmVariable fluorescence to maximal fluorescence (Fv/Fm = (Fm − Fo)/Fm)
Fv/FoThe stress-detecting parameter (Fv/Fo = (Fm − Fo)/Fo)
VjVj = (Fj − Fo)/Fm − Fo
MoMo = (F300 − F50)/(Fm − F50)/0.25 ms
PitotalPItotal = PIAbs × {(1 − Vi)/(1 − Vj)}/[1 − {(1 − Vi)/(1 − Vj)}]
Table 2. The content of individual pigments and the nitrogen–flavonol index depending on the botanical variety and year of cultivation.
VariableChlMFlvMAnthMNFI
Lonicera caerulea var. kamstchatica
VarietyVostorg0.47 ± 0.09 bc1.36 ± 0.12 a0.12 ± 0.06 ab0.33 ± 0.09 ab
Jugana0.50 ± 0.09 c1.42 ± 0.09 b0.11 ± 0.04 a0.33 ± 0.07 ab
Aurora0.50 ± 0.10 c1.41 ± 0.11 b0.12 ± 0.06 ab0.34 ± 0.07 b
Lonicera caerulea var. emphyllocalyx
Lori0.44 ± 0.07 a1.40 ± 0.11 ab0.11 ± 0.05 a0.31 ± 0.06 a
21-170.41 ± 0.10 a1.41 ± 0.10 b0.13 ± 0.04 b0.31 ± 0.07 a
139-240.46 ± 0.11 b1.30 ± 0.12 a0.10 ± 0.06 a0.36 ± 0.08 b
Average0.45 ± 0.091.41 ± 0.110.11 ± 0.060.33 ± 0.08
p value0.00540.00360.00580.0003
Year of study20220.45 ± 0.08 a1.40 ± 0.10 a0.12 ± 0.05 a0.34 ± 0.07 a
20230.43 ± 0.10 a1.39 ± 0.12 a0.11 ± 0.08 a0.32 ± 0.08 a
Average0.44 ± 0.101.40 ± 0.110.12 ± 0.060.33 ± 0.07
p value0.16360.24410.18450.2054
InteractionVVVV
Explanation: ChlM—chlorophyll content; FlvM—flavonol content; AnthM—anthocyanin content; NFI—nitrogen–flavonol index; V—variable. The values represent the mean ± SD; SD—standard deviation. The alphabetical letters represent significant differences at the level of p < 0.05.
Table 3. The content of individual pigments and the nitrogen–flavonol index in LK and LE leaves depending on ozone exposure time.
Lenght of OzonationTime After Ozonation [Days]ChlMFlvMAnthMNFI
Control10.45 ± 0.10 cd1.36 ± 0.10 a0.13 ± 0.06 b0.33 ± 0.08 bc
30.44 ± 0.09 b1.39 ± 0.11 bc0.12 ± 0.04 ab0.34 ± 0.08 c
50.46 ± 0.10 d1.43 ± 0.09 c0.12 ± 0.03 ab0.34 ± 0.06 c
Average0.44 ± 0.091.39 ± 0.100.13 ± 0.080.34 ± 0.08
5 ppm·1 min10.44 ± 0.09 c1.38 ± 0.11 abc0.15 ± 0.08 c0.30 ± 0.07 a
30.44 ± 0.09 c1.41 ± 0.11 bc0.11 ± 0.03 a0.31 ± 0.06 b
50.45 ± 0.09 c1.43 ± 0.12 c0.13 ± 0.03 ab0.32 ± 0.06 b
Average0.44 ± 0.101.41 ± 0.110.13 ± 0.050.31 ± 0.07
5p pm·3 min10.43 ± 0.10 bc1.38 ± 0.10 abc0.14 ± 0.08 bc0.33 ± 0.09 bc
30.45 ± 0.11 c1.36 ± 0.12 a0.09 ± 0.03 a0.34 ± 0.09 c
50.45 ± 0.07 c1.43 ± 0.14 c0.12 ± 0.04 a0.32 ± 0.06 b
Average0.44 ± 0.091.39±0.120.12 ± 0.060.33 ± 0.08
5 ppm·5 min10.43 ± 0.11 bc1.37 ± 0.10 ab0.15 ± 0.05 c0.30 ± 0.08 a
30.39 ± 0.08 a1.30 ± 0.09 abc0.09 ± 0.06 a0.32 ± 0.06 b
50.40 ± 0.09 a1.39 ± 0.10 c0.11 ± 0.03 a0.31 ± 0.09 b
Average0.41 ± 0.131.43 ± 0.100.12 ± 0.030.31 ± 0.08
p value0.00080.00350.00240.0042
InteractionL × TL × TL × TL × T
Explanation: ChlM—chlorophyll content; FlvM—flavonoid content; AnthM—anthocyanin content; NFI—nitrogen–flavonol index; L—length of ozonation; T—time after ozonation. The values represent the mean ± SD; SD—standard deviation. The alphabetical letters represent significant differences at the level of p < 0.05.
Disclaimer/Publisher’s Note: The statements, opinions and data contained in all publications are solely those of the individual author(s) and contributor(s) and not of MDPI and/or the editor(s). MDPI and/or the editor(s) disclaim responsibility for any injury to people or property resulting from any ideas, methods, instructions or products referred to in the content.

