Article

Research on the Paths of the Modern Agricultural Industrial System Promoting Income Increases and Prosperity for Farmers Based on the fsQCA Method

School of Economics and Management, North University of China, Taiyuan 030051, China
*
Author to whom correspondence should be addressed.
Sustainability 2025, 17(7), 2799; https://doi.org/10.3390/su17072799
Submission received: 9 December 2024 / Revised: 12 March 2025 / Accepted: 19 March 2025 / Published: 21 March 2025
(This article belongs to the Section Sustainable Urban and Rural Development)

Abstract

:
This paper innovatively proposes the concepts of length, width, and depth for modern agricultural industrial systems. The development level of the modern agricultural industrial system is systematically measured by the length of the agricultural industry chain, the width of agriculture in terms of its overlap with and integration of non-agriculture industries, and the depth of agricultural productive services. Using the fuzzy set qualitative comparative analysis method, 88 main production areas of special and excellent agricultural products in Shanxi, China, are selected as sample objects. The configuration paths of the length, width, and depth of the modern agricultural industrial system impacting farmers’ wage income, operating income, property income, and transfer income are explored. The study found the following: (1) The income level of farmers is jointly influenced by the length, width, and depth of the modern agricultural industrial system, emphasizing that a single factor does not constitute a necessary condition for farmers’ income growth and prosperity. (2) There exist four types of paths through which the modern agricultural industrial system can promote increases in farmer incomes, namely “non-industry length * industry width”, “industry length * non-industry width * non-industry depth”, “non-industry length * industry depth” and “industry length * non-industry depth”, a various types of paths have a differential impact on the structure of farmers’ incomes. (3) The length, width, and depth of the modern agricultural industrial system individually have crowding-out effects on each of a farmer’s four types of income.

1. Introduction

Ensuring an increase in farmers’ income has been one of the greatest challenges to agricultural development in China in recent years. In the past, long-term agricultural production focused excessively on the quantity of farm products and the growth of regional economic indicators, neglecting the central role of farmers in rural development. As China has achieved the great victory of comprehensive poverty alleviation, how to continuously increase farmers’ incomes and promote their prosperity has become a crucial yet challenging aspect of achieving common prosperity. General Secretary Xi Jinping has repeatedly stressed that “we should insist on increasing farmers’ income as the central task of the ‘three rural’ work, and broaden the channels for farmers to increase their income and become prosperous”. Rural industry can provide a solid foundation for farmers’ income growth and rural affluence, industrial revitalization is the top priority of rural revitalization, and industrial prosperity is the prerequisite for solving all problems in the countryside. Whether the industry is prosperous or not is directly reflected in the construction and optimization of the industrial system, such as the industrial structure and the degree of association. As the key to the construction of the “three systems”, the modern agricultural industrial system has the role of planning the overall situation and leading and driving the implementation of the rural revitalization strategy. A contemporary industrial development pattern of regionalized layout, specialized production, and industrialized operation has first emerged as a result of China’s agricultural modernization process, which is progressively advancing [1]. However, there are still issues, such as poor adaptability within the agricultural industrial chain structure, underdeveloped agricultural producer services, imbalanced profit distribution among pre-production, in-production, and post-production links [2], an imbalanced internal structure of agricultural tertiary industry integration, limited capacity of industrial development to drive farmers’ income growth, inadequate expansion of non-economic functions of agriculture [3], and more. The aforementioned issues, which concern the internal structural arrangement and functional location of the agricultural industrial system, are ultimately scientific suggestions for its design. In order to build a strong socialist modernized nation, encourage rural revitalization, and realize common wealth, it is crucial to explorer the relationship between the modern agricultural industrial system and farmers’ income.
Since the 1990s, China’s agricultural industry has expanded from breeding to processing and distribution, and the integration of agriculture with cultural tourism and recreational industries has expanded the functions of agriculture from production to culture, ecology, education, recreation, and entertainment, which shows that China’s agricultural industry is developing along the path of modernization [4]. Existing research mainly focuses on the connotation characteristics, functions, and development paths of the modern agricultural industry. The research object focuses on a single dimension or function of the agricultural industrial system while lacking a systematic research perspective. There is a lack of systematic research on the length of the agricultural industrial chain, the width of cross-integrated agriculture, and the depth of agricultural services. Scholars generally agree that the preconditions for farmers’ income growth mainly depend on the development level and structural characteristics of agricultural industries [5,6], continuously lengthening agricultural industrial chains [7], and the quality of cross-agriborders [8]. Furthermore, some scholars have discovered a non-linear effect of agricultural industry development on farmers’ income. For instance, Al Abbasi et al. revealed an inverted U-shaped relationship between rural transformation and farmers’ income inequality [9], and Peng et al. further revealed that this non-linear relationship is more significant in relatively poor villages [10]. Some scholars found that the development of supporting services in the agricultural industry has a heterogeneous impact on the structure of farmers’ income. For example, Ge et al. found that digital financial inclusion has a positive income-enhancing effect on rural residents. Wage income, operating income, and transfer income are promoted to a certain extent, while property income is affected in the opposite way [11]. Li proposed that the use of digital technology has a significant positive impact on operating income in rural household incomes and is more favorable to high-income groups [12]. It can be seen that the existing studies have empirically demonstrated that farmers’ income increase in three dimensions: lengthening agricultural industry chains, agriculture and non-agriculture integration, and the development of a productive agricultural service. The mature development of the modern agricultural industry needs to be cultivated from the three dimensions together; yet, the complete structure of the modern agricultural industrial system systematically affecting farmers’ incomes and farmers’ income structures is less discussed and urgently needs deeper theoretical explanations.
Shanxi, a typical loess-covered mountainous plateau and not a major agricultural province, boasts endowment advantages in specialty agriculture such as that of minor grain crops and dried and fresh fruits. Developing a modern specialty agricultural industrial system is the fundamental path for Shanxi’s rural revitalization and an essential guarantee for farmers’ income growth and prosperity. As of October 2023, Shanxi had 444,000 agricultural business entities, an increase of 21.6% year-on-year. The province currently has 45 national-level leading enterprises, 826 provincial-level leading enterprises, and 2850 leading enterprises above the county level. The group standard of “Organic Dry Farming—Jin products” has reached 30, and 10 advantageous regional public brands have been cultivated. The number of nationally famous, high-quality, and new agricultural products has reached 127, and the number of “Shenzhen products” has reached 156. The development of Shanxi’s superior agriculture has promoted local farmers’ income growth and improved their income structure. In 2021, the average wage income, operating income, and property income of rural residents in Shanxi were CNY 6859, CNY 3958, and CNY 230, respectively, but there is still a distance from the national average level during the same period. Therefore, reviewing and summarizing the impact of Shanxi’s superior agricultural industrial development on farmers’ income and income structure and exploring the development path of the modern agricultural industrial system based on considering farmers’ income growth are vital both in practice and in theory.
According to the information on the list of famous and special agricultural products released by the Center for Quality and Safety of Agricultural Products of the Ministry of Agriculture and Rural Affairs of China, among the 117 county-level administrative units in Shanxi Province, 88 counties are the main production areas of special agricultural products, so it is used as the research sample of this paper, and its geographical distribution is shown in Figure 1.
The remaining parts of this paper are organized as follows: the Section 2 deals with the construction of the theoretical model; the Section 3 describes the research methodology and data sources; in the Section 4, we conduct result analysis; and the Section 5 contains the conclusions, recommendations, and discussions.

2. Theoretical Model Construction

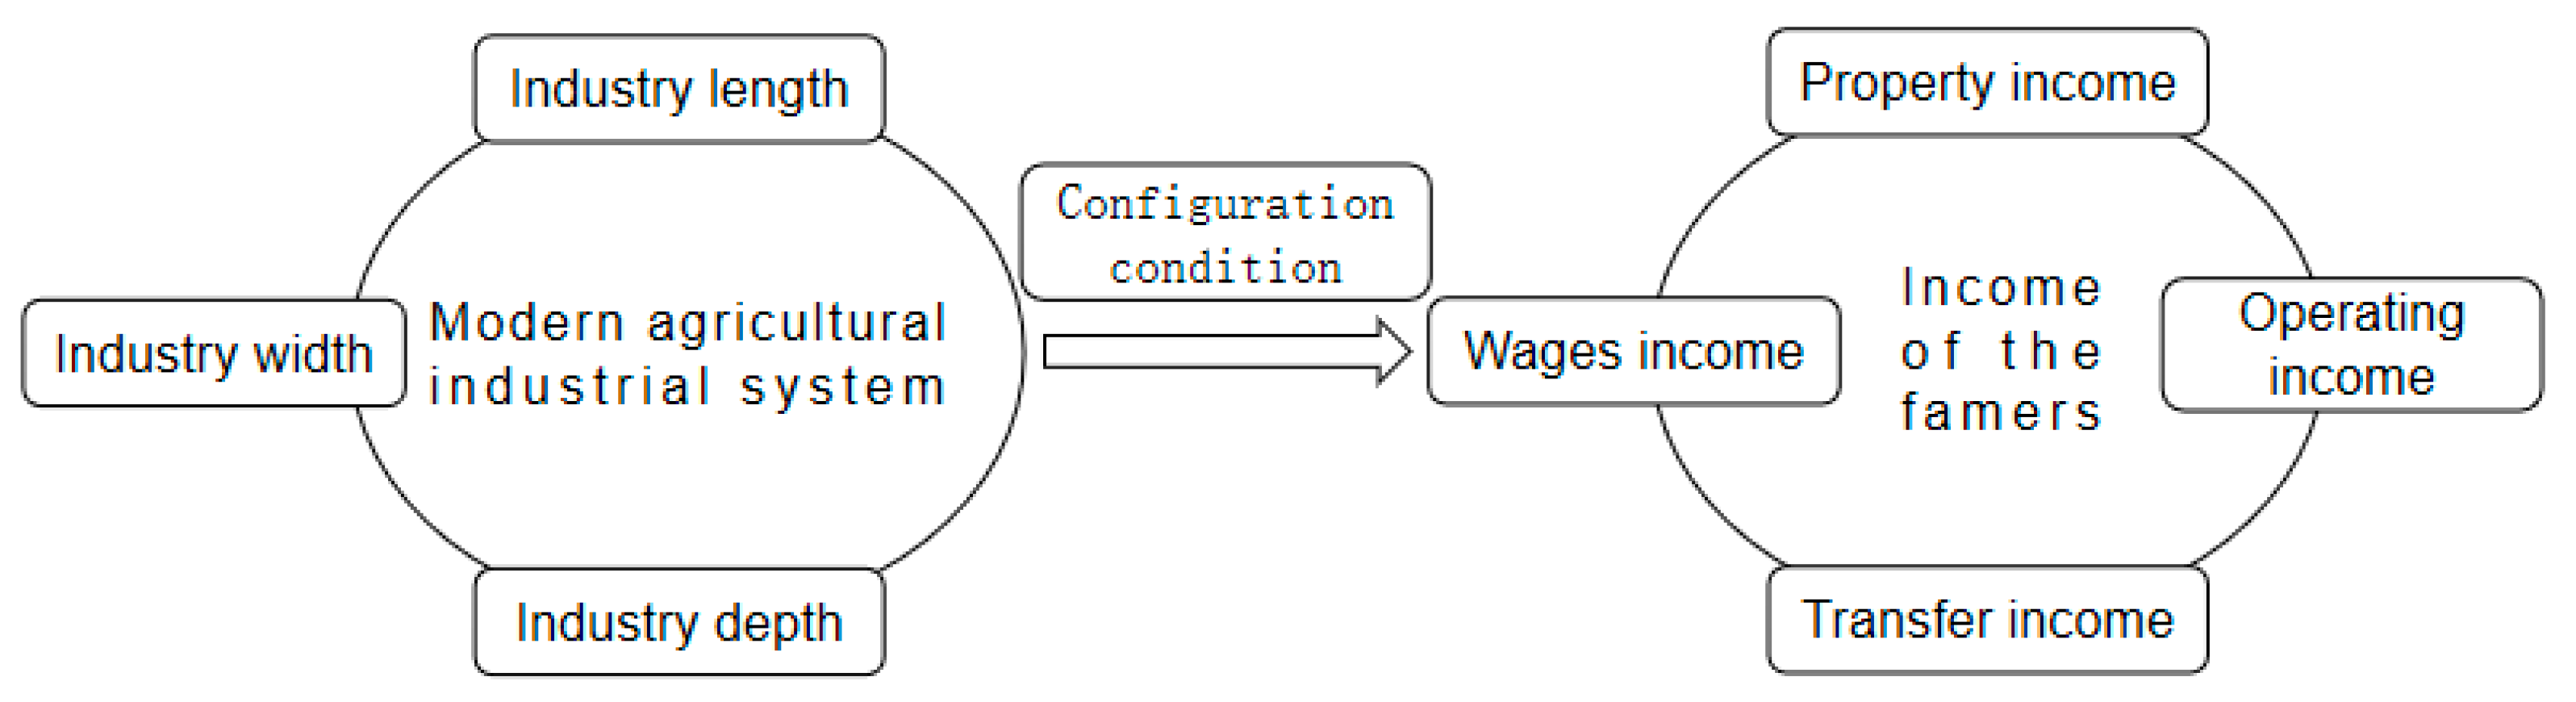
2.1. Farmers’ Income and Its Structure

Farmers’ income refers to the economic benefits derived from engaging in agricultural production, animal husbandry, forestry, fishery, and other business activities. It serves as a vital indicator of rural economic development and an essential basis for measuring farmers’ living standards and social welfare levels. Based on income sources, farmers’ income can be classified into four categories: operating income, wage income, property income, and transfer income. Operating income, the primary component, comprises earnings from farmers’ agricultural activities and those from individual business operations. Wage income refers to remuneration earned by farmers through labor contributions in non-agricultural sectors (e.g., factories, and construction sites). Property income encompasses rental income from leasing land or other assets (e.g., houses, machinery) and income generated through equity participation, partnerships, and joint ventures. Transfer income mainly comprises subsidies and welfare benefits provided by the national or local governments to farmers, such as grain subsidies and agricultural machinery purchase subsidies. Promoting farmers’ income is the central task of China’s “Three Rural Issues” work, and the government encourages and creates all kinds of conditions for farmers to increase their income through multiple channels.

2.2. Connotations and Measurement of Modern Agricultural Industrial System

The term “modern agricultural industrial system” first appeared in document No. 1 of the Communist Party of China (CPC) Central Committee in 2007. The 19th National Congress of the CPC has made “building a modern agricultural industrial system, production system and business system” an important part of the rural revitalization strategy. The modern agricultural industrial system practices in Heilongjiang, Henan, Shandong, and other provinces of China have all established the key directions by lengthening the agricultural industry chain, activating agricultural multi-functional businesses, and improving the productive service system of agriculture. However, there are differences in the academic community with regard to the basic connotations deemed appropriate and construction paths deemed necessary for the modern agricultural industrial system. Wan et al. emphasize that the modern agricultural industrial system, firstly, is based on the agriculture developed itself, then there is industrial system building, with the following characteristics: a high-end value chain, an advanced structure, highly active organization, highly integrated industry, an integrated spatial layout, and alignment with the process of urbanization [13]. Cao et al. understand the connotations of the modern agricultural industrial system from three different perspectives: an agricultural product industrial system, agricultural industry chain system, and agricultural multi-functional system [14]. Most scholars believe that the construction or evaluation of the modern agricultural industrial system can be carried out via the following: optimization of the modern agricultural industrial structure, agricultural industrialization, construction of a deep and intensive processing system of agricultural products, multi-functional development of agriculture, cultivation of new types of agricultural businessman, construction of new agricultural socialized service system, and so on [2,15,16]. Although the discussion and evaluation dimensions are diversified and the perspectives are different, stronger consensus can be achieved with regard to the dimensions of agricultural industry chain construction, agricultural multi-functional development, and agricultural productive services. Therefore, based on the basic consensus of practice and theory, this paper will indicate and evaluate the development level of the modern agricultural industrial system from the three dimensions, i.e., modern agricultural industry chain construction, agriculture’s overlap with and integration of non-agricultural industry, and the development of agricultural productive services. Accordingly, the concepts of length, width, and depth of the modern agricultural industrial system are proposed, and the modern agricultural industrial system is quantitatively measured from these three dimensions.
The length of the modern agricultural industrial system refers to the length of the whole agricultural industry chain. The connotation and boundaries of the concept of the industrial chain have been continuously enriched and expanded, from the division of labor between production processes within the enterprise proposed by Adam Smith to the division of labor cooperation between enterprises proposed by Hirschman and Stevens. Eventually, Mike Porter and Peter Haynes referred to the product value chain and the information chain. The agricultural industry chain is proposed based on the concept of the industry chain, and Mighell et al. view the agricultural industry chain from the perspective of “vertical coordination”, which refers to a series of activities including raw material production, processing, storage and transportation, sales and other activities [17]. Zhang et al. think that the agricultural industry chain includes the value chain, the information chain, the logistics chain, the capital chain, the technology chain, and the organization chain of the agricultural industry [18]. In this paper, the whole agricultural industry chain is viewed from the vertical process within the agricultural industry, and the more the whole industry chain is extended to cover upstream or downstream, the longer the length of the modern agricultural industry system is, drawing on the idea of Wang et al. [19] and the method of Koopman et al. [20], dividing the full agricultural industrial chain into three periods: planting/breeding, manufacturing/processing, and marketing. For every period covered by the agricultural industrial chain, one point will be added to the length of the modern agricultural industry system, until three points are reached.
The width of the modern agricultural industrial system refers to the overlap of agriculture and its integration with non-agriculture industry. Document No. 1 of the CPC Central Committee in 2015 proposed, for the first time, to promote the integration of the first, second, and third industries of agriculture in rural areas, and indicated that the integrated development of rural industries is an important way to help farmers increase their income. Document No. 1 of the CPC Central Committee in 2016 once again pointed out that “promoting the integrated development of integration of the first, second, and third industries of agriculture in rural areas is an important initiative to broaden the channels for farmers and build a modern agricultural industrial system”. The “integration of the first, second, and third industries of agriculture in rural areas” in the Chinese policy document has been interpreted by many scholars as the lengthening of the agricultural industry chain, the development of agricultural multi-functionalities, and the integration of agriculture with the service industry [21]. It has been widely used in the quantitative measurement of the integration of the agricultural industry, which is different from the width of the modern agricultural industrial system defined in this paper. Su et al. suggest the connotations of integrating the first, second, and third industries in rural areas, and believe that the integration of the three industries in rural areas refers to the internalization of the industrial division of labor between the first industry, which includes agriculture, forestry, animal husbandry, fishery, and other sub-industries, and the second and third industries; it also refers to the industrialization of the agricultural industry, to the expansion and upgrading of the agricultural industry itself, and to division and cooperation across the boundaries of the agricultural industry [22]. The meaning of the integration of the three industries in rural areas defined by Su et al. is highly aligned with that of the width of the modern agricultural industry referred to in this paper, i.e., the degree to which agriculture overlaps with and integrates non-agricultural industries. The width of the agricultural industry should be based on the ability of agriculture to influence, absorb, and provide the services of other non-agricultural industries after it has itself developed. The number of agricultural industries overlapping with non-agricultural industries is used in this study to calculate the width of the modern agricultural industrial system. The width of the modern agricultural industry system increases by one point for every field crossed from the agricultural industry to the non-agricultural industry. There is no upper limit to the total width.
The depth of the modern agricultural industrial system refers to the level of supporting services for agricultural productivity. Document No. 1of the CPC Central Committee in 2024 highlighted “seed key core technology research, agricultural machinery and equipment to make up for the shortcomings of the action, the construction of the county commercial system, etc.”, which are components related to the agricultural productive services. This sector has emerged as a significant symbol of agricultural modernization and a driving force. Services for all facets of agricultural production are provided by agricultural productive services, which are primarily made up of services for seeds, agricultural production materials, agricultural technology, training, business, processing, information, circulation, leisure, finance, insurance, areas among others [23,24]. The level of agricultural productivity in supporting services is referred to as the depth of the contemporary agricultural industrial system in this paper. To avoid overlaps between the length and width of the modern agricultural industrial system, processing, business, and leisure services are eliminated, and financial services are incorporated into insurance services. After these adjustments, the depth of the modern agricultural industry system is measured from seven aspects: seed services, agricultural material, agricultural technology, training, information, circulation, and insurance. For every additional aforementioned agricultural productive service, the depth of the modern agricultural industry system increases by one point. The maximum score of the depth is seven points.

2.3. Modern Agricultural Industrial System and Farmers’ Income Increase

2.3.1. Length of the Modern Agricultural Industrial System and Farmers’ Income Increase

The length of the modern agricultural industry system is considered to be the same as the length of the modern agricultural industry chain in this study. Scholars have studied the impact of agricultural industrial chains on farmers’ income and its structure from various perspectives. Yan et al. categorized agricultural industries into four sectors—inputs, production, processing, and distribution—based on a perspective of vertical extension along the industrial chain. They used the ratio of the total added value of agricultural industries to the added value of various agricultural production sectors as an index for developing agricultural industries. Empirical findings revealed that this index positively promotes farmers’ incomes, and further demonstrated that extending the agricultural industrial chain downstream has a more significant effect on increasing farmers’ income [25]. Ying et al. concluded that the rise in the development of the whole agricultural industry chain can lead to an increase in farmers’ income by constructing an intelligent evaluation model of the indicator system of the whole agricultural industry chain [26]. Guo et al., through case analysis, found that extending the industrial chain has a significant impact on farmers’ operating income and wage income [27]. Jiang identified five models of rural tertiary industry integration, among which the model that achieves agricultural tertiary industry integration through the extension of the industrial chain has a relatively balanced impact on various types of farmer incomes. Empirical data show that farmers’ incomes from selling agricultural products account for 19.12%, their land rent income accounts for 10.29%, and cash dividends and other incomes account for 8.82% [28]. Therefore, the academic community has reached a consensus that “the length of the agricultural industry chain has a positive impact on the growth of farmers’ income”. However, there are still differences in the impact on the structure of farmers’ incomes, so it is necessary to further discuss the heterogeneous impact of the length of the modern agricultural industry on farmers’ income and income structure.

2.3.2. Width of the Modern Agricultural Industrial System and Farmers’ Income Increase

In this paper, the width of agricultural overlaps with and integration of non-agriculture industries is regarded as the width of the modern agricultural industry system. From the perspective of income structure, scholars have reached a consensus on the positive role of the integration of the three rural industries in promoting farmers’ income, but there is insufficient research on its impact on farmers’ income structure and its mechanisms. For example, Zhang et al. concluded that the integration of rural three industries is mainly realized by increasing the operating income and wage income of farm households [29]. Wang et al. found that the integration of the three rural industries had a significant positive effect on the wage income, operating income and transfer income of farming households, but not on the property income of farming households [30]. Furthermore, some scholars have explored the intrinsic mechanisms by which the integration of the three rural industries affects farmers’ incomes. For example, the rural integration of three industries promotes growth in farmers’ operations, wages, and transfer incomes through branding effects and government support [27]. The rural integration of primary, secondary, and tertiary industries promotes increases in farmers’ incomes through three channels of action: the reuse of land resources [31], the increase in non-farming employment opportunities [32,33] and upgrades to the structure of the agricultural industry [34]. However, all of the aforementioned research on rural industry integration involves extending the agricultural industry chain, developing the multifunctionality of agriculture, and supporting agricultural productive services, which account for the width of the modern agricultural industry system mentioned in this paper, as well as its length and depth, which may lead to biased conclusions. Jiang distinguished five modes for the integration of rural primary, secondary, and tertiary industries. In the function-expanding integration model in which agriculture develops into non-agricultural industries, such as sightseeing, picking, leisure, and vacation, the sources of a farmers’ income mainly include farmers’ wage income (47.76%), income from selling agricultural products (43.28%) and other incomes (8.94%) [28]. This study provides empirical evidence that the width of the modern agricultural industrial system referred to in this paper promotes farmers’ wage incomes, operating incomes, and other incomes.

2.3.3. Depth of the Modern Agricultural Industry System and Farmers’ Income Growth

The depth of the modern agricultural industrial system is defined in this research as the depth of agricultural productive services. More scholars have focused their research on individual services in the agricultural productive services industry exploring the specific impacts of agricultural mechanization [35], technological progress [36], farmers’ training [37], and financial science and technology [38] on farmers’ incomes. Some scholars have used micro-farmer survey data to explore the income-increasing effects of agricultural production services [39,40]. A few scholars have conducted empirical studies using macro panel data at the provincial and county levels, revealing that the agricultural production service industry promotes the growth of farmers’ incomes by improving the efficiency of agricultural production [41,42]. It can be seen that there is an impact of agricultural production services on farmers’ income, but there is a lack of research on this impact on the structure of farmers’ income, and the conclusions are scattered. This paper considers the depth of the modern agricultural industry system to include seeds services, agricultural material, agricultural technology, training, information, circulation, and insurance, exploring how these services promote farmers’ wages, operations, property, and transfer income growth, and identifying sustainable pathways for income growth through modern agricultural industry system development.
To summarize, existing studies have discussed the impact of the length of the agricultural industry chain, the width of agricultural overlaps with and integration of non-agriculture industries, and the depth of agricultural productive services on the increase in farmers’ incomes and prosperity, and have reached a consensus on the positive impacts of the various dimensions of agriculture on farmers’ overall incomes. However, the modern agricultural industrial system is complicated. On the one hand, the dimensions of the agricultural industrial system affect farmers’ incomes both in unity and in contradiction with each other. There are different impacts on the direction, level of increase, and pattern of the overall income of farmers. Therefore, the systematic impacts of the dimensions of the agricultural industrial system on farmers’ income should be considered comprehensively instead of being separated. On the other hand, the impact of the agricultural industry system’s length, width, and depth on farmers’ income structures also varies. It affects wage income, operating income, property income, and transfer income differently, with distinct influence pathways. This may imply multiple paths for farmers to increase their income and achieve prosperity. There is still a significant gap in the theoretical interpretations and scientific evidence needed to understand how promoting farmers’ income growth through industrial development can lead to common prosperity. The aforementioned areas have not been addressed by the current research. Therefore, this paper constructs a theoretical framework for the modern agricultural industrial system, considering farmers’ multi-dimensional income growth using 88 special superior agricultural regions in Shanxi as case studies. It employs fuzzy set qualitative comparative analysis to explore the diverse configurations of length, width, and depth in promoting farmers’ wages, operations, property, and transfer incomes, as shown in Figure 2.

3. Research Methods and Data Sources

3.1. Research Methodology

Qualitative comparative analysis (QCA) is a set-theoretic approach that treats research objects as configurations of conditions, aiming to analyze complex causal issues such as multiple causation, causal asymmetry, and equivalence [43]. It overcomes the drawbacks of conventional metrics like regression and can make clear the various pathways and channels that contribute to particular results. In this paper, fsQCA was chosen for three reasons. First, it fits with the underlying assumptions of the research. We believe that instead of a single element, a combination of “one fruit and multiple causes” is responsible for the realization of farmers’ income and prosperity. In addition to finding the groupings of conditions and the “special routes”, fsQCA aids in elucidating the combined effect of numerous concurrent causes and effects and can successfully determine the strength or weakness of the causal effect among multiple conditions. Second, it applies to multi-case comparative research. It avoids the one-sidedness of a single-case study; at the same time, the sensitivity of causal complexity analysis makes it more advantageous than regression analysis and other methods in small and medium-sized sample case analysis [44]. Third, this analysis technique is more advantageous. Among the three methods of QAC analysis, fuzzy set qualitative comparative analysis (fsQCA) can assign values to variables multiple times in an interval of 0 to 1, and variable affiliation is calculated based on the gap between each conditional variable and the ideal concept. Thus, it helps to explore more comprehensively and deeply the impact of the structural characteristics of the agricultural industry in terms of its length, width, and depth on the farmers’ income increases and their income structures.

3.2. Data Sources

This paper takes 88 main counties and districts of Shanxi Province with special agricultural advantages as case samples. Farmers’ income is categorized into four sources: wage income, operating income, property income, and transfer income. Data are sourced from the Shanxi Statistical Yearbook and the statistical yearbooks of 11 prefectures. The development level of the industrial chain, the degree of integration of agriculture, primary, secondary, and tertiary industries, and the supporting level of agricultural producer services within the modern agricultural industrial system in Shanxi Province are derived from public news reports, official websites of local agricultural departments, agricultural and rural bureaus, and reports from local leading agricultural enterprises. These data are used to calculate the length, width, and depth of the modern agricultural industrial system.

3.3. Sample Data and Calibration
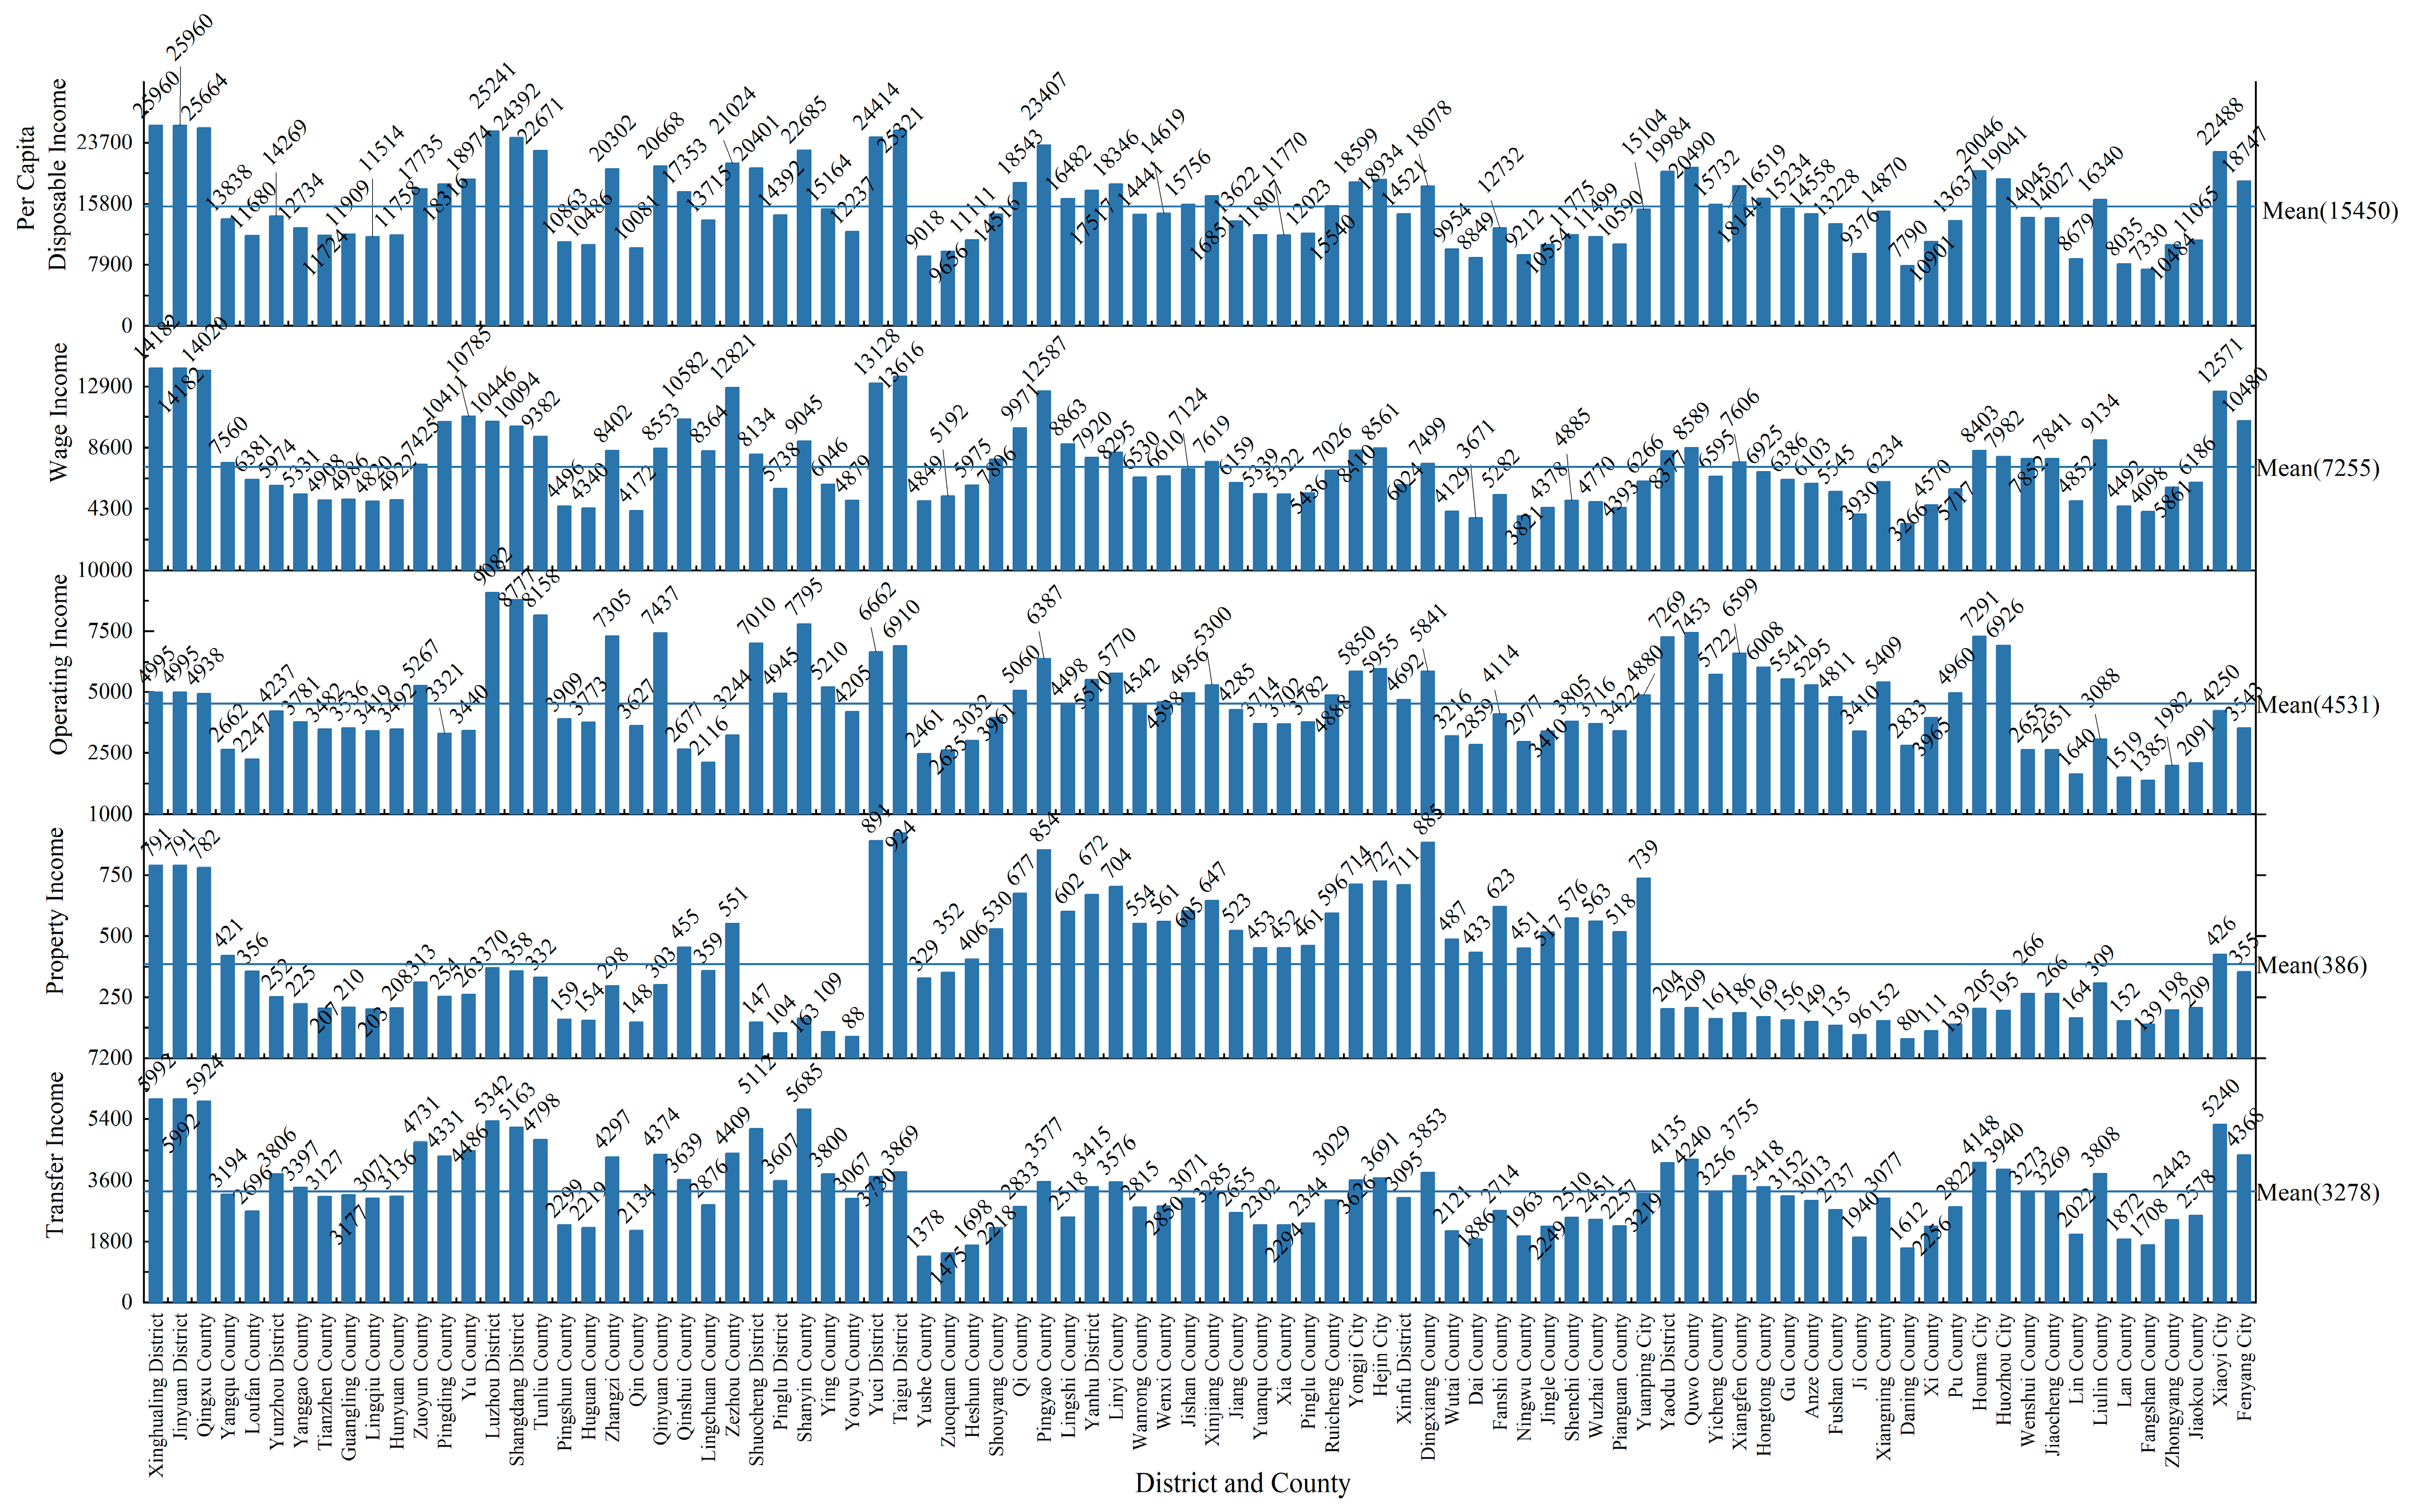
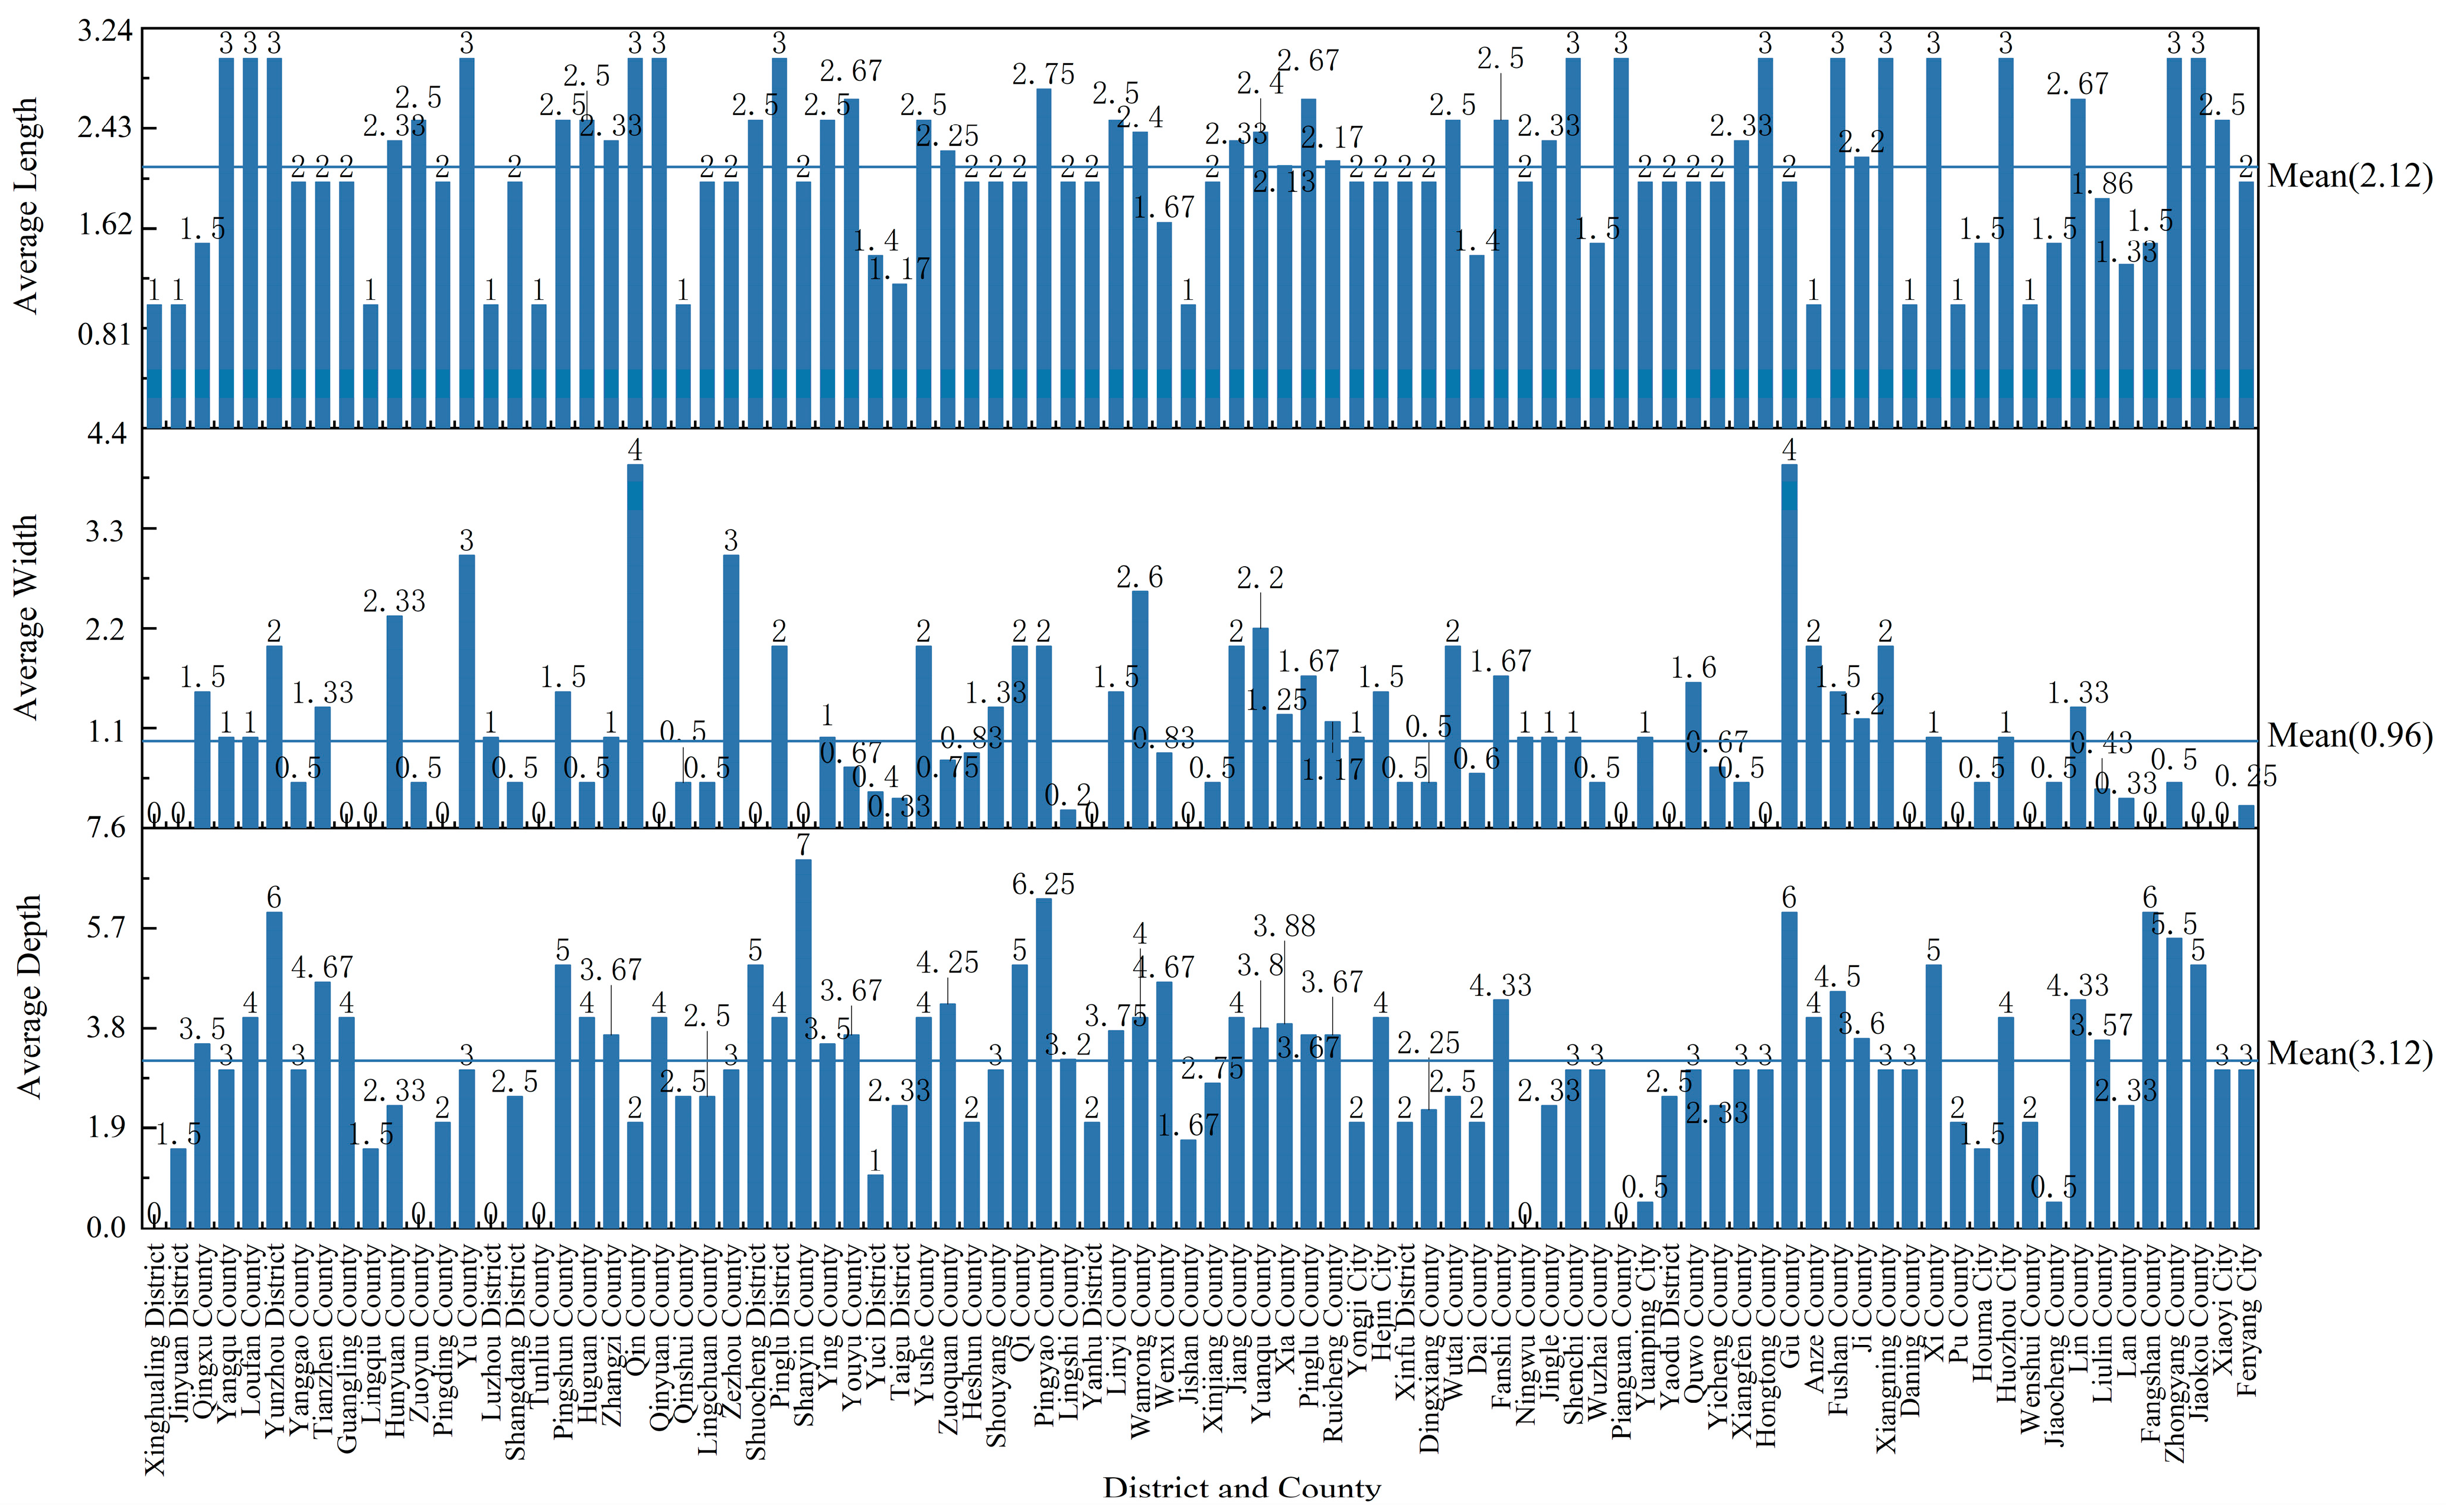
3.3.1. Sample Data

This study selects 88 counties and districts in Shanxi Province as research samples. The data on farmers’ income structure, as well as the length, width, and depth of the modern agricultural industrial system, along with their descriptive statistics, are shown in Figure 3 and Figure 4, and Table 1 and Table 2, respectively.
According to Figure 3 and Table 1, the average per capita disposable income of farmers in the sample production areas in Shanxi Province in 2022 was CNY 15,450.69. The difference between the highest (CNY 25,960) and the lowest (CNY 7330) income is as large as 2.5 times, reflecting the uneven character of farmers’ incomes in the sample production areas. Among the income components, wage income is the primary source for farmers, with an average of CMY 7254.19 in 2022 in the sample production areas. The difference between the highest (CNY 14,182) and the lowest (CNY 3266) is about four times, indicating that there are significant regional differences in the ability of special agriculture to drive the growth of farmers’ wage incomes and that great attention should be paid to its underlying mechanisms. Operational income averaged at CNY 4531.45 in 2022 with a difference of up to five times between the maximum (CNY 9082) and the minimum (CNY 1685). Transfer income averaged at CNY 3278.75. The maximum (CNY 5992) and minimum (CNY 1378) transfer income have a three-fold difference between them, meaning that transfer income exhibits the smallest income gap out of the four income structure categories. Property income averaged at CNY 385.7, with the highest (CNY 924) and lowest (CNY 80), income showing a greater than 10-fold difference, which is the largest internal difference among the four income structures. The proportion of farmers’ property income to their total income is relatively low, which is closely related to the lagging development of financial markets in rural areas of China and the lack of ability of farmers to make investments and finance their development [45]. However, there are huge regional differences in their incomes, so it is of great significance to explore the underlying mechanisms of this to promote farmers’ income growth.
As shown in Figure 4 and Table 2, the average length of Shanxi’s special agricultural industry system is 2.1, and the main links covered by the special agricultural industry chain are “breeding + processing” or “breeding + sales”. The industrial chain is incomplete, and the industry needs to be extended to the middle and lower reaches to further improve the ability for the deep processing of agricultural products, market operation and the overall competitiveness of the industry. In addition, the length of the Shanxi special agricultural industrial system has large regional differences in terms of the level of development. The maximum value of the length is 3, which is mainly distributed in 16 counties and districts, such as Louxiao County, Yunzhou County, Qin County, Zhongyang County, Shenchi County, etc., and the minimum value of the length is 1, which is mainly distributed in 11 counties and districts, such as Xinghualing District, Jinyuan District, Jishan County, etc., and does not present a regional agglomeration. The average width of Shanxi’s special agriculture industry system is 0.96, except for a few production areas combining special agriculture and culture, tourism, and recreation, which are rarely integrated with other areas. The degree of agricultural overlap with and integration of non-agriculture industries is extremely low, and needs to be increased. The maximum width, of 4, is distributed across Qinxian County and Guxian County, the narrowest width is 0, and includes Xinghualing District, Jinyuan District, Salt Lake District, and other 20 counties and districts; These areas, which have the capacity to provide special agricultural services, are small. Insufficient integration with non-agricultural industries and insufficient cross-borders, still remain in the internal cycle of the agricultural industry, limiting the development and growth of special-quality agriculture. The average depth of Shanxi’s special agricultural industry system is 3.11, which mainly involves seed services, information services, and circulation services’ the depth of Shanyin County is as high as 7, while the depth of Xinghualing District, Zuoyun County, and the other six counties and districts is only 0. The regional difference in depth is also very large, and it is inclined toward low values, which reflects that Shanxi’s special agricultural industry lacks enough support from the productive service industry, and that the level of modernization and development of agriculture is on the low end.

3.3.2. Variable Calibration

Calibration refers to the process of transforming the raw values of variables into their degrees of membership within a set [44], which is a necessary step in conducting complex causal analysis using fsQCA. Based on the actual case scenarios and the distribution of variable values, this paper adopts the direct calibration method proposed by Ragin [46] for structured calibration. Specifically, full membership, crossover points, and full non-membership are set at 95%, 50%, and 5%, respectively, based on the descriptive statistical analysis of the case samples. Additionally, to avoid cases where the degree of membership in the condition or outcome set equals 0.5, this study manually adds a constant of 0.001 to variables calibrated to 0.5. The specific calibration anchors and descriptive statistical analysis results are presented in Table 3.

4. Configuration Analysis

4.1. Necessity Analysis of Individual Conditions

Given the qualitative and quantitative principles of the QCA method, it is necessary to conduct a necessity test on multiple conditional variables related to farmers’ income structure before proceeding with configuration analysis to determine whether they serve as key or core variables in the configuration analysis. According to the consistency principle to determine whether a single conditional variable is a necessary condition for the outcome variable, if the consistency of a single conditional variable is greater than 0.9, it is considered to be a necessary condition for the generation of the outcome. If the consistency of a single conditional variable is less than 0.9, it means that there is no necessary relationship between the conditional variable and the outcome variable, and then a test on the adequacy of the conditional grouping can be carried out. In this paper, the consistency of all conditional variables is less than 0.9 (Table 4), indicating that there is no single conditional necessity relationship between industrial length, industrial width, and industrial depth and the overall scores of Shanxi farmers’ wage income, operational income, property income, and transfer income. Therefore, it is necessary to conduct an in-depth exploration of multiple concurrent causes.

4.2. Sufficiency Analysis of Conditional Configurations

4.2.1. Configuration Paths for Wage Income

In conducting truth table analysis, this paper refers to the research of scholars such as Du Yunzhou et al. [43], setting the frequency threshold at 1 and the consistency threshold at 0.8. The PRI consistency is divided based on natural breakpoints [47]. Discontinuity occurs after a PRI value of 0.6, so outcome variable values above 0.6 are modified to 1, and the rest are 0. Using fsQCA 3.0 software, we analyze the conditional configurations that lead to a specific outcome (high farmer income), yielding three forms: a complex solution, an intermediate solution, and a parsimonious solution. In the process of configuration analysis, scholars often use intermediate and parsimonious solutions to explore the core and peripheral conditions of the outcome variable. Farmers’ wage income refers to the remuneration that farmers receive by providing labor in non-agricultural industries. Through the analysis of the intermediate and parsimonious solutions, this paper identifies two configuration paths, S1a and S2a, that lead to high-wage income, as shown in Table 5. The overall coverage of the solutions is 0.534154, and the overall consistency is 0.780875. The explanatory power of these two paths reaches 78.09%, covering to 53.42% of the case areas. In general, both configurations have good explanatory power for achieving high farmer wage incomes.
Path S1a, “non-industry length * industry width”, indicates that a condition that lacks industry length can better enhance farmers’ wage income increases by improving industry width. The consistency of the path is 0.80064, indicating that the cases conforming to the development path have 80.06% explanatory power; the original coverage is 0.362539 and the unique coverage is 0.123823, indicating that path S1a explains about 36.25% of the cases, among which 12.24% of the cases can be uniquely explained by the path. Specifically, the agricultural industry, through the cross-border integration of non-agricultural industries, such as the development of agriculture + food processing, agriculture + tourism, agriculture + e-commerce, and other diversified industries, provides more employment opportunities and job options for farmers and increases the number of sources for farmers’ wage incomes in general, which is in line with the conclusions of the studies by Jiang [28], Zhang et al. [29], Wang et al. [30], and other scholars. A representative case in this path is Anze County in Linfen City, Shanxi Province, where the specialty agriculture of Anze County is the forsythia industry, but this still remains as a forsythia plantation industry. The length of its special agricultural industry system is 1, the lowest level in the province. The construction of the forsythia industry length is seriously insufficient, but the county has made great efforts in “forsythia+”. Since 2022, the aim has been to achieve a “forsythia + tourism”, “forsythia + tea industry”, forsythia industry width of 2, ranked first in the province. By integrating the advantages of forsythia resources and actively developing leisure agriculture, rural tourism, e-commerce, cultural experience, and other new business forms, the cross-border integration and development of the local forsythia industry has contributed an increase in local market players of 12.5%, providing more than 20,000 jobs, and more than 8000 local families are involved in the development of the forsythia industry, with the average income of the household increasing by more than CNY 10,000. Among them, the county’s farmers’ wage income was CNY 7707, i.e., higher than the average farmers’ wage income in the province, which is closely related to the employment opportunities provided by the cross-border integration development of the local forsythia industry for farmers.
Path S2a, “industry length * non-industry width * non-industry depth”, indicates that in the absence of industry width and depth, farmers’ wage income can be improved by extending the length of the industry. The consistency of the path is 0.799248, indicating that the cases conforming to the development path have 79.92% explanatory power. The original coverage is 0.410331, and the unique coverage is 0.171615, indicating that path S2a can explain about 41.03% of the case sites, of which 17.16% can be uniquely explained by the path. Increasing the length of the industry means that products undergo more processing and value-added processes, which increases added value and increases the opportunities for farmers’ participation and sources of income. Through participation in planting, breeding, processing, and marketing, farmers can earn stable wage incomes. A representative area that conforms to this grouping path is Pianguan County in Xinzhou City, Shanxi Province, which is characterized by small mixed grains and animal husbandry as its form of special agriculture. The upstream planting and breeding scale is large, with a planting area of 114,700 acres of small grains, 910,000 acres of pasture slopes, and a stock of more than 800,000 sheep. The middle reaches have developed processing industries such as brewing, drinking, and meat products; the downstream reaches have created regional public brand names such as “Pianguan Mutton” and “Pianguan Millet” and are actively developing online and offline sales channels. As a result, the length of the county’s specialty agricultural industry is 3, which is in the first tier of the province, but the width and depth of its industry are 0, and it has completely failed to expand the small grains and animal husbandry industry into other industrial fields or to develop a related productive service industry. The wage income of farmers in the county is CNY 4393, which mostly comes from the employment opportunities provided by the development of the whole industrial chain of small mixed grains and animal husbandry.
To summarize, there are two paths affecting farmers’ wage income: S1a, “non-industry length * industry width”, and S2a, “industry length * non-industry width * non-industry depth”. This shows that simply developing the length or width of the modern agricultural industrial system has a positive effect on farmers’ wage income, while both paths exclude the effect of the depth of the modern agricultural industry on farmers’ wage income. From the perspective of the only coverage indicator, the impact of industry length (17.16%) and width (12.38%) on farmers’ wage income is of general significance. Therefore, from a practical point of view, extending the length or expanding the width of the agricultural industry can promote the growth of farmers’ wage income, and both can promote farmers’ income through the improvement of the industry’s own competitiveness and the provision of more jobs. However, the support level of the agricultural production service industry does not contribute to the growth of farmers’ wage income, probably due to the low level of development of the sample in this dimension, which makes it difficult to accurately investigate the mechanisms involved. In addition, it is found that there is a crowding effect of the length and width or depth of the modern agricultural industry on farmers’ wage income. The reason may be that the development of the depth or width of the agricultural industry needs to compete with the development of the length of the agricultural industry for labor, land, capital, and other resources, caused by the scarcity of resources in the development of modern agricultural industry dimensions of the conflict, which in turn affects the contribution of the dimensions of the agricultural industry to the growth of farmers’ wage income.

4.2.2. Configuration Paths of Operating Income

Operating income refers to the income that farmers earn through their own agricultural production activities and engagement in individual business. Through fsQCA analysis, the configuration paths to achieve high operational income are S1b, S2b, and S3b, as shown in Table 6. The overall coverage of the solution is 0.551685, and the overall consistency of the solution is 0.746687. The explanatory power of the three paths reaches 74.67%, covering 55.17% of the case sites. In general, the above three configurations have good explanatory power for achieving high farmer operating incomes.
Path S1b, “non-industry length * industry width”, indicates that under conditions that lacking industry length, farmers’ business income can be better increased by increasing industry width. The consistency of the path is 0.838487, indicating that the cases conforming to the development path have 83.84% explanatory power; the original coverage is 0.358151, and the unique coverage is 0.0182149, indicating that path S1b explains about 35.82% of the cases, of which 1.82% can be uniquely explained by the path. The model focuses mainly on the horizontal expansion and diversification of the modern agricultural industry. When agriculture expands into other industrial fields, such as agriculture + tourism, + catering, + retail, + e-commerce, etc., individual farmers have more opportunities to increase their business income through individual entrepreneurship and partnership. A typical case under this path is Zezhou County in Jincheng City, Shanxi Province, where the county’s form of specialty agriculture is small grains, and its industrial chain covers two stages, planting and processing, with insufficient development in terms of length. The width, on the other hand, has expanded to tourism, e-commerce and food processing, and the level of width is the highest in the province. Cross-border integration of the agricultural industry development of Zezhou County’s “small grains characteristics of agriculture +” output value scale reached CNY 1.9 billion. Through the construction of the “company + cooperatives + base + farmers” industrialized management mode, 1532 farmers’ professional cooperatives were cumulatively developed, registered capital reached CNY 1.92 billion, and the number of members grew to 32,000 people. Through shares, participation in various types of professional cooperatives, and partnerships in agriculture, culture, tourism, and rural e-commerce business ultimately drive more than 40,000 local farmers to increase their income and wealth.
Path S2b, “non-industry length * industry depth”, indicates that under conditions lacking industry length, it is also possible to promote the improvement in farmers’ operating incomes by broadening the depth of the industry. The consistency of this path is 0.776287, indicating that the cases conforming to this development path have 77.63% explanatory power; the original coverage is 0.40847, and the unique coverage is 0.0380237, indicating that path S2b explains about 40.85% of the cases, and about 3.8% of the cases are uniquely explained by this path. Under this type of model, the development of agricultural production services is an effective way to increase farmers’ operating income, and the various ancillary services required for agricultural production, such as agricultural machinery, agricultural tools, agricultural capital, commerce, and logistics, can provide farmers with more “small and beautiful” entrepreneurial opportunities, thereby increasing their operating income. A typical case under this path is Liulin County in Lvliang City, where the specialty agricultural industry is the jujube industry, the average length of the specialty agricultural industry is 1.86, the average depth is 3.57, and the operating income of farmers is CNY 3088. Liulin County has achieved remarkable results in the development of the depth of the agricultural industry and has constructed a comprehensive set of agricultural production service systems by introducing and promoting high-quality varieties of jujube, walnut, and other varieties adapted to local conditions, perfecting agricultural services, deepening multifaceted services such as agricultural technology promotion, information services, agricultural product logistics, agricultural loan and insurance, and promoting the digital upgrading of facility-based agriculture. These initiatives have promoted the modernization and increased the development level of the local jujube industry and raised the income of jujube farmers.
Path S3b, “industry length * non-industry width * non-industry depth”, indicates that in the absence of industry width and depth, farmers’ operating income can also be raised by increasing the length of the industry. The consistency of the path is 0.80536, indicating that the cases conforming to the development path have 80.54% explanatory power; the original coverage is 0.390027 and the unique coverage is 0.104508, indicating that path S3b explains about 39% of the cases and about 10.45% of the cases can be explained uniquely by the path. This model emphasizes the importance of the vertical development of the industry, and in the absence of horizontal expansion and internal deepening, the lengthening the industry can also increase the income of the front-end farmers. A representative case in this path is Zuoyun County in Datong City, which specializes in small grains and potatoes, and the average length of the county’s special agricultural industrial system is 2.5, while the width and depth are 0.5 and 0, respectively. Farmers’ operating income is CNY 5267, higher than the provincial average, accounting for nearly 30% of the total income of local farmers. The small grains industry adopts the “cooperative + farmers” development model, in which cooperatives gather the breeding strength of local decentralized farmers and provide primary agricultural products for local agricultural, leading enterprises in a cooperative manner so that decentralized small farmers can effectively access the modern agricultural industrial system and earn an operating income through larger-scale and more sustainable breeding businesses, such as the local agricultural leading enterprise Yanmen Qinggao Company, to drive the surrounding 3000 households to plant buckwheat on 30,000 acres of buckwheat plantations. At the same time, the continuous development of the company’s income has also risen, with an average income of CNY 4680 in 2022 and a total income of CNY 14.04 million.
To summarize, there are three paths affecting farmers’ operating income: S1b, “non-industry length * industry width”, S2b, “non-industry length * industry depth”, and S3b, “industry length * non-industry width * non-industry depth”. This indicates that the length, width, and depth of the modern agricultural industrial system have a positive impact on farmers’ operating income. In terms of the only coverage indicator, the length of the industry (10.45%) has a more generalized impact on farmers’ operating income than the depth (3.80%) and width (1.82%). The impact of industry length on operational income is mainly realized through the embedding of farmers in the upper reaches of the agricultural industry. Farmers can earn more operational income by providing agricultural businesses with a wider range of primary products, especially if the products are more economically viable. The lack of capacity and limited opportunities for entrepreneurial involvement with regard to the depth and width of the agricultural industry has led to less experience in promoting farmers’ operating income in these two dimensions. For example, agricultural sales, agricultural intermediary services, and “agriculture plus” cross-border operations, which originate from a small number of well-managed farmers’ cooperatives, can generate some operating income for farmers. It was also found that there is a crowding-out effect between the length of the industry and the depth or width of the industry on farmers’ operating incomes, which may still be due to the opportunity costs of agricultural resource factors.

4.2.3. Configuration Paths of Property Income

Property income includes rental income obtained by farmers from leasing their land or other assets (such as houses, machinery, and equipment) to others, as well as property income derived from equity participation, shareholding, and partnership operations. The configuration paths to achieve high property income are S1c and S2c, as shown in Table 7. The overall solution coverage is 0.554128, and the overall consistency of the solution is 0.733312. The explanatory power of the two paths reaches 73.33%, covering 55.41% of the case sites. In general, the above two configurations both have good explanatory power for achieving high farmer property incomes.
Path S1c, “industry length * non-industry depth”, indicates that under the condition of lack of industry depth, it is also possible to promote improvement in farmers’ property incomes by increasing the length of the industry. The consistency of this path is 0.749257, indicating that the cases conforming to this development path have 74.93% explanatory power; the original coverage is 0.479895, and the unique coverage is 0.187723, indicating that path S1c explains about 47.99% of the cases and that about 18.77% of the cases can be uniquely explained by this path. Under this model, the extension of the industry promotes the specialization of and increase the scale of agriculture, which in turn raises the level of demand for various resource factors such as land, and for this reason, farmers can obtain stable rental incomes through land transfer, agricultural leasing, and so on. At the same time, the extension of the length of the agricultural industry, leading to an increase in demand for land and other agricultural resource factors, will certainly deplete the supply of agricultural production services, especially the supply of such scarce resources as land, and therefore may manifest in the path “industry length * non-industry depth” for the growth in property income characteristics. A representative case under this path is Jingle County in Xinzhou City, which is characterized by the quinoa industry and focuses on the development of quinoa cultivation and deep processing. The average length and depth of the quinoa industry are 2.33; the length is higher than the average length of the province (2.1), and the depth is lower than the average depth of the province (3.11). Farmers’ property income in Jingle County ranks among the highest in the province at CNY 517, with the main contribution coming from the local quinoa industry’s higher level of deep processing, including that of land, capital, agricultural facilities, and other large-scale resources, and with a great need to improve the opportunities for local farmers to obtain property income through equity, participation, leasing, and other means.
Path S2c, “non-industry length * industry width”, indicates that under conditions lacking industry length, farmers’ property income can also be enhanced by broadening industry width. The consistency of this path is 0.820896, indicating that the cases conforming to this development path have 82.09% explanatory power; the original coverage is 0.366405, and the unique coverage is 0.0742326, indicating that path S2c explains about 36.64% of the cases, and about 7.42% of the cases can be uniquely explained by this path. Even though the agricultural industry is rather short in length, this model effectively promotes farmers’ property revenue by expanding the industry width. Farmers can not only obtain stable rent and dividend incomes through land transfer and shareholding cooperation but also obtain property income through participation in diversified industries such as agricultural product processing, rural tourism, and e-commerce sales. A typical case under this path is Gu County in Linfen City, where the length of the industry is 2, the width of the industry is 4, and the level of farmers’ property income is CNY 156. Gu County vigorously develops “walnut +” special agriculture, establishes an ecological cycle in the agricultural industry, and establishes many farmers’ professional cooperatives, family farms, and other new agricultural management bodies. Farmers participate in the operation of these business entities through shareholding, cooperation, and other means, and receive property income such as dividends and bonuses.
In summary, there are two paths affecting farmers’ property incomes, S1c, “industry length * non-industry depth”, and S2c, “non-industry length * industry width”, which exclude the impact of the depth of the modern agricultural industrial system on farmers’ property incomes. Only length and width can affect farmers’ property incomes. Moreover, from the perspective of the only coverage indicator, length (18.77%) affects farmers’ property incomes more generally than width (7.42%). The length and width of the modern agricultural industrial system help to increase the property income of farmers, which refers to the capital gains from agricultural production practices in which farmers invest their property resource elements in increasing the length of the agricultural industry. A more common practice is for individual farmers to lease land to collectives or agribusinesses to carry out large-scale farming, or to invest in farmers’ cooperatives with land, houses, or money. They participate in the upstream and downstream construction of the agricultural industry in the form of farmers’ cooperatives or carry out cross-border agricultural operations in the form of farmers’ cooperatives. It is also found that there is a crowding out effect between the length of the industry and the depth or width of the industry on property income, and the reason for this may also be related to the conflict in the distribution of agricultural resource factors in different dimensions of the agricultural industry.

4.2.4. Configuration Paths of Transfer Income

Transfer income primarily refers to various subsidies and welfare benefits provided by the state or local governments to farmers, such as grain subsidies and agricultural machinery purchase subsidies. The configuration paths to achieve high transfer income are S1d, S2d, and S3d, as shown in Table 8. The overall solution coverage is 0.581151, and the overall consistency of the solution is 0.765794, indicating that the explanatory power of the three paths reaches 76.58%, covering 58.12% of the case sites. In general, the above three configurations have good explanatory power for achieving high farmer transfer incomes.
Path S1d, “non-industry length * industry width”, indicates that under the condition of lack of industry length, farmers’ transfer income can also be promoted by expanding industry width. The consistency of this path is 0.793711, indicating that the cases conforming to this development path have 79.37% explanatory power; the original coverage is 0.348223, and the unique coverage is 0.0224509, indicating that path S1d explains about 34.82% of the cases, and about 2.25% of the cases can be uniquely explained by this path. Under this type of model, even though the length of the industry is relatively short, agriculture can be expanded and strengthened via the industry width, thus attracting more government subsidies and increasing farmers’ transfer incomes. A representative case under this path is Wanrong County in Yuncheng City, where the industry width is 2.6, much higher than the average width of the province’s special agricultural industry (0.96), the length is 2.4, and the transfer income of farmers is CNY 2815. Wanrong County relies on Chinese herbal medicine characteristics of agriculture to create an integrated model of “agriculture + food processing + tourism + e-commerce”, and has gradually increased the subsidies related to agriculture. In 2023, CNY 600 per mu will be subsidized for the construction of standardized demonstration bases for Chinese herbal medicines (medicinal tea), and CNY 1200 per mu will be subsidized for the construction of breeding bases for Chinese herbal medicines. In addition, a subsidy of CNY 67 per mu will be provided to farmers with contractual rights to farmland, which will be used to promote the cultivation of Chinese herbal medicines and other agricultural by-products.
Path S2d, “non-industry length * industry depth”, indicates that under conditions lacking industry length, farmers’ transfer incomes can also be raised by creating industry depth. The consistency of this path is 0.774124, indicating that the cases conforming to this development path have 77.41% explanatory power; the original coverage is 0.418382, and the unique coverage is 0.0502807, indicating that path S2d explains about 41.84% of the cases, and about 5.03% of the cases can be uniquely explained by this path. Under this type of model, emphasis is placed on the development of agricultural production services such as agricultural insurance, financial services, information services, and agricultural technology services to promote the increase in farmers’ transfer incomes. The typical case under this path is Shanyin County in Shuozhou City, which has an industry length of 0, reflecting the extremely immature development of the agricultural industry in Shanyin County. The depth of the industry is 7, this depth being the maximum value in the province, and agricultural supporting services are very well developed. Farmers’ transfer income is CNY 5685, ranking among the highest in the province, accounting for more than 25% of the total income of local farmers. Shanyin County vigorously develops grain agricultural services. For example, it actively introduces and cultivates high-yield, high-quality crop varieties in seed services, and organizes expert teams for field guidance and technical training in agricultural machinery services. In 2024, the central government provided CNY 6.2 million to Shanyin County for socialized agricultural production services to support agricultural production hosting services, which directly increased farmers’ transfer incomes.
Path S3d, “industry length * non-industry width * non-industry depth”, indicates that under conditions lacking industry width and depth, farmers’ transfer income improvement can also be enhanced by extending the length of the industry. The consistency of the path is 0.819934, indicating that the cases conforming to the development path have 81.99% explanatory power; the original coverage is 0.407858, and the unique coverage is 0.11927, indicating that path S3d explains about 40.79% of the cases, and about 11.93% of the cases can be uniquely explained by the path. Such models emphasize that the lengthening of the agricultural industry length can increase government subsidies related to agriculture, such as subsidies for grain cultivation, deep processing, and the purchase of agricultural machinery, and thus increase farmers’ transfer incomes. A representative case under this path is Ningwu County in Xinzhou City, which is known as the “Hometown of Chinese Plateau Naked Oats”, and the naked oats industry is its specialty agriculture. The average length of the county’s special agriculture is 2, the average width is 1, and the average depth is 0. The development level of both width and depth is relatively low, and farmers’ transfer income is CNY 1963, which is lower than the average level of the whole province, but it accounts for more than 20% of the total income of local farmers. By integrating land resources, developing the large-scale cultivation of naked oats, and introducing processing enterprises, an integrated naked oats industry of cultivation, processing, and sales has been formed. The development of the industry has also brought more agriculture-related subsidies, including CNY 23 million worth of agricultural industry development and subsidy articulation funds, CNY 40.61 million of rural industry development project articulation funds, and CNY 2.14 million of provincial articulation funds for the development of agricultural specialty industries for people who have been lifted out of poverty. Various types of agriculture-related subsidies have stimulated farmers’ enthusiasm to participate in naked oats production and management, directly increasing their transfer income.
To summarize, there are three paths affecting farmers’ transfer income: S1d, “non-industry length * industry width”, S2d, “non-industry length * industry depth”, and S3d, “industry length * non-industry width * non-industry depth”; the length, width, and depth of the modern agricultural industrial system can positively affect farmers’ transfer incomes. From the unique coverage comparison of the cases, farmers’ transfer incomes have increased the most (11.93%) as a result of increased industry length, followed by the depth of the industry (5.03%) and the width of the industry (2.25%). This shows that the development of the whole modern agricultural industry chain can lead to special government agricultural subsidies, and in practice, the extension of the agricultural industry chain can lead to more government subsidies. For example, Shanxi Provincial People’s Government 2020 issued Opinions on Accelerating the Development of Ten Industrial Clusters of Deep Processing of Agricultural Products”, which financially supports the extension of Shanxi’s top ten special agricultural industrial clusters, from primary processing to deep processing. In the practice of expanding the depth and width of the agricultural industry, there are fewer cases of agricultural subsidies being obtained based on these two operations, and it is difficult to advance this practice. It is also found that the length of the industry and the depth or width of the industry have a mutual crowding-out effect on the impact of the transfer income, which may be due to the limitations of government financial expenditure, and the limited transfer payments have to be coordinated and allocated to the length, width, and depth of industrial development.

4.3. Robustness Test

This paper adopts three methods to conduct robustness tests. Firstly, the calibration anchors are adjusted. With the crossing point remaining unchanged, this paper adjusts the completely belonging anchor point to the 75th percentile and the completely non-belonging anchor point to the 25th percentile, and the configuration results remain consistent with the original configuration. Secondly, the consistency threshold is increased. By raising the consistency threshold from 0.8 to 0.85, the configuration remains consistent with the original one. Finally, the case threshold is increased. By elevating the case threshold from 1 to 2, the resulting configuration is consistent with the original one. In summary, the research findings of this paper demonstrate strong robustness.

5. Discussion

The marginal contributions of this study, firstly, innovatively put forward the concepts of length, width, and depth in the modern agricultural industrial system and quantitatively measure them, providing a theoretical analytical framework for systematically thinking about and evaluating the level of development of the modern agricultural industrial system, and also providing useful insights for systematic research on other industrial systems. Secondly, the fuzzy set qualitative comparative analysis (fsQCA) method is used to explore the multiple paths of the dimensions of the modern agricultural industrial system on the income structure of farmers, revealing the differentiated impacts of the length, width, and depth dimensions of the modern agricultural industrial system on the income structure of farmers, enriching and further expanding the correlation research on the revitalization of the agricultural industry and the income of farmers, and providing new theoretical insights for the development of the modern agricultural industrial system for the purpose of further increasing farmers’ incomes and prosperity.
Due to the cross-cutting and ambiguous nature of the measurement of the construction of the agricultural industry chain, the overlap and integration of agriculture with non-agriculture industries, and the agricultural productive services, there is a certain degree of measurement error. In addition, this study takes the special agricultural production area of Shanxi as the sample object. Shanxi’s agriculture is not representative enough of the whole country, and more empirical verification is needed to see whether the conclusions of the study are of general significance for extending to other regions.

6. Conclusions

Taking 88 major counties and districts in Shanxi’s superior agriculture as research samples, this paper employs fuzzy set qualitative comparative analysis (fsQCA) to explore the configurational effects of the length, width, and depth of the modern agricultural industrial system on farmers’ wage income, operating income, property income, and transfer income. The main conclusions are as follows:
(1)
The level of farmers’ income is jointly influenced by the length, width, and depth of the modern agricultural industrial system, emphasizing that a single factor does not constitute a necessary condition for farmers to increase their income and become wealthy.
(2)
There exist four paths for the modern agricultural industrial system to promote farmers’ income, namely “non-industry length * industry width”, “industry length * non-industry width * non-industry depth”, “non-industry length * industry depth” and “industry length * non-industry depth”, as shown in Table 9. The first type of path, “non-industry length * industry width”, has a promoting effect on all four income levels of farmers, which means that strongly encouraging an overlap and integration of agriculture with non-agriculture industries can improve all kinds of income categories for farmers; the integration of the agricultural industry with others is of great significance to increasing farmers’ incomes. The second type of path, “industry length * non-industry width * non-industry depth”, has a boosting effect on the other three income categories, except for farmers’ property incomes. This means that the development of the modern agricultural industry chain alone can raise farmers’ wage, operating, and transfer incomes by providing more jobs, expanding the scale of farming and attracting financial subsidies, and that the construction of modern agricultural industry chain is also significant. The third type of path, “non-industry length * industry depth”, helps to increase farmers’ operating income and transfer income, indicating that the development of modern agricultural production services can provide more entrepreneurial opportunities and attract financial subsidies, and that it plays an important role in facilitating the organic linkage between small farmers and modern agriculture. The fourth type of path, “industry length * non-industry depth”, only helps to increase farmers’ property income.
(3)
The development of the length, width, and depth of the modern agricultural industry has a crowding-out effect on farmers’ wage income, operating income, property income, and transfer income. When there is a scarcity of labor, land, capital, and other resources, the development of the length, width, and depth of the modern agricultural industry will compete for limited agricultural production resources, which in turn will affect the increase in farmers’ incomes.
Based on the above conclusions, countermeasures for the development of the modern agricultural industry are proposed: (1) The first is to attach great importance to encouraging the overlap and integration of agriculture with non-agriculture industries, placing it at the forefront of the development of the agricultural industrial system. This also includes actively expanding the field of “agriculture plus”, continuously improving the ability to coordinate the development of agriculture and other non-agricultural industries, building aircraft carriers for the agricultural industry through the cross-border integration of non-agricultural sectors, and comprehensively raising farmer incomes of various types. (2) Emphasis should also be placed on the construction of the entire modern agricultural industry chain, expanding and strengthening the various segments of modern agriculture, including breeding, deep processing, and sales services, so that the strength of the agricultural industry itself can be increased by providing more jobs, leading to a wider range of breeding scales, and providing more subsidies related to agriculture, thus promoting increases in farmers’ wage, operating, and transfer incomes. (3) Moderate consideration should be given to the development of modern agricultural production services, and the in-depth development of the agricultural industrial system is one of the effective paths for helping farmers to achieve prosperity. Local agricultural resource endowments and stages of development should be taken into account to allow more small farmers to engage in agricultural support services, such as seed services, agricultural materials, agricultural technology, training, information, distribution, and insurance, to allow for greater operating incomes and transfer incomes. (4) It is important to take into account how the different facets of the agricultural sector affect farmers’ earnings holistically. It is more important to logically plan and prioritize the different stages of development of each component of the local agricultural industrial system when there are constraints on agricultural production resources. This allow farmers to be brought together through the development of a modern agriculture business, and will support farmers in obtaining a sustainable income and wealth. It is not recommended for multiple projects to be worked on at once or to develop one area without firstly setting priorities.

Author Contributions

Conceptualization, X.Z. and X.L.; methodology, H.C.; data curation, X.L. and W.H.; writing—original draft preparation, X.L.; writing—review and editing, X.Z. and X.L.; visualization, H.C. and X.L.; funding acquisition, X.Z. All authors have read and agreed to the published version of the manuscript.

Funding

This research was funded by the Philosophy and Social Science Planning Projects of Shanxi Province, China, grant number 2023YY158, and the North University of China Graduate Student Science and Technology Project Funding, grant number 20242044.

Institutional Review Board Statement

Not applicable.

Informed Consent Statement

Not applicable.

Data Availability Statement

The original contributions presented in this study are included in the article; further inquiries can be directed to the corresponding author.

Conflicts of Interest

The authors declare no conflicts of interest.

References

  1. Liu, M.G.; Fang, X.M.; Ren, J.R. Accelerating the modernization of agriculture and rural areas in China. China Agric. Econ. Rev. 2023, 15, 871–880. [Google Scholar] [CrossRef]
  2. Liu, Y.; Ma, X.Y.; Shu, L.; Hancke, G.P.; Abu-Mahfouz, A.M. From Industry 4.0 to Agriculture 4.0: Current Status, Enabling Technologies, and Research Challenges. IEEE Trans. Ind. Inform. 2021, 17, 4322–4334. [Google Scholar] [CrossRef]
  3. Wang, J.Y.; Peng, L.; Chen, J.C.; Deng, X.Z. Impact of rural industrial integration on farmers’ income: Evidence from agricultural counties in China. J. Asian Econ. 2024, 93, 101761. [Google Scholar]
  4. Yang, H.; Wang, X.; Bin, P. Agriculture carbon-emission reduction and changing factors behind agricultural eco-efficiency growth in China. J. Clean. Prod. 2022, 334, 130193. [Google Scholar]
  5. Hong, M.Y.; Zhang, W.J. Industrial structure upgrading, urbanization and urban-rural income disparity: Evidence from China. Appl. Econ. Lett. 2021, 28, 1321–1326. [Google Scholar]
  6. Yang, Y.J.; Chen, L.M.; Zhang, Y.D. Rural industrial convergence, urbanization development, and farmers’ income growth—Evidence from the Chinese experience. Front. Sustain. Food Syst. 2023, 7, 1237844. [Google Scholar]
  7. Huang, Z.; Wang, T.; Li, N. Reciprocal and Symbiotic: Family Farms’ Operational Performance and Long-Term Cooperation of Entities in the Agricultural Industrial Chain—From the Evidence of Xinjiang in China. Sustainability 2023, 15, 349. [Google Scholar]
  8. Hu, Y.; Yu, H.; Chen, Q. Digitalization Driving High-Quality Converged Development of Rural Primary, Secondary, and Tertiary Industries: Mechanisms, Effects, and Paths. Sustainability 2023, 15, 11708. [Google Scholar] [CrossRef]
  9. Al Abbasi, A.; Saha, S.; Begum, I.A.; Rola-Rubzen, M.F.; McKenzie, A.M.; Alam, M.J. Does rural transformation affect rural income inequality? Insights from cross-district panel data analysis in Bangladesh. Heliyon 2024, 10, 9. [Google Scholar]
  10. Peng, C.; Ma, B.; Zhang, C. Poverty alleviation through e-commerce: Village involvement and demonstration policies in rural China. J. Integr. Agric. 2021, 20, 998–1011. [Google Scholar]
  11. Ge, H.P.; Tang, L.Z.; Zhou, X.J.; Tang, D.C.; Boamah, V. Research on the Effect of Rural Inclusive Financial Ecological Environment on Rural Household Income in China. Int. J. Environ. Res. Public Health 2022, 19, 2486. [Google Scholar] [CrossRef] [PubMed]
  12. Li, G. The Heterogeneous Impact of Digital Technology Utilization on Rural Household Income: Evidence from China. J. Knowl. Econ. 2024, 1–25. [Google Scholar] [CrossRef]
  13. Wan, J.Y.; Zeng, L.J.; Zhou, W.L. An Exploration of Rural Revitalization and Industrial Development of Modern Agriculture in Theory and Practice: A Workshop Review. Chin. Rural Econ. 2018, 3, 138–144. (In Chinese) [Google Scholar]
  14. Cao, H.; Guo, Y.T.; Liu, J.J.; Tan, Z.X. Study on How to Construct Modern Agricultural Industrial System in China. J. Huazhong Agric. Univ. (Soc. Sci. Ed.) 2017, 2, 31–36. (In Chinese) [Google Scholar]
  15. Long, H.L.; Ma, L.; Zhang, Y.N.; Qu, L.L. Multifunctional rural development in China: Pattern, process and mechanism. Habitat Int. 2022, 121, 102530. [Google Scholar]
  16. Li, Y.; Dou, Y. Logical Mechanism, Main Characteristics, and Strategic Focus of Agricultural and Rural Modernization. Econ. Rev. J. 2024, 5, 87–94. (In Chinese) [Google Scholar]
  17. Mighell, R.L.; Jones, L.A. Vertical Coordination in Agriculture; US Department of Agriculture: Washington, DC, USA, 1963.
  18. Zhang, M.Y.; Zhang, X.P. On Choosing the Agent of the Agricultural Industry Chain from the Perspective of Dice Game Playing. J. Anhui Agric. Sci. 2009, 1, 397–399. (In Chinese) [Google Scholar]
  19. Wang, Z.; Wei, S.; Zhu, K. Quantifying International Production Sharing at the Bilateral and Sector Levels. In ERN: International Trade (Topic); National Bureau of Economic Research: Cambridge, MA, USA, 2013. [Google Scholar]
  20. Koopman, R.; Wang, Z.; Powers, W.; Wei, S. Give Credit Where Credit Is Due: Tracing Value Added in Global Production Chains. In NBER Working Papers; National Bureau of Economic Research: Cambridge, MA, USA, 2010. [Google Scholar]
  21. Zhou, J.; Chen, H.P.; Bai, Q.Y.; Liu, L.X.; Li, G.H.; Shen, Q.L. Can the Integration of Rural Industries Help Strengthen China’s Agricultural Economic Resilience? Agriculture 2023, 13, 1813. [Google Scholar] [CrossRef]
  22. Su, Y.Q.; You, Y.T.; Wang, Z.G. Convergence Development of Primary, Secondary and Tertiary Industries: Theoretical Discussion, Situation Analysis and Suggestions. China Soft Sci. 2016, 8, 17–28. (In Chinese) [Google Scholar]
  23. Tang, L.Q.; Liu, Q.; Yang, W.J.; Wang, J.Y. Do agricultural services contribute to cost saving? Evidence from Chinese rice farmers. China Agric. Econ. Rev. 2018, 10, 323–337. [Google Scholar]
  24. Kenneth, A.R. Rural Non-farm Development: A Trade-Theoretic View. J. Int. Trade Econ. Dev. 1998, 7, 425–437. [Google Scholar]
  25. Yan, B.; Zhai, Y.; Zhou, Y. Impact and Spatial Effect of Agribusiness Development on Farmer Income at the Provincial Level. Econ. Geogr. 2022, 42, 162–171. (In Chinese) [Google Scholar]
  26. Ying, S.S.; He, T.T.; Wu, C.Y. Intelligent Evaluation Model Based on Index System of Agricultural Industrial Chain. IEEE Access 2023, 10, 133720–133732. [Google Scholar] [CrossRef]
  27. Guo, J.; Zhang, X.; Kong, X. The Convergence of Primary, Secondary and Tertiary Industries and Farmers’ Income Generation: One Case Study of Convergence of Primary, Secondary and Tertiary Industries in Rural Areas of Henan Province. Issues Agric. Econ. 2012, 3, 135–144. (In Chinese) [Google Scholar]
  28. Jiang, Z.L. Re-exploration of the Integration and Development of Primary, Secondary and Tertiary Industries in Rural Areas. Issues Agric. Econ. 2021, 6, 8–18. (In Chinese) [Google Scholar]
  29. Zhang, L.; Wen, T.; Liu, Y.B. Rural Industrial Convergence Development and Farmers’ Income Increase: Theoretical Mechanism and Empirical Determination. J. Southwest Univ. (Soc. Sci. Ed.) 2020, 46, 42–56+191–192. (In Chinese) [Google Scholar]
  30. Wang, G.Y.; Bai, L.X. Research on the Impact of the Integration of Primary, Secondary and Tertiary Industries on Farmer’s Income in Rural China—Based on Perspective of Mediating Effect. Agric. Econ. Manag. 2023, 4, 48–64. (In Chinese) [Google Scholar]
  31. Ye, J.Z. Land Transfer and the Pursuit of Agricultural Modernization in China. J. Agrar. Change 2015, 13, 314–337. [Google Scholar] [CrossRef]
  32. Ji, M.; Ying, J.; Shao, X.; Tian, Y. An Empirical Examination of Aging’s Ramifications on Large-scale Agriculture: China’s Perspective. Economics 2024, 18, 20220094. [Google Scholar] [CrossRef]
  33. Guo, Y.; Wang, J. Practices for rural population aging in China: Land-based pension. Habitat Int. 2024, 151, 103136. [Google Scholar] [CrossRef]
  34. Guo, Y.; Liu, Y. Poverty alleviation through land assetization and its implications for rural revitalization in China. Land Use Policy 2021, 105, 105418. [Google Scholar]
  35. Qian, L.; Lu, H.; Gao, Q.; Lu, H. Household-owned farm machinery vs. outsourced machinery services: The impact of agricultural mechanization on the land leasing behavior of relatively large-scale farmers in China. Land Use Policy 2022, 115, 106008. [Google Scholar]
  36. Engas, K.G.; Raja, J.Z.; Neufang, I.F. Decoding technological frames: An exploratory study of access to and meaningful engagement with digital technologies in agriculture. Technol. Forecast. Soc. Change 2023, 190, 122405. [Google Scholar]
  37. Zheng, Y.; Zhu, T.; Jia, W. Does Internet use promote the adoption of agricultural technology? Evidence from 1 449 farm households in 14 Chinese provinces. J. Integr. Agric. 2022, 21, 282–292. [Google Scholar]
  38. Lian, X.; Mu, Y.; Zhang, W. Digital inclusive financial services and rural income: Evidence from China’s major grain-producing regions. Financ. Res. Lett. 2023, 53, 103622. [Google Scholar]
  39. Ai, J.; Hu, L.; Xia, S.H.; Xiang, H.L.; Chen, Z.J. Analysis of Factors Influencing the Adoption Behavior of Agricultural Productive Services Based on Logistic-ISM Model: A Case Study of Rice Farmers in Jiangxi Province, China. Agriculture 2023, 13, 162. [Google Scholar] [CrossRef]
  40. Zhang, C.Y.; Chang, Q.; Huo, X.X. How Productive Services Affect Apple Production Technical Efficiency: Promote or Inhibit? Sustainability 2019, 11, 5411. [Google Scholar] [CrossRef]
  41. Chen, T.; Rizwan, M.; Abbas, A. Exploring the Role of Agricultural Services in Production Efficiency in Chinese Agriculture: A Case of the Socialized Agricultural Service System. Land 2022, 11, 347. [Google Scholar] [CrossRef]
  42. Pan, J.T.; Zhi, R.T.; Wu, P.; Chen, C.B.; Zhang, Y.Q. Enrichment Effect of Agricultural Productive Services: Mechanism and Spatial Spillover: Based on Panel Data for 30 Provinces. J. China Agric. Univ. 2025, 30, 244–256. (In Chinese) [Google Scholar]
  43. Du, Y.; Kim, P.H. One size does not fit all: Strategy configurations, complex environments, and new venture performance in emerging economies. J. Bus. Res. 2021, 124, 272–285. [Google Scholar]
  44. Schneider, C.Q.; Claudius, W. Set-Theoretic Methods for the Social Sciences: A Guide to Qualitative Comparative Analysis; Cambridge University Press: Cambridge, UK, 2012. [Google Scholar]
  45. Peng, X.J.; Lu, H.Y.; Fu, J.M.; Li, Z.J. Does Financial Development Promote the Growth of Property Income of China’s Urban and Rural Residents? Sustainability 2021, 13, 2849. [Google Scholar] [CrossRef]
  46. Ragin, C.C. Resesigning Social Inquiry: Fuzzy Sets and Beyond; University of Chicago Press: Chicago, IL, USA, 2008. [Google Scholar]
  47. Park, Y.K.; Mithas, S. Organized Complexity of Digital Business Strategy: A Configurational Perspective. MIS Q. 2020, 44, 85–127. [Google Scholar]
Figure 1. Spatial distribution of the 88 main production areas of special agricultural products in Shanxi Province, China. (a) small grains, (b) dried and fresh fruits, (c) vegetables, (d) Chinese herbs, (e) livestock and poultry.
Sustainability 17 02799 g001
Figure 2. Theoretical framework.
Sustainability 17 02799 g002
Figure 3. Histogram of per capita disposable income and structure of farmers in sample production areas in Shanxi Province, 2022.
Sustainability 17 02799 g003
Figure 4. Histogram of length, width and depth measurements of special agricultural industrial systems in the sample production areas of Shanxi Province.
Sustainability 17 02799 g004
Table 1. Farmers’ per capital disposable income and its structure in sample production areas of Shanxi Province in 2022.
CountyPer Capita Disposable Income of FarmersWage IncomeOperational IncomeProperty IncomeTransfer Income
Xing Hualing District25,96014,18249957915992
Jinyuan District25,96014,18249957915992
Qingxu County25,66414,02049387825924
Yangqu County13,838756026624213194
Loufan County11,680638122473562696
Yunzhou District14,269597442372523806
Yanggao County12,734533137812253397
Tianzhen County11,724490834822073127
Guangling County11,909498635362103177
Lingqiu County11,514482034192033071
Hunyuan County11,758492234922083136
Zuoyun County17,735742552673134731
Pingding County18,31610,41133212544331
Yu County18,97410,78534402634486
Luzhou District25,24110,44690823705342
Shangdang District24,39210,09487773585163
Tunliu County22,671938281583324798
Pingshun County10,863449639091592299
Huguan County10,486434037731542219
Zhangzi County20,302840273052984297
Qin County10,081417236271482134
Qinyuan County20,668855374373034374
Qinshui County17,35310,58226774553639
Lingchuan County13,715836421163592876
Zezhou County21,02412,82132445514409
Shuocheng District20,401813470101475112
Pinglu District14,392573849451043607
Shanyin County22,685904577951635685
Ying County15,164604652101093800
Youyu County12,23748794205883067
Yuci District24,41413,12866628913730
Taigu District25,32113,61669109243869
Yushe County9018484924613291378
Zuoquan County9656519226353521475
Heshun County11,111597530324061698
Shouyang County14,516780639615302218
Qi County18,543997150606772833
Pingyao County23,40712,58763878543577
Lingshi County16,482886344986022518
Yanhu District17,517792055106723415
Linyi County18,346829557707043576
Wanrong County14,441653045425542815
Wenxi County14,619661045985612850
Jishan County15,756712449566053071
Xinjiang County16,851761953006473285
Jiang County13,622615942855232655
Yuanqu County11,807533937144532302
Xia County11,770532237024522294
Pinglu County12,023543637824612344
Ruicheng County15,540702648885963029
Yongji City18,599841058507143626
Hejin City18,934856159557273691
Xinfu District14,521602446927113095
Dingxiang County18,078749958418853853
Wutai County9954412932164872121
Dai County8849367128594331886
Fanshi County12,732528241146232714
Ningwu County9212382129774511963
Jingle County10,554437834105172249
Shenchi County11,775488538055762510
Wuzhai County11,499477037165632451
Pianguan County10,590439334225182257
Yuanping City15,104626648807393219
Yaodu District19,984837772692044135
Quwo County20,490858974532094240
Yicheng County15,732659557221613256
Xiangfen County18,144760665991863755
Hongtong County16,519692560081693418
Gu County15,234638655411563152
Anze County14,558610352951493013
Fushan County13,228554548111352737
Ji County937639303410961940
Xiangning County14,870623454091523077
Daning County779032662833801612
Xi County10,901457039651112256
Pu County13,637571749601392822
Houma City20,046840372912054148
Huozhou City19,041798269261953940
Wenshui County14,045785226552663273
Jiaocheng County14,027784126512663269
Lin County8679485216401642022
Liulin County16,340913430883093808
Lan County8035449215191521872
Fangshan County7330409813851391708
Zhongyang County10,484586119821982443
Jiaokou County11,065618620912092578
Xiaoyi City22,48812,57142504265240
Fenyang City18,74710,48035433554368
Mean15,450.697254.914531.45385.703278.75
Maximum259601418290829245992
Minimum733032661385801378
Table 2. Measurement table of length, width, and depth of the special agricultural industrial system in sample production areas of Shanxi Province.
CountyIndustry Average LengthIndustry Average WidthIndustry Average Depth
Xing Hualing District100
Jinyuan District101.5
Qingxu County1.51.53.5
Yangqu County313
Loufan County314
Yunzhou District326
Yanggao County20.53
Tianzhen County21.334.67
Guangling County204
Lingqiu County101.5
Hunyuan County2.332.332.33
Zuoyun County2.50.50
Pingding County202
Yu County333
Luzhou District110
Shangdang District20.52.5
Tunliu County100
Pingshun County2.51.55
Huguan County2.50.54
Zhangzi County2.3313.67
Qin County342
Qinyuan County304
Qinshui County10.52.5
Lingchuan County20.52.5
Zezhou County233
Shuocheng District2.505
Pinglu District324
Shanyin County207
Ying County2.513.5
Youyu County2.670.673.67
Yuci District1.40.41
Taigu District1.170.332.33
Yushe County2.524
Zuoquan County2.250.754.25
Heshun County20.832
Shouyang County21.333
Qi County225
Pingyao County2.7526.25
Lingshi County20.23.2
Yanhu District202
Linyi County2.51.53.75
Wanrong County2.42.64
Wenxi County1.670.834.67
Jishan County101.67
Xinjiang County20.52.75
Jiang County2.3324
Yuanqu County2.42.23.8
Xia County2.131.253.88
Pinglu County2.671.673.67
Ruicheng County2.171.173.67
Yongji City212
Hejin City21.54
Xinfu District20.52
Dingxiang County20.52.25
Wutai County2.522.5
Dai County1.40.62
Fanshi County2.51.674.33
Ningwu County210
Jingle County2.3312.33
Shenchi County313
Wuzhai County1.50.53
Pianguan County300
Yuanping City210.5
Yaodu District202.5
Quwo County21.63
Yicheng County20.672.33
Xiangfen County2.330.53
Hongtong County303
Gu County246
Anze County124
Fushan County31.54.5
Ji County2.21.23.6
Xiangning County323
Daning County103
Xi County315
Pu County102
Houma City1.50.51.5
Huozhou City314
Wenshui County102
Jiaocheng County1.50.50.5
Lin County2.671.334.33
Liulin County1.860.433.57
Lan County1.330.332.33
Fangshan County1.506
Zhongyang County30.55.5
Jiaokou County305
Xiaoyi City2.503
Fenyang City20.253
Mean2.120.963.11
Maximum347
Minimum100
Table 3. Variable calibration and descriptive statistics.
CollectionFuzzy Value Membership ScoreDescriptive Statistics
0.950.50.1MeanMinimumMaximumStandard Deviation
Industry Length3212.12130.63
Industry Width2.820.6700.93040.89
Industry Depth6.413.5003.40071.60
Farmers’ Wage Income13,396.4065303997.207254.91326614,1822691.04
Farmers’ Operating Income7641.1042372025.604531.46138590821716.52
Farmers’ Property Income825.65332106385.7080924229.37
Farmers’ Transfer Income5530.65313617023278.75137859921077.28
Table 4. Analysis of necessary conditions.
Conditional VariableWage Income~Wage Income
ConsistencyCoverageConsistencyCoverage
Industry length0.6596670.5490160.7597170.710727
~Industry length *0.6524260.7072210.5179300.631083
Industry width0.5445330.5686920.6283010.737585
~Industry width *0.7487330.6418380.6325960.609559
Industry depth0.6512190.5869040.7195620.728954
~Industry depth *0.6992520.6892700.5922270.656198
Conditional VariableOperational Income~Operational Income
ConsistencyCoverageConsistencyCoverage
Industry length0.6903460.6090800.7218690.639212
~Industry length *0.5910750.6792260.5585300.644165
Industry width0.5701270.6312070.5871140.652382
~Industry width *0.6860200.6234220.6681040.609352
Industry depth0.6785060.6482490.6982760.669567
~Industry depth *0.6541440.6835600.6331670.664050
Conditional VariableProperty Income~Property Income
ConsistencyCoverageConsistencyCoverage
Industry length0.6585770.5560470.7235150.668140
~Industry length *0.6069470.6674520.5192520.624542
Industry width0.5998090.6354930.5455730.632216
~Industry width *0.6528670.5677630.6854470.651976
Industry depth0.6183680.5653690.7122040.712203
~Industry depth *0.6852250.6852250.5653690.618368
Conditional VariableTransfer Income~Transfer Income
ConsistencyCoverageConsistencyCoverage
Industry length0.6835830.5871830.7539790.685215
~Industry length *0.6335360.7087910.5457560.645997
Industry width0.5334420.5749940.6341730.723217
~Industry width *0.7432180.6575630.6273210.587213
Industry depth0.6536480.6080050.7334220.721775
~Industry depth *0.7008890.7130620.6016800.647633
* “~” represents a logical “NOT” denotation, meaning that the opposite situation is true; the same applies below.
Table 5. The configuration to achieve high wage incomes.
Conditional ConfigurationS1aS2a
Industry lengthSustainability 17 02799 i001Sustainability 17 02799 i003
Industry widthSustainability 17 02799 i003Sustainability 17 02799 i001
Industry depthSustainability 17 02799 i001
Consistency0.800640.799248
Original coverage rate0.3625390.410331
Unique coverage rate0.1238230.171615
Consistency of the overall solution0.780875
Coverage rate of the overall solution0.534154
Note: Sustainability 17 02799 i003 indicates the presence of a core condition; Sustainability 17 02799 i004 indicates the presence of a marginal condition; Sustainability 17 02799 i001 indicates the absence of a core condition; Sustainability 17 02799 i002 indicates the absence of a marginal condition; — indicates that the presence or absence of the condition is irrelevant.
Table 6. The configuration to achieve high operating incomes.
Conditional ConfigurationS1bS2bS3b
Industry lengthSustainability 17 02799 i001Sustainability 17 02799 i001Sustainability 17 02799 i003
Industry widthSustainability 17 02799 i003Sustainability 17 02799 i001
Industry depthSustainability 17 02799 i003Sustainability 17 02799 i001
Consistency0.8384870.7762870.80536
Original coverage rate0.3581510.408470.390027
Unique coverage rate0.01821490.03802370.104508
Consistency of the overall solution0.746687
Coverage rate of the overall solution0.551685
Note: Sustainability 17 02799 i003 indicates the presence of a core condition; Sustainability 17 02799 i004 indicates the presence of a marginal condition; Sustainability 17 02799 i001 indicates the absence of a core condition; Sustainability 17 02799 i002 indicates the absence of a marginal condition; — indicates that the presence or absence of the condition is irrelevant.
Table 7. The configuration to achieve high property incomes.
Conditional ConfigurationS1cS2c
Industry lengthSustainability 17 02799 i003Sustainability 17 02799 i001
Industry widthSustainability 17 02799 i003
Industry depthSustainability 17 02799 i001
Consistency0.7492570.820896
Original coverage rate0.4798950.366405
Unique coverage rate0.1877230.0742326
Consistency of the overall solution0.733312
Coverage rate of the overall solution0.554128
Note: Sustainability 17 02799 i003 indicates the presence of a core condition; Sustainability 17 02799 i004 indicates the presence of a marginal condition; Sustainability 17 02799 i001 indicates the absence of a core condition; Sustainability 17 02799 i002 indicates the absence of a marginal condition; — indicates that the presence or absence of the condition is irrelevant.
Table 8. The configuration to achieve high transfer incomes.
Conditional ConfigurationS1dS2dS3d
Industry lengthSustainability 17 02799 i001Sustainability 17 02799 i001Sustainability 17 02799 i003
Industry widthSustainability 17 02799 i003Sustainability 17 02799 i001
Industry depthSustainability 17 02799 i003Sustainability 17 02799 i001
Consistency0.7937110.7741240.819934
Original coverage rate0.3482230.4183820.407858
Unique coverage rate0.02245090.05028070.11927
Consistency of the overall solution0.765794
Coverage rate of the overall solution0.581151
Note: Sustainability 17 02799 i003 indicates the presence of a core condition; Sustainability 17 02799 i004 indicates the presence of a marginal condition; Sustainability 17 02799 i001 indicates the absence of a core condition; Sustainability 17 02799 i002 indicates the absence of a marginal condition;— indicates that the presence or absence of the condition is irrelevant.
Table 9. The configuration path of the modern agricultural industrial system to promote farmers’ income increase.
Farmer’s IncomeIndustrial Development Path
Wage income1. Non-Industry Length * Industry Width
2. Industry Length * Non-Industry Width * Non-Industry Depth
Operational income1. Non-Industry Length * Industry Width
2. Industry Length * Non-Industry Width * Non-Industry Depth”
3. Non-Industry Length * Industry Depth
Property income1. Non-Industry Length * Industry Width
4. Industry Length * Non-Industry Depth
Transfer income1. Non-Industry Length * Industry Width
2. Industry Length * Non-Industry Width * Non-Industry Depth
3. Non-Industry Length * Industry Depth
Disclaimer/Publisher’s Note: The statements, opinions and data contained in all publications are solely those of the individual author(s) and contributor(s) and not of MDPI and/or the editor(s). MDPI and/or the editor(s) disclaim responsibility for any injury to people or property resulting from any ideas, methods, instructions or products referred to in the content.

