
The Spatial Distribution of Trace Elements and Rare-Earth Elements in the Stream Sediments Around the Ikuno Mine Area in Hyogo Prefecture, Southwest Japan

 and
and 
Abstract
1. Introduction
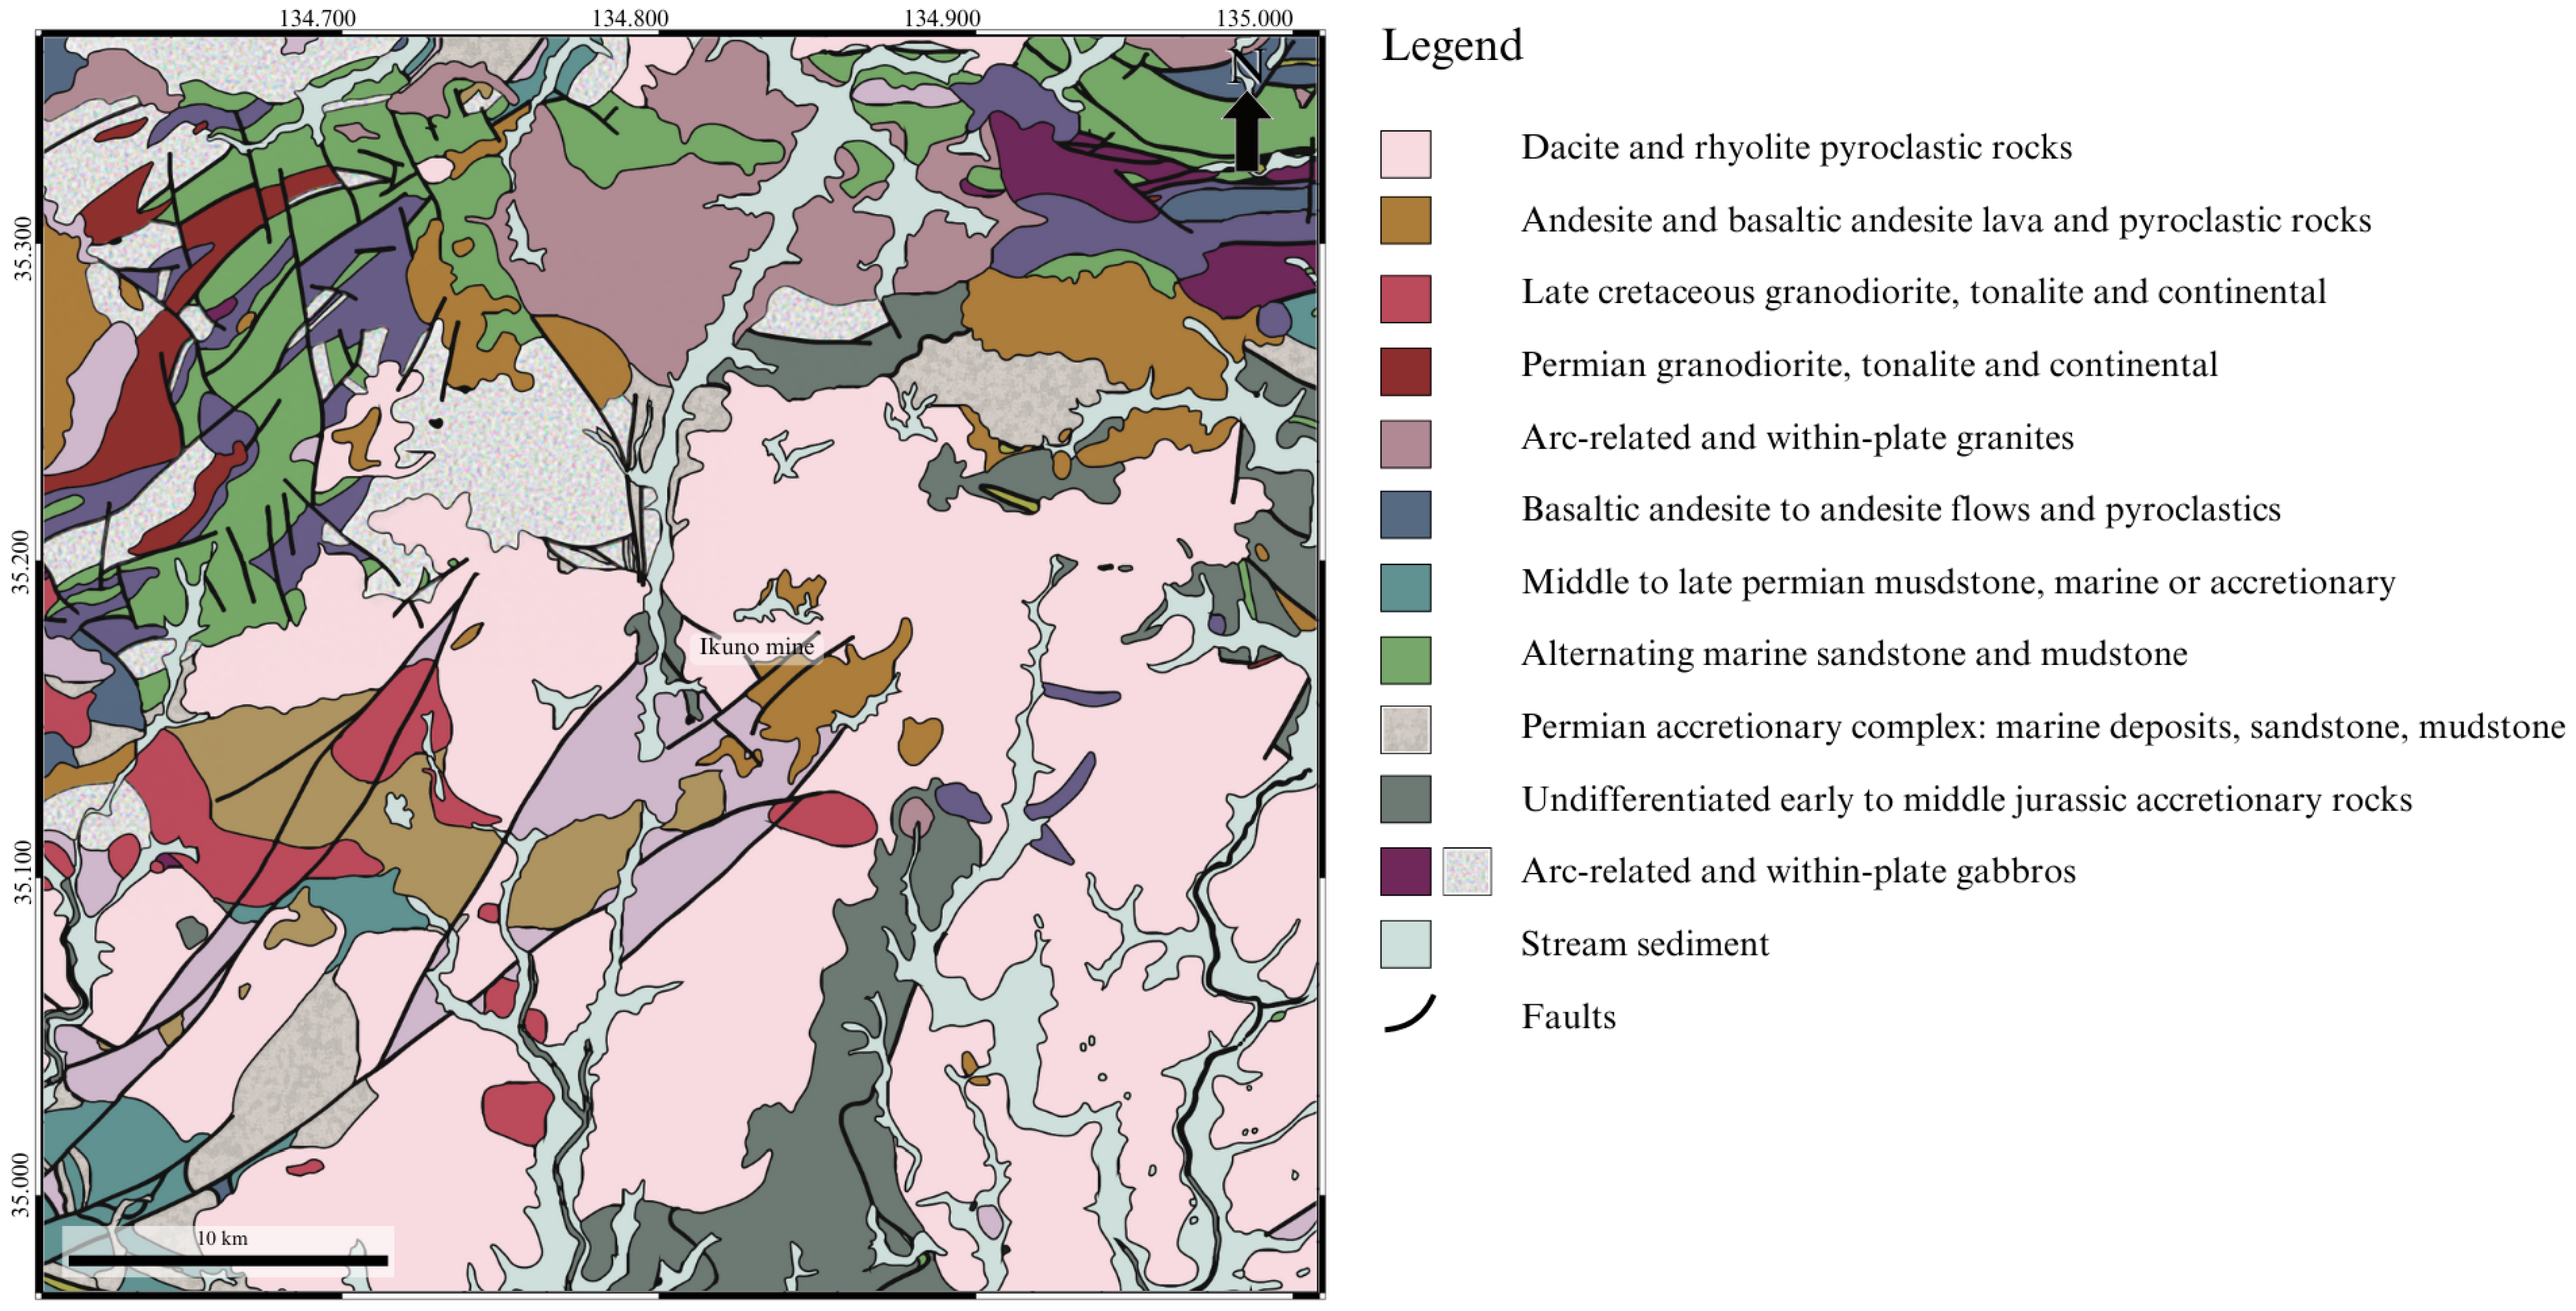
2. Study Area
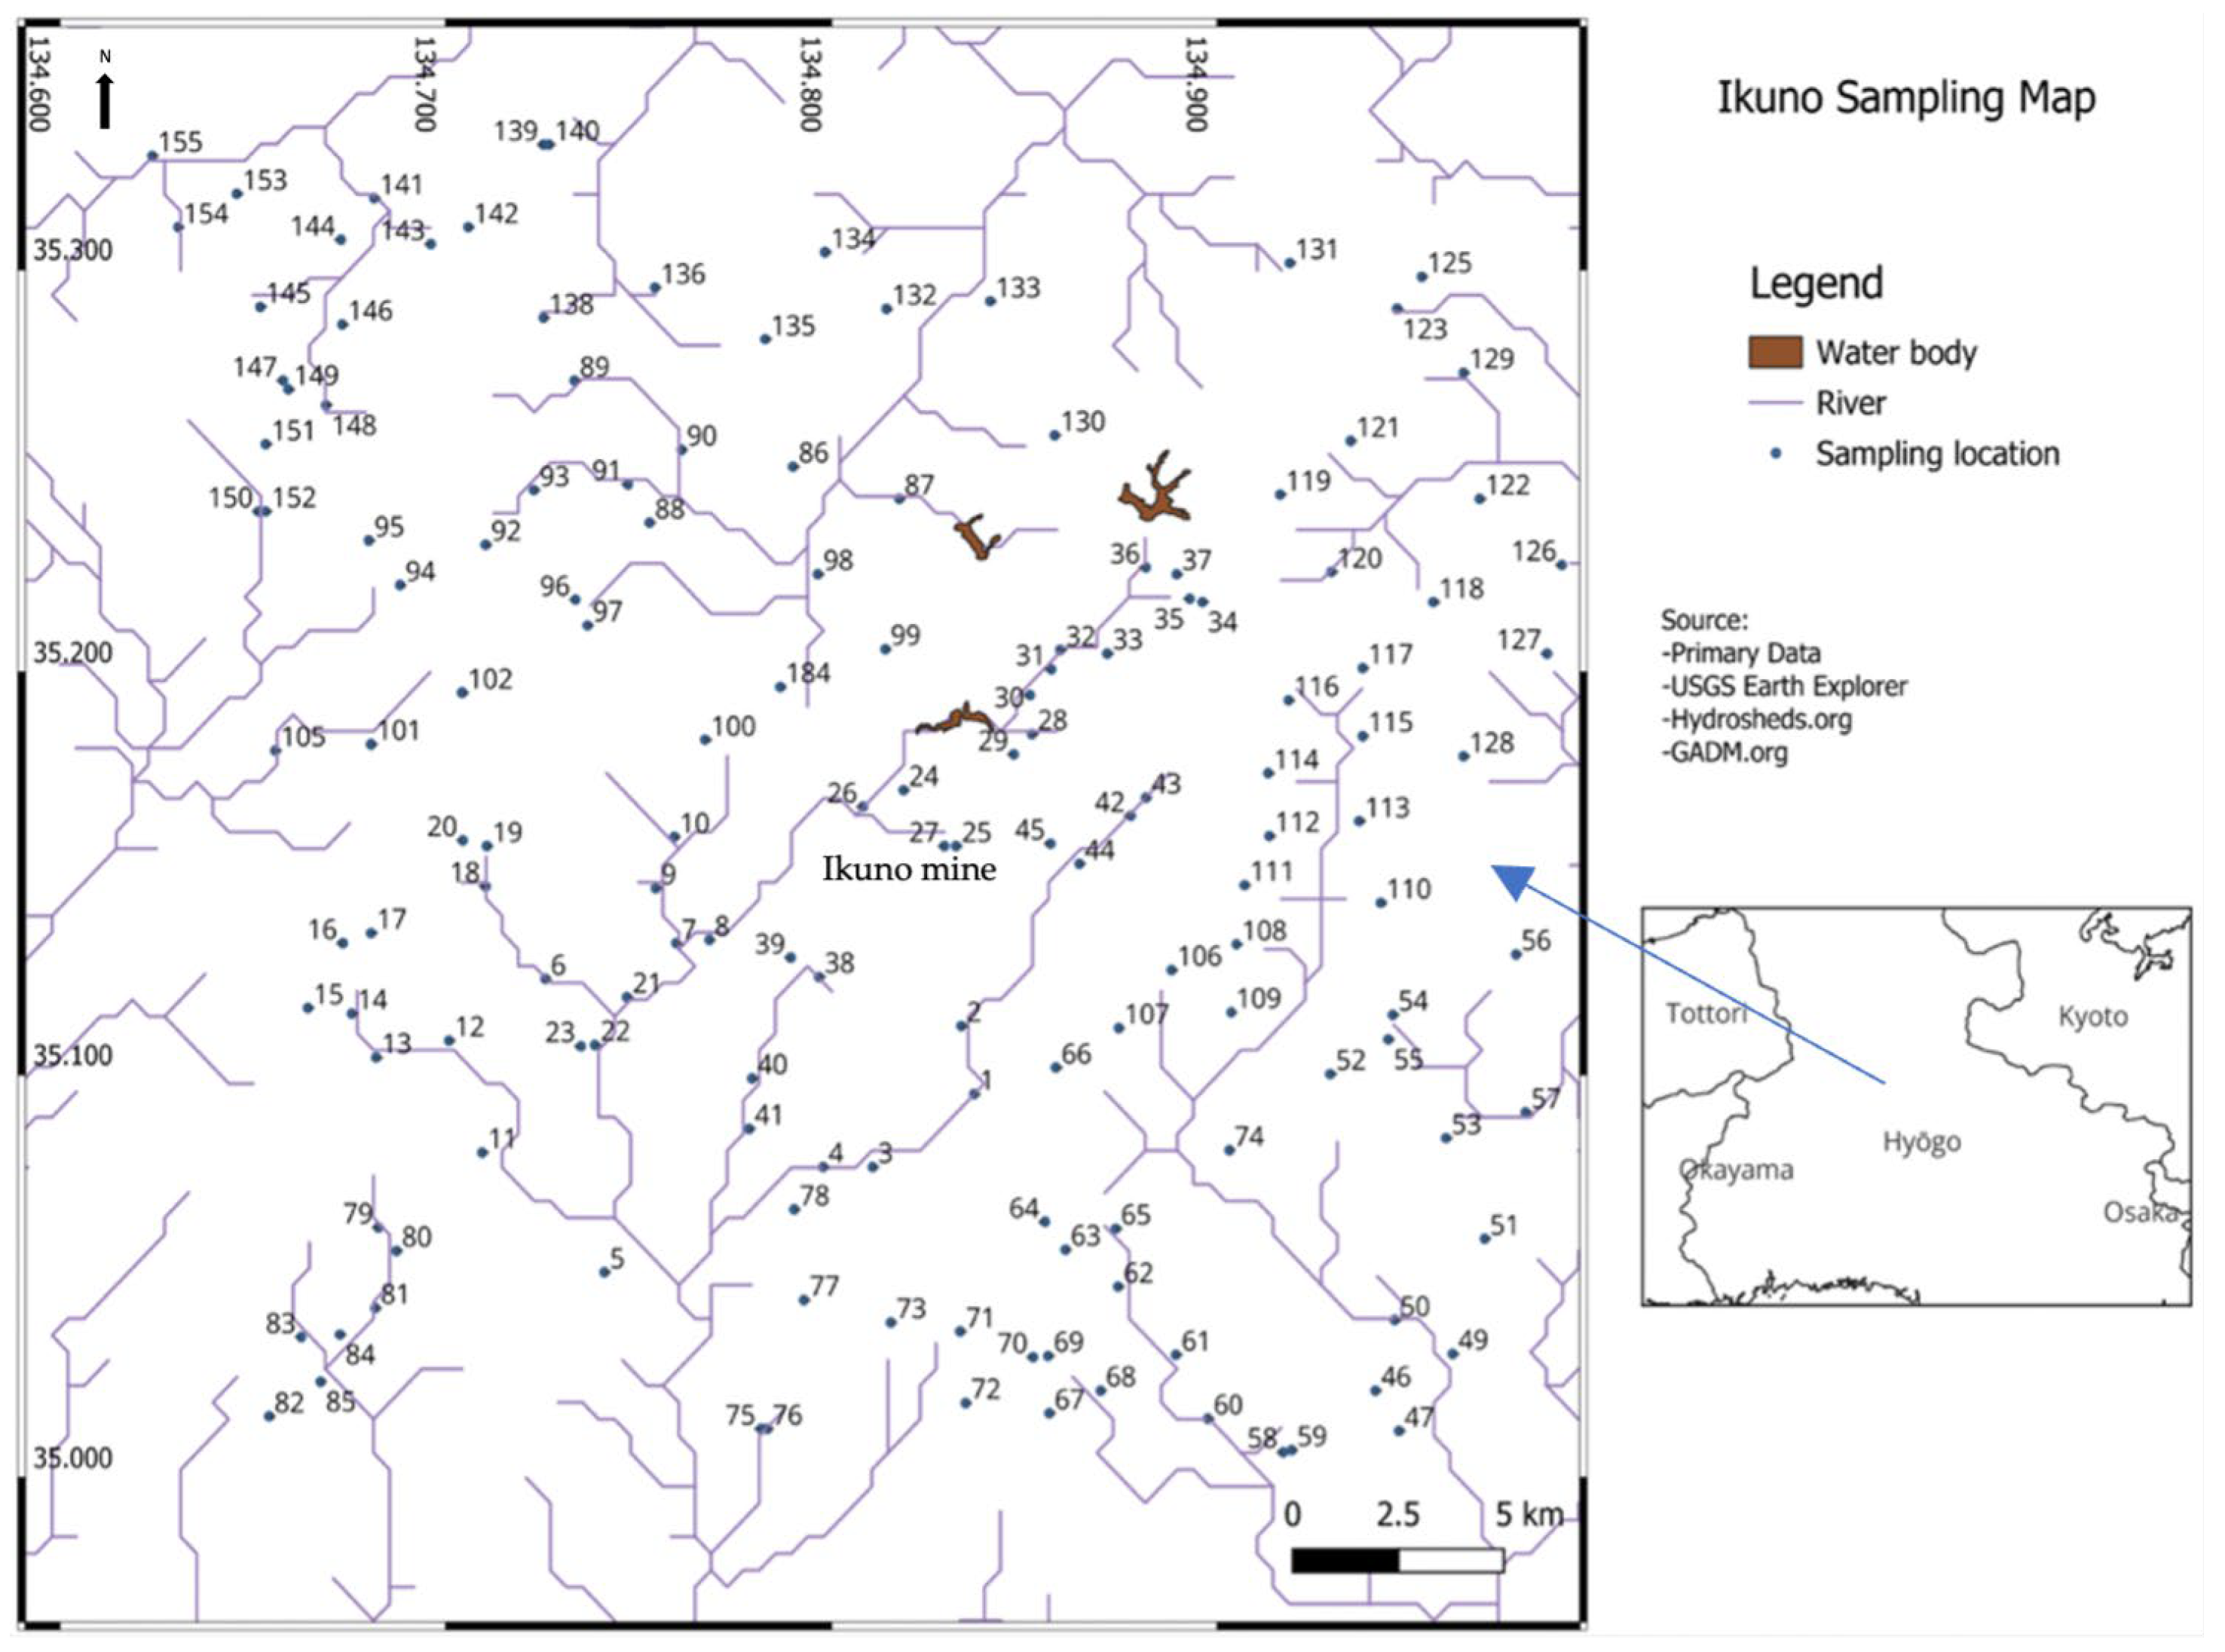
3. Materials and Methods
4. Results
4.1. Geochemical Maps
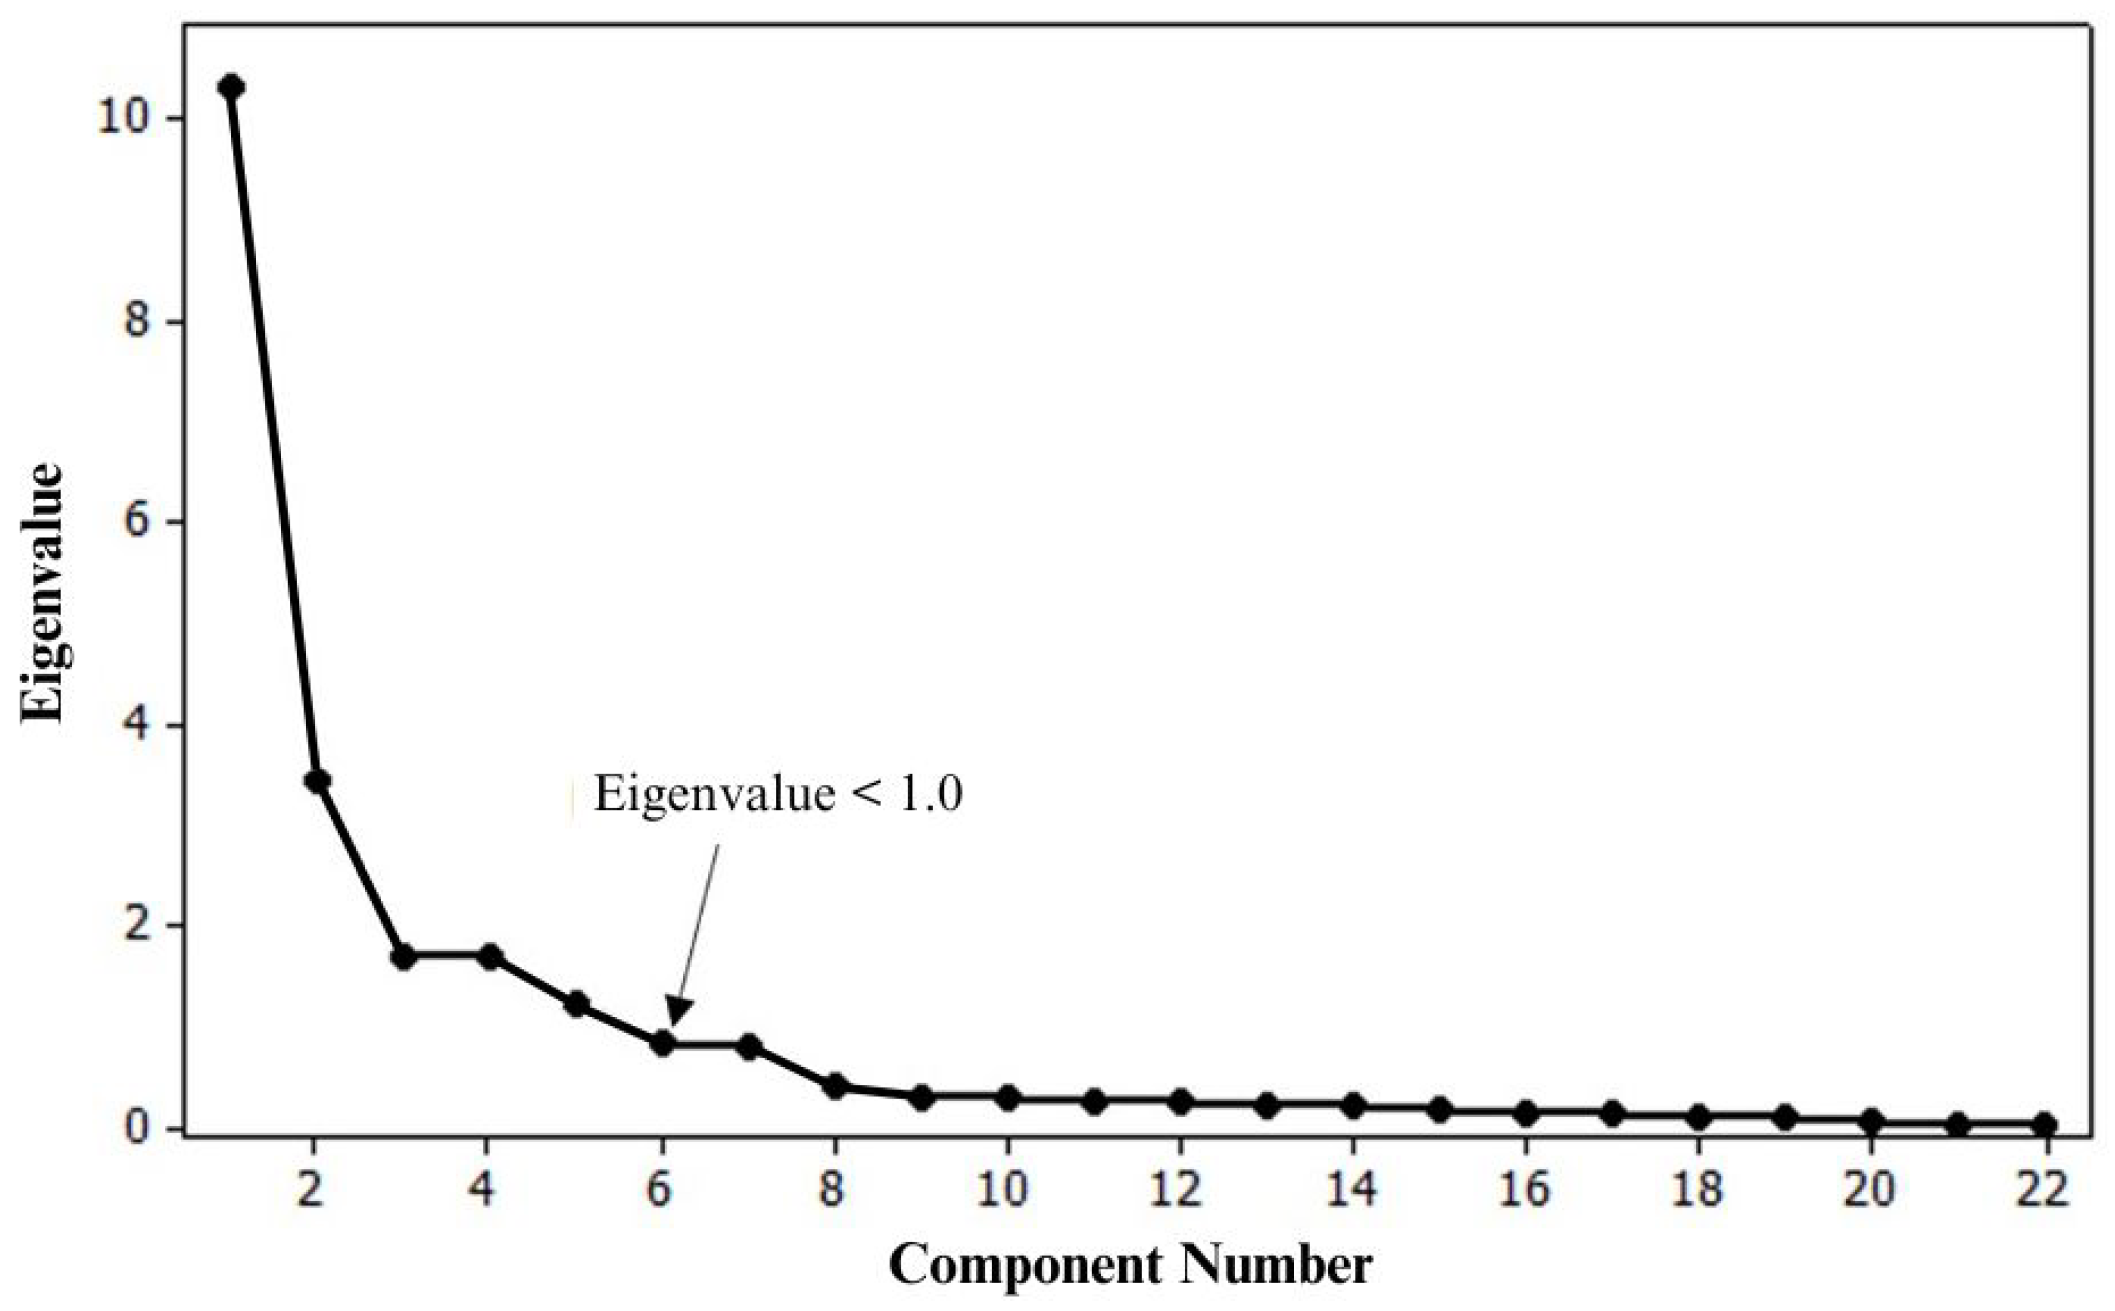
4.2. Factor Analysis of Elemental Concentrations in the Stream Sediments
4.3. The Spatial Distribution Patterns of the Elemental Concentrations in the Stream Sediments
5. Discussion
5.1. The Influence of Lithology on the Stream Sediments
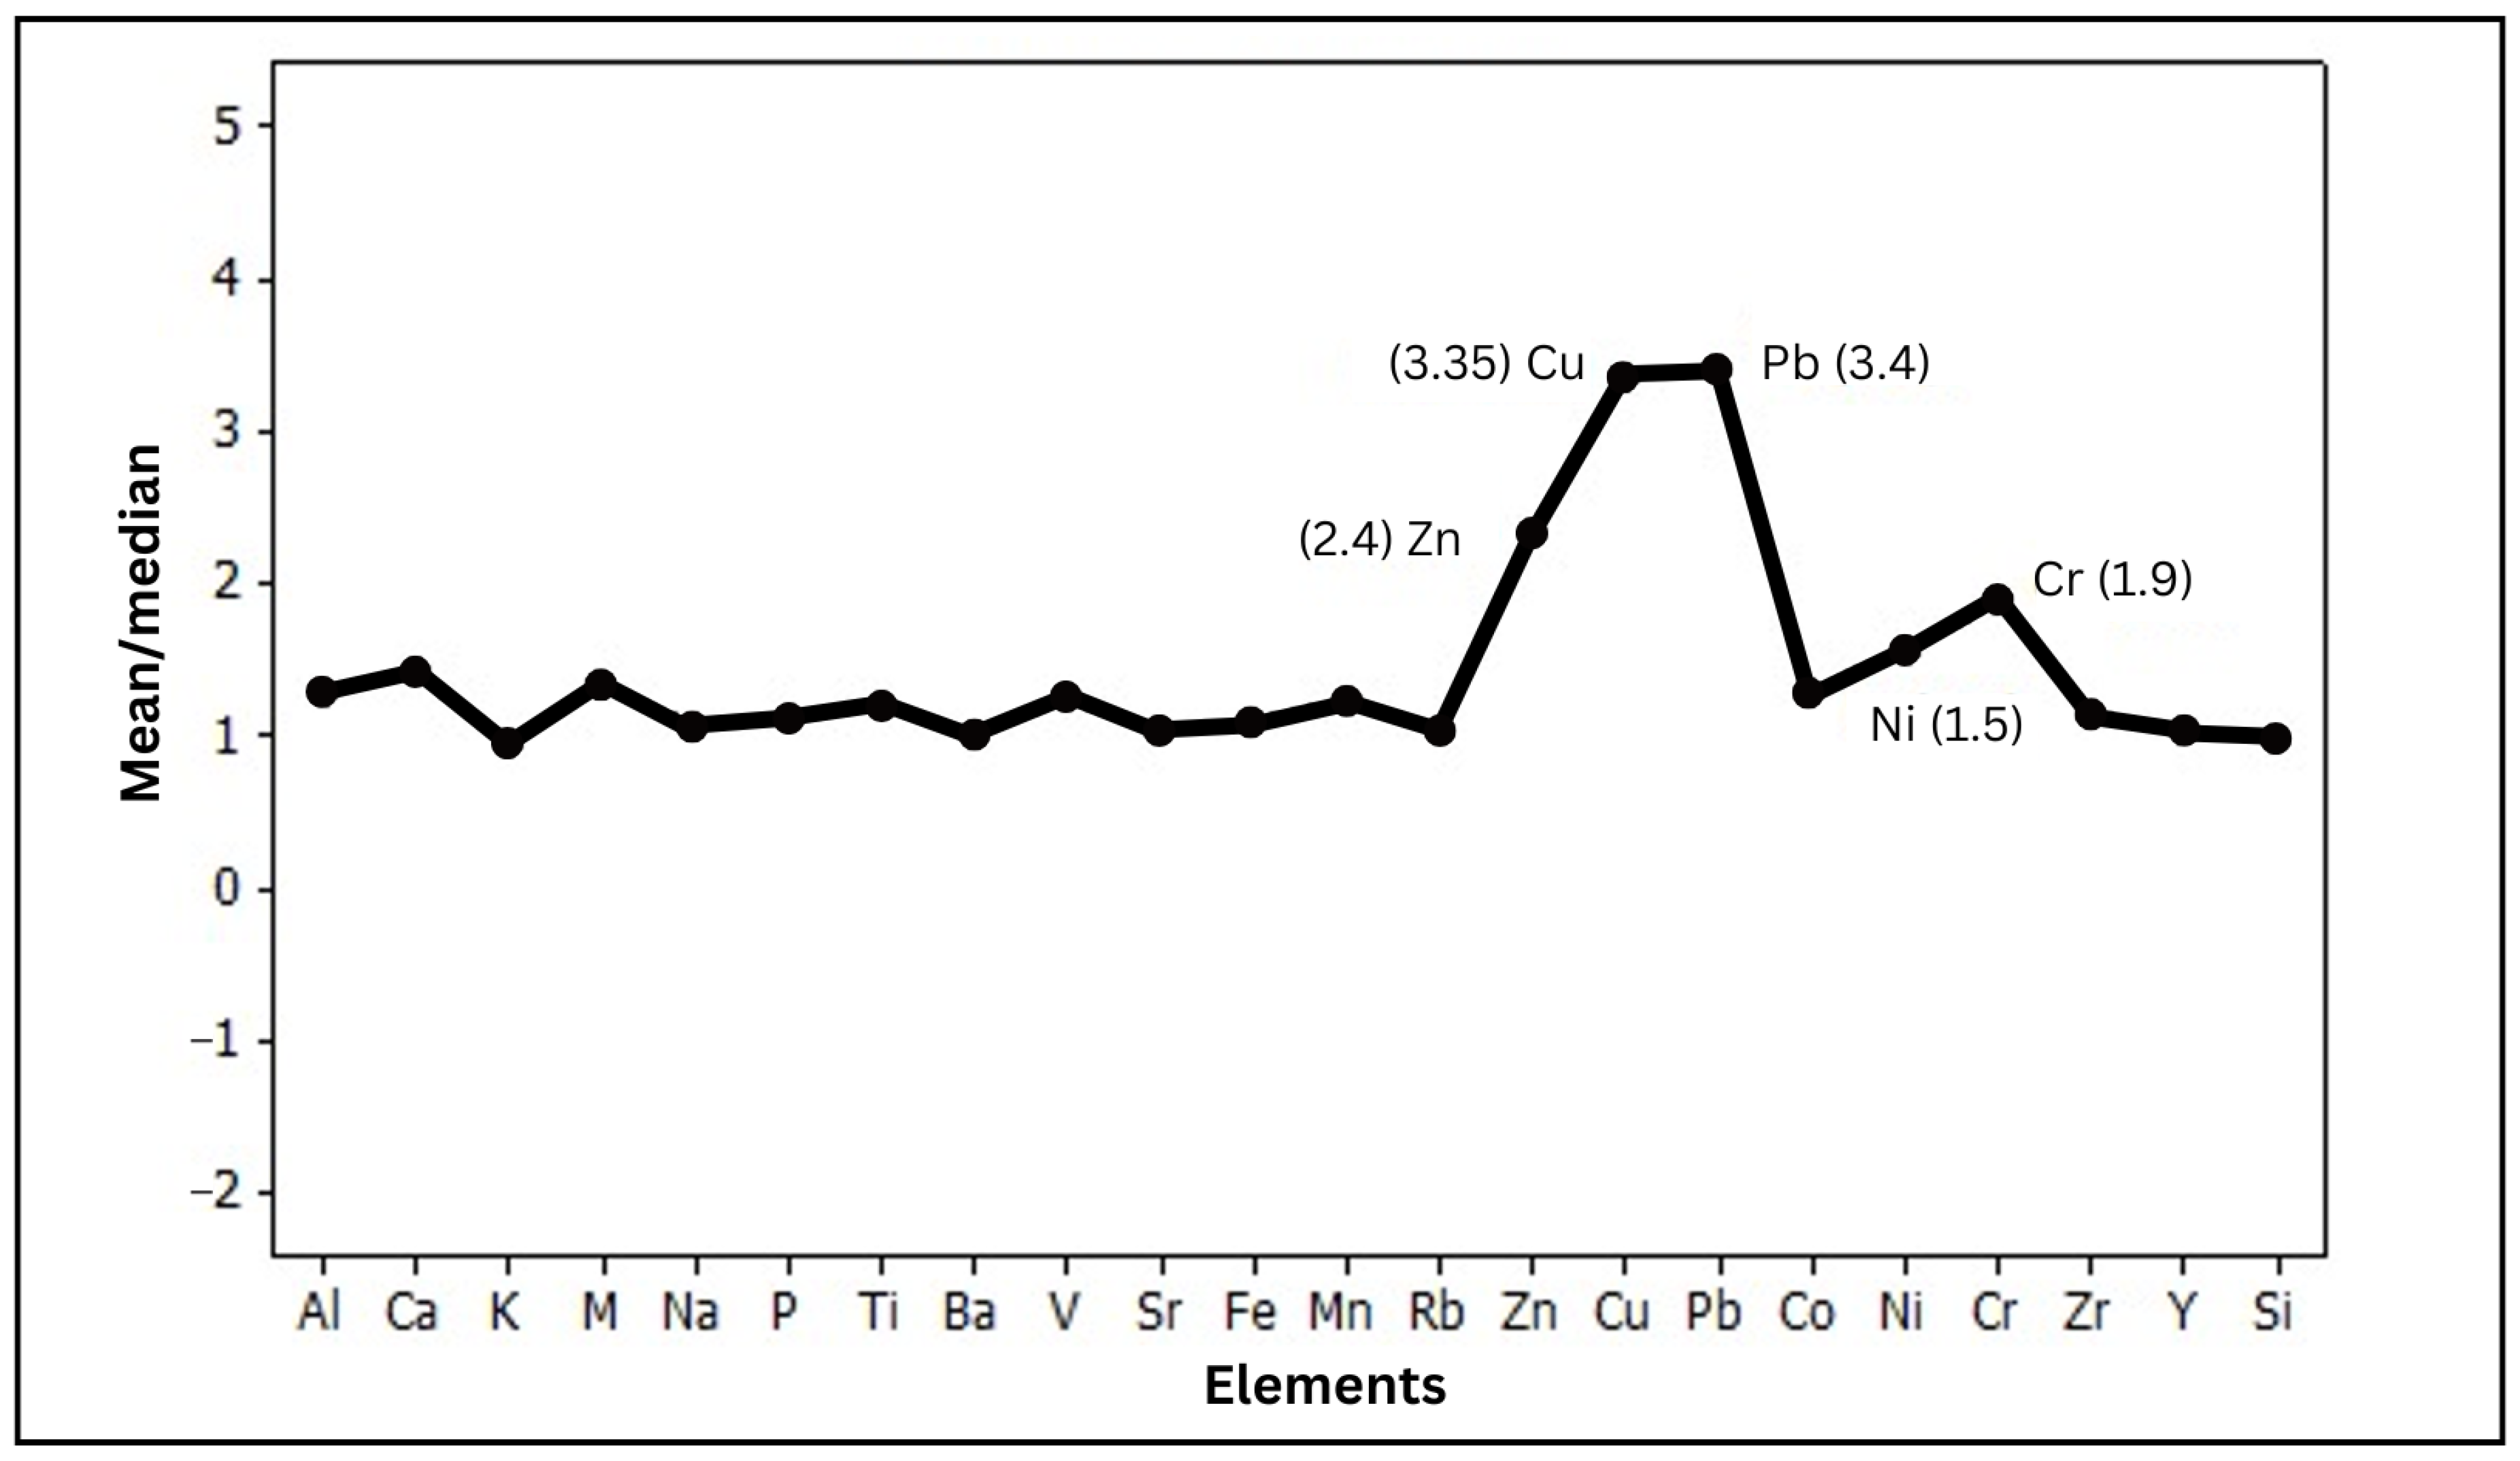
5.2. The Influence of Mineral Deposits on the Spatial Distribution Patterns of the Elements
5.3. The Influence of Heavy Mineral Sedimentation in the Basin
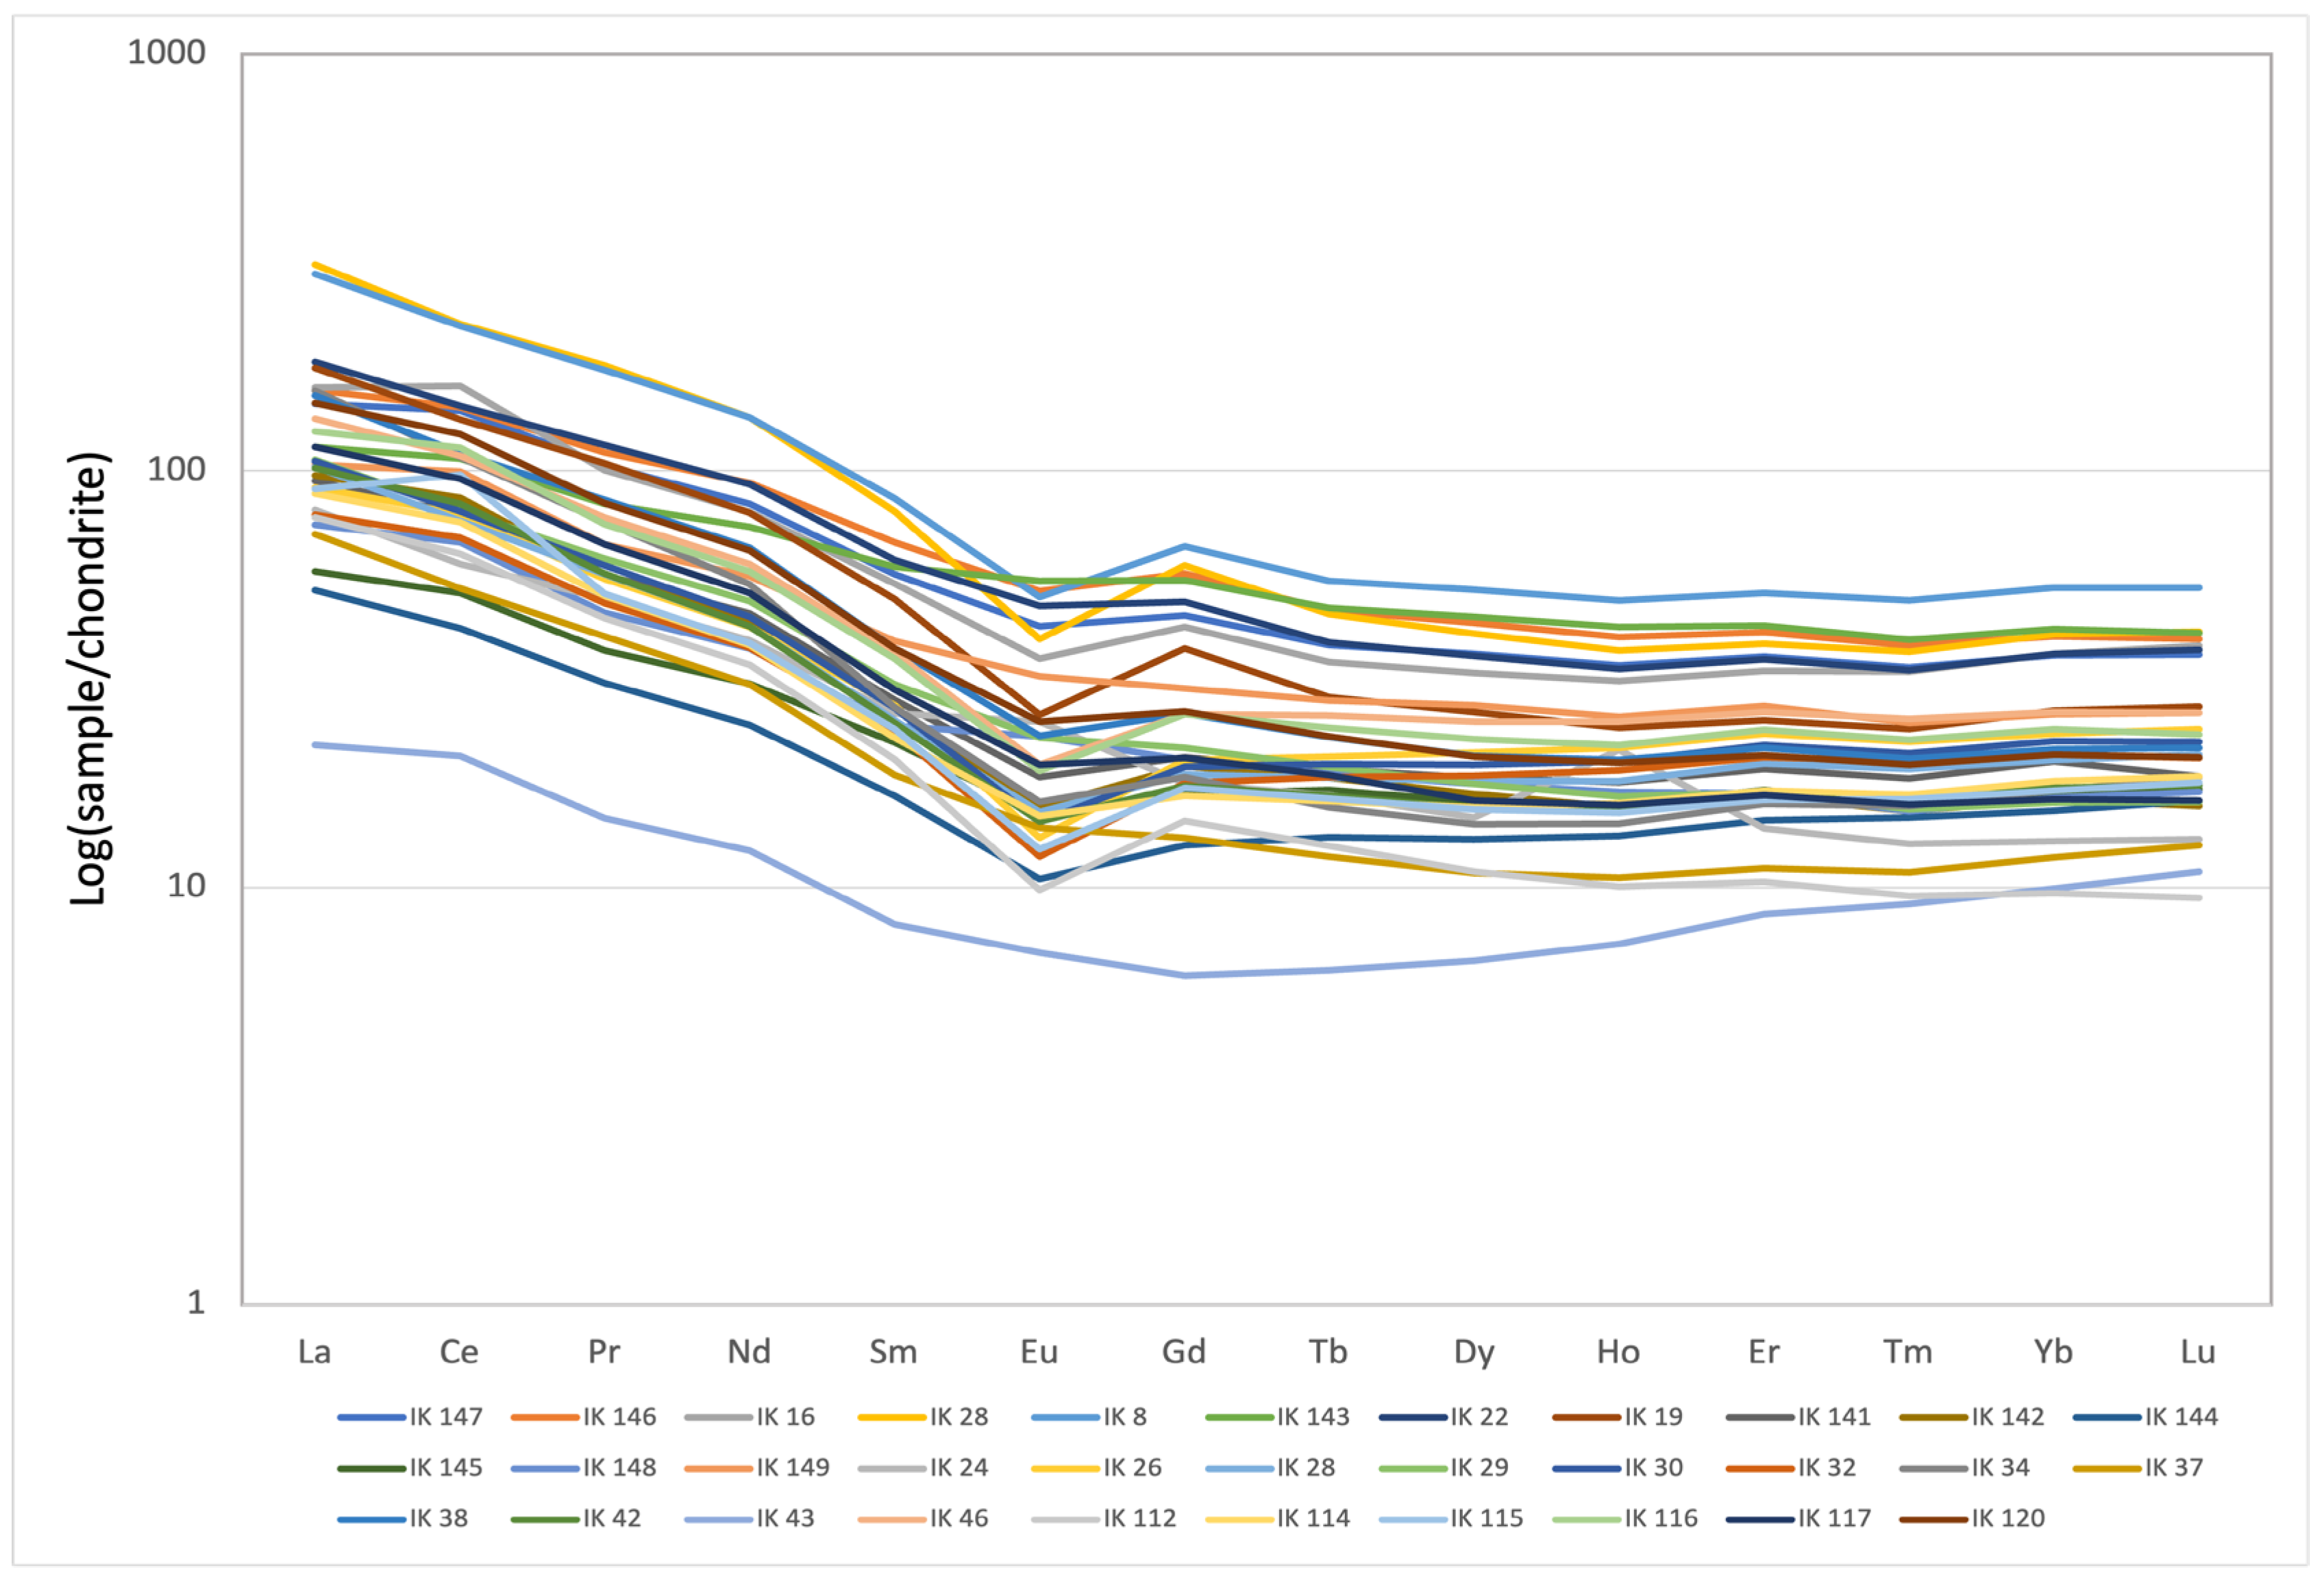
5.4. Rare-Earth Elements (REEs)
6. Conclusions
- Parent Lithology:
- Parent lithology exerts the strongest control over elemental distributions, explaining over 50% of the variance. Mafic, felsic, accretionary complex, and sedimentary rocks significantly influence major elements and specific trace elements (V, Cu, Rb, Ba, Ni, Cr, Sr).
- Influence of Mineral Deposits:
- Elemental concentrations influenced by mineral deposits exhibit higher mean/median ratios and extreme outliers due to ore deposits in the mining areas.
- Heavy Mineral Sedimentation:
- The spatial distribution of some elements is influenced by the sedimentation of heavy minerals within the basin, contributing to localized variations in elemental concentrations. LREEs (La, Ce, Nd) show higher concentrations compared to HREEs. Deviations from typical REE abundances, including negative Ce anomalies, suggest a potential influence of the surrounding mining areas on REE distributions.
Author Contributions
Funding
Institutional Review Board Statement
Informed Consent Statement
Data Availability Statement
Conflicts of Interest
References
- Ichikuni, M. Introduction: Role of geochemical map in geochemistry. Chikyukagaku (Geochem.) 1991, 25, 69–71. [Google Scholar]
- Darnley, A.G.; Bjorklund, A.; Bolviken, B.; Gustavsson, N.; Koval, P.V.; Plant, J.A.; Steenfelt, A.; Tauchid, M.; Xie, X. A Global Geochemical Database for Environmental and Resource Management; Final Report of IGCP Project 159; UNESCO Publishing: Paris, France, 1995. [Google Scholar]
- Goldstein, S.J.; Jacobsen, S.B. Rare earth elements in river waters. Earth Planet. Sci. Lett. 1988, 89, 35–47. [Google Scholar]
- Ali, S.A.; Saddique, A.; Rizwan, K. Global Potential of Rare Earth Resources and Rare Earth Demand from Clean Technologies. Resources 2017, 7, 203. [Google Scholar]
- S&P Global Commodity Insights. Rare Earth Element Prices to Remain Strong as Demand Exceeds Supply: Ionic. Available online: https://www.spglobal.com/commodity-insights/en/news-research/latest-news/energy-transition/051322-rare-earth-element-prices-to-remain-strong-as-demand-exceeds-supply-ionic (accessed on 22 February 2025).
- Kingsnorth, D.J. An Analysis of the Current Global Market for Rare Earth Elements; University of Wyoming: Laramie, Wyoming, 2020; Available online: https://www.uwyo.edu/ser/research/centers-of-excellence/energy-regulation-policy/_files/ree-econ-policy.pdf (accessed on 22 February 2025).
- Bozau, E.; Goettlicher, J.; Stärk, H.-J. Rare earth element fractionation during the precipitation and crystallization of hydrous ferric oxides from anoxic lake water. Appl. Geochem. 2008, 23, 3473–3486. [Google Scholar]
- Protano, G.; Riccobono, F. High contents of rare earth elements (REEs) in stream waters of a Cu–Pb–Zn mining area. Environ. Pollut. 2002, 117, 499–514. [Google Scholar]
- Guillén, M.T.; Delgado, J.; Albanese, S.; Nieto, J.M.; Lima, A.; De Vivo, B. Environmental geochemical mapping of Huelva municipality soils (SW Spain) as a tool to determine background and baseline values. J. Geochem. Explor. 2011, 109, 59–69. [Google Scholar]
- Lapworth, D.J.; Knights, K.V.; Key, R.M.; Johnson, C.C.; Ayoade, E.; Adekanmi, M.A.; Arisekola, T.M.; Okunlola, O.A.; Backman, B.; Eklund, M.; et al. Geochemical mapping using stream sediments in west-central Nigeria: Implications for environmental studies and mineral exploration in West Africa. Appl. Geochem. 2012, 27, 1035–1052. [Google Scholar]
- Imai, N.; Terashima, S.; Okai, T.; Kanai, Y.; Mikoshiba, M.; Kamioka, H.; Togashi, S.; Matsuhisa, Y.; Taniguchi, M.; Yokota, S. The geochemical map of domestic and foreign countries and new geochemical map project covering whole country in Japan. Chishitsu News 2001, 558, 9–17. [Google Scholar]
- Imai, N.; Terashima, S.; Ohta, A.; Mikoshiba, M.U.; Okai, T.; Tachibana, Y.; Togashi, S.; Matsuhisa, Y.; Kanai, Y.; Kamika, H.; et al. Geochemical map of Japan. Geol. Surv. Jpn. AIST 2004, 209, 28. [Google Scholar]
- Ohta, A.; Imai, N.; Terashima, S.; Tachibana, Y.; Ikehara, K.; Nakajima, I. Geochemical mapping in Hokuriku, Japan: Influence of surface geology, mineral occurrences and mass movement from terrestrial to marine environments. Appl. Geochem. 2004, 19, 1453–1469. [Google Scholar]
- Mikoshiba, M.U.; Imai, N. Geochemical map of the Tohoku region, northern Honshu, Japan. Geochim. Cosmochim. Acta 2003, 67, A290. [Google Scholar]
- Yamamoto, K.; Tanaka, T.; Kawabe, I.; Iwamori, H.; Hirahara, Y.; Asahara, Y.; Kim, K.H.; Richardson, C.; Ito, T.; Dragusanu, C.; et al. Geochemical map of the Ryoke granitic area in the northeastern part of Toyota City, Aichi Prefecture. J. Geol. Soc. Jpn. 1998, 104, 688–704. [Google Scholar]
- Yoshikawa, T.; Kurimoto, C.; Aoki, M. Geology of the Ikuno district. Quadrangle Series, 1:50,000. Okayama 2005, 12, 48. [Google Scholar]
- Yamamoto, T.; Kurimoto, C.; Yoshioka, T. Geology of the Yamazaki District. Quadrangle Series, 1:50,000. Okayama 2002, 12, 45. [Google Scholar]
- Hirokawa, O.; Togo, H.; Kambe, N. Explanatory Text of the Geological Map of Japan, Scale 1:50,000: Oyaichiba; Geological Survey of Japan: Tsukuba, Japan, 1954; p. 10. [Google Scholar]
- Geological Survey of Japan, AIST. Seamless Digital Geological Map of Japan; Geological Survey of Japan, AIST: Tokyo, Japan, 2015. [Google Scholar]
- Tanaka, T.; Kawabe, I.; Hirahara, Y.; Iwamori, I.; Mimura, K.; Sugisaki, R.; Asahara, Y.; Ito, I.; Yarai, H.; Yonezawa, C.; et al. Geochemical survey of the Sanage-yama area in Aichi Prefecture for environmental assessment. J. Earth Planet. Sci. Nagoya Univ. 1994, 41, 1–31. [Google Scholar]
- Sugisaki, R.; Momura, T.; Ando, K. An automatic X-ray fluorescence method for the analysis of silicate rocks. Bunseki Kagaku (Anal. Chem.) 1977, 26, 710–722. [Google Scholar]
- Yokoyama, T.; Nagai, Y.; Hinohara, Y.; Mori, T. Investigating the influence of nonspectral matrix effects in the determination of twenty-two trace elements in rock samples by ICP-QMS. Geostand. Geoanal. Res. 2017, 41, 221–242. [Google Scholar]
- O’Neill, H.S.C. The Smoothness and Shapes of Chondrite-normalized Rare Earth Element Patterns in Basalts. J. Petrol. 2016, 57, 1463–1508. [Google Scholar]
- Anders, E.; Grevesse, N. Abundances of the elements: Meteoritic and solar. Geochim. Cosmochim. Acta 1989, 53, 197–214. [Google Scholar]
- Nakada, R.; Shibuya, T.; Suzuki, K.; Takahashi, Y. Europium anomaly variation under low-temperature water-rock interaction: A new thermometer. Geochem. Int. 2017, 55, 822–832. [Google Scholar]
- Ohta, A.; Imai, N.; Terashima, S.; Tachibana, Y. Investigation of elemental behaviors in Chugoku region of Japan based on geochemical map utilizing stream sediments. Chikyukagaku (Geochem.) 2004, 38, 203–222. [Google Scholar]
- Ohta, A.; Imai, N.; Terashima, S.; Tachibana, Y. Application of multi-element statistical analysis for regional geochemical mapping in Central Japan. Appl. Geochem. 2005, 20, 1017–1037. [Google Scholar]
- Ohta, A.; Imai, N.; Okai, I.; Endo, H.; Kawanabe, S.; Ishi, T.; Taguchi, Y.; Kamioka, H. The characteristics of chemical distribution patterns in and around Yamagata city—Geochemical map in the southern area of Yamagata Basin. Chikyukagaku (Geochem.) 2002, 36, 109–125. [Google Scholar]
- Pyle, J.M.; Spear, F.S. Yttrium zoning in garnet: Coupling of major and accessory phases during metamorphic reactions. Am. Mineral. 2003, 88, 708. [Google Scholar]
- Jaffe, H.W. The role of yttrium and other minor elements in the garnet group. Am. Mineral. 1951, 36, 133–155. [Google Scholar]
- Lanzirotti, A. Yttrium zoning in metamorphic garnets. Geochim. Cosmochim. Acta 1995, 59, 4105–4110. [Google Scholar]
- Yang, P.; Rivers, T.; Jackson, S. Crystal-chemical and thermal controls on traceelement partitioning between coexisting garnet and biotite in metamorphic rocks from western Labrador. Can. Mineral. 1999, 37, 443–468. [Google Scholar]
- Christie, T.; Brathwaite, B.; Tulloch, A. Mineral Commodities Report 17—Rare Earths and Related Elements; New Zealand Institute of Geological and Nuclear Sciences Limited: Lower Hutt, New Zealand, 1998; p. 13. [Google Scholar]
- Henderson, P. General geochemical properties and abundances of the rare earth elements. In Rare Earth Element Geochemistry, 2; Henderson, P., Ed.; Elsevier: Amsterdam, The Netherlands, 1984; pp. 1–32. [Google Scholar]
- Wedepohl, K.H. Handbook of Geochemistry; Springer: Berlin/Heidelberg, Germany, 1970; Volume 2, p. 667. [Google Scholar]
- Jaireth, S.; Hoatson, D.M.; Miezitis, Y. Geological setting and resources of the major rare-earth-element deposits in Australia. Ore Geol. Rev. 2014, 62, 72–128. [Google Scholar]
- Seto, M.; Akagi, T. Chemical condition for the appearance of a negative Ce anomaly in stream waters and groundwaters. Geochem. J. 2008, 42, 371–380. [Google Scholar] [CrossRef]
- Ratié, G.; Vantelon, D.; Pédrot, M.; Beauvois, A.; Chaouchi, K.; Fosse, C.; Davranche, M. Cerium anomalies in riverbanks: Highlight intc the role of ferric deposits. Sci. Total Environ. 2020, 713, 136544. [Google Scholar]
- Zhong, S.; Seltmann, R.; Qu, H.H.; Song, Y. Characterization of the zircon Ce anomaly for estimation of oxidation state of magmas: A revised Ce/Ce method. Mineral. Petrol. 2019, 113, 755–763. [Google Scholar]


| Oxides and Elements | Unit | Min | Max | Mean | Median | SD | p | p-Log |
|---|---|---|---|---|---|---|---|---|
| Al2O3 | wt% | 10.81 | 17.42 | 18.24 | 14.25 | 1.12 | 0.935 | 0.786 |
| CaO | wt% | 0.36 | 6.11 | 1.48 | 1.04 | 1.11 | <0.001 | 0.106 |
| Fe2O3 | wt% | 2.13 | 22.01 | 6.95 | 6.48 | 3.29 | 0.008 | 0.91 |
| K2O | wt% | 0.91 | 4.35 | 2.71 | 2.85 | 0.68 | 0.202 | 0.002 |
| MgO | wt% | 0.25 | 5.22 | 1.48 | 1.1 | 1.05 | <0.001 | 0.568 |
| MnO | wt% | 0.05 | 0.77 | 0.16 | 0.13 | 0.1 | <0.001 | 0.087 |
| Na2O | wt% | 0.48 | 3.54 | 1.58 | 1.51 | 0.53 | 0.132 | 0.817 |
| P2O5 | wt% | 0.02 | 0.27 | 0.09 | 0.08 | 0.04 | 0.06 | 0.033 |
| SiO2 | wt% | 44.72 | 77.19 | 65.59 | 66.67 | 6.24 | 0.172 | 0.042 |
| TiO2 | wt% | 0.21 | 6.64 | 0.94 | 0.79 | 0.63 | <0.001 | 0.644 |
| Pb | ppm | 17 | 4623 | 153 | 45 | 472 | <0.001 | 0.001 |
| Ba | ppm | 32 | 1071 | 515 | 516 | 130 | 0.231 | <0.001 |
| Zr | ppm | 141 | 1231 | 413 | 366 | 199 | 0.003 | 0.811 |
| Y | ppm | 19 | 82 | 29 | 28 | 7 | <0.001 | 0.016 |
| Sr | ppm | 37 | 301 | 133 | 129 | 51 | 0.591 | 0.308 |
| Rb | ppm | 43 | 267 | 136 | 133 | 37 | 0.428 | 0.031 |
| Zn | ppm | 50 | 13,152 | 419 | 179 | 1146 | <0.001 | 0.002 |
| Cu | ppm | 2 | 2601 | 114 | 34 | 313 | <0.001 | 0.041 |
| Ni | ppm | 2 | 190 | 31 | 20 | 30 | <0.001 | 0.199 |
| Co | ppm | 6 | 210 | 36 | 28 | 29 | <0.001 | 0.955 |
| Cr | ppm | 7 | 1837 | 113 | 60 | 205 | <0.001 | 0.661 |
| V | ppm | 17 | 454 | 115 | 92 | 73 | 0.008 | 0.941 |
| Oxides and Elements | Communality | Factor | ||||
|---|---|---|---|---|---|---|
| 1 | 2 | 3 | 4 | 5 | ||
| TiO2 | 0.57 | 0.91 | 0.128 | −0.059 | 0.103 | −0.057 |
| K2O | 0.81 | −0.885 | 0.178 | −0.21 | −0.059 | −0.159 |
| V | 0.93 | 0.862 | 0.18 | 0.199 | 0.228 | 0.03 |
| Fe2O3 | 0.83 | 0.858 | 0.377 | 0.078 | 0.207 | 0.006 |
| SiO2 | 0.95 | −0.819 | −0.24 | −0.097 | −0.385 | −0.154 |
| MgO | 0.79 | 0.782 | 0.105 | 0.463 | 0.273 | 0.151 |
| Co | 0.82 | 0.771 | 0.455 | 0.147 | 0.225 | 0.046 |
| Rb | 0.7 | −0.748 | 0.337 | −0.285 | −0.086 | 0.105 |
| CaO | 0.88 | 0.72 | −0.027 | 0.213 | 0.535 | −0.069 |
| MnO | 0.85 | 0.684 | 0.484 | 0.008 | 0.114 | 0.12 |
| Ba | 0.73 | −0.682 | −0.19 | −0.417 | 0.222 | 0.209 |
| Y | 0.88 | 0.53 | −0.056 | −0.129 | −0.072 | 0.484 |
| P2O5 | 0.62 | 0.486 | 0.372 | 0.162 | 0.43 | 0.358 |
| Pb | 0.48 | 0.02 | 0.949 | −0.047 | 0.051 | 0.065 |
| Zn | 0.6 | 0.122 | 0.935 | 0.037 | 0.12 | −0.007 |
| Cu | 0.4 | 0.143 | 0.831 | 0.334 | 0.06 | −0.071 |
| Na2O | 0.88 | −0.211 | −0.564 | 0.393 | 0.351 | −0.361 |
| Ni | 0.74 | 0.161 | 0.052 | 0.904 | 0.057 | 0.155 |
| Cr | 0.87 | 0.451 | 0.116 | 0.769 | 0.118 | −0.016 |
| Sr | 0.78 | 0.4 | −0.074 | −0.02 | 0.839 | −0.077 |
| Al2O3 | 0.86 | 0.113 | 0.207 | 0.106 | 0.695 | 0.2 |
| Zr | 0.89 | −0.063 | −0.052 | −0.15 | −0.143 | −0.863 |
| Eigenvalue | 10.2 | 3.3 | 1.7 | 1.6 | 1.2 | |
| Variance (%) | 36 | 18 | 11 | 10 | 7 | |
| Parent Lithology a | Fel_V | Fel_P | Maf_V | Acc_P | Acc_Pl | Sed_1 | Gab_Pl | Fel_Pp | |
|---|---|---|---|---|---|---|---|---|---|
| Number | 80 | 12 | 6 | 27 | 17 | 9 | 1 | 4 | |
| Al2O3 | wt% | 14.03 | 13.77 | 14.33 | 14.16 | 15.95 | 14.8 | 13.72 | 14.22 |
| CaO | wt% | 0.98 | 1.67 | 2.06 | 0.74 | 2.75 | 2.1 | 1.14 | 1.1 |
| Fe2O3 | wt% | 5.87 | 5.27 | 9.63 | 5.28 | 9.88 | 10.32 | 5.96 | 7.27 |
| K2O | wt% | 2.95 | 3.41 | 1.86 | 2.88 | 1.72 | 2.21 | 2.81 | 2.61 |
| MgO | wt% | 0.99 | 1.32 | 1.54 | 1.02 | 3.49 | 2.63 | 0.93 | 1.81 |
| MnO | wt% | 0.13 | 0.1 | 0.26 | 0.12 | 0.2 | 0.17 | 0.13 | 0.18 |
| Na2O | wt% | 1.44 | 2.4 | 1.13 | 1.51 | 1.9 | 1.46 | 1.2 | 1.17 |
| P2O5 | wt% | 0.08 | 0.08 | 0.12 | 0.07 | 0.12 | 0.11 | 0.05 | 0.1 |
| SiO2 | wt% | 67.51 | 64.94 | 56.36 | 71.09 | 58.81 | 60.5 | 67.98 | 64.81 |
| TiO2 | wt% | 0.74 | 0.61 | 1.29 | 0.76 | 1.16 | 1.02 | 0.8 | 0.84 |
| Pb | ppm | 47 | 42 | 67 | 40 | 59 | 40 | 43 | 158 |
| Ba | ppm | 546 | 526 | 483 | 527 | 380 | 371 | 624 | 446 |
| Zr | ppm | 376 | 430 | 369 | 401 | 260 | 224 | 340 | 267 |
| Y | ppm | 30 | 29 | 26 | 27 | 27 | 25 | 32 | 29 |
| Sr | ppm | 129 | 172 | 139 | 100 | 184 | 141 | 103 | 105 |
| Rb | ppm | 142 | 139 | 107 | 126 | 84 | 123 | 153 | 151 |
| Zn | ppm | 195 | 143 | 310 | 166 | 202 | 148 | 135 | 372 |
| Cu | ppm | 30 | 20 | 25 | 34 | 55 | 69 | 15 | 73 |
| Ni | ppm | 16 | 11 | 18 | 28 | 70 | 56 | 11 | 50 |
| Co | ppm | 24 | 23 | 53 | 18 | 58 | 69 | 24 | 43 |
| Cr | ppm | 43 | 51 | 72 | 73 | 189 | 146 | 23 | 206 |
| V | ppm | 84 | 97 | 211 | 80 | 196 | 166 | 119 | 138 |
| Oxides and Elements | Threshold | Number of Outlier Data | |
|---|---|---|---|
| Fe2O3 | 13.18 | wt% | 6 |
| MnO | 0.31 | wt% | 10 |
| TiO2 | 1.83 | wt% | 6 |
| Pb | 135 | ppm | 24 |
| Zn | 495 | ppm | 20 |
| Cu | 127 | ppm | 18 |
| Ni | 27 | ppm | 15 |
| Co | 76 | ppm | 9 |
| Cr | 228 | ppm | 16 |
| Zr | 767 | ppm | 9 |
| Sr | 244 | ppm | 1 |
| V | 255 | ppm | 4 |
| REEs | Median | Mean | Min | Max | SD |
|---|---|---|---|---|---|
| La | 24.72 | 28.56 | 5.21 | 74.10 | 14.43 |
| Ce | 55.77 | 61.07 | 12.67 | 137.99 | 27.87 |
| Pr | 5.61 | 6.70 | 1.36 | 16.60 | 3.37 |
| Nd | 21.49 | 25.83 | 5.60 | 61.36 | 12.87 |
| Sm | 4.11 | 5.33 | 1.21 | 12.68 | 2.75 |
| Eu | 1.09 | 1.33 | 0.39 | 3.06 | 0.75 |
| Gd | 4.04 | 5.43 | 1.22 | 13.09 | 3.06 |
| Tb | 0.70 | 0.87 | 0.23 | 1.96 | 0.42 |
| Dy | 4.54 | 5.57 | 1.64 | 12.75 | 2.70 |
| Ho | 1.01 | 1.17 | 0.23 | 2.67 | 0.57 |
| Er | 3.23 | 3.68 | 1.38 | 8.13 | 1.63 |
| Tm | 0.48 | 0.54 | 0.23 | 1.21 | 0.24 |
| Yb | 3.31 | 3.76 | 1.56 | 8.42 | 1.68 |
| Lu | 0.50 | 0.58 | 0.23 | 1.29 | 0.26 |
Disclaimer/Publisher’s Note: The statements, opinions and data contained in all publications are solely those of the individual author(s) and contributor(s) and not of MDPI and/or the editor(s). MDPI and/or the editor(s) disclaim responsibility for any injury to people or property resulting from any ideas, methods, instructions or products referred to in the content. |
© 2025 by the authors. Licensee MDPI, Basel, Switzerland. This article is an open access article distributed under the terms and conditions of the Creative Commons Attribution (CC BY) license (https://creativecommons.org/licenses/by/4.0/).
Share and Cite
Mardiyah, A.; Syahputra, M.R.; Tang, Q.; Okabyashi, S.; Tsuboi, M. The Spatial Distribution of Trace Elements and Rare-Earth Elements in the Stream Sediments Around the Ikuno Mine Area in Hyogo Prefecture, Southwest Japan. Sustainability 2025, 17, 2777. https://doi.org/10.3390/su17062777
Mardiyah A, Syahputra MR, Tang Q, Okabyashi S, Tsuboi M. The Spatial Distribution of Trace Elements and Rare-Earth Elements in the Stream Sediments Around the Ikuno Mine Area in Hyogo Prefecture, Southwest Japan. Sustainability. 2025; 17(6):2777. https://doi.org/10.3390/su17062777
Chicago/Turabian StyleMardiyah, Ainun, Muhammad Rio Syahputra, Qiang Tang, Satoki Okabyashi, and Motohiro Tsuboi. 2025. "The Spatial Distribution of Trace Elements and Rare-Earth Elements in the Stream Sediments Around the Ikuno Mine Area in Hyogo Prefecture, Southwest Japan" Sustainability 17, no. 6: 2777. https://doi.org/10.3390/su17062777
APA StyleMardiyah, A., Syahputra, M. R., Tang, Q., Okabyashi, S., & Tsuboi, M. (2025). The Spatial Distribution of Trace Elements and Rare-Earth Elements in the Stream Sediments Around the Ikuno Mine Area in Hyogo Prefecture, Southwest Japan. Sustainability, 17(6), 2777. https://doi.org/10.3390/su17062777