Article

ESG Performance of Chinese Listed Enterprises Participating in the Belt and Road Initiative

1
Faculty of World Economy and International Affairs, HSE University, 20 Myasnitskaya Ulitsa, Moscow 101000, Russia
2
Laboratory of Responsible Business, Centre for Basic Research, HSE University, 20 Myasnitskaya Ulitsa, Moscow 101000, Russia
*
Author to whom correspondence should be addressed.
Sustainability 2025, 17(6), 2776; https://doi.org/10.3390/su17062776
Submission received: 17 February 2025 / Revised: 15 March 2025 / Accepted: 19 March 2025 / Published: 20 March 2025
(This article belongs to the Section Economic and Business Aspects of Sustainability)

Abstract

:
The Chinese government encourages enterprises participating in the Belt and Road Initiative (BRI) to improve their ESG performance to better align the BRI with sustainable development. This paper reveals the heterogeneous treatment effect of the BRI on the ESG performance of enterprises using time-varying DID and DDD models, powerfully validating that the BRI promotes the ESG performance of participating enterprises. According to our mechanism analysis, the BRI promotes the ESG performance of enterprises involved in international infrastructure projects and the development of trade routes. However, it has no significant impact on enterprises involved in outward foreign direct investment, exploring international markets, and providing support services and others. According to our heterogeneity analysis, the BRI promotes the ESG performance of state-owned enterprises (SOEs) more than that of non-SOEs, the ESG performance of non-manufacturing enterprises more than that of manufacturing enterprises, and the ESG performance of enterprises on the Main Board more than that of enterprises on other boards. These findings can provide policymakers and enterprise managers with guidance on improving ESG performance and clarify the micro-level empirical evidence of the performance of the BRI in implementing sustainable development.

1. Introduction

The Belt and Road Initiative (BRI) is a large-scale pan-regional integration scheme initiated by China in 2013. It seeks to “facilitate policy coordination, infrastructure connectivity, unimpeded trade, financial integration, and closer people-to-people ties” [1]. The United Nations [2] and the State Council of China [1] state that the BRI is actively practising the 2030 Agenda for Sustainable Development. Numerous empirical studies also suggest that the BRI contributes to the achievement of Sustainable Development Goals (SDGs) in both economic and social dimensions [3,4,5], but more attention needs to be paid to the environmental dimension [3,6]. To address this concern, the Chinese government has adopted more sustainable policies under the framework of the BRI [1,2] and encourages enterprises participating in the BRI to promote environment, social, and governance (ESG) performance.
However, there is a lack of empirical evidence on the effect of the BRI on enterprises’ ESG performance. A study has taken the lead in confirming that the BRI promotes enterprises’ ESG performance using the standard difference-in-differences (DID) model [7]. However, that study is based on the assumption that the timing and mechanisms of enterprises’ participation in the BRI are homogeneous. Its assumption that all enterprises respond to the BRI at the same time may lead to erroneous estimation results, contrary to reality. Its assumption that all enterprises respond to the BRI with the same mechanism is also contrary to reality and fails to account for the actual mechanisms behind the heterogeneous effect.
To address the above issues, this paper employs time-varying DID and triple-difference (DDD) models to further validate the heterogeneous effect of the BRI on enterprises’ ESG performance. The contribution of this paper is not only the refinement of the evaluation methodology but also confirming that the heterogeneous treatment effect of the BRI exists across different participation mechanisms and characteristics of enterprises. For different participation mechanisms, the BRI promotes the ESG performance of enterprises that are involved in international infrastructure projects and the development of trade routes. However, there is no evidence that such promotion exists in the enterprises towards outward foreign direct investment (OFDI), exploring international markets, and providing support services or others. For characteristics of enterprises, the BRI promotes the ESG performance of state-owned enterprises (SOEs) more than that of non-state-owned enterprises (non-SOEs), the ESG performance of non-manufacturing enterprises more than that of manufacturing enterprises, and the ESG performance of enterprises listed on the Main Board more than that of enterprises listed on other boards. This paper also discusses theoretical rationales behind these heterogeneities [8].
This paper not only provides micro-level empirical evidence of practical efforts of the BRI on sustainable development, where the BRI promotes the ESG performance of participating enterprises. The identified heterogeneity treatment effect can also help the government to develop more targeted policies to encourage enterprises participating in the BRI towards sustainable development. Enterprise managers also benefit from this study by understanding the existing differences in ESG performance and the mechanisms behind them.
The remainder of this paper is structured as follows. Section 2 reviews the existing literature and thereby derives hypotheses. Section 3 describes data sources and filtering processes, as well as the construction of variables. Section 4 introduces main methodologies, including the standard DID model, time-varying DID model, and time-varying DDD model. Section 5 shows the principal results, the results of mechanism analyses, and the results of heterogeneity analyses, with corresponding explanations. Section 6 provides the main conclusions and discusses the key findings. The appendices provide information on additional tests to support the credibility of this study.

2. Literature Review and Hypothesis Development

2.1. Interaction Between the BRI and ESG

From a macro perspective, the BRI is highly compatible with the United Nations 2030 Agenda for Sustainable Development [1,2]. Fang et al. (2023) monitored the progress of the SDGs of 65 countries participating in the BRI and found that the BRI SDG index had risen from 43.5 in 2000 to 60.2 in 2019 [9].
The BRI is one of the largest international infrastructural undertakings of our time, which assists numerous developing countries in the construction of transport networks, electricity, water, and communications facilities, contributing to SDGs 6, 9, and 11 [2,10]. The BRI further mitigates regional energy shortages by helping developing countries exploit and utilise fossil energy sources, construct energy transport channels, and develop new energy sources, contributing to SDG 7 [11,12]. The BRI also contributes to the Sustainable Consumption and Production Framework for Africa, through capacity cooperation and technology transfer, contributing to SDG 12 [13]. And the BRI promotes economic growth in partner countries through trade, investment, and infrastructure development, which drives employment and increases income, thereby reducing poverty and inequality, contributing to SDGs 1, 2, 5, 8, and 10 [2,3,5,10,11]. In addition, the BRI promotes access to basic health care and education for people in underdeveloped regions through medical and educational assistance, contributing to SDGs 3 and 4 [2,4,10,11]. Furthermore, China fosters the BRI as an important arena for global multilateral partnerships, contributing to SDGs 16 and 17 [1,10].
While the BRI is prominent in achieving both economic and social dimensions of the SDGs, its impact on the environment is questionable [9]. The BRI may have side effects of deteriorating the environment while promoting economic growth, which is not conducive to the SDGs 13, 14, and 15 [3,6,9,13,14]. It suggests that the BRI needs to place greater emphasis on sustainable development in the realisation of its ambitions, especially the environmental dimension. The Chinese government has already taken actions by developing sustainable policies and encouraging enterprises to fulfil corporate social responsibility (CSR) [1,10,14,15].
Switching to a micro perspective, Chinese enterprises participating in the BRI are integrating ESG principles into their strategies to respond to governments’ sustainability policies [14,15,16] as well as public and investor expectations of CSR [8,17]. These two are the driving forces for participating enterprises to improve their ESG performance.
The former refers to participating enterprises not only needing to maintain consistency with the sustainable development policies of the Chinese government but also needing to meet the regulatory requirements of host countries [8,16]. The Chinese government puts formal and informal pressures on participating enterprises to urge them to fulfil CSR and improve ESG performance. Formal pressures (namely, legitimacy pressures) include requiring enterprises to publish CSR or ESG reports and formulating stricter regulatory policies [14,15]. Informal pressures involve using non-institutional means to make enterprise managers think that they are “the main implementer of the BRI and the overseas spokesperson of the country and their CSR performance is closely related to the country’s overseas image” [16]. It is worth mentioning that the Chinese government also publicly reports and praises enterprises that actively fulfil CSR and have excellent ESG performance, which greatly enhances the reputation of these enterprises and prompts other enterprises to emulate them (peer effects) [16,17]. On the other hand, the Chinese government does not provide financial support to poorly performing enterprises, which forces enterprises to actively implement ESG practices [16,18]. Enterprises participating in the BRI also experience legitimacy and institutional pressures from host countries [8]. Yang et al. (2022) show that positive impacts of the BRI on the CSR performance of multinational enterprises are stronger in host countries with higher levels of CSR-related institutional pressures [16].
The latter refers to promoting ESG performance being beneficial for participating enterprises by gaining financial support from investors and gaining a reputation with the public. Bai et al. (2022) show good ESG performance of Chinese listed enterprises reduces their financial distress and attracts institutional investors, especially in secondary and tertiary industries [19]. Furthermore, once these enterprises perform poorly, they will not only face penalties from the home and host country governments but also be easily boycotted by the public, thus hindering the normal development of business. Nicolas et al. (2024) showed that when ESG-related reputation risks exist on social media, abnormal returns are significantly negatively affected [20].
Besides the above, the BRI creates a stable environment for the green transformation of enterprises [21] and enhances the environmental responsibility of Chinese enterprises through green innovation [22]. And good ESG performance promotes corporate green innovation, particularly for private corporates [23,24]. These findings suggest that participation in the BRI and good ESG performance can provide a competitive advantage for Chinese enterprises, in turn incentivising them to improve their ESG performance.
Nevertheless, challenges remain in fully realising ESG principles. An analysis of Chinese multinationals participating in the BRI shows some progress in CSR related to employee relations and products, but existing irresponsible behaviours remain [16]. Despite the BRI’s commitment to sustainable development, research shows significant gaps in corporate responsibility reporting, particularly on biodiversity impacts and ecological restoration [14].
More importantly, there is a lack of solid empirical evidence on whether the BRI contributes to the ESG performance of participating enterprises. Thereby, this paper derives the first hypothesis.
Hypothesis 1. 
The BRI promotes the ESG performance of participating enterprises.

2.2. Multiple Mechanisms of the BRI

The majority of current studies on the correlation between the BRI and CSR or ESG performance are based on the assumption that the mechanisms of enterprises’ participation in the BRI are homogeneous [7,21,22], which contradicts reality. The BRI is a collection of miscellaneous projects, which incorporates various types of enterprises. In other words, the issue concerns how to determine whether an enterprise is participating in the BRI or not.
The dominant approach is to crudely consider enterprises that undertake outward foreign direct investment (OFDI) as participating in the BRI [7,16], which is plainly parochial. As early as 2000, the Chinese government recognised the “Going Global Strategy” as an essential national strategy to encourage enterprises to engage in OFDI. The main factors for Chinese firms engaging in OFDI are economically relevant [25], so it is far-fetched to define enterprises engaging in OFDI purely as participating in the BRI. More importantly, a large number of contractors working on core projects of the BRI (such as infrastructure) have not established subsidiaries in other countries [16].
In practice, many enterprises are responding to the BRI through other mechanisms. Firstly, one of the most important themes of the BRI is infrastructure development, with a large number of Chinese construction companies contracting international infrastructure projects [10,26,27]. Secondly, the BRI aims to develop six economic corridors and three blue economic passages as trade routes [28], which drives many Chinese transport enterprises to engage in the development of trade routes or other enterprises to obtain locational advantages from them [29]. Thirdly, the BRI attracts a large number of Chinese listed enterprises to actively explore international markets to increase exports through trade facilitation [26,30]. Furthermore, there are numerous Chinese enterprises providing support services within the framework of the BRI, including financial and IT services [31].
Given that infrastructure projects and trade routes are seen as core points of the BRI and most environmental concerns occur in these areas, related enterprises may be more susceptible to pressures from governments to further improve their ESG performance.
From the above, it is learnt that enterprises participate in the BRI with different mechanisms, which suggests that the promoting effect of the BRI on ESG performance may be heterogeneous across different mechanisms. Consequently, this paper derives the second set of hypotheses, consisting of five sub-hypotheses.
Hypothesis 2a. 
The BRI promotes ESG performance by outward foreign direct investment.
Hypothesis 2b. 
The BRI promotes ESG performance by infrastructure projects.
Hypothesis 2c. 
The BRI promotes ESG performance by trade routes.
Hypothesis 2d. 
The BRI promotes ESG performance by exploring international markets.
Hypothesis 2e. 
The BRI promotes ESG performance by support services and others.

2.3. Different Characteristics of Enterprises

The heterogeneity of the impact of the BRI on ESG performance is found not only in the different mechanisms of participation in the BRI but also in the characteristics of the enterprises themselves.
Firstly, there may be differences between state-owned enterprises (SOEs) and non-SOEs. Khalid et al. (2021) showed that multinational non-SOEs outperform other similar enterprises in their environmental and governance performance [8]. Compared to SOEs, the ESG performance of non-SOEs reduces financial distress to a greater extent [19,24,32]. This shows that the motivation for non-SOEs to promote ESG performance comes more from investors’ expectations of CSR [8,14,33].
However, Yang et al. (2022) show that the BRI promotes the fulfilment of CSR for multinational enterprises and appears more clearly in SOEs [16]. This is because SOEs are more susceptible to institutional power and informal pressures from the government and have less financial pressure and earning pressure, allowing more focus on the fulfilment of CSR [14,16,33]. Thereby, this paper derives the first sub-hypothesis of the third set of hypotheses.
Hypothesis 3a. 
The BRI promotes the ESG performance of SOEs more than that of non-SOEs.
Secondly, there may be differences between manufacturing and non-manufacturing enterprises. Enterprises are tacitly recognised as being strongly motivated to improve ESG performance, since this not only attracts investors to reduce financial distress but also improves performance on the stock market [34]. However, manufacturing enterprises face greater difficulties in improving their ESG performance, which cannot be achieved overnight given that they need to improve their technological innovation capabilities to comply with ESG requirements [35,36]. Consequently, market expectations for manufacturing enterprises to improve their ESG performance are also weaker than those for non-manufacturing enterprises, which means that their ESG ratings are less correlated with their performance in the stock market [34,37].
Manufacturing enterprises are generally more constrained by environmental regulations issued by their production locations. As China’s environmental protection regulations are increasingly upgraded, it is possible that some highly polluting enterprises will choose to conduct OFDI in countries with less environmental pressures (namely, the pollution haven hypothesis) [10,38,39]. Although the BRI can influence these manufacturing enterprises through informal pressures [14,16], it is not possible to employ formal pressures directly to influence their business behaviours in other countries, particularly when these investments are positively welcomed by host countries (for economic development).
Thereby, this paper derives the second sub-hypothesis of the third set of hypotheses.
Hypothesis 3b. 
The BRI promotes the ESG performance of non-manufacturing enterprises more than that of manufacturing enterprises.
Thirdly, there are differences among enterprises of different sizes and development stages. Popescu et al. (2023) suggest that small enterprises may lack the ability to afford ESG practices due to insufficient financial support [35]. The empirical analysis of Chen et al. (2024) also shows that ESG performance can effectively control the operating risks of large enterprises, while small enterprises are less affected by ESG performance [40]. More importantly, government pressures and public expectations are also more demanding on large and mature enterprises [33,41].
China’s stock markets mainly consist of the Main Board, the Growth Enterprise Board, the Sci-Tech Innovation Board, and the New Third Board (currently transferred to the Beijing Stock Exchange). Among them, the requirements for listed enterprises on the Main Board are much higher than those for enterprises on other boards, the former type of enterprises being relatively sizable and profitable. Thereby, this paper derives the third sub-hypothesis of the third set of hypotheses.
Hypothesis 3c. 
The BRI promotes the ESG performance of enterprises on the Main Board more than that of enterprises on other boards.

3. Data

3.1. Data Sources and Filtering

This paper uses data relating to Chinese listed enterprises from 2009 to 2023. ESG performance (dependent variable) is measured by Huazheng ESG ratings (also known as Sino-Securities Index ESG ratings) extracted from the Wind database. The Huazheng ESG ratings system is one of the most prestigious and credible rating systems in China. It covers all A-share listed enterprises in China, and the available data can be traced back to 2009. It collects more than 300 indicators for scoring and adjusts the scores based on the industry to produce nine ESG ratings: C, CC, CCC, B, BB, BBB, A, AA, and AAA [42]. Since the longitudinal data on scores are not publicly available, the above ratings are assigned from 1 to 9 as the dependent variable.
Although there are numerous ESG rating systems currently available in China, the Huazheng ESG rating system has the following advantages that make it the only available data source in this study:
  • It is the only ESG ratings system in China with data traced back to before 2013 (namely, before the BRI was proposed);
  • It covers all A-share listed enterprises and therefore avoids self-selection bias and has strong representativeness;
  • Instead of relying on self-reported data from enterprises, it proactively collects over 300 indicators for ratings, avoiding greenwashing behaviour;
  • It takes into account industry heterogeneity in ratings, making it unnecessary to consider industry factors in this paper.
Considering that Huazheng ESG ratings being the only data suitable for this study, it precludes the robustness test by varying the dependent variables. To address this issue, this paper performs a series of additional robustness tests to support the credibility of this study (see Appendix B).
Furthermore, the data on whether a company participates in the BRI (independent variable) come from the “Collection of BRI Concept Stocks (BK0712)” produced by the Eastmoney website. Other enterprise characteristics (control variables) are derived from the China Stock Market and Accounting Research (CSMAR) database. The above databases or websites are affiliated with authoritative financial institutions in China and are widely used in industry and academia [19,21,34,40].
The three types of data above are merged, and the data filtering steps below are performed to avoid interference from special samples. This results in an unbalanced panel dataset with 43,841 enterprise-year observations from 5184 enterprises (425 of them participate in the BRI).
  • Remove samples with missing or incomplete data;
  • Remove samples from the financial industry;
  • Remove samples with special treatment (ST and *ST stocks) in the risk alert board.
The unbalanced panel dataset contains more samples but may introduce selection bias. Cheng et al. (2024) further cull samples by removing enterprises without observations around 2014 (the defined start year of the BRI) for the standard DID model [7]. This paper does not perform such a refiltering for samples, given that the time-varying DID model is used, which means that the time to respond to the policy is heterogeneous for individuals. And refiltering leads to fewer samples, which produces more unreliable results, especially when the assumption of missing at random is satisfied [43]. But as a robustness test, this paper also constructs a balanced panel dataset consisting of 13,005 enterprise-year observations (15 years and 867 enterprises; 135 of them participate in the BRI).
However, there is heterogeneity in the years and mechanisms by which enterprises participate in the BRI, and such information is not available in the current databases. The authors compiled this information by retrieving public information, including official corporate websites, annual reports and other disclosures from enterprises, and news reports. The year of participation is strictly limited to the year when the enterprise starts to take practical actions to respond to the BRI. This paper also conducts placebo tests (see Appendix C) to exclude any suspicion of self-manipulation of the above data by the authors and to enhance the credibility of this study.
Figure 1 shows the time distribution of enterprises participating in the BRI that started responding to the BRI by years and mechanisms, compiled by the authors based on public information, including the following: exploration of international markets (127 enterprises), involvement in international infrastructure projects (100 enterprises), outward foreign direct investment (92 enterprises), involvement in or benefit from the development of trade routes (71 enterprises), and provision of support services or others (35 enterprises).

3.2. Variables

This paper constructs a series of variables as shown in Table 1, where descriptive statistics of the variables can also be found.
Huazheng ESG ratings are used as the dependent variable (ESG) to appraise the ESG performance of enterprises. The mean value for all observations is 4.14 (between B and BB), with the minimum being 1 (C) and the maximum being 8 (AA). This means that none of the enterprises have received an AAA rating (scoring above 95% marks) as of 2023, due to the very strict criteria used in the rating system.
This paper constructs two sets of independent variables for the standard DID model and the time-varying DID model, respectively. For the standard DID model, the treatment variable (Treat) is assigned 1 for enterprises that participate in the BRI and 0 for non-participants, and the time variable (Time) is assigned 1 for observations in 2013 and thereafter and 0 for observations pre-2013. Although the BRI was proposed in 2013, there is usually a lag in policy, so this paper also changes that time to 2014 and 2015 for robustness tests (see Table A2 in Appendix B). For the time-varying DID model, this paper constructs the other treatment variable (BRI) that may be heterogeneous for each enterprise in each year. That is to say, if the enterprise participates in the BRI in the year, it is assigned 1, and if not, 0.
This paper also selects some financial or governance characteristics of enterprises as control variables, which may also be influential factors for the ESG performance of enterprises [19,21,37]. To exclude outliers, winsorisation is performed at 1% and 99% for continuous control variables (see Table 1).
Based on the literature [8,34,40], three dummy variables (representing state-owned enterprises or not, manufacturing enterprises or not, and enterprises on the Main Board or not) are selected as grouping variables for heterogeneity analyses and as third independent variables in triple differences, which allow for the verification of Hypotheses 3a, 3b, and 3c.

4. Methodology

4.1. Standard DID Model

Difference in differences (DID) is a quasi-experimental approach that is widely used to estimate the causal impact of policies and external shocks on observations [43,44]. Therefore, the standard DID model has been widely used in empirical studies targeting the BRI [4,5,6,7,16,37].
In experimental research, researchers often randomly divide the experimental subjects into two groups (treatment group and control group), only apply external shocks to the treatment group, and then compare the difference between the two to obtain the treatment effect. However, in most economic studies, it is difficult to conduct such experiments, especially when evaluating sudden external events. Therefore, this kind of quasi-experimental design (DID model) is used extensively.
The linchpin of the DID model is to find two groups—one group is affected by the external shock (treatment group), while the other group is not affected (control group)—and the other characteristics (control variables) of the two groups are the same. In this study, enterprises participating in the BRI are considered the treatment group, while enterprises not participating in the BRI are considered the control group. In this way, this paper can determine the impact of the BRI on ESG performance by the treatment effect.
Furthermore, two-way fixed effects are often used to control for unobserved time-invariant heterogeneity (enterprise fixed effect) and common shocks or trends (year fixed effect) [43,44].
Formula (1) is a standard DID model with two-way fixed effects.
ESG it = α + β Treat i × Time t + γ X it + δ i + θ t + ε it
The dependent variable is the ESG performance of enterprise i in year t ; α is the intercept term; β represents the treatment effect of the BRI, with Treat and Time being the treatment and time dummy variables, respectively; X represents a set of control variables, and γ is their coefficients; and δ represents the enterprise fixed effect, θ represents the year fixed effect, and ε is a random error term.
The standard DID model is based on the assumption that all treated individuals are influenced simultaneously (enterprises in the control group respond to the BRI at the same time), which violates reality and is therefore not used as the baseline model in this paper, but rather as robustness tests (see Table A1, Table A2 and Table A3 in Appendix B). In the robustness tests, the years 2013, 2014, and 2015 are set as the time the BRI occurred, respectively.

4.2. Time-Varying DID Model

The timing of enterprises’ response to the BRI is heterogeneous [22,27,45], and Figure 1 shows the time distribution. The standard DID model assumes that all enterprises in the treatment group respond to the BRI at the same time and is therefore not appropriate.
To address the issue, this paper introduces the time-varying DID model (also known as DID with multiple time periods), whereby enterprises can be treated at different points in time [46]. The time-varying DID model allows for more precise capturing of the treatment effect of the BRI on ESG performance by realising heterogeneity in treatment time.
Consequently, the authors also identify the year (see Figure 1) that each enterprise in the treatment group begins to take practical actions to respond to the BRI by retrieving public information. It makes feasible to construct the time-varying DID model.
Formula (2) is a time-varying DID model with two-way fixed effects.
ESG it = α + β BRI it + γ X it + δ i + θ t + ε it
In this model, the treatment and time dummy variables are unified into one treatment variable (BRI), which can change over time for enterprises. The others are consistent with the model described above.
This paper uses the model to test Hypothesis 1 by using the overall sample (see Section 5.1) to test Hypotheses 2a to 2e by using the sub-samples classified by different mechanisms (see Section 5.2) and to test Hypotheses 3a to 3c by using the sub-samples classified by different characteristics of enterprises (see Section 5.3).

4.3. Triple-Difference Model

The DID model is based on the parallel trends assumption (PTA) (see Appendix A) that differences between treatment and control groups remain consistent over time in the absence of treatment [43,46]. On the assumption that the difference between the two groups has remained consistent in the past and that the difference becomes larger or smaller after external shocks, the change in the difference is the treatment effect.
However, the PTA is not always rigorously met in empirical studies, so the triple-difference (DDD) model is often used in order to relax this assumption [43,47]. The DDD model can transform the existing “differences in trends between the two groups” into controllable fixed effects by introducing the third difference dimension (enterprise characteristics in this study), thereby achieving causal identification under weaker conditions. Beyond this, the model is also used to capture heterogeneity by the coefficient of the triple interaction term [16,47,48].
Formula (3) is a time-varying DDD model with two-way fixed effects.
ESG it = α + β BRI it + ω BRI it × Third it + γ X it + δ i + θ t + ε it
The third variable is introduced in the model in combination with the treatment variable (BRI) to realise triple differences, and ω represents the difference in treatment generated by Third. The others are consistent with the model described above.
This paper uses the model to explore whether the heterogeneous effect exists in different characteristics of enterprises, further testing Hypotheses 3a, 3b, and 3c (see Section 5.3). In other words, three grouping variables (SOE, MFG, Market) are used as the third variable, respectively.
The authors wrote their own code to implement all of the above models in Stata 17.

5. Results

5.1. Principal Results

Table 2 presents the results of the time-varying DID model for the unbalanced panel dataset (as baseline results) and balanced panel dataset (as robustness tests), revealing the impact of the BRI on the ESG performance of Chinese listed enterprises.
For the baseline results (using the unbalanced panel dataset), column (1) shows that the estimated coefficient for the BRI is 0.207 (significant at the 1-percent level) excluding control variables, and column (2) shows that the value is 0.185 (significant at the 1-percent level) including control variables. These suggest that the BRI promotes ESG performance, supporting Hypothesis 1.
Furthermore, the balanced panel dataset is used as the robustness test to avoid selection bias which might be introduced by the unbalanced panel dataset, as shown in columns (3) and (4). These results are also significantly positive at the 1-percent level, supporting Hypothesis 1.
This paper also performs parallel trends assumption tests (Figure A1 and Figure A2 in Appendix A), robustness tests (Table A1, Table A2 and Table A3 in Appendix B), and placebo tests (Figure A3 and Figure A4 in Appendix C) to eliminate other interferences and further verify Hypothesis 1.
The parallel trends assumption (PTA) must be satisfied unless other techniques are employed to eliminate bias, whether using the standard DID model or the time-varying DID model [44,46].
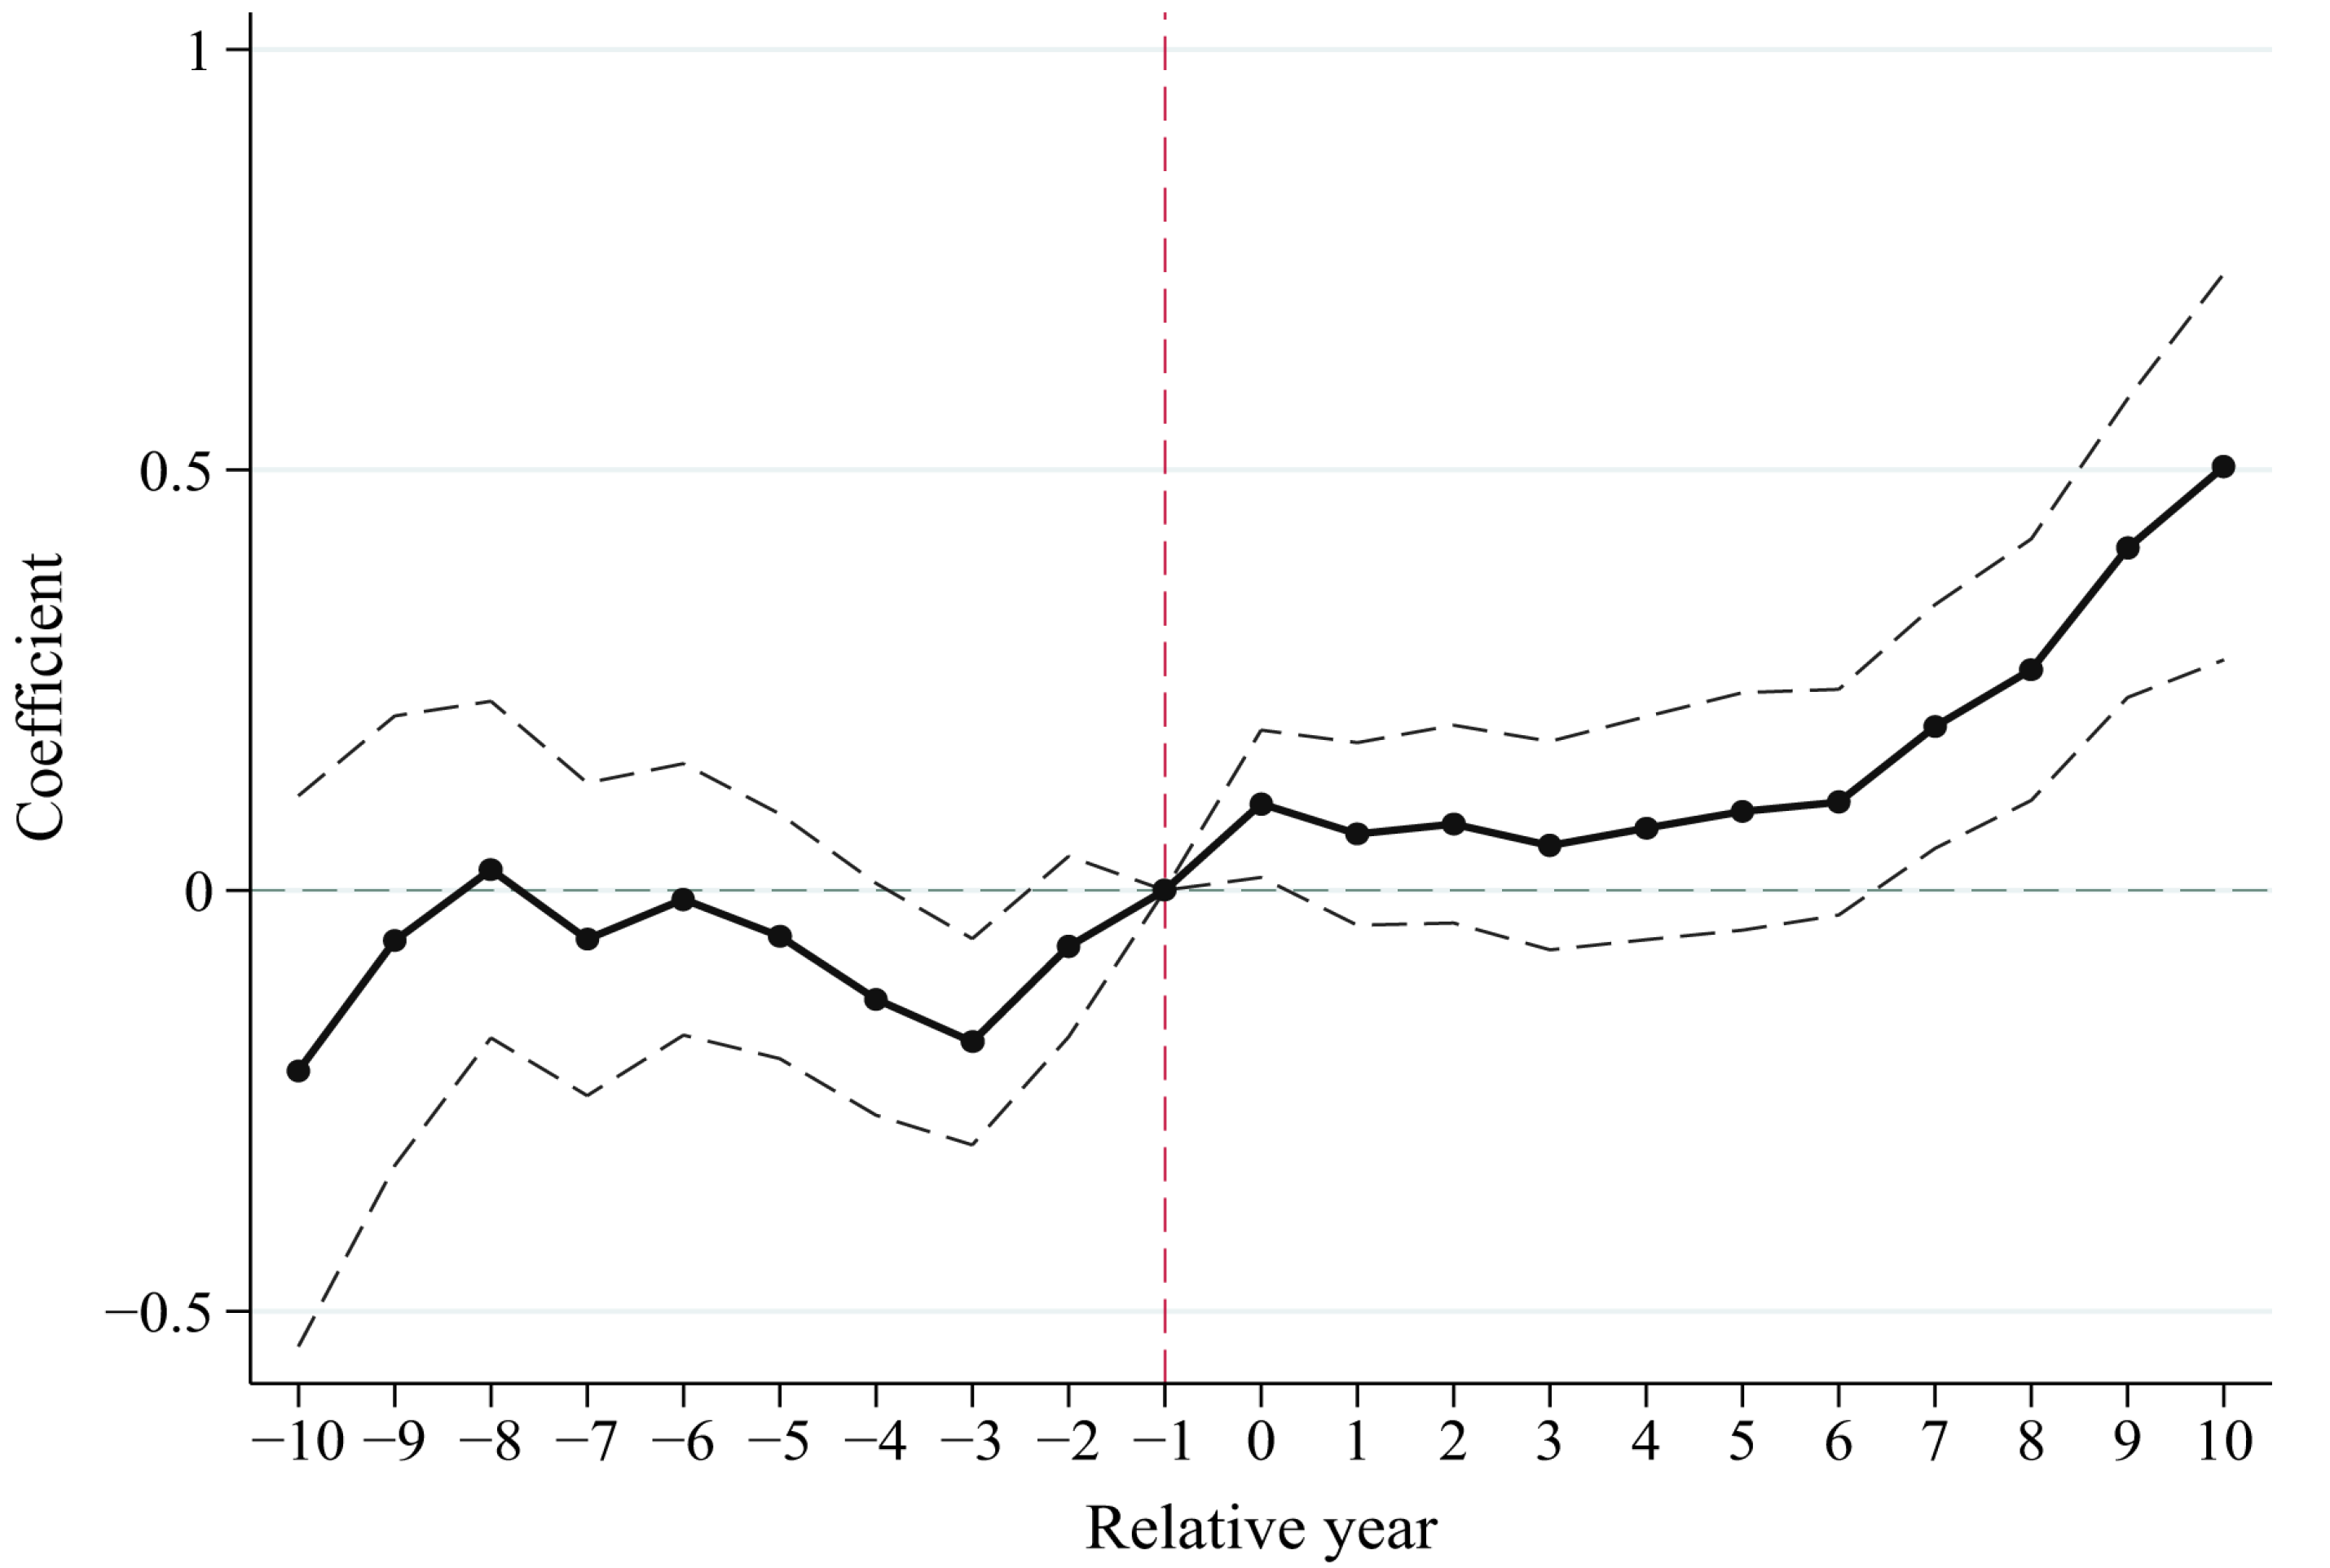
This paper tests the PTA for the time-varying DID model (see Figure A1 in Appendix A) using event-study estimates [46,49], and the result indicates that there is almost no significant difference between the treatment and control groups before the policy occurred. The only exception is a nuance (significant at the 5-percent level) in the previous three periods, and the upward trend exists potentially thereafter. This could be due to the preparatory phase of enterprises’ actions for the BRI. This paper more rigorously advances the time of policy by 1 to 10 periods in placebo tests later (see Figure A3 in Appendix C) and further employs the DDD model (see Section 5.3) to eliminate potential bias.
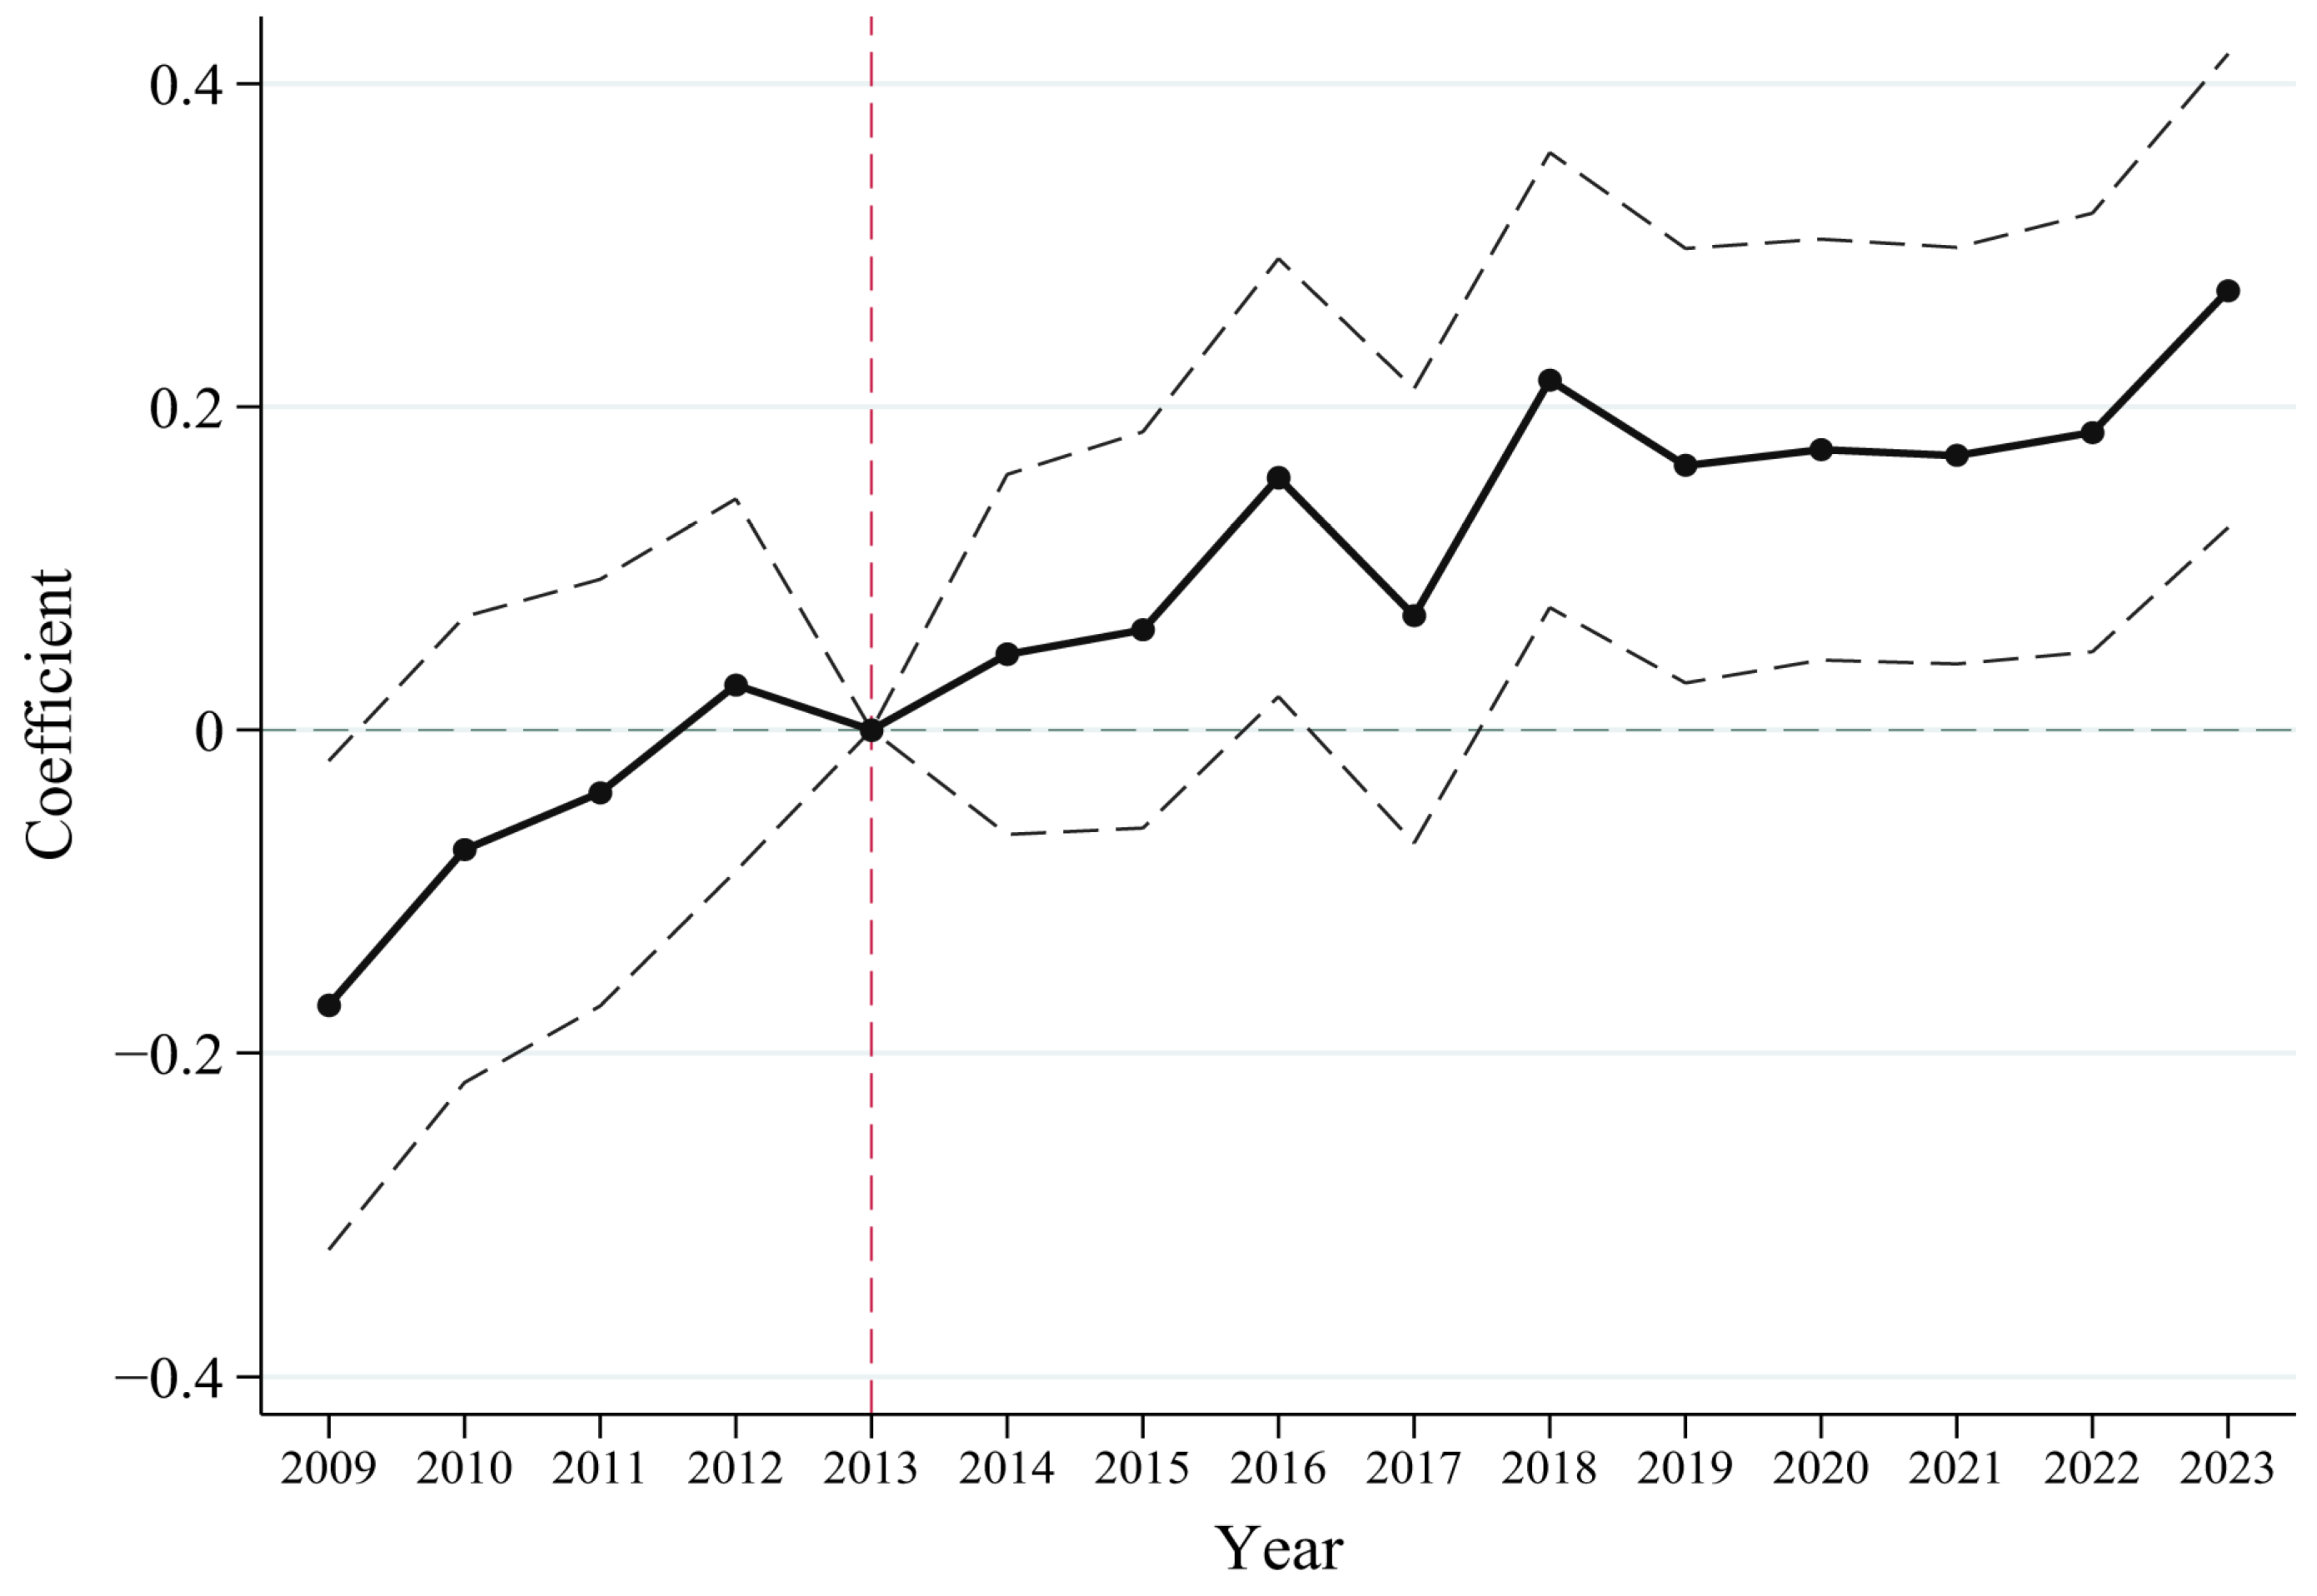
This paper also tests the PTA of the standard DID model (see Figure A2 in Appendix A), showing that the PTA cannot be well satisfied (an upward trend has existed since 2009) if all enterprises participating in the BRI are set to receive treatment from 2013. This further supports the time-varying DID model being more suitable than the standard DID model for evaluating the impact of the BRI on ESG performance.
Robustness tests are designed to determine the stability of the estimated coefficients under plausible changes to research methods [50]. This prevents researchers from manipulating research methods to obtain results that appear flashy but lack reliability.
Firstly, this paper is based on an essential assumption that enterprises participating in the BRI started receiving the treatment at different points in time. However, these time points are compiled by the authors through public information, which leaves room for manipulation. Therefore, this paper uses the standard DID model as robustness tests (see Table A1 in Appendix B), referencing Cheng et al. (2024) [7]. Although the BRI was proposed in 2013 (see columns 1 and 2), both 2014 (see columns 3 and 4) and 2015 (see columns 5 and 6) are also used as benchmark years for robustness tests as there is a lag in the policy. The estimated coefficients of the above models are all significantly positive at the 1-percent level, supporting Hypothesis 1 as well.
Secondly, the DID as a quasi-experimental method may introduce a self-selection bias; that is, the randomised controlled trial cannot be fully realised. Moreover, confounding variables can interfere with treatment effect estimation [43,51]. To address the above issues, the propensity matching score (PSM) is introduced in combination with DID models as robustness tests (see Table A2 in Appendix B). The results of the PSM-DID model are all significantly positive at the 1-percent level and approximate the estimated coefficients without the PSM, supporting Hypothesis 1 as well.
Thirdly, this paper performs additional robustness tests by restricting the sample to exclude other interference (see Table A3 in Appendix B). The test of the parallel trends assumption for the standard DID model (see Figure A2 in Appendix A) implies a trend difference between the treatment and control groups in 2009. Columns (1) and (3) of Table A3 show the results restricting the sample between 2010 and 2023 to exclude the disruption for 2009, which supports Hypothesis 1. Furthermore, COVID-19 has had wide-ranging impacts on the world economy since 2019. Column (2) presents the result restricting the sample between 2010 to 2018, avoiding disruptions from COVID-19, also supporting Hypothesis 1. Column (4) shows the result of a placebo test, which will be explained later.
Placebo tests are designed to verify that the treatment effect is indeed attributable to the policy by fictionalising treatment units or treatment times [52].
Column (4) of Table A3 in Appendix B shows the estimated coefficient where only the sample from 2010 to 2013 (when the BRI had not yet taken effect) is used and a spurious policy occurrence year, 2012, is chosen. And the result is not significant even at the 10-percent level.
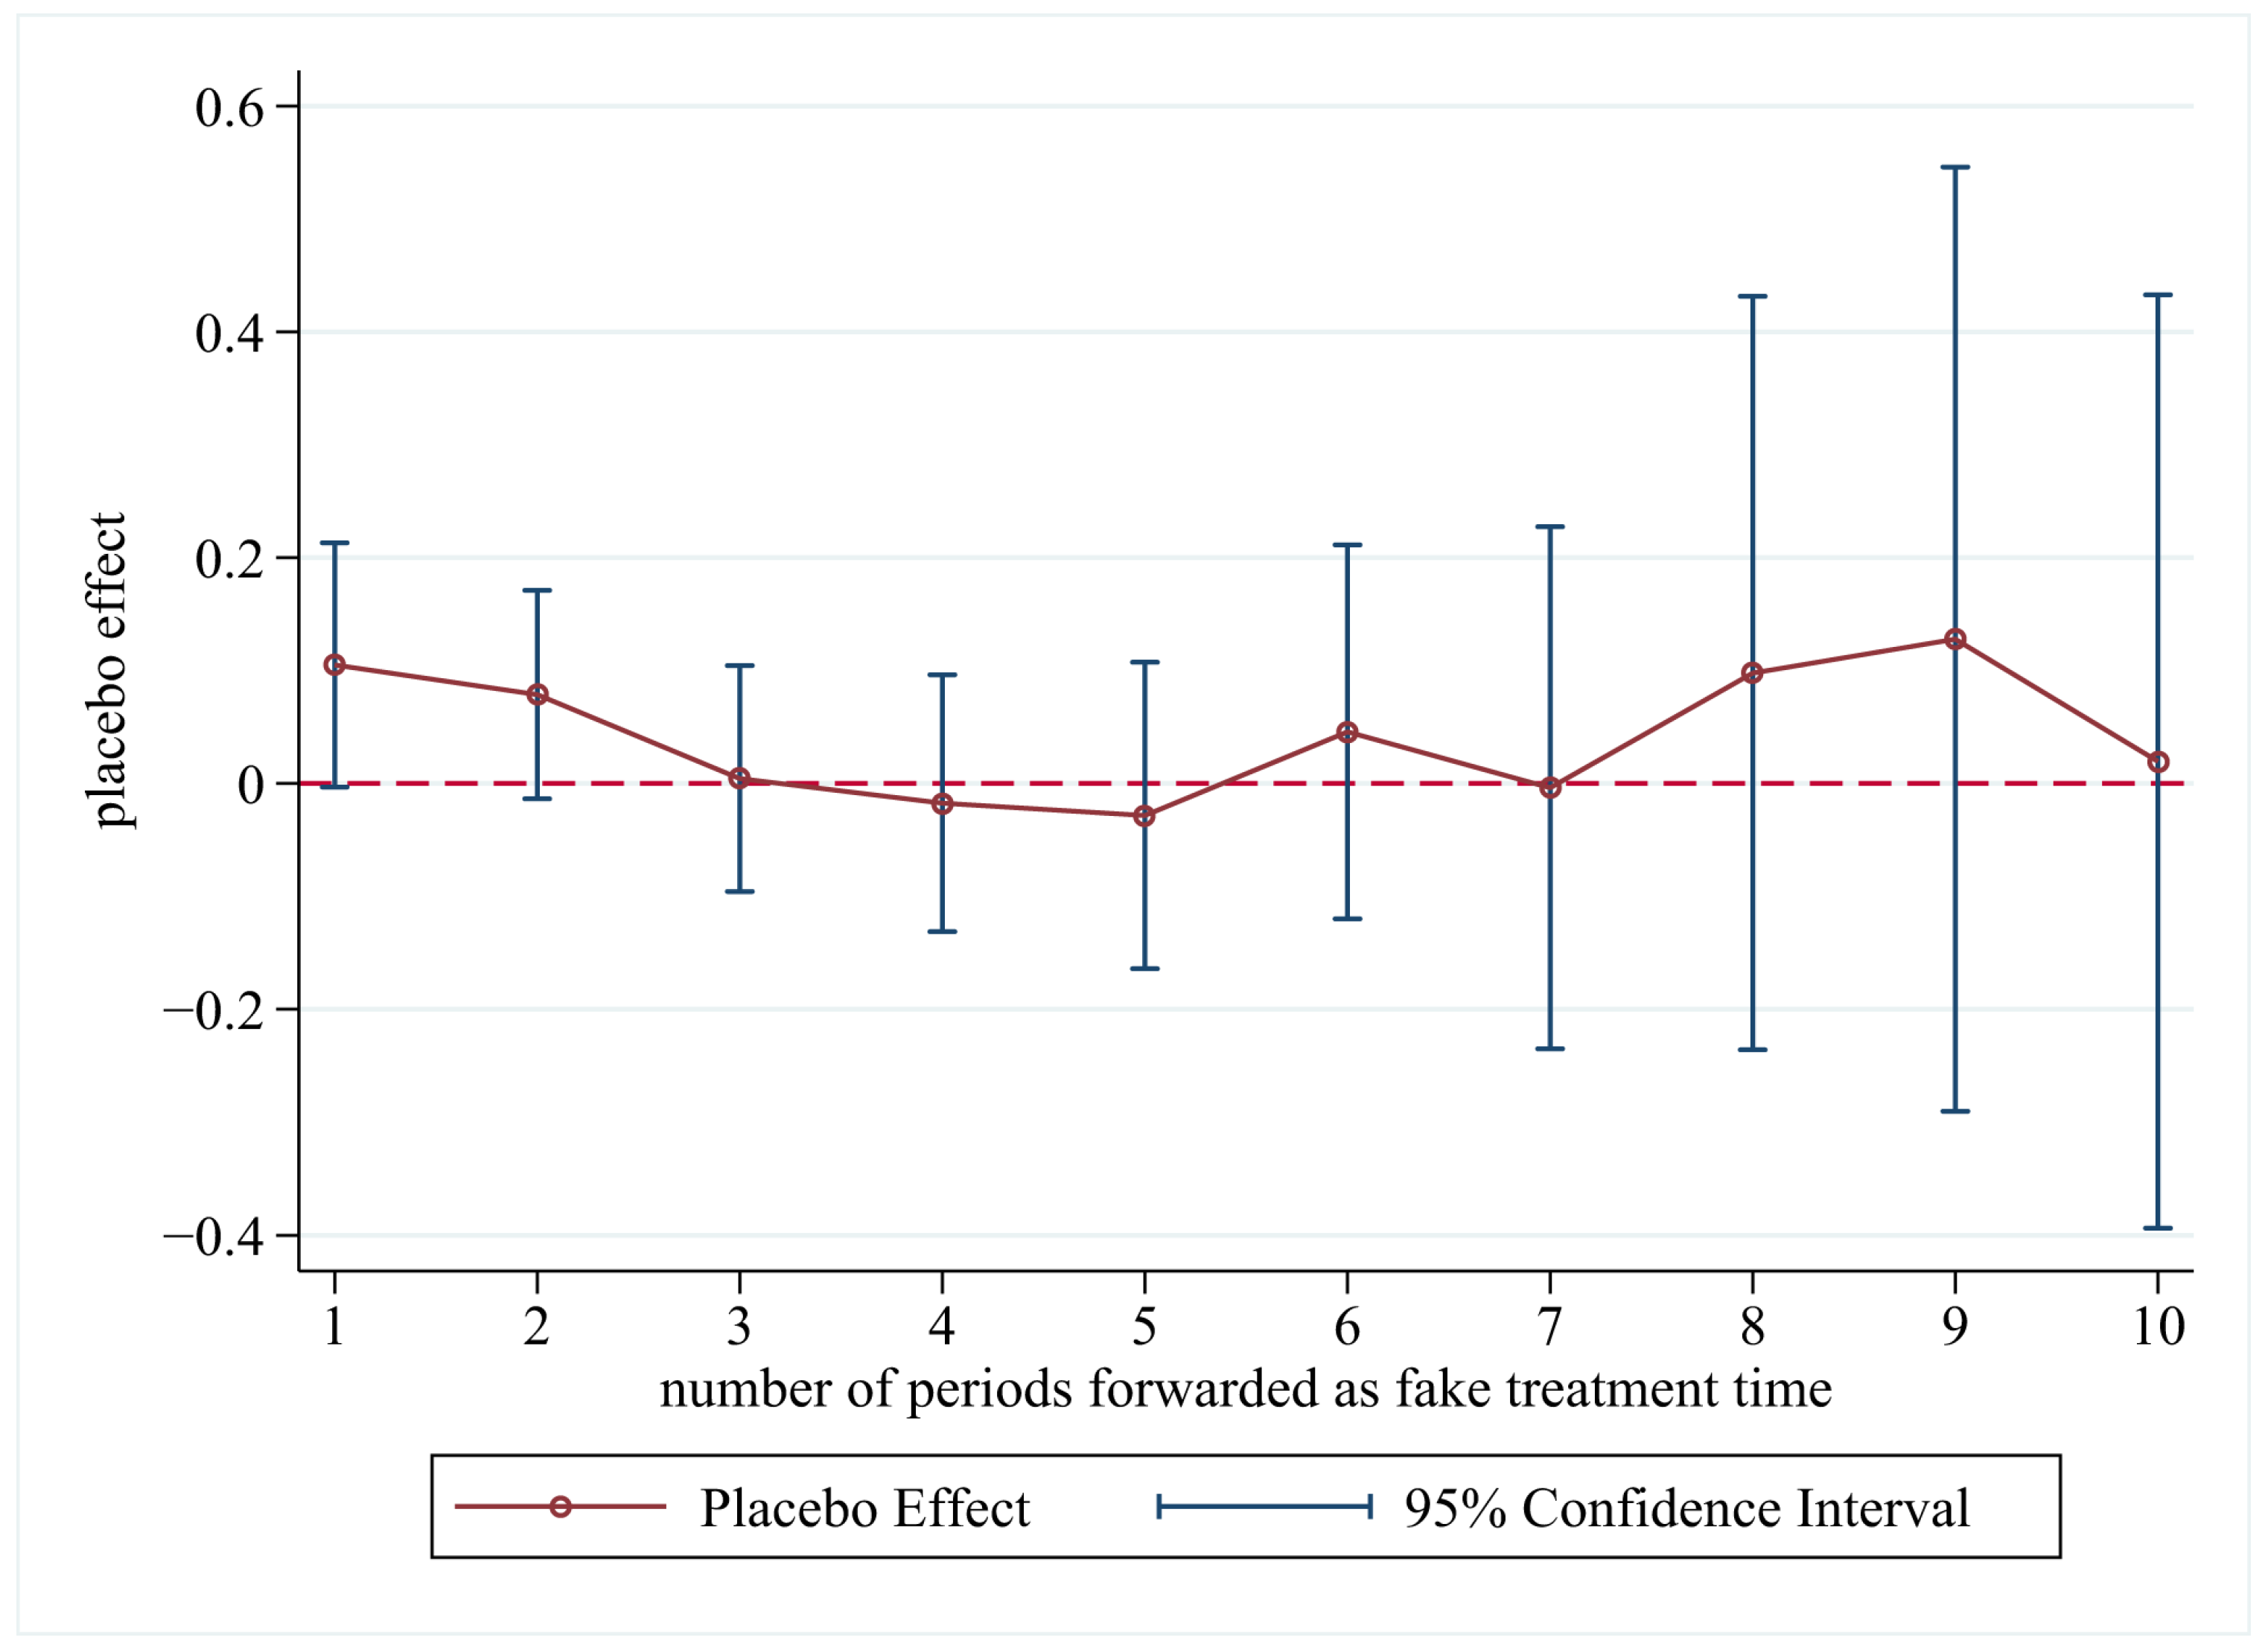
Furthermore, Figure A3 in Appendix C shows the placebo effect of advancing the start of treatment by 1 to 10 periods [52] for enterprises participating in the BRI. None of the results are significant at the 5-percent level. Figure A4 in Appendix C shows the distribution of treatment effects based on 500 times for random fictitious treatment units [52]. The result shows that the estimated coefficient 0.185 in the baseline model (see column 2 of Table 2) is an extreme event. The above results suggest that the promotion of ESG performance should be attributed to the BRI, supporting Hypothesis 1.

5.2. Mechanism Analysis

This paper focuses not only on the heterogeneity in the timing of enterprises’ participation in the BRI but also on the heterogeneity in the mechanisms of participation. This paper summarises the mechanisms through which enterprises participate in the BRI by dividing them into five categories and conducts subgroup analyses to identify the treatment effect of the different mechanisms (see Table 3).
Column (1) shows the treatment effect for OFDI, column (4) shows the treatment effect for exploring international markets, and column (5) shows the treatment effect for support services and others. None of the above results were significant even at the 10-percent level; therefore, Hypotheses 2a, 2d, and 2e remain unsubstantiated.
Column (2) shows the treatment effect for infrastructure projects, and column (3) shows the treatment effect for trade routes. Their estimated coefficients are significantly positive at the 1-percent level, supporting Hypotheses 2b and 2c. This suggests that the BRI primarily promotes the ESG performance of enterprises that are involved in international infrastructure projects and the development of trade routes. This is consistent with our expectations in Section 2. These two areas represent the core elements of the BRI [10,28] and trigger the vast majority of environmental concerns [14]. Consequently, the relevant enterprises are more susceptible to informal pressures from their home country and institutional pressures from their host countries to improve their ESG performance.

5.3. Heterogeneity Analysis

This paper also investigates the heterogeneous treatment effect of the BRI for different characteristics of enterprises, including SOEs or not, manufacturing or not, and listed on Main Board or others. Table 4 shows the results of the heterogeneity analysis by subgroup analyses based on different grouping variables.
Firstly, the heterogeneous treatment effect may exist between state-owned and non-state-owned enterprises [7,8,16]. Column (1) shows an estimated coefficient of 0.231 for state-owned enterprises (significant at the 1-percent level), and column (2) shows an estimated coefficient of 0.057 for non-state-owned enterprises (not significant even at the 10-percent level). The above results suggest that the BRI promotes the ESG performance of SOEs more than that of non-SOEs, supporting Hypothesis 3a. The heterogeneity stems from the following reasons: SOEs face greater government pressures, and having fewer financial pressures allows them to focus more on improving ESG performance.
Secondly, there may be differences in the treatment effects of the BRI between manufacturing and non-manufacturing enterprises [34,35,36,37]. Column (3) shows an estimated coefficient of 0.056 for manufacturing enterprises (not significant even at the 10-percent level), and column (4) shows an estimated coefficient of 0.358 for non-manufacturing enterprises (significant at the 1-percent level). The above results suggest that the BRI promotes the ESG performance of non-manufacturing enterprises more than that of manufacturing enterprises, supporting Hypothesis 3b. The heterogeneity stems from the following reasons: higher public expectations of ESG performance for non-manufacturing enterprises; manufacturing enterprises being more likely to move to countries with low environmental requirements to escape formal pressures from their home country.
Thirdly, the effect of the BRI on ESG performance is likely heterogeneous across enterprises of different sizes and stages of development [33,35,40,41]. This paper is divided into two groups based on the board on which companies are listed: enterprises listed on the Main Board (see column 5) are larger and more mature, and those listed on other boards (see column 6) are smaller and at earlier stages of development. Column (5) shows an estimated coefficient of 0.199 for enterprises listed on the Main Board (significant at the 1-percent level), and column (6) shows an estimated coefficient of 0.013 for enterprises listed on other boards (not significant even at the 10-percent level). The above results suggest that the BRI promotes the ESG performance of enterprises listed on the Main Board more than that of enterprises on other boards, supporting Hypothesis 3c. The heterogeneity stems from the following reasons: larger and more mature enterprises face more government pressures and public expectations for ESG performance.
To further capture heterogeneous treatment effects in different characteristics of enterprises and to relax the PTA [16,43,47,48], the DDD model is also employed (see Formula (3)). Table 5 shows the results of the time-varying DDD model, by introducing the three factors mentioned above as the third independent variable, respectively.
Column (1) presents the triple-difference estimate 0.249 (significant at the 1-percent level) for state-owned and non-state-owned enterprises. This indicates that the BRI promotes the ESG performance of SOEs more than that of non-SOEs, further supporting Hypothesis 3a.
Column (2) presents the triple-difference estimate negative 0.227 (significant at the 1-percent level) for manufacturing and non-manufacturing enterprises. This indicates that the BRI promotes the ESG performance of non-manufacturing enterprises more than that of manufacturing enterprises, further supporting Hypothesis 3b.
Column (3) presents the triple-difference estimate 0.244 (significant at the 5-percent level) for enterprises listed on the Main Board and other boards. This indicates that the BRI promotes the ESG performance of enterprises listed on the Main Board more than that of enterprises on other boards, further supporting Hypothesis 3c.

6. Conclusions and Discussion

This paper validates the heterogeneous treatment effect of the BRI on the ESG performance of Chinese listed enterprises, based on the time-varying DID and DDD models. This paper has three notable research contributions.
Firstly, this paper removes an implausible assumption in many studies targeting the BRI [4,7,16], namely, that the timing of enterprises’ participation in the BRI is homogeneous. The time-varying DID model is used to cope with enterprises starting to respond to the BRI at different points in time. The results powerfully validate that the BRI promotes the ESG performance of participating enterprises by formal and informal pressures.
Secondly, this paper reveals that enterprises participate in the BRI through different mechanisms and there is heterogeneity in treatment effects across different mechanisms. The results suggest that the BRI promotes the ESG performance of enterprises involved in international infrastructure projects and the development of trade routes. However, it has no significant impact on enterprises involved in outward foreign direct investment, exploring international markets, and providing support services and others. This is because international infrastructure projects and the development of trade routes are seen as critical elements of the BRI [10,28]. They represent the image of the BRI and raise major concerns regarding the environmental impacts of the BRI, so the government has adopted more vigorous policies and non-institutional means to urge the enterprises involved [10,14]. The other three types of enterprises lack such government incentives.
Last but not least, the heterogeneity analysis provides information on the heterogeneous treatment effect of the BRI across enterprises with different characteristics through the DDD model. The BRI promotes the ESG performance of state-owned enterprises more than that of non-SOEs, since SOEs have to strictly comply with government guidelines and have less financial pressure, being given funding by the government [16,19,32]. The BRI promotes the ESG performance of non-manufacturing enterprises more than that of manufacturing enterprises, since manufacturing enterprises have fewer public expectations for improving ESG performance and prefer to utilise the pollution haven hypothesis to escape formal pressures from their home country [34,35,36,37,38,39]. The BRI promotes the ESG performance of enterprises on the Main Board more than that of enterprises on other boards, since larger and more mature enterprises have more financial capacity, public expectations, and government pressures to improve ESG performance [33,34,40,41].
These findings not only provide the micro-level empirical evidence of the performance of the BRI in implementing sustainable development but also benefit policymakers and enterprise managers. Policymakers can use formal and informal pressures more effectively and harmlessly to promote the ESG performance of enterprises. Enterprise managers do need to recognise that government pressures and public expectations are increasingly stringent, and the proactive adoption of ESG practices is essential.

Author Contributions

Conceptualisation, W.Z. and O.B.; methodology, W.Z.; software, W.Z.; validation, W.Z. and O.B.; formal analysis, W.Z.; resources, W.Z. and O.B.; data curation, W.Z.; writing—original draft preparation, W.Z. and O.B.; writing—review and editing, W.Z. and O.B.; visualisation, W.Z.; supervision, O.B.; project administration, O.B.; funding acquisition, W.Z. All authors have read and agreed to the published version of the manuscript.

Funding

The authors acknowledge financial support from the China Scholarship Council under Grant No. 202308091620 and the Russian Government Scholarship under Grant No. CHN-0318/23.

Institutional Review Board Statement

Not applicable.

Informed Consent Statement

Not applicable.

Data Availability Statement

The main data used in this study are available in the Wind database and the China Stock Market and Accounting Research (CSMAR) database. Other data and code can be provided by the authors upon request.

Acknowledgments

This article is the output of a research project implemented as a part of the Basic Research Program at HSE University.

Conflicts of Interest

The authors declare no conflicts of interest.

Abbreviations

The following abbreviations are used in this manuscript:
ESGEnvironmental, social, and governance
SDGsSustainable Development Goals
BRIBelt and Road Initiative
SOEsState-owned enterprises
DIDDifference in differences
DDDTriple difference
OFDIOutward foreign direct investment
CSRCorporate social responsibility
PTAParallel trends assumption

Appendix A

This appendix shows the results from testing the parallel trends assumption using event-study estimates for the time-varying DID model (Figure A1) and standard DID model (Figure A2).
Figure A1. Test of the parallel trends assumption (time-varying DID model). Note: The horizontal axis shows the relative year (relative to the year that enterprises began responding to the BRI), and the vertical axis shows the estimated coefficients (base period is −1). The dashed lines are the 95% confidence intervals. For data prior to −10, winsorisation is performed to −10.
Sustainability 17 02776 g0a1
Figure A2. Test of the parallel trends assumption (standard DID model). Note: The horizontal axis shows the calendar year, and the vertical axis shows the estimated coefficients (base period is 2013). The dashed lines are the 95% confidence intervals.
Sustainability 17 02776 g0a2

Appendix B

Table A1. Results for robustness tests using the standard DID model.
Dependent Variable: ESGTime ≥ 2013Time ≥ 2014Time ≥ 2015
(1)(2)(3)(4)(5)(6)
Treat × Time0.216 ***
(0.048)
0.192 ***
(0.048)
0.216 ***
(0.045)
0.194 ***
(0.045)
0.212 ***
(0.043)
0.189 ***
(0.042)
Constant4.123 ***
(0.004)
0.067
(0.433)
4.124 ***
(0.003)
0.069
(0.433)
4.126 ***
(0.003)
0.071
(0.433)
Control variablesNoYesNoYesNoYes
Enterprise FEYesYesYesYesYesYes
Year FEYesYesYesYesYesYes
Observations43,48443,48443,48443,48443,48443,484
Adj R20.38830.40710.38840.40730.38850.4073
Note: *** p < 0.01. Robust standard errors for clustering at the enterprise level are in parentheses.
Table A2. Results for robustness tests using the PSM-DID model.
Dependent Variable: ESGTime-Varying PSM-DIDStandard PSM-DID
≥2013≥2014≥2015
(1)(2)(3)(4)
BRI0.179 ***
(0.040)
Treat × Time 0.185 ***
(0.048)
0.184 ***
(0.045)
0.179 ***
(0.043)
Constant0.030
(0.438)
0.032
(0.438)
0.030
(0.438)
0.030
(0.438)
Control variablesYesYesYesYes
Enterprise FEYesYesYesYes
Year FEYesYesYesYes
Observations42,49442,49442,49442,494
Adj R20.40860.40840.40850.4086
Note: *** p < 0.01. Robust standard errors for clustering at the enterprise level are in parentheses. The above results are obtained after year-by-year 1:2 nearest-neighbour matching, which satisfies both the common support test and the balancing test.
Table A3. Additional robustness tests.
Dependent Variable: ESGTime-Varying DIDStandard DID
Restricted to 2010–2023 (Avoiding Disruptions from an Ex-Ante Trend in 2009)Restricted to 2010–2018 (Further Avoiding Disruptions from COVID-19)Restricted to 2010–2023
(Time ≥ 2013)
Placebo Test
(Time = 0 if 2010–2011;
Time = 1 if 2012–2013)
(1)(2)(3)(4)
BRI0.165 ***
(0.040)
0.197 ***
(0.050)
Treat×Time 0.164 ***
(0.049)
0.072
(0.051)
Constant−0.071
(0.452)
1.588 **
(0.674)
−0.078
(0.452)
−0.283
(1.398)
Control variablesYesYesYesYes
Enterprise FEYesYesYesYes
Year FEYesYesYesYes
Observations42,11721,30342,1177906
Adj R20.41190.50310.41170.5376
Note: *** p < 0.01, ** p < 0.05. Robust standard errors for clustering at the enterprise level are in parentheses.

Appendix C

This appendix shows the results of placebo tests performed according to Chen et al. (2025) [52]. Figure A3 is the result of an in-time placebo test (using fake treatment times) by advancing the start of treatment by 1 to 10 periods for enterprises participating in the BRI. Figure A4 is the result of an in-space placebo test (using fake treatment units) based on 500 times for random fictitious treatment units, where the red vertical line represents an estimated coefficient of 0.185 in the baseline model.
Figure A3. Result of in-time placebo test.
Sustainability 17 02776 g0a3
Figure A4. Result of in-space placebo test.
Sustainability 17 02776 g0a4

References

  1. State Council of China. The Belt and Road Initiative: A Key Pillar of the Global Community of Shared Future. Available online: http://english.scio.gov.cn/whitepapers/2023-10/10/content_116735061.htm (accessed on 3 January 2025).
  2. United Nations. Progress Report on the Belt and Road Initiative in Support of the United Nations 2030 Agenda for Sustainable Development. Available online: https://www.un.org/sites/un2.un.org/files/progress_report_bri-sdgs_english-final.pdf (accessed on 3 January 2025).
  3. Maliszewska, M.; van der Mensbrugghe, D. The Belt and Road Initiative: Economic, Poverty and Environmental Impacts; World Bank Policy Research Working Paper 8814; World Bank: Washington, DC, USA, 2019. [Google Scholar] [CrossRef]
  4. Cao, X.; Li, P.; Li, S.; Zhang, H.; Qin, M. The Belt and Road Initiative, public health expenditure and economic growth: Evidence from quasi-natural experiments. Int. J. Environ. Res. Public Health 2022, 19, 16234. [Google Scholar] [CrossRef] [PubMed]
  5. Xie, N.; Chen, A.; Wang, X.; Zhang, X. Does the BRI contribute to poverty reduction in countries along the Belt and Road? A DID-based empirical test. Humanit. Soc. Sci. Commun. 2023, 10, 872. [Google Scholar] [CrossRef]
  6. Sattar, A.; Hussain, M.N.; Ilyas, M. An impact evaluation of Belt and Road Initiative (BRI) on environmental degradation. Sage Open 2022, 12, 21582440221078836. [Google Scholar] [CrossRef]
  7. Cheng, Q.; Cai, X.; Liu, B. The Belt and Road Initiative and ESG performance of the enterprises. Int. Econ. Trade Res. 2024, 40, 58–74. (In Chinese) [Google Scholar] [CrossRef]
  8. Khalid, F.; Sun, J.; Huang, G.; Su, C.Y. Environmental, social and governance performance of Chinese multinationals: A comparison of state-and non-state-owned enterprises. Sustainability 2021, 13, 4020. [Google Scholar] [CrossRef]
  9. Fang, K.; Xu, A.; Wang, S.; Jia, X.; Liao, Z.; Tan, R.R.; Sun, H.; Su, F. Progress towards sustainable development goals in the Belt and Road Initiative countries. J. Clean. Prod. 2023, 424, 138808. [Google Scholar] [CrossRef]
  10. Lewis, D.J.; Yang, X.; Moise, D.; Roddy, S.J. Dynamic synergies between China’s Belt and Road Initiative and the UN’s sustainable development goals. J. Int. Bus. Policy 2021, 4, 58–79. [Google Scholar] [CrossRef]
  11. Li, C.; Wan, Y.; Xu, Z.; Fan, X.; Shuai, C.; Yu, X.; Tan, Y. Impacts and pathways of the Belt and Road Initiative on sustainable development goals of the involved countries. Sustain. Dev. 2024, 32, 2976–2989. [Google Scholar] [CrossRef]
  12. Kydyrbek, F.; Hor, K.W.C.; Baikushikova, G.; Kukeyeva, F.; Augan, M. Understanding China’s Belt and Road Initiative and SDG 7 from an international relations perspective: The case of Kazakhstan. China WTO Rev. 2024, 10, 84–97. [Google Scholar]
  13. Senadjki, A.; Bashir, M.J.; AuYong, H.N.; Awal, I.M.; Chan, J.H. Pathways to sustainability: How China’s Belt and Road Initiative is shaping responsible production and consumption in Africa. Environ. Sci. Pollut. Res. 2024, 31, 1468–1487. [Google Scholar] [CrossRef]
  14. Bohnett, E.; Coulibaly, A.; Hulse, D.; Hoctor, T.; Ahmad, B.; An, L.; Lewison, R. Corporate responsibility and biodiversity conservation: Challenges and opportunities for companies participating in China’s Belt and Road Initiative. Environ. Conserv. 2022, 49, 42–52. [Google Scholar] [CrossRef]
  15. Zhang, R.; Noronha, C.; Guan, J. CSR Reporting and the Belt and Road Initiative: Implementation by Chinese Multinational Enterprises, 1st ed.; Routledge: London, UK, 2023. [Google Scholar] [CrossRef]
  16. Yang, N.; Wang, J.; Liu, X.; Huang, L. Home-country institutions and corporate social responsibility of emerging economy multinational enterprises: The Belt and Road Initiative as an example. Asia Pac. J. Manag. 2022, 39, 927–965. [Google Scholar] [CrossRef]
  17. Shu, Y.; Zhuang, X.; Xu, G.; Zhang, S.; Ying, R. Peer effects, environmental regulation and environmental financial integration—Empirical evidence from listed companies in heavily polluting industries. Econ. Anal. Policy 2024, 82, 1446–1458. [Google Scholar] [CrossRef]
  18. Peng, P.; Sun, M. Government subsidies and corporate environmental, social and governance performance: Evidence from companies of China. Int. Stud. Econ. 2024, 19, 374–405. [Google Scholar] [CrossRef]
  19. Bai, X.; Han, J.; Ma, Y.; Zhang, W. ESG performance, institutional investors’ preference and financing constraints: Empirical evidence from China. Borsa Istanb. Rev. 2022, 22, 157–168. [Google Scholar] [CrossRef]
  20. Nicolas, M.L.; Desroziers, A.; Caccioli, F.; Aste, T. ESG reputation risk matters: An event study based on social media data. Financ. Res. Lett. 2024, 59, 104712. [Google Scholar] [CrossRef]
  21. Wang, L.; Cheng, Z. Impact of the Belt and Road Initiative on enterprise green transformation. J. Clean. Prod. 2024, 468, 143043. [Google Scholar] [CrossRef]
  22. Li, B.; Zhang, Z.; Zhang, Z. The impact of the Belt and Road Initiative on green innovation and innovation modes: Empirical evidence from Chinese listed enterprises. Front. Environ. Sci. 2024, 11, 1323888. [Google Scholar] [CrossRef]
  23. Long, H.; Feng, G.F.; Chang, C.P. How does ESG performance promote corporate green innovation? Econ. Change Restruct. 2023, 56, 2889–2913. [Google Scholar] [CrossRef]
  24. Wu, Y.; Ivashkovskaya, I.; Besstremyannaya, G.; Liu, C. Unlocking green innovation potential amidst digital transformation challenges—The evidence from ESG transformation in China. Sustainability 2025, 17, 309. [Google Scholar] [CrossRef]
  25. Brink, T.T. Chinese firms ‘going global’: Recent OFDI trends, policy support and international implications. Int. Politics 2015, 52, 666–683. [Google Scholar] [CrossRef]
  26. Zou, L.; Shen, J.H.; Zhang, J.; Lee, C.C. What is the rationale behind China’s infrastructure investment under the Belt and Road Initiative. J. Econ. Surv. 2022, 36, 605–633. [Google Scholar] [CrossRef]
  27. Zhi, Y.; Li, Z.; Luo, C. Does “Going Global” help to restrain enterprises’ financialization: The Belt and Road initiative as a quasi-natural experiment. China Econ. Q. Int. 2024, 4, 69–81. [Google Scholar] [CrossRef]
  28. Ng, C.Y.; Wu, Y.; Zhang, W.; Jigeer, S.; Zhang, J.; Yu, H. China-Russia cooperation in the Northern Sea Route development. Int. Organ. Res. J. 2025, 20, 1. [Google Scholar]
  29. Choi, K.S. The current status and challenges of China Railway Express (CRE) as a key sustainability policy component of the Belt and Road Initiative. Sustainability 2021, 13, 5017. [Google Scholar] [CrossRef]
  30. Görg, H.; Mao, H. Does the Belt and Road Initiative stimulate Chinese exports? Evidence from micro data. World Econ. 2022, 45, 2084–2100. [Google Scholar] [CrossRef]
  31. Petry, J. Beyond ports, roads and railways: Chinese economic statecraft, the Belt and Road Initiative and the politics of financial infrastructures. Eur. J. Int. Relat. 2023, 29, 319–351. [Google Scholar] [CrossRef]
  32. Hao, Y.; Wu, W. Environment, social, and governance performance and corporate financing constraints. Financ. Res. Lett. 2024, 62, 105083. [Google Scholar] [CrossRef]
  33. Meng, X.H.; Zeng, S.X.; Tam, C.M. From voluntarism to regulation: A study on ownership, economic performance and corporate environmental information disclosure in China. J. Bus. Ethics 2013, 116, 217–232. [Google Scholar] [CrossRef]
  34. Li, H.; Guo, H.; Hao, X.; Zhang, X. The ESG rating, spillover of ESG ratings, and stock return: Evidence from Chinese listed firms. Pac.-Basin Financ. J. 2023, 80, 102091. [Google Scholar] [CrossRef]
  35. Popescu, C.E.; Pentescu, A.; Shivarov, A. Sustainability, ESG ratings and corporate performance in the manufacturing sector: A research review. Eur. J. Interdiscip. Stud. 2023, 15, 186–209. [Google Scholar] [CrossRef]
  36. Yang, J.; Zuo, Z.; Li, Y.; Guo, H. Manufacturing enterprises move towards sustainable development: ESG performance, market-based environmental regulation, and green technological innovation. J. Environ. Manag. 2024, 372, 123244. [Google Scholar] [CrossRef] [PubMed]
  37. Deng, X.; Cheng, X. Can ESG indices improve the enterprises’ stock market performance?—An empirical study from China. Sustainability 2019, 11, 4765. [Google Scholar] [CrossRef]
  38. Long, W.; Luo, L.; Sun, H.; Zhong, Q. Does going abroad lead to going green? Firm outward foreign direct investment and domestic environmental performance. Bus. Strategy Environ. 2023, 32, 484–498. [Google Scholar] [CrossRef]
  39. Bashir, M.F. Discovering the evolution of Pollution Haven Hypothesis: A literature review and future research agenda. Environ. Sci. Pollut. Res. 2022, 29, 48210–48232. [Google Scholar] [CrossRef]
  40. Chen, F.; Liu, Y.H.; Chen, X.Z. ESG performance and business risk—Empirical evidence from China’s listed companies. Innov. Green Dev. 2024, 3, 100142. [Google Scholar] [CrossRef]
  41. Jung, H.; Bae, J.; Kim, H. The effect of corporate social responsibility and corporate social irresponsibility: Why company size matters based on consumers’ need for self-expression. J. Bus. Res. 2022, 146, 146–154. [Google Scholar] [CrossRef]
  42. Sino-Securities Index Information Service (Shanghai) Co., Ltd. Sino-Securities Index ESG Ratings Methodology (Version 2.1). Available online: https://www.chindices.com/esg-ratings.html (accessed on 15 March 2025).
  43. Chen, Q. Advanced Econometrics and Stata Application, 2nd ed.; Higher Education Press: Beijing, China, 2008. (In Chinese) [Google Scholar]
  44. Kotyrlo, E. Simple and complex difference-in-differences approach. Appl. Econom. 2024, 73, 119–142. [Google Scholar] [CrossRef]
  45. Wang, S.; Zhang, M.; Chen, F. Unveiling the impact of Belt and Road Initiative on green innovation: Empirical evidence from Chinese manufacturing enterprises. Environ. Sci. Pollut. Res. 2023, 30, 88213–88232. [Google Scholar] [CrossRef]
  46. Callaway, B.; Sant’Anna, P.H. Difference-in-differences with multiple time periods. J. Econom. 2021, 225, 200–230. [Google Scholar] [CrossRef]
  47. Olden, A.; Møen, J. The triple difference estimator. Econom. J. 2022, 25, 531–553. [Google Scholar] [CrossRef]
  48. Wu, L.; Liu, S.; Qi, L.; Lin, D. Mandatory disclosure and corporate ESG performance: Evidence from China’s “explanation for nondisclosure” requirement. Corp. Soc. Responsib. Environ. Manag. 2025, 32, 176–191. [Google Scholar] [CrossRef]
  49. Roth, J. Pretest with caution: Event-study estimates after testing for parallel trends. Am. Econ. Rev. Insights 2022, 4, 305–322. [Google Scholar] [CrossRef]
  50. Neumayer, E.; Plümper, T. Robustness Tests for Quantitative Research; Cambridge University Press: Cambridge, UK, 2017. [Google Scholar] [CrossRef]
  51. Caliendo, M.; Kopeinig, S. Some practical guidance for the implementation of propensity score matching. J. Econ. Surv. 2008, 22, 31–72. [Google Scholar] [CrossRef]
  52. Chen, Q.; Qi, J.; Yan, G. Placebo tests for difference-in-differences: A practical guide. J. Manag. World 2025, 41, 181–203. (In Chinese) [Google Scholar] [CrossRef]
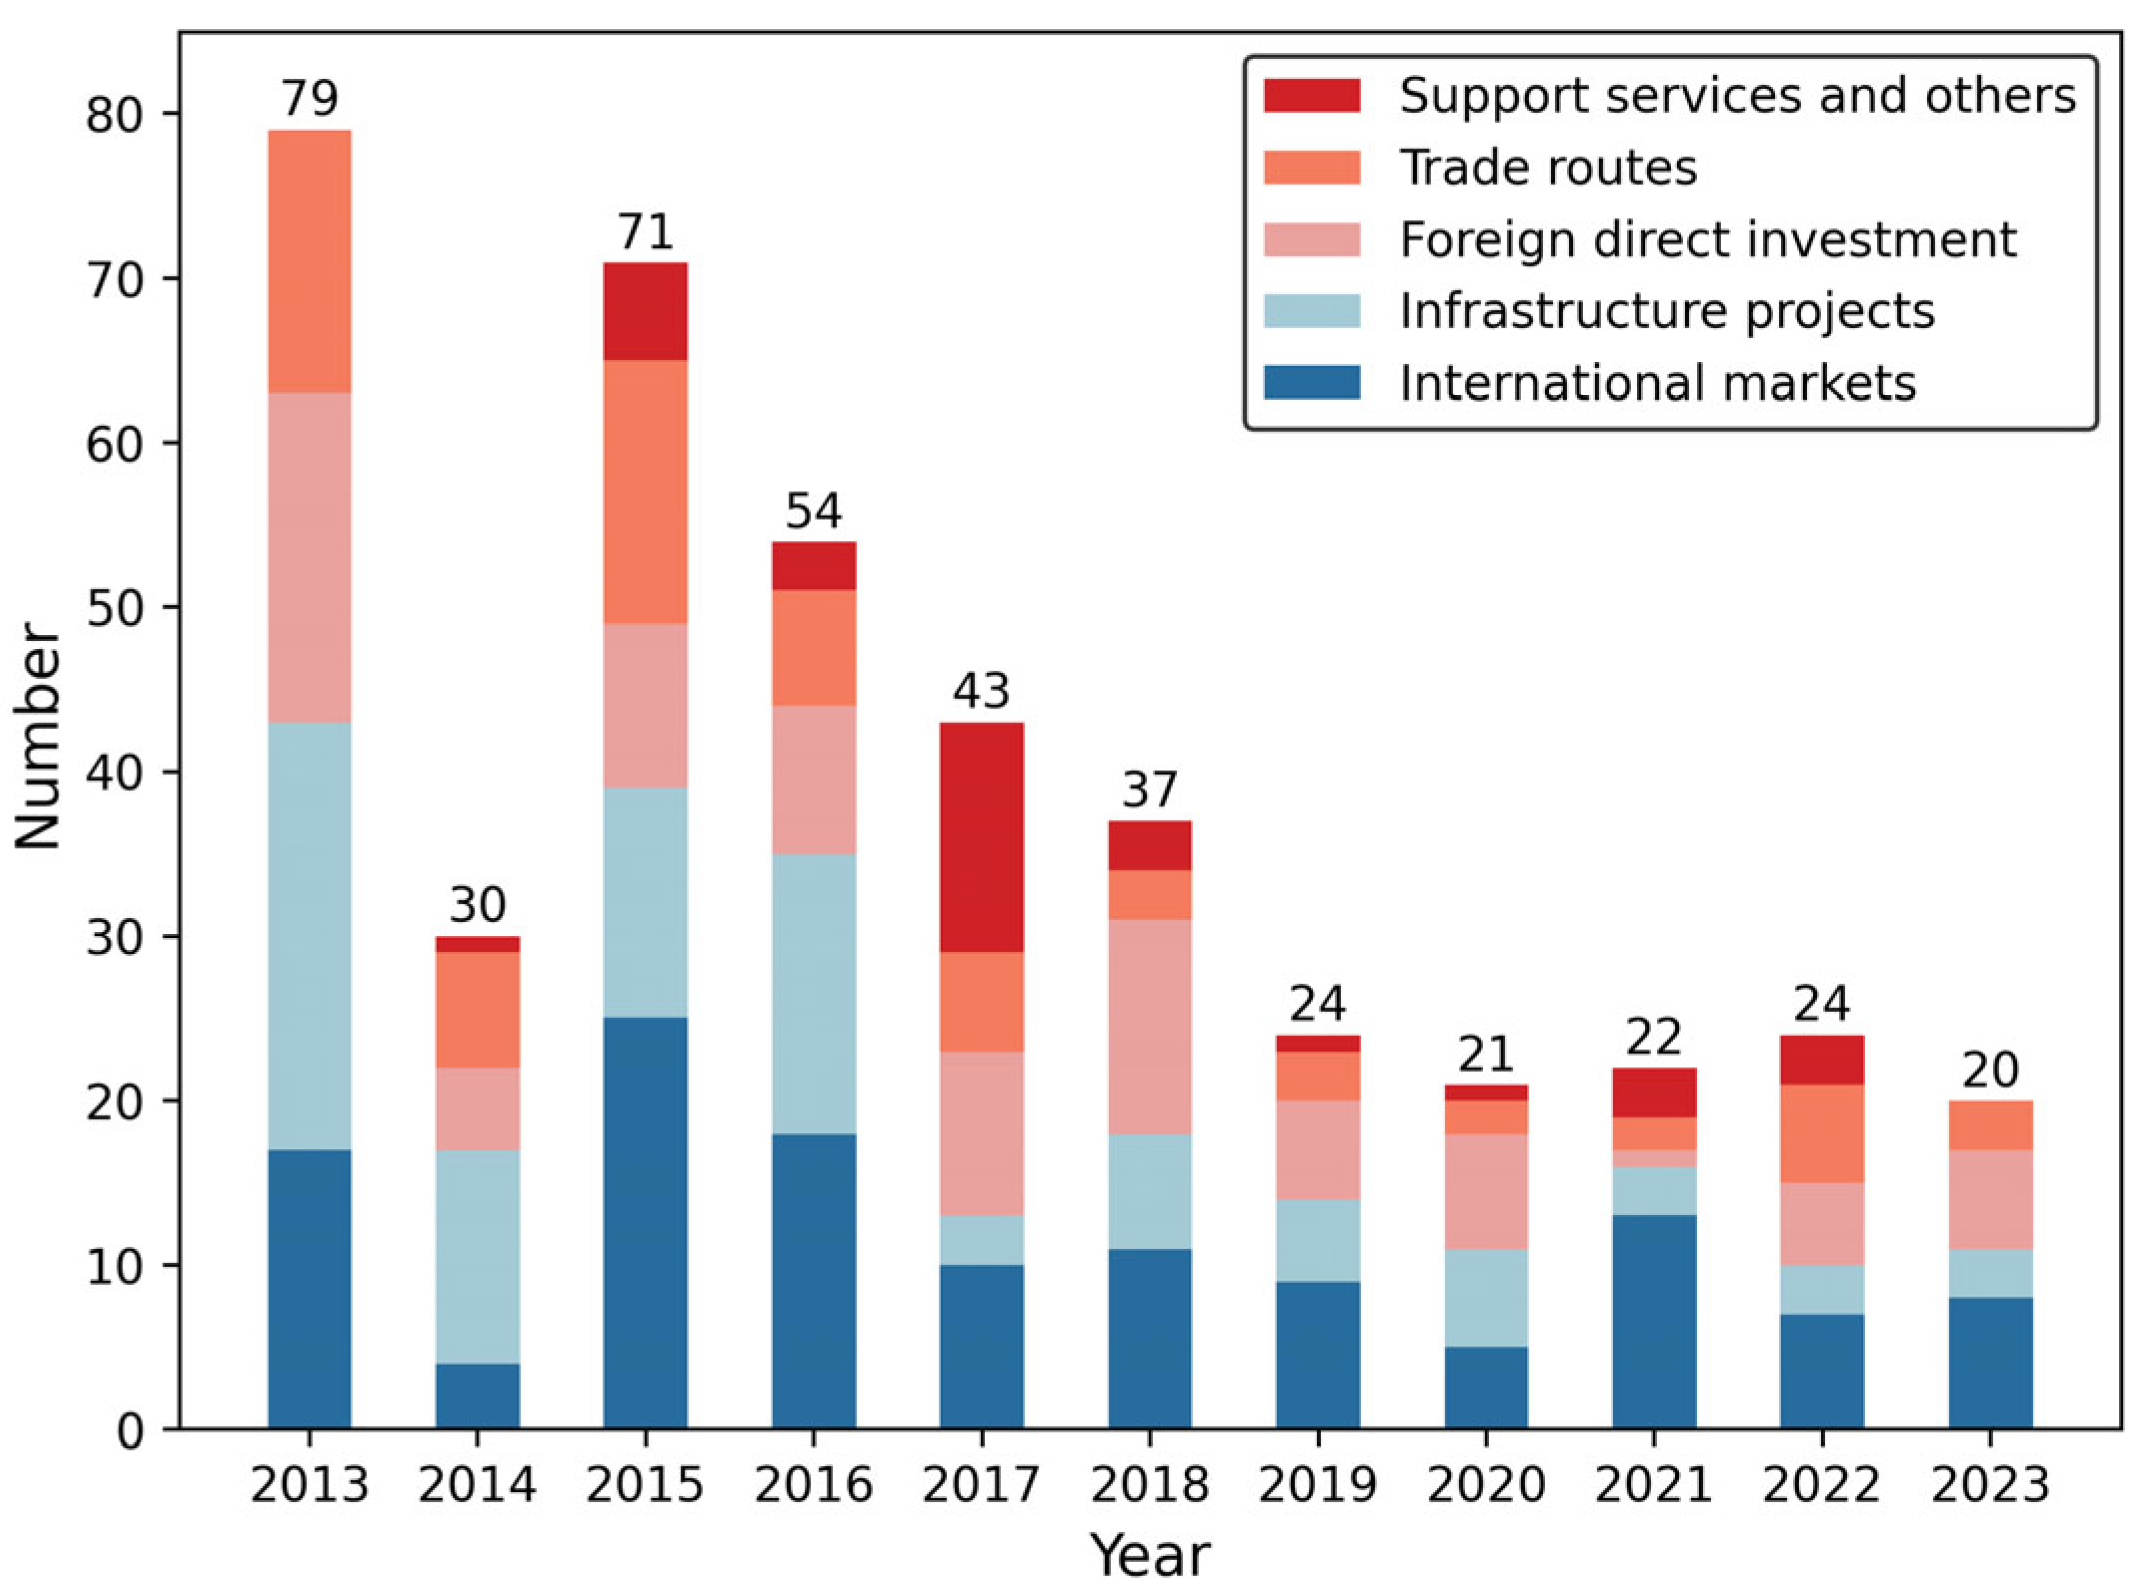
Figure 1. Years and mechanisms for enterprises to participate in the BRI. Note: The figure is generated from Python (version 3.12) code written by the authors.
Sustainability 17 02776 g001
Table 1. Definition and descriptive statistics of variables.
VariableDefinitionMeanStd. Dev.MinMaxWinsorisation
ESGHuazheng ESG rating4.1400.90218No, dependent variable
TreatThe enterprise participated in the BRI0.1020.30301No, independent variables (dummy) for standard DID
TimeThe BRI existed in the year (2013 and later)0.8370.36901
BRIThe enterprise has participated in the BRI in the year0.0630.24201No, independent variable (dummy) for time-varying DID
Control variables
Ageln(establishment age)2.8520.3741.6093.526Yes
Sizeln(total assets)22.1781.30019.84726.258Yes
Employln(employees)7.6051.2554.69111.116Yes
LevLeverage ratio0.4160.2070.0500.896Yes
ROAReturn on assets0.0410.065−0.2220.221Yes
GrowthOperating income growth ratio0.1520.371−0.5592.166Yes
Top1Shareholding ratio of the largest shareholder0.3410.1490.0840.743Yes
Boardln(board size)2.1180.2001.6092.708Yes
DualCEO duality0.2930.45501No (dummy)
Grouping variables
SOEState-owned enterprise0.3590.48001No (dummy)
MFGManufacturing0.6610.47401No (dummy)
MarketMain board0.7540.43101No (dummy)
Note: All variables have 43,841 enterprise-year observations. For continuous control variables, winsorisation is performed at 1% and 99%. Mean and standard deviation and minimum and maximum values are statistics after winsorisation. For dummy variables, 1 is yes, and 0 is no.
Table 2. Baseline results for the time-varying DID model.
Dependent Variable: ESGUnbalanced Panel DatasetBalanced Panel Dataset
(1)(2)(3)(4)
BRI0.207 ***
(0.040)
0.185 ***
(0.040)
0.195 ***
(0.056)
0.194 ***
(0.056)
Age −0.095
(0.090)
−0.019
(0.168)
Size 0.192 ***
(0.018)
0.219 ***
(0.033)
Employ 0.069 ***
(0.016)
0.060 **
(0.026)
Lev −0.817 ***
(0.056)
−0.465 ***
(0.109)
ROA 0.452 ***
(0.103)
0.546 **
(0.228)
Growth −0.087 ***
(0.012)
−0.071 ***
(0.022)
Top1 0.249 **
(0.098)
−0.002
(0.175)
Board −0.095 *
(0.050)
−0.110
(0.089)
Dual −0.013
(0.017)
−0.039
(0.034)
Constant4.128 ***
(0.003)
0.067
(0.433)
4.221 ***
(0.005)
−0.758
(0.819)
Enterprise FEYesYesYesYes
Year FEYesYesYesYes
Observations43,48443,48413,00513,005
Adj R20.38850.40730.39710.4091
Note: *** p < 0.01, ** p < 0.05, * p < 0.1. Robust standard errors for clustering at the enterprise level are in parentheses. The decrease in the number of observations in (1) and (2) is due to singleton observations being removed automatically. Other tables in this paper use unbalanced panel datasets unless otherwise noted.
Table 3. Results of mechanism analysis.
Dependent Variable: ESGTime-Varying DID
OFDIInfrastructure ProjectsTrade RoutesInternational MarketSupport Services and Others
(1)(2)(3)(4)(5)
BRI0.124
(0.092)
0.287 ***
(0.065)
0.352 ***
(0.094)
0.062
(0.077)
0.105
(0.116)
Constant0.036
(0.456)
0.209
(0.450)
0.068
(0.452)
−0.083
(0.454)
0.128
(0.457)
Control variablesYesYesYesYesYes
Enterprise FEYesYesYesYesYes
Year FEYesYesYesYesYes
Observations39,98540,15239,82540,25739,377
Adj R20.40850.40990.40950.40730.4092
Note: *** p < 0.01. Robust standard errors for clustering at the enterprise level are in parentheses.
Table 4. Results of heterogeneity analysis.
Dependent Variable: ESGTime-Varying DID
State-Owned EnterprisesNon-SOEsManufacturing EnterprisesNon-Manufacturing EnterprisesEnterprises on the Main BoardEnterprises on Other Boards
(1)(2)(3)(4)(5)(6)
BRI0.231 ***
(0.053)
0.057
(0.057)
0.056
(0.048)
0.358 ***
(0.067)
0.199 ***
(0.042)
0.013
(0.105)
Constant0.125
(0.731)
−0.352
(0.547)
0.197
(0.556)
0.320
(0.757)
0.046
(0.482)
−0.496
(1.037)
Control variablesYesYesYesYesYesYes
Enterprise FEYesYesYesYesYesYes
Year FEYesYesYesYesYesYes
Observations15,73227,75228,63614,80732,99510,489
Adj R20.41940.40360.39780.44790.41650.3741
Note: *** p < 0.01. Robust standard errors for clustering at the enterprise level are in parentheses.
Table 5. Results for the time-varying DDD model.
Dependent Variable: ESGTime-Varying DDD
SOEMFGMarket
(1)(2)(3)
BRI0.249 ***
(0.075)
Constant −0.227 ***
(0.073)
Control variables 0.244 **
(0.111)
Enterprise FE0.028
(0.057)
0.312 ***
(0.062)
−0.033
(0.104)
Year FE0.070
(0.433)
0.086
(0.433)
0.048
(0.434)
ObservationsYesYesYes
Adj R2YesYesYes
Note: *** p < 0.01, ** p < 0.05. Robust standard errors for clustering at the enterprise level are in parentheses.
Disclaimer/Publisher’s Note: The statements, opinions and data contained in all publications are solely those of the individual author(s) and contributor(s) and not of MDPI and/or the editor(s). MDPI and/or the editor(s) disclaim responsibility for any injury to people or property resulting from any ideas, methods, instructions or products referred to in the content.