Article

Floor-Usage Behavior and Thermal Comfort Among Apartment Residents Under Cultural Transition in Indonesia

1
Department of Architecture and Building Engineering, School of Environment and Society, Institute of Science Tokyo, 4259-G5-2 Nagatsuda-cho, Midori-ku, Yokohama 226-8501, Japan
2
Institut Teknologi Sepuluh Nopember, Surabaya 60111, Indonesia
3
Graduate School of Advanced Science and Engineering, Hiroshima University, 1-5-1 Kagamiyama, Higashi-Hiroshima, Hiroshima 739-8529, Japan
*
Author to whom correspondence should be addressed.
Sustainability 2025, 17(6), 2775; https://doi.org/10.3390/su17062775
Submission received: 13 February 2025 / Revised: 11 March 2025 / Accepted: 17 March 2025 / Published: 20 March 2025
(This article belongs to the Section Sustainable Urban and Rural Development)

Abstract

:
The rapid urbanization in Southeast Asia has resulted in an increase in vertical apartment buildings, bringing notable changes in residents’ lifestyles accompanied by Westernized cultures. Focusing on Indonesia, this study delves into how residents adapt their behaviors, especially traditional floor-sitting behavior, to living in the different types of apartments. The study also explores energy consumption and thermal comfort in relation to floor-usage behaviors. We conducted a comprehensive questionnaire survey of more than 3300 respondents in Indonesia, with 1841 Jabodetabek samples used for analysis. The findings indicate that approximately 80% of lower-income apartment residents (Rusunawa) predominantly engaged in floor-sitting behavior and relied on fans for cooling. In contrast, approximately 75% of higher-income apartment residents (condominiums) preferred chair-sitting and used air conditioning (AC). Cluster analysis of three key factors—primary posture, foot covering, and floor covering—revealed four distinct groups. The clusters with a lower preference for floor-sitting exhibited approximately 50% higher annual electricity consumption due to AC usage, whereas the clusters favoring floor-sitting consumed less electricity, relying more on fans. However, despite variations in energy use, over 85% of respondents across all clusters were mostly reported as comfortable, indicating that behavioral adaptations with floor-sitting remain viable in achieving thermal comfort. While an increase in income level changes behaviors and energy use, the results suggest that floor-sitting is a traditional practice that serves as an effective low-energy strategy in hot and humid climates.

1. Introduction

1.1. Overview

Residential energy consumption in Southeast Asia has been rising rapidly due to economic growth, urbanization, and the increased frequency of heat waves [1]. The International Energy Agency (IEA) reported that energy demand has increased at an annual rate of 3% over the past two decades, and this trend is expected to continue through 2030 [1]. The Intergovernmental Panel on Climate Change (IPCC) forecasted that by 2040, Asia will account for approximately 52% of global electricity consumption [2]. In the tropical climates of Indonesia, air conditioner (AC) ownership was approximately 8% as of 2017, with higher rates among wealthier households [3]. AC ownership will continue to rise from one in ten households to more than one in three by 2030, according to the Announced Pledges Scenario 2021–2060 [4]. Once households start using AC, they tend to continue doing so [5]. Considering that the majority of Indonesian citizens are currently within the low- to middle-income ranges [6,7] and will shift to middle- to high-income ranges owing to economic growth, energy consumption for AC is expected to increase dramatically in the near future [3,8]. This economic growth in Southeast Asia accompanies urbanization with shifting housing types from landed houses to vertical apartment houses. In Indonesia, the first vertical housing (Rusun) was built in the 1980s by governmental housing programs [9,10]. Private apartments (Rusunami) were first built in the 2000s [10], and the number of high-rise apartments has continued to increase over the last two decades. The building and unit typologies can be distinguished based on the era in which they were constructed.
Notably, economic growth in Southeast Asia has also led to cultural shifts, largely driven by urbanization. Western influences often accompany this transition and change the way people live and behave in their houses [11]. As more people move to cities and adopt modern conveniences, traditional habits are being replaced with new practices influenced by Westernization. These cultural transitions, including a greater dependence on technology and energy-consuming appliances, directly and indirectly increase household energy consumption [11]. The growing demand for AC and appliances in urban settings reflects how urbanization and Westernization are fueling energy use in the region.

1.2. Literature Review

Although the global discourse on housing transitions and energy consumption is well documented [12,13], the relationship between housing typology and occupant behaviors in the context of Southeast Asia needs further exploration to predict residents’ future energy consumption and thermal comfort. In Indonesia, for example, traditional houses were characterized by open spaces and natural ventilation strategies to maintain thermal comfort [14,15,16,17]. These characteristics were associated with energy-efficient living practices. For example, it was shown in Javanese houses that 31% of the total electricity consumption could be reduced through the use of natural ventilation [18]. In addition to natural ventilation [19], raised floor settings for underfloor ventilation [20], appropriate building orientation [12] and traditional materials [21] have also been used as strategies for achieving thermal comfort. The thoughtful design of buildings and residents’ behaviors would collectively contribute to a comfortable living environment with minimal energy consumption [22]. Furthermore, in Southeast Asia (e.g., Indonesia) and East Asia (e.g., Japan and Korea), the floor was traditionally utilized as an important area for activities. Here, people tended to sit on the floor when engaging in social activities [23,24,25,26]. Moreover, this traditional floor-sitting style might be related to how individuals aim to maintain thermal comfort in adapting to higher ambient temperatures.
Previous studies indicated that the floor-sitting style is not solely a cultural tradition but also influences a home’s heating and cooling requirements [3,5]. The air temperature and conditions of the floor might play a role in thermal comfort [27,28,29]. One intriguing example is the cultural practice of sitting on the floor in Korea, showing its potential impact of 6.0% energy savings for heating compared to the chair-sitting style [30]. In Indonesia, where the transition from traditional landed houses to modern apartment living occurs [31,32,33], it is important to understand how residents’ preference for floor-sitting adapts to apartment living for elaborating thermal control in hot and humid climates. As mentioned before, the adoption of Western-style apartments may introduce a shift in physical and behavioral dimensions (i.e., sitting on chairs and AC usage), potentially influencing energy consumption patterns. However, there are few empirical studies that have investigated the relationship between housing types, floor-sitting behaviors, electricity consumption and thermal comfort in hot and humid climates, except for our basic study [23].

1.3. Research Objectives

This study aims to explore the relationships between floor-sitting behavior, thermal comfort and energy usage in apartment houses, considering the cultural transition and lifestyle changes, through a large-scale questionnaire survey conducted in major cities of Indonesia. The main research question lies in how apartment types, occupant behaviors such as floor-sitting, cooling strategies, electricity consumption and residents’ thermal comfort are interconnected. Furthermore, the occupant behavior and thermal comfort of low-income and high-income residents will be compared to predict and suggest future lifestyles and the design of apartments under the cultural transition in Indonesia. Specifically, the main issue is how low-income residents adapt their behaviors to achieve thermal comfort without using AC in hot and humid environments.
Based on the literature review, it is hypothesized that in tropical regions, contact cooling with the floor may contribute to the thermal comfort of occupants during their daily indoor activities. Environmental factors such as air temperature, humidity and airflow have been widely studied for thermal comfort [34,35]. However, contact cooling effects on building surfaces, particularly with floors, need further examination. As radiant heating and cooling systems are gaining attention in East Asian and European nations [36], existing research has mainly focused on floor heating [37,38,39,40]. In recent years, research on floor cooling has also been increasing in East Asia [23,41,42,43] and Southeast Asia [11,44].
This study is expected to provide important social contributions by elucidating how traditional behaviors such as floor-sitting style can be integrated into modern apartment design and cooling systems (i.e., radiant floor cooling) to enhance thermal comfort and energy efficiency. Furthermore, this research offers insights into how cultural behaviors can provide both social and environmental benefits, contributing to the well-being of residents in Southeast Asia.

2. Methodology

2.1. Survey Design

This study employed a cross-sectional observation and a nationwide questionnaire survey on floor-usage behaviors and thermal comfort in Indonesia. The large-scale questionnaire was developed to systematically record naturally occurring behaviors in real-life settings and to understand how individuals behave with different types of postures on the floor in different cities [44,45]. This approach allows for both qualitative exploration and structured data collection to provide a more comprehensive understanding of the research topic [46,47].
The survey respondents had diverse educational and income backgrounds, ranging from low- to high-income groups. After obtaining permission from the building managers, the surveyors (the IPSOS Indonesia company) visited respondents’ units to obtain their consent to participate in the survey and explain the survey questions face-to-face. Respondents answered the questions directly with the surveyors and received an honorarium.

2.2. Sampling Strategy

A stratified sampling method was used to select five major cities across the country that represent a wide range of environments and climates of Indonesia. In Indonesia, there are three apartment types: Rusunawa, Rusunami and condominium (see Section 2.3). The sampling aimed to capture diversity in sitting postures, floor covering types, usage of cooling methods, psychological factors, and energy consumption during daily activities, particularly those associated with floor-usage behaviors. Direct interviews were conducted with respondents, comprising mostly close-ended and partly open-ended questions (Table 1).
According to the population data in 2010, Indonesia has 10 large cities with a population of more than 1 million [48]. The country, as a vast equatorial archipelago comprising five major islands, is characterized by various cultures [49]. The following five major cities were chosen for the survey: Bandung (population: 2.5 million), Jabodetabek (the megapolitan area of Jakarta) (10.6 million), Makassar (1.4 million), Medan (2.4 million) and Surabaya (2.9 million). In 2021, 56,690 residential apartments were built in Indonesia [50]. Considering the above-mentioned population sizes and apartment distribution patterns of respective cities, the proportional allocation sample was determined as follows: n = 400 for Medan and Makassar, n = 600 for Bandung and Surabaya and n = 1800 for Jabodetabek.

2.3. Object Description and Data Collection Process

As mentioned before, vertical apartment residences are broadly classified into Rusunawa, Rusunami and condominiums by the Indonesian government. Rusunawa (Rumah Susun Sederhana Sewa) is owned by the government and available for rent by low-income citizens. Rusunami (Rumah Susun Sederhana Milik) is available for ownership by individuals supported by the government [51]. A condominium is a privately owned luxurious vertical housing unit [52]. This tiered structure in Indonesian housing reflects the economic hierarchy, with condominiums representing the high-income, Rusunami the middle-income, and Rusunawa the low-income groups.
Data were collected for three building types by the survey company from September to November 2022. Random sampling was employed to adequately represent gender and age groups and various ethnic groups in Indonesia. The raw data were obtained from 3383 individuals who lived in apartments in the selected major cities through the questionnaire.
The sample proportions were Rusunawa (48%), Rusunami (41%) and condominiums (11%). The occupied units were divided into family unit types: two bedrooms (48%), one bedroom (28%) and the studio type (24%). One to more than three family members completed the questionnaire. Specifically, the surveys were completed by respondents aged 18 years and above, with 24% completed by a single family member, 44% completed by two family members, 19% completed by three family members, and 13% completed by more than three family members. The details are shown in Table A1 (Appendix A).

2.4. Questionnaire

In general, as shown in Table 1, the respondents were asked 86 questions in 6 main categories and 24 sub-categories of questions with psychological response scale options for thermal comfort, thermal sensation and thermal satisfaction based on the American Society of Heating, Refrigerating and Air-Conditioning Engineers (ASHRAE) [6]. The questionnaire is divided into six parts. Section I encompasses inquiries for general information about the respondents, focusing on individual and residential information. Section II pertains to energy usage in daily activities, including AC use, residents’ lifestyles, and psychological factors. Section III includes questions related to daily activities such as gathering, mealtime, studying, relaxing, and sleeping. Section IV addresses questions regarding the type of foot coverings (barefoot, socks, slippers, and shoes) and floor coverings (no covers, thin mat, mattress, carpet, sit pillow and bed). Section V is dedicated to inquiries concerning daily behavioral patterns associated with posture during their activities, with the options of sitting on the floor, sitting on the chair/sofa, laying on the sofa, laying on the floor and laying on the bed. Section VI focuses on identifying specific body parts that have direct contact with the floor and preferences for floor contact during the above-mentioned daily activities.

2.5. Statistical Analysis

The analysis began with describing and checking the demographic data for all cities. In particular, the floor-usage behaviors were compared among the cities in detail. In this paper, the results of the Jabodetabek region are presented because the capital city comprises all the apartment types (other cities do not contain sufficient numbers of condominiums). To compare the data among different apartment types in the same city, Jabodetabek was selected as the case study city in this paper. As a rapidly growing megapolitan region which has undergone fast population growth and urban expansion [2,53], this region reflects various lifestyle and cultural transitions influenced by Westernization. Furthermore, Indonesians view gatherings as an essential aspect of their lifestyle, reflecting the importance of maintaining social connections [24]. Therefore, gathering activities were selected as the primary focus within residential units for the activity analysis.
To classify the obtained data, a hierarchical cluster analysis was used to identify underlying patterns and groups among the respondents with floor-sitting behaviors during gathering activities. This analysis incorporated three key variables: primary posture, the main type of foot covering and floor covering. The Euclidean distance was employed using R version 4.2.1, with the number of clusters ranging from 1 to 10. The results of the statistics are shown in Figure A1 (Appendix A). Four and five clusters were selected by the results of gap statistics, and the key distinction between the four and five clusters was the identification of a group wearing sandals. However, only 97 samples were wearing sandals, leading to an imbalance in the sample size. To ensure a more even distribution of the samples and align with the study’s objective, four clusters were finally selected, namely from Cluster 1 (C1) to Cluster 4 (C4).
Next, statistical analyses were performed using R ver.4.4.2; statistical significance was set at p < 0.05. Among the four clusters, a Pearson’s Chi-squared test was used to perform multiple comparisons of proportions of the preference for floor-sitting, thermal sensation, thermal comfort and satisfaction in the daytime and nighttime, as shown in Table A2 (Appendix A). The effect size of Cramér’s V was interpreted based on the conventional benchmarks, with values of 0.1, 0.3 and 0.5, representing small, moderate, and large effects, respectively. The calculations for r and Cramér’s V were performed using the R package “effectsize” (version 1.0.0). The adjusted p-value (adj. p), calculated using the Bonferroni method, was introduced as a criterion to minimize the likelihood of a Type I error, which occurs when a difference is detected despite no actual difference existing.
In addition, to identify factors that are highly correlated with the preference for floor-sitting by the respondents, a binary logistic regression analysis was applied to the obtained data. The objective variables were the preferences (i.e., like or dislike sitting on the floor) and related reasons. The explanatory variables were the ownership of cooling equipment (AC and/or fan), floor coverings, apartment types, number of family members, window-/door-opening conditions, thermal sensations, unit types and respondents’ attributes (age, gender, income). Thermal comfort and electricity consumption were also considered as possible variables that correlated with the preference for floor-sitting. However, the preliminary test revealed that they were not independent from other variables (i.e., thermal sensation and income), so they were excluded from the explanatory variables in this analysis. To ensure the reliability and stability of the statistical model, an adequate number of observations is necessary for each category of the objective variable. A widely accepted guideline in logistic regression suggests that the least frequent outcome should have at least ten times the number of explanatory variables [54]. Since there were 15 explanatory variables, the number of the less frequent outcomes in the objective variable should be at least 150. Therefore, the objective variables that meet the criteria were used for the analysis (see Section 3.4.1).

3. Results

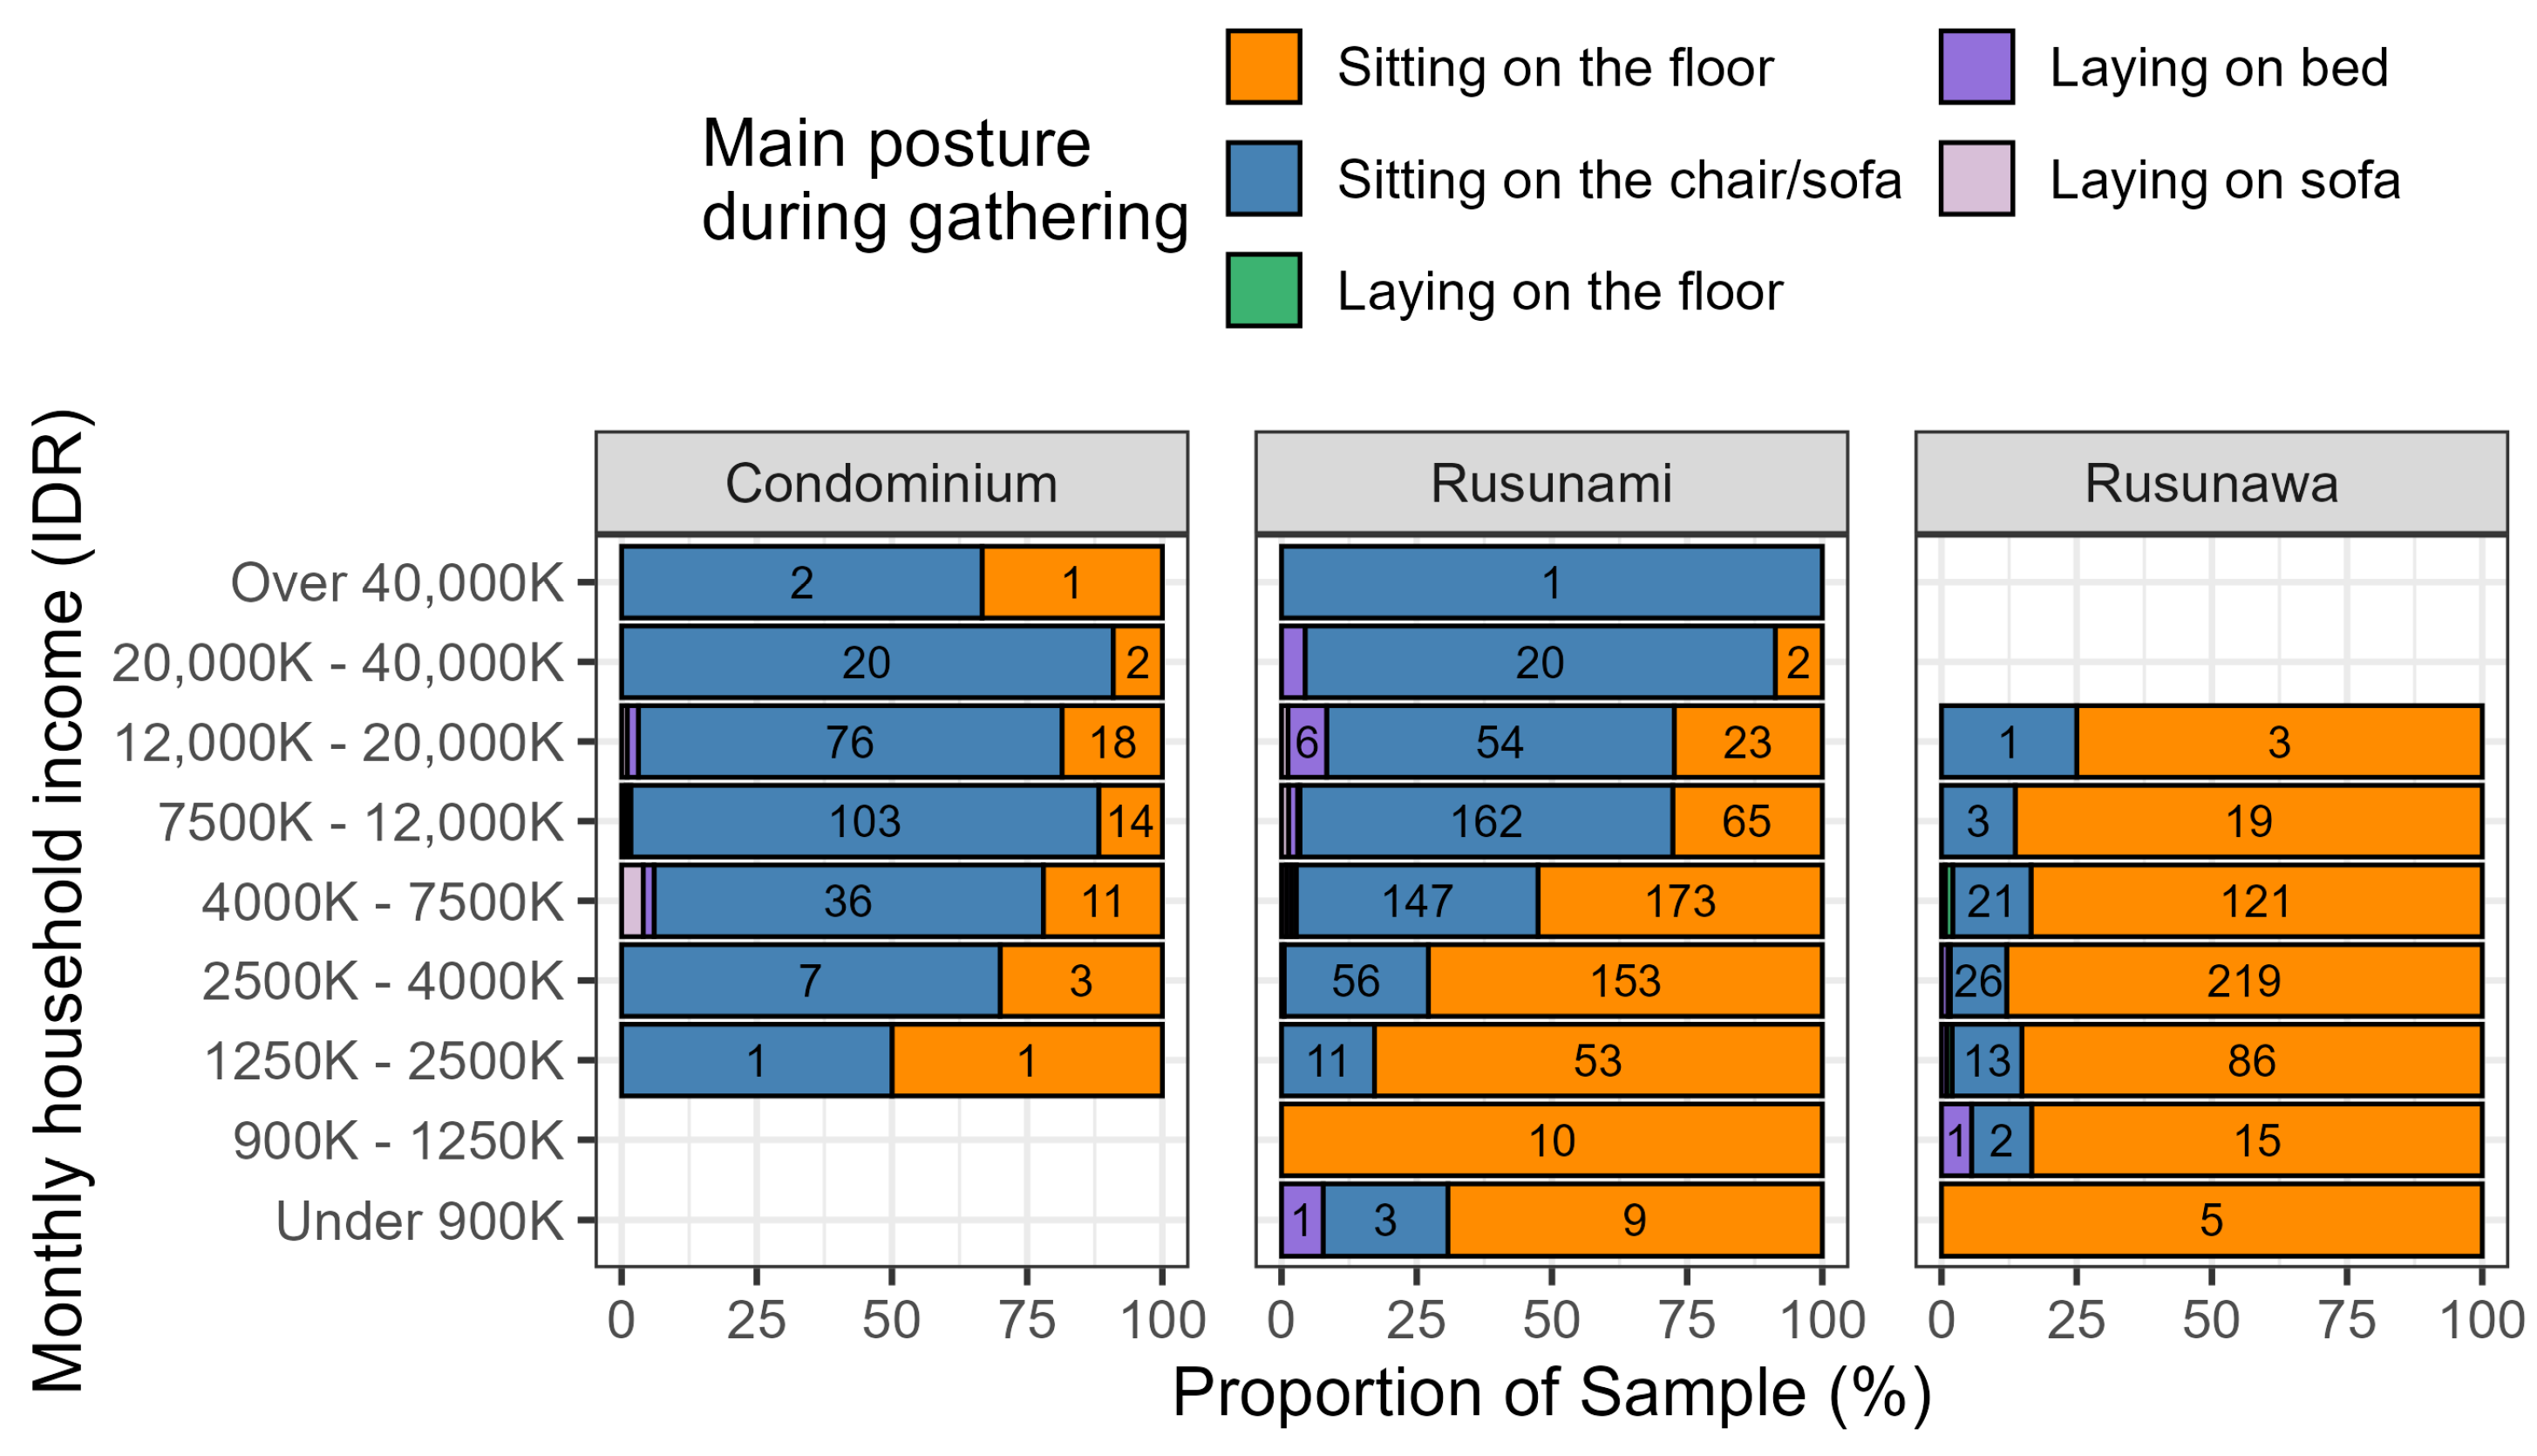
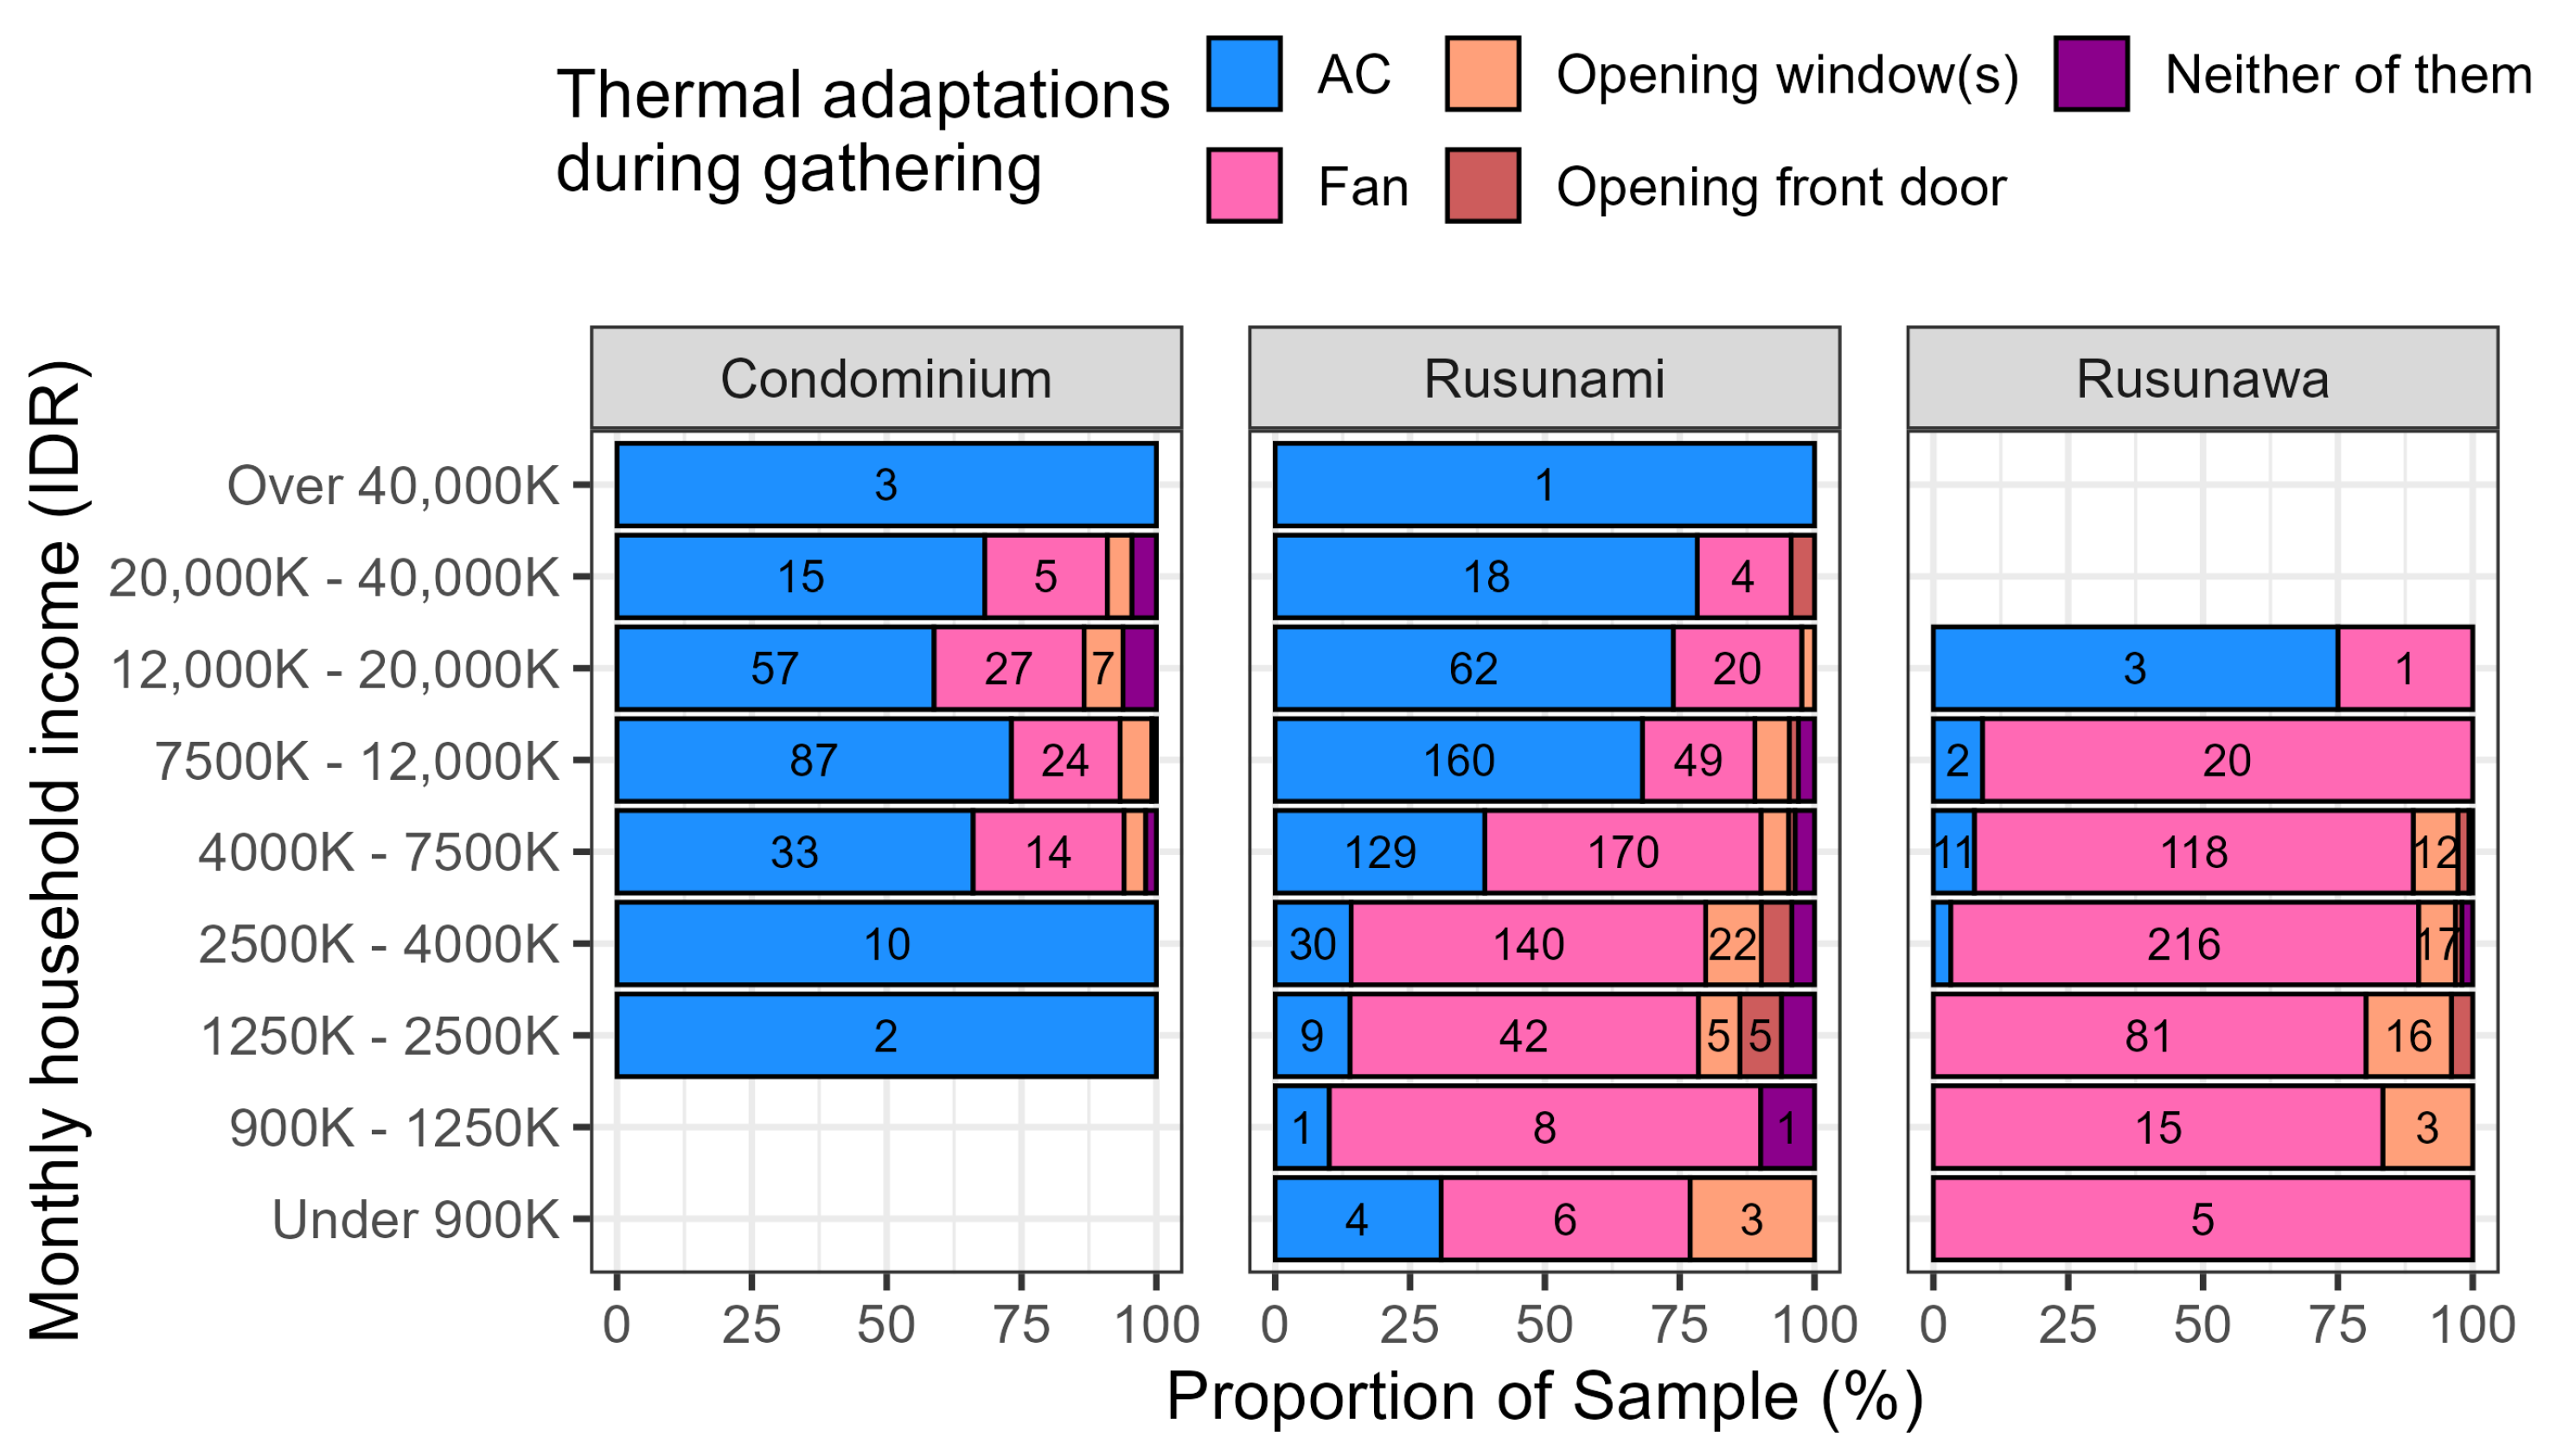
3.1. Main Posture and Thermal Adaptations During Gathering Activity

This section analyzes the main posture and thermal adaptations during gathering activities. Figure 1 shows the proportion of main postures during gathering activities for each apartment type and monthly household income. As expected, monthly household incomes were higher in condominiums and lower in Rusunawa. In Rusunami, income ranged from lower to higher segments. Furthermore, the dominant posture was “sitting on the chair/sofa” in condominiums and “sitting on the floor” in Rusunawa. In Rusunami, the sitting style gradually varied from lower to higher income ranges, even in the same income range, namely IDR 4000 K–7500 K; the main posture differed between condominiums and Rusunawa. In the same income range in Rusunami, the proportion for sitting on a chair/sofa was 46%, while that for sitting on the floor was 54%.
Figure 2 shows the proportion of thermal adaptations during gathering activities for each apartment type and monthly household income. The proportions of AC and fan usage were almost the same as those of the above-mentioned main postures shown in Figure 1. AC usage was dominant in condominiums, and fan usage prevailed in Rusunawa. In Rusunami, the proportions of AC and fan usage gradually varied with household income; they were 41% in AC and 54% in fan usage at the income range of IDR 4000 K–7500 K. These results indicate typical occupant behaviors associated with the main postures and thermal adaptations for each apartment type and income level.

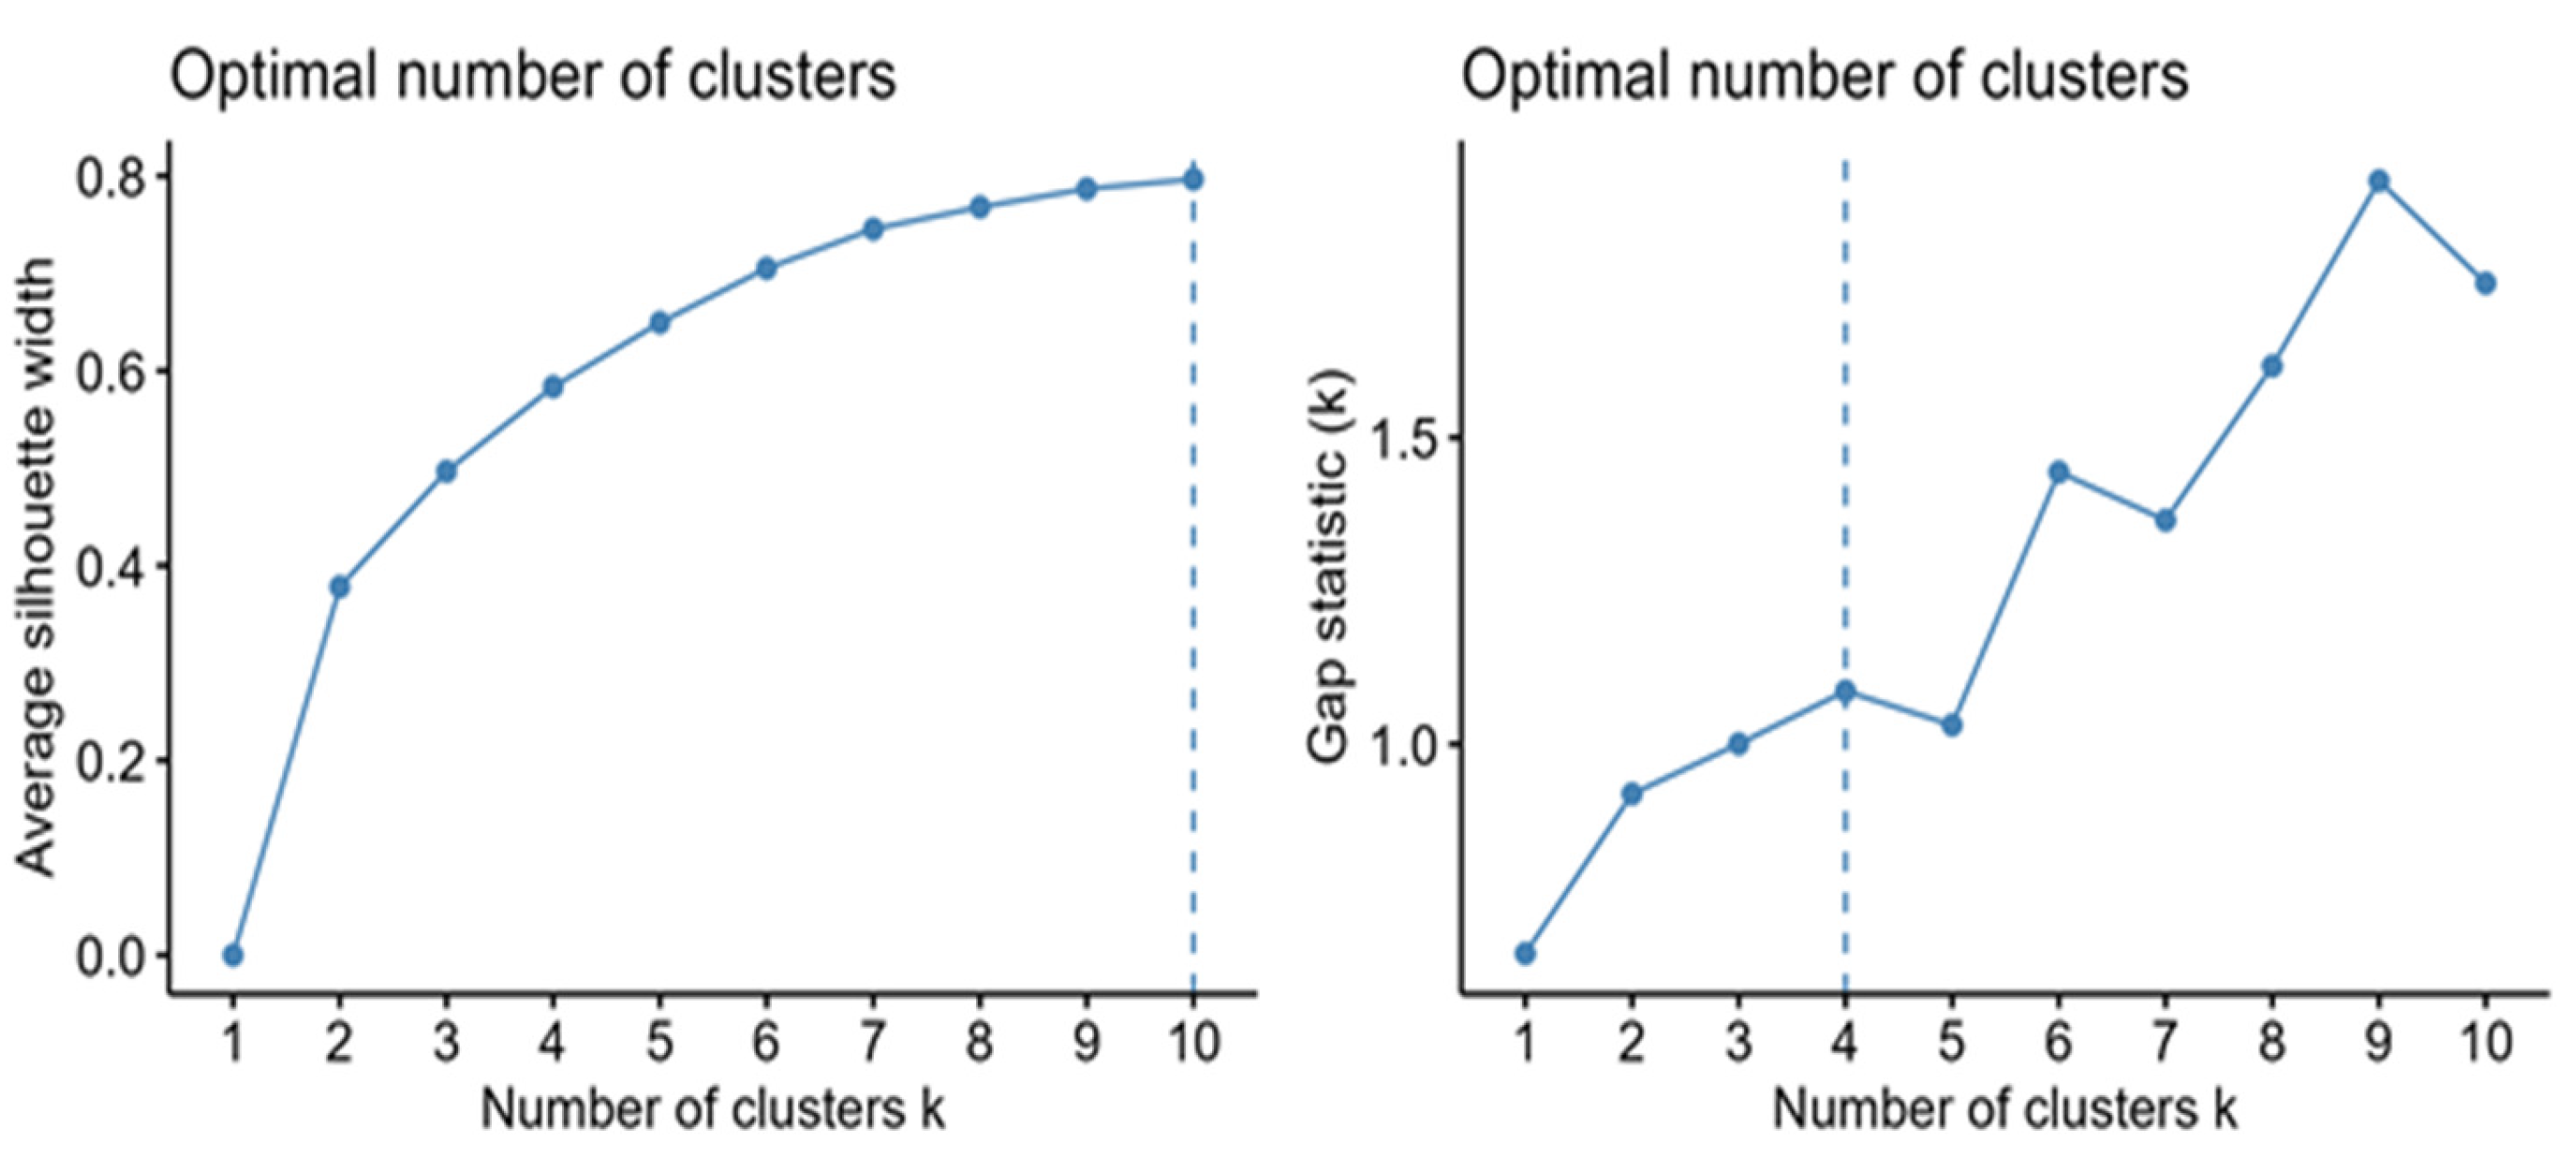
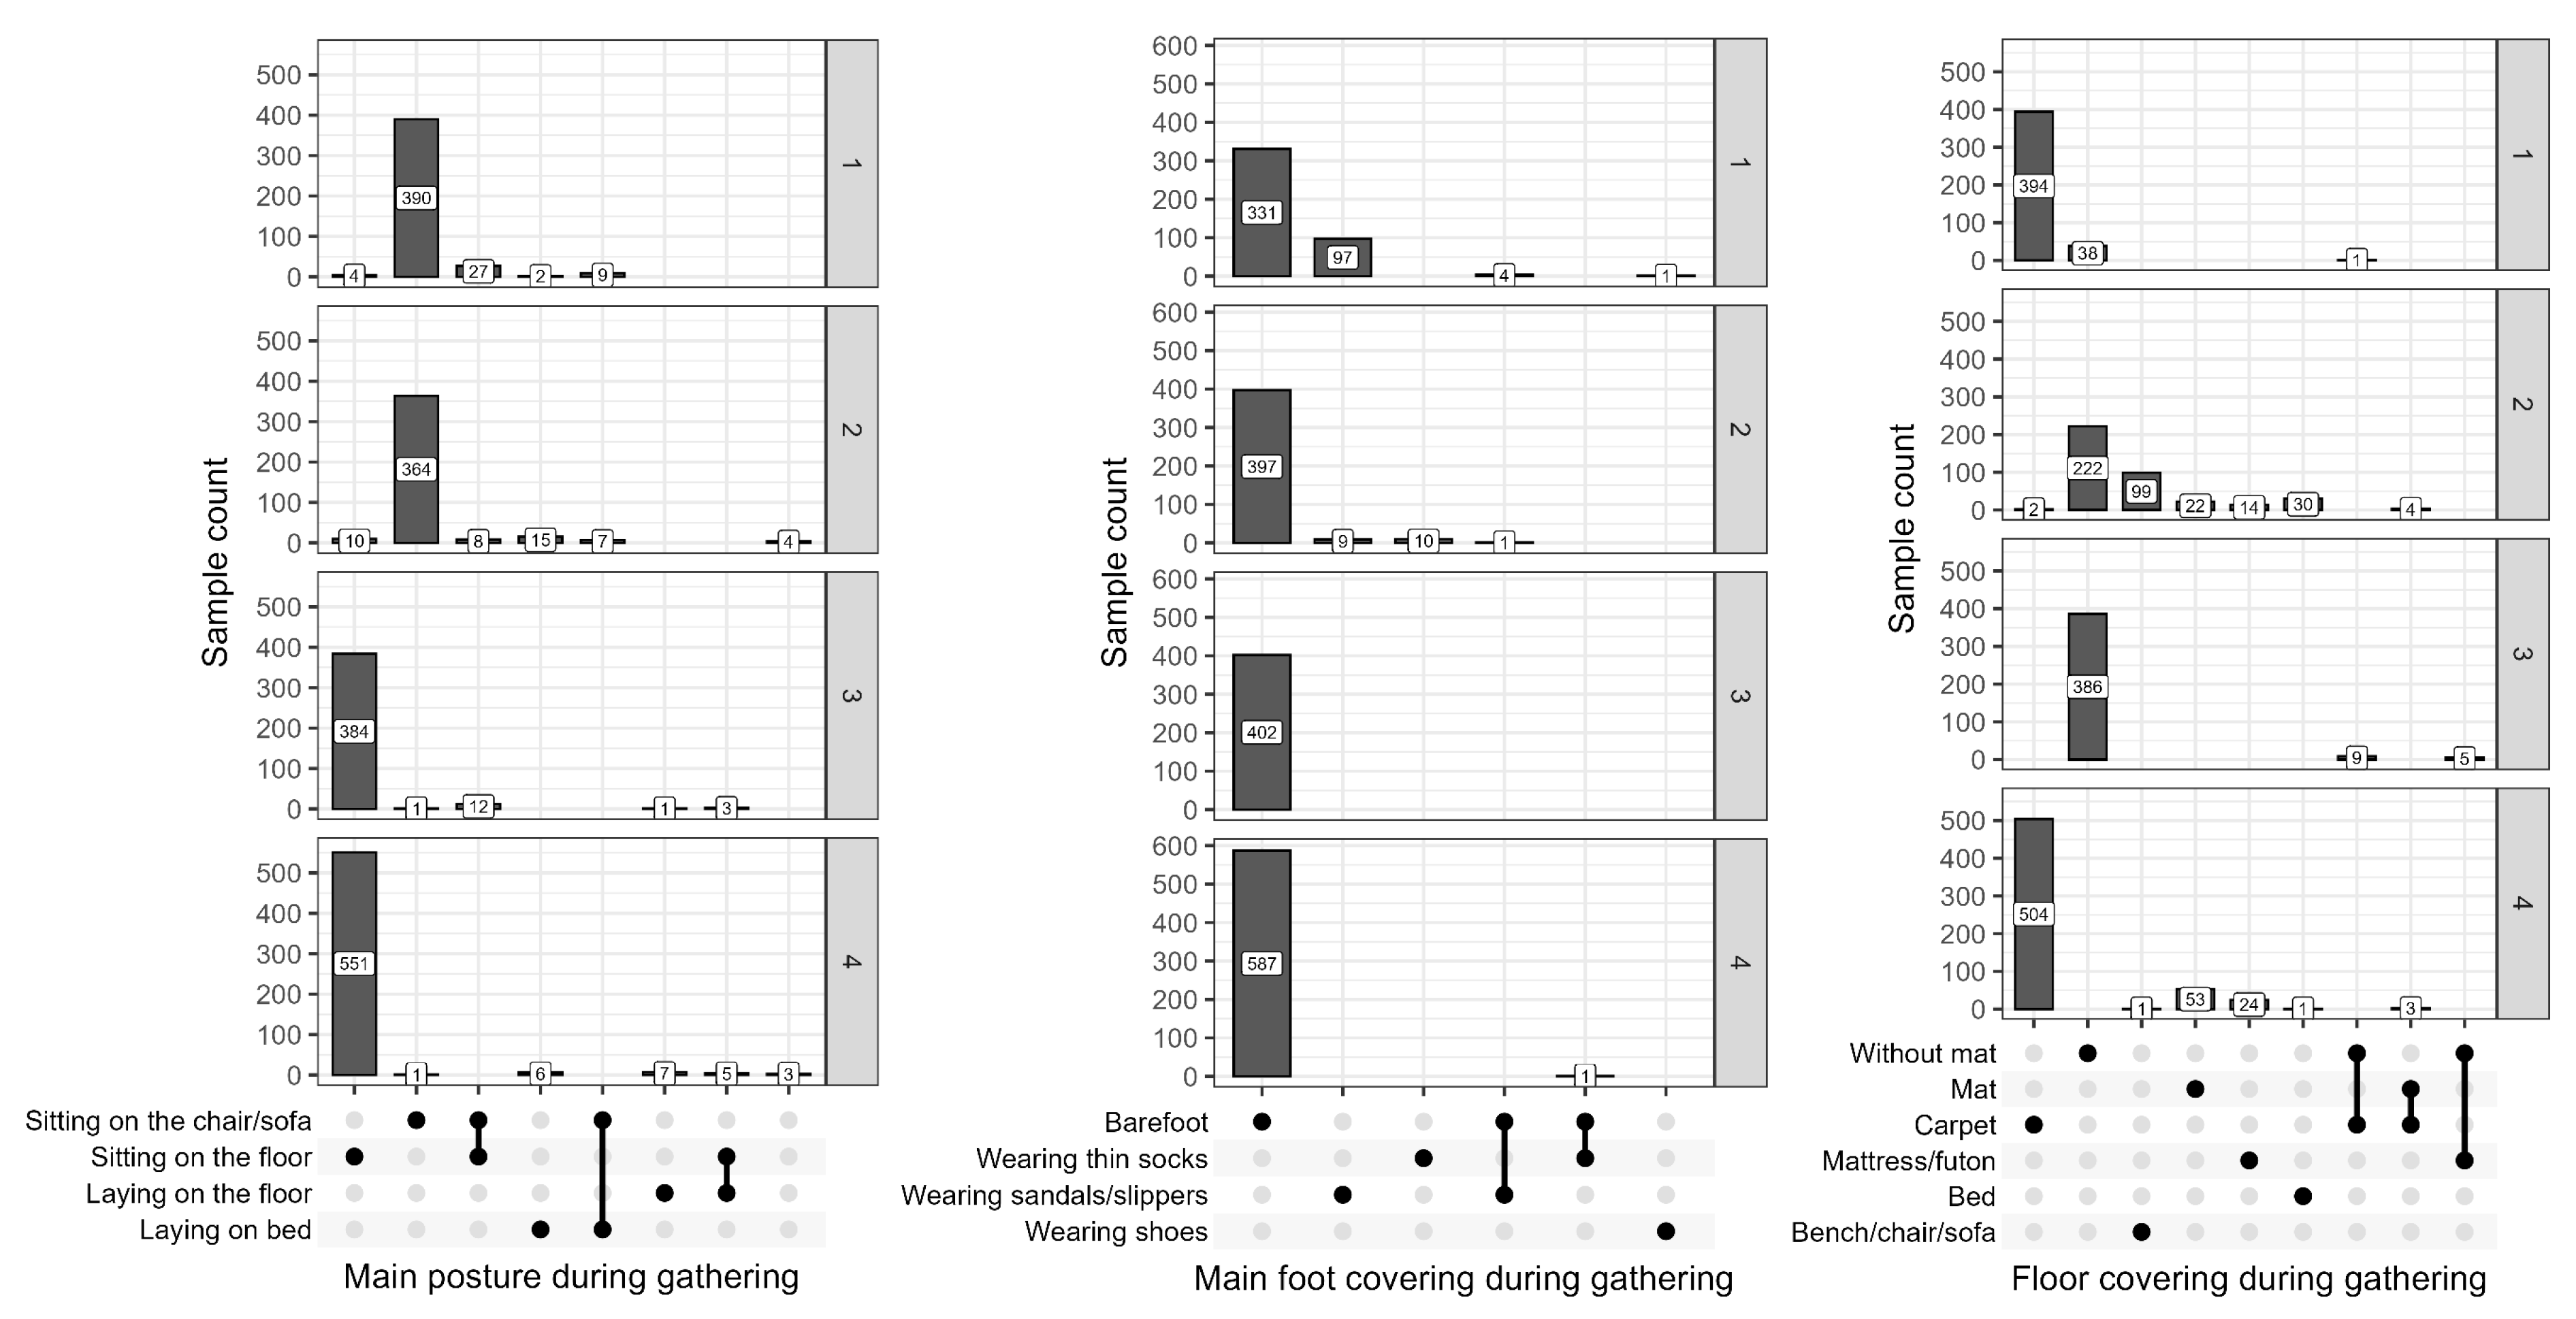
3.2. Cluster Description

In the following results, the characteristics of each cluster were analyzed by the factors, including apartment type, usage of thermal adaptations, energy consumption, and respondents’ psychological factors, such as preference for floor-sitting, thermal sensation, thermal comfort, and thermal satisfaction.
Table A1 (Appendix A) shows the results of a cluster analysis with the main characteristics of the four clusters. The most common unit was the two-bedroom type, followed by the studio for all clusters. The floor materials were mostly ceramic tiles. The survey respondents ranged from 10 to above 55 years in age, and most respondents were aged 35–39 years. The male–female ratio was 30:70. The larger female proportion was because other household members were working or doing activities outside the home when the survey was carried out.
Figure 3 shows the results for main posture, main foot covering, and floor covering for each cluster during gathering activities. Multiple answers were considered in the figure. There were clear differences in the main posture between the clusters. Clusters C1 and C2 were dominated by sitting on the chair/sofa, while in C3 and C4, sitting on the floor prevailed. All clusters show that most respondents did not use footwear (i.e., barefoot). Regarding the choice of floor covering, C1 and C4 used carpets/mats, and C2 and C3 did not use floor coverings.
Figure 4 shows the proportion of apartment types and monthly household income for each cluster. C1 and C2 were primarily occupied by Rusunami, followed by condominiums. C3 was occupied by Rusunawa, followed by Rusunami. Rusunami and Rusunawa were largely occupied in C4. The largest segment in C1 and C2 was IDR 7500 K–12,000 K, which indicates a higher income class according to the World Bank classification [7]. In C3, the majority earned IDR 2500 K–4000 K, meaning a lower-income class. In C4, the majority earned IDR 4000 K–7500 K, indicating a middle-income class. These results are correlated to the results in Figure 1.
The above results indicate the differences in sitting behavior between income levels, e.g., sitting on the chair/sofa in C1 and C2 for higher-income groups and sitting on the floor in C3 and C4 for lower- to middle-income groups.

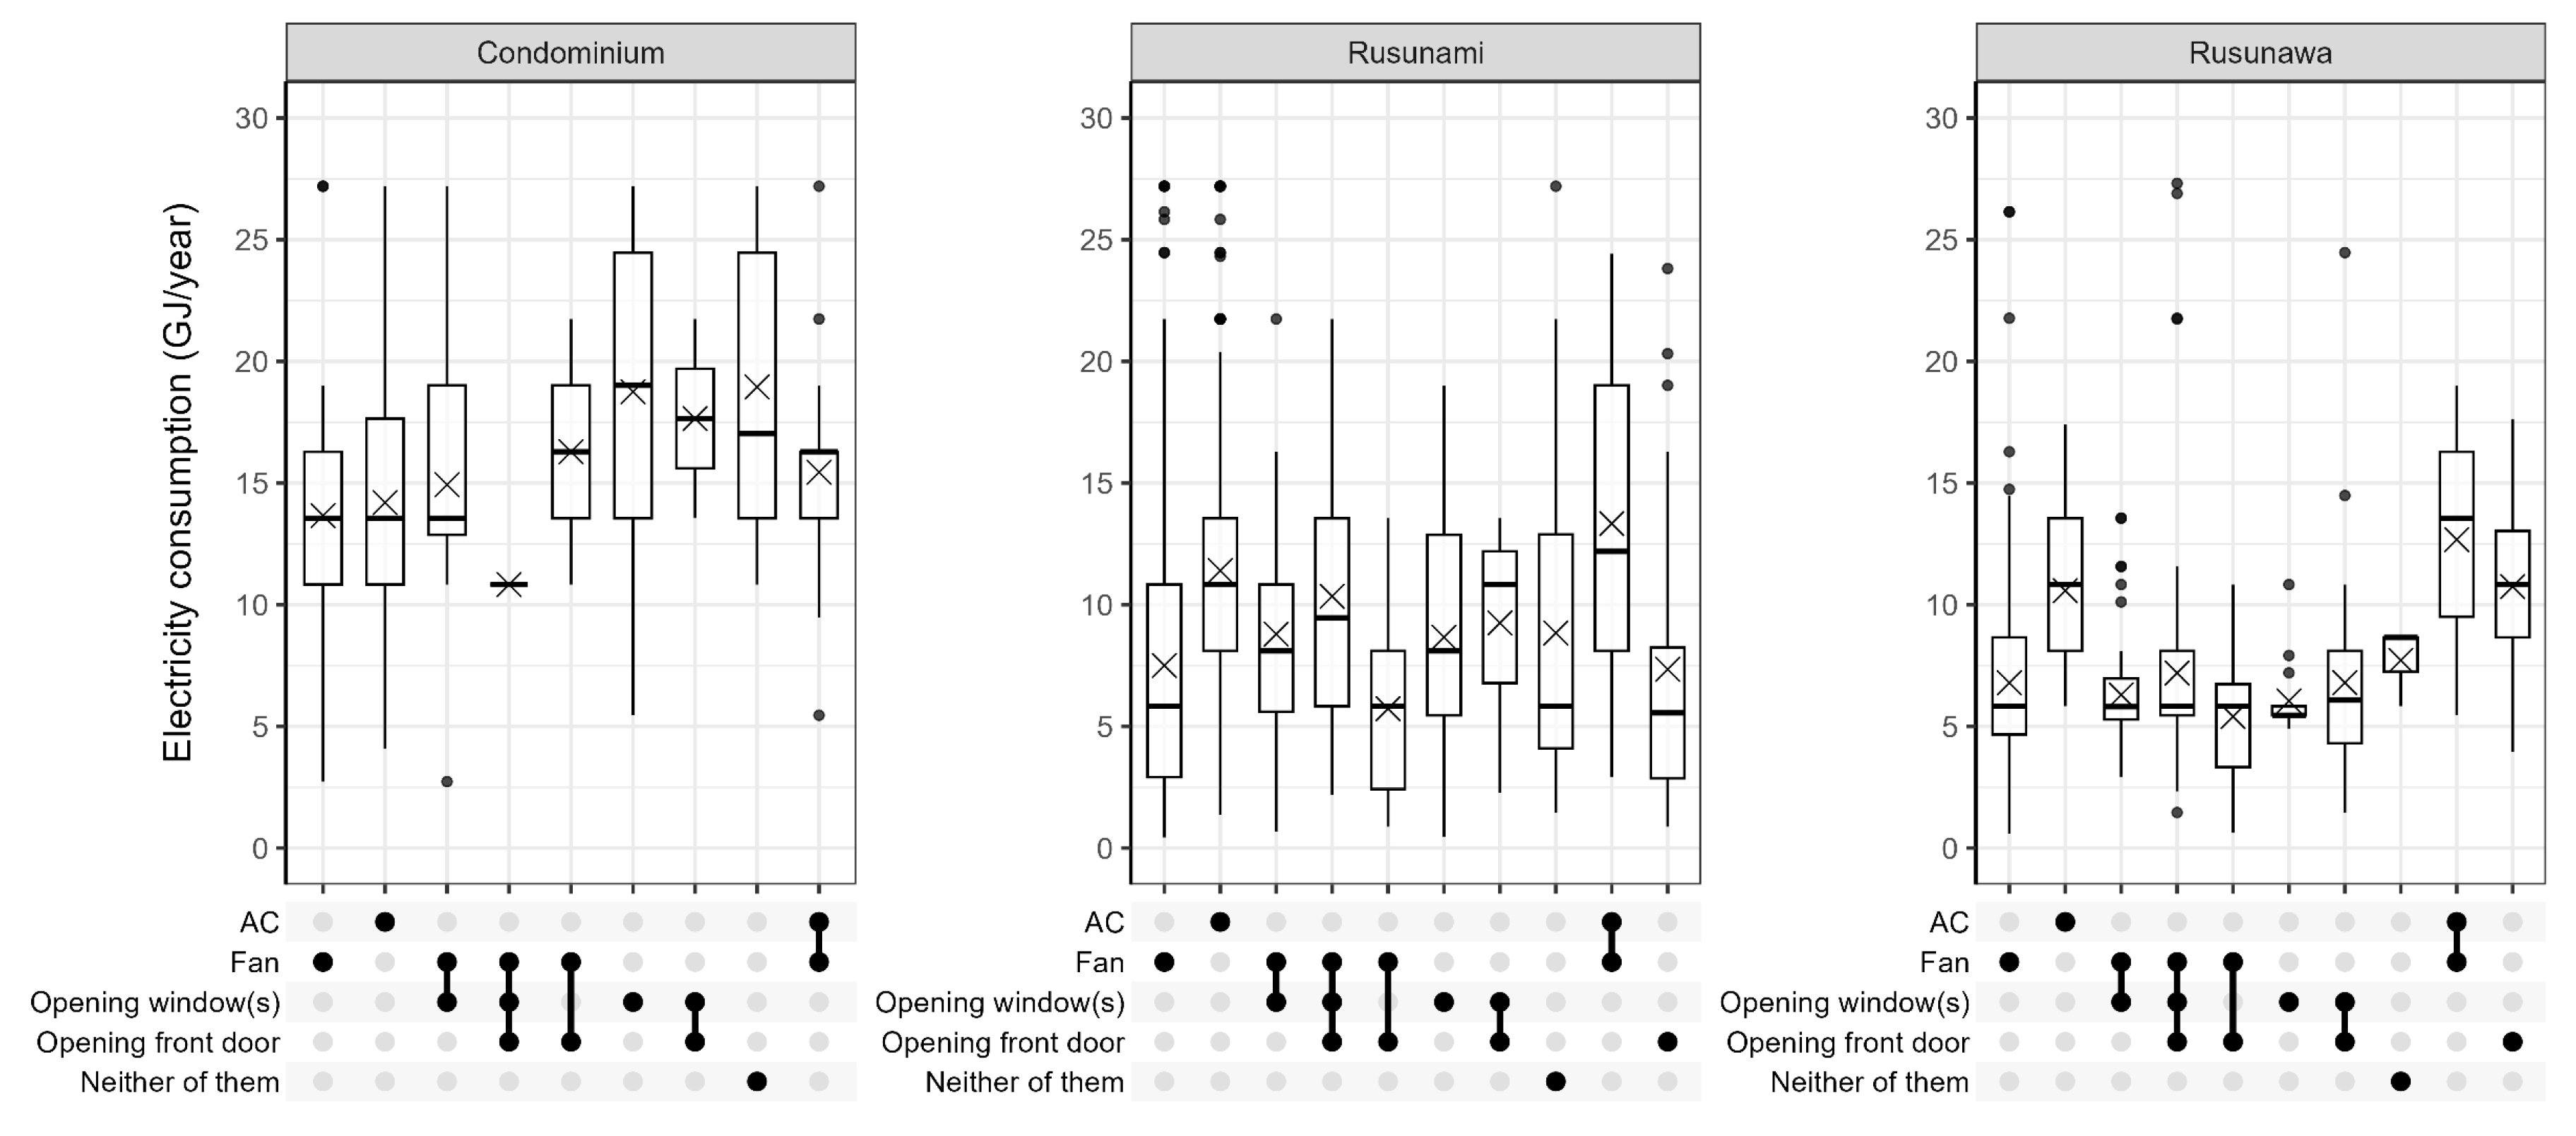
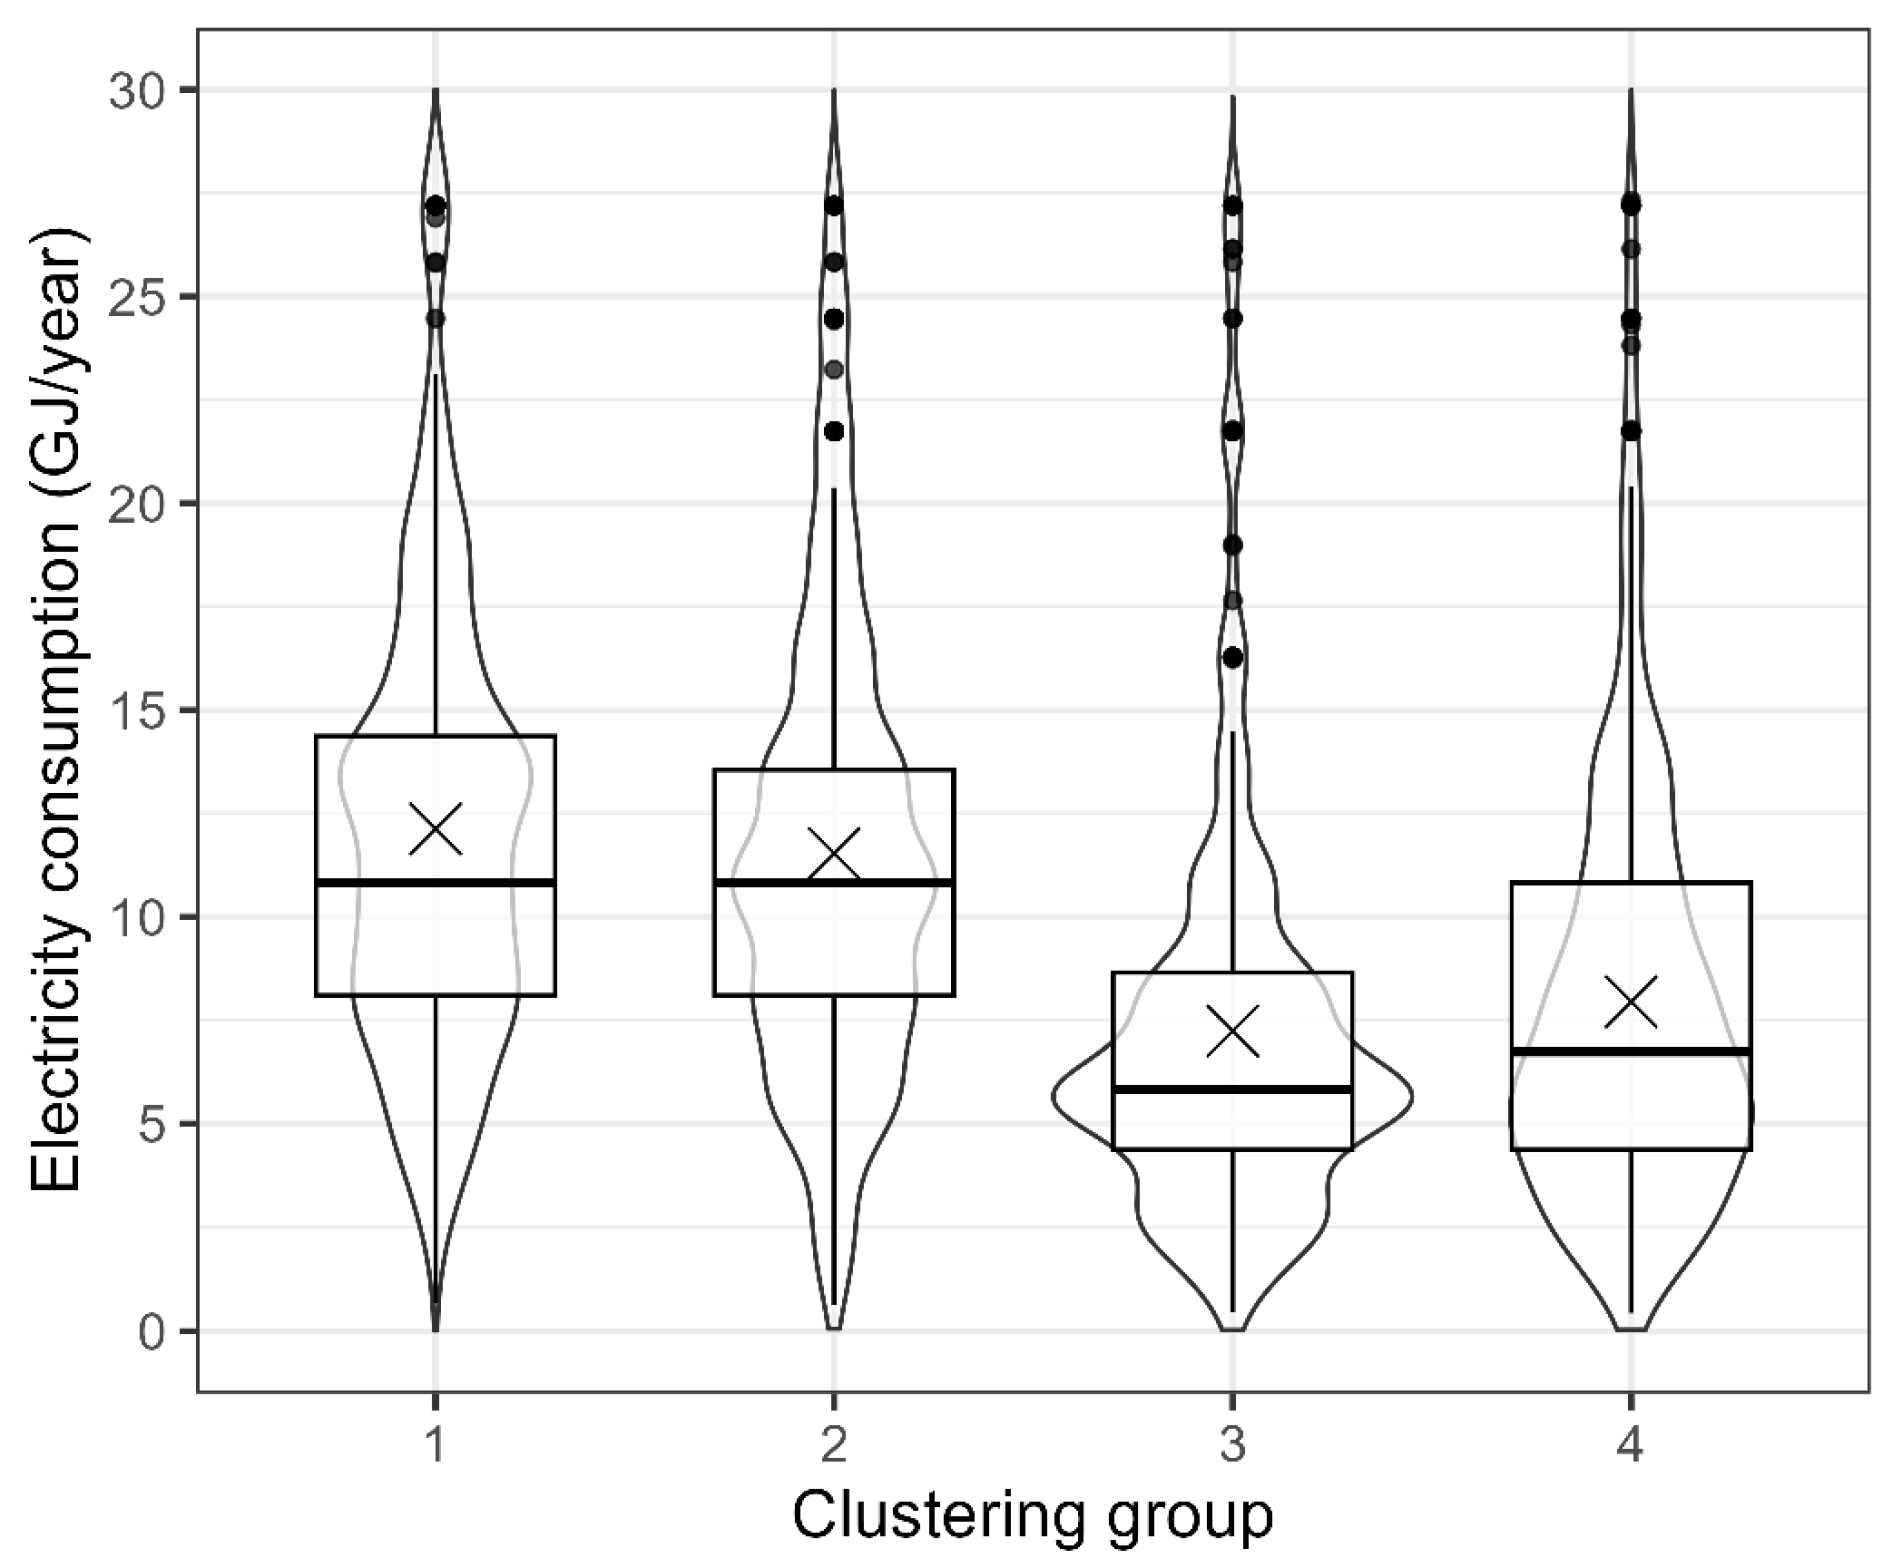
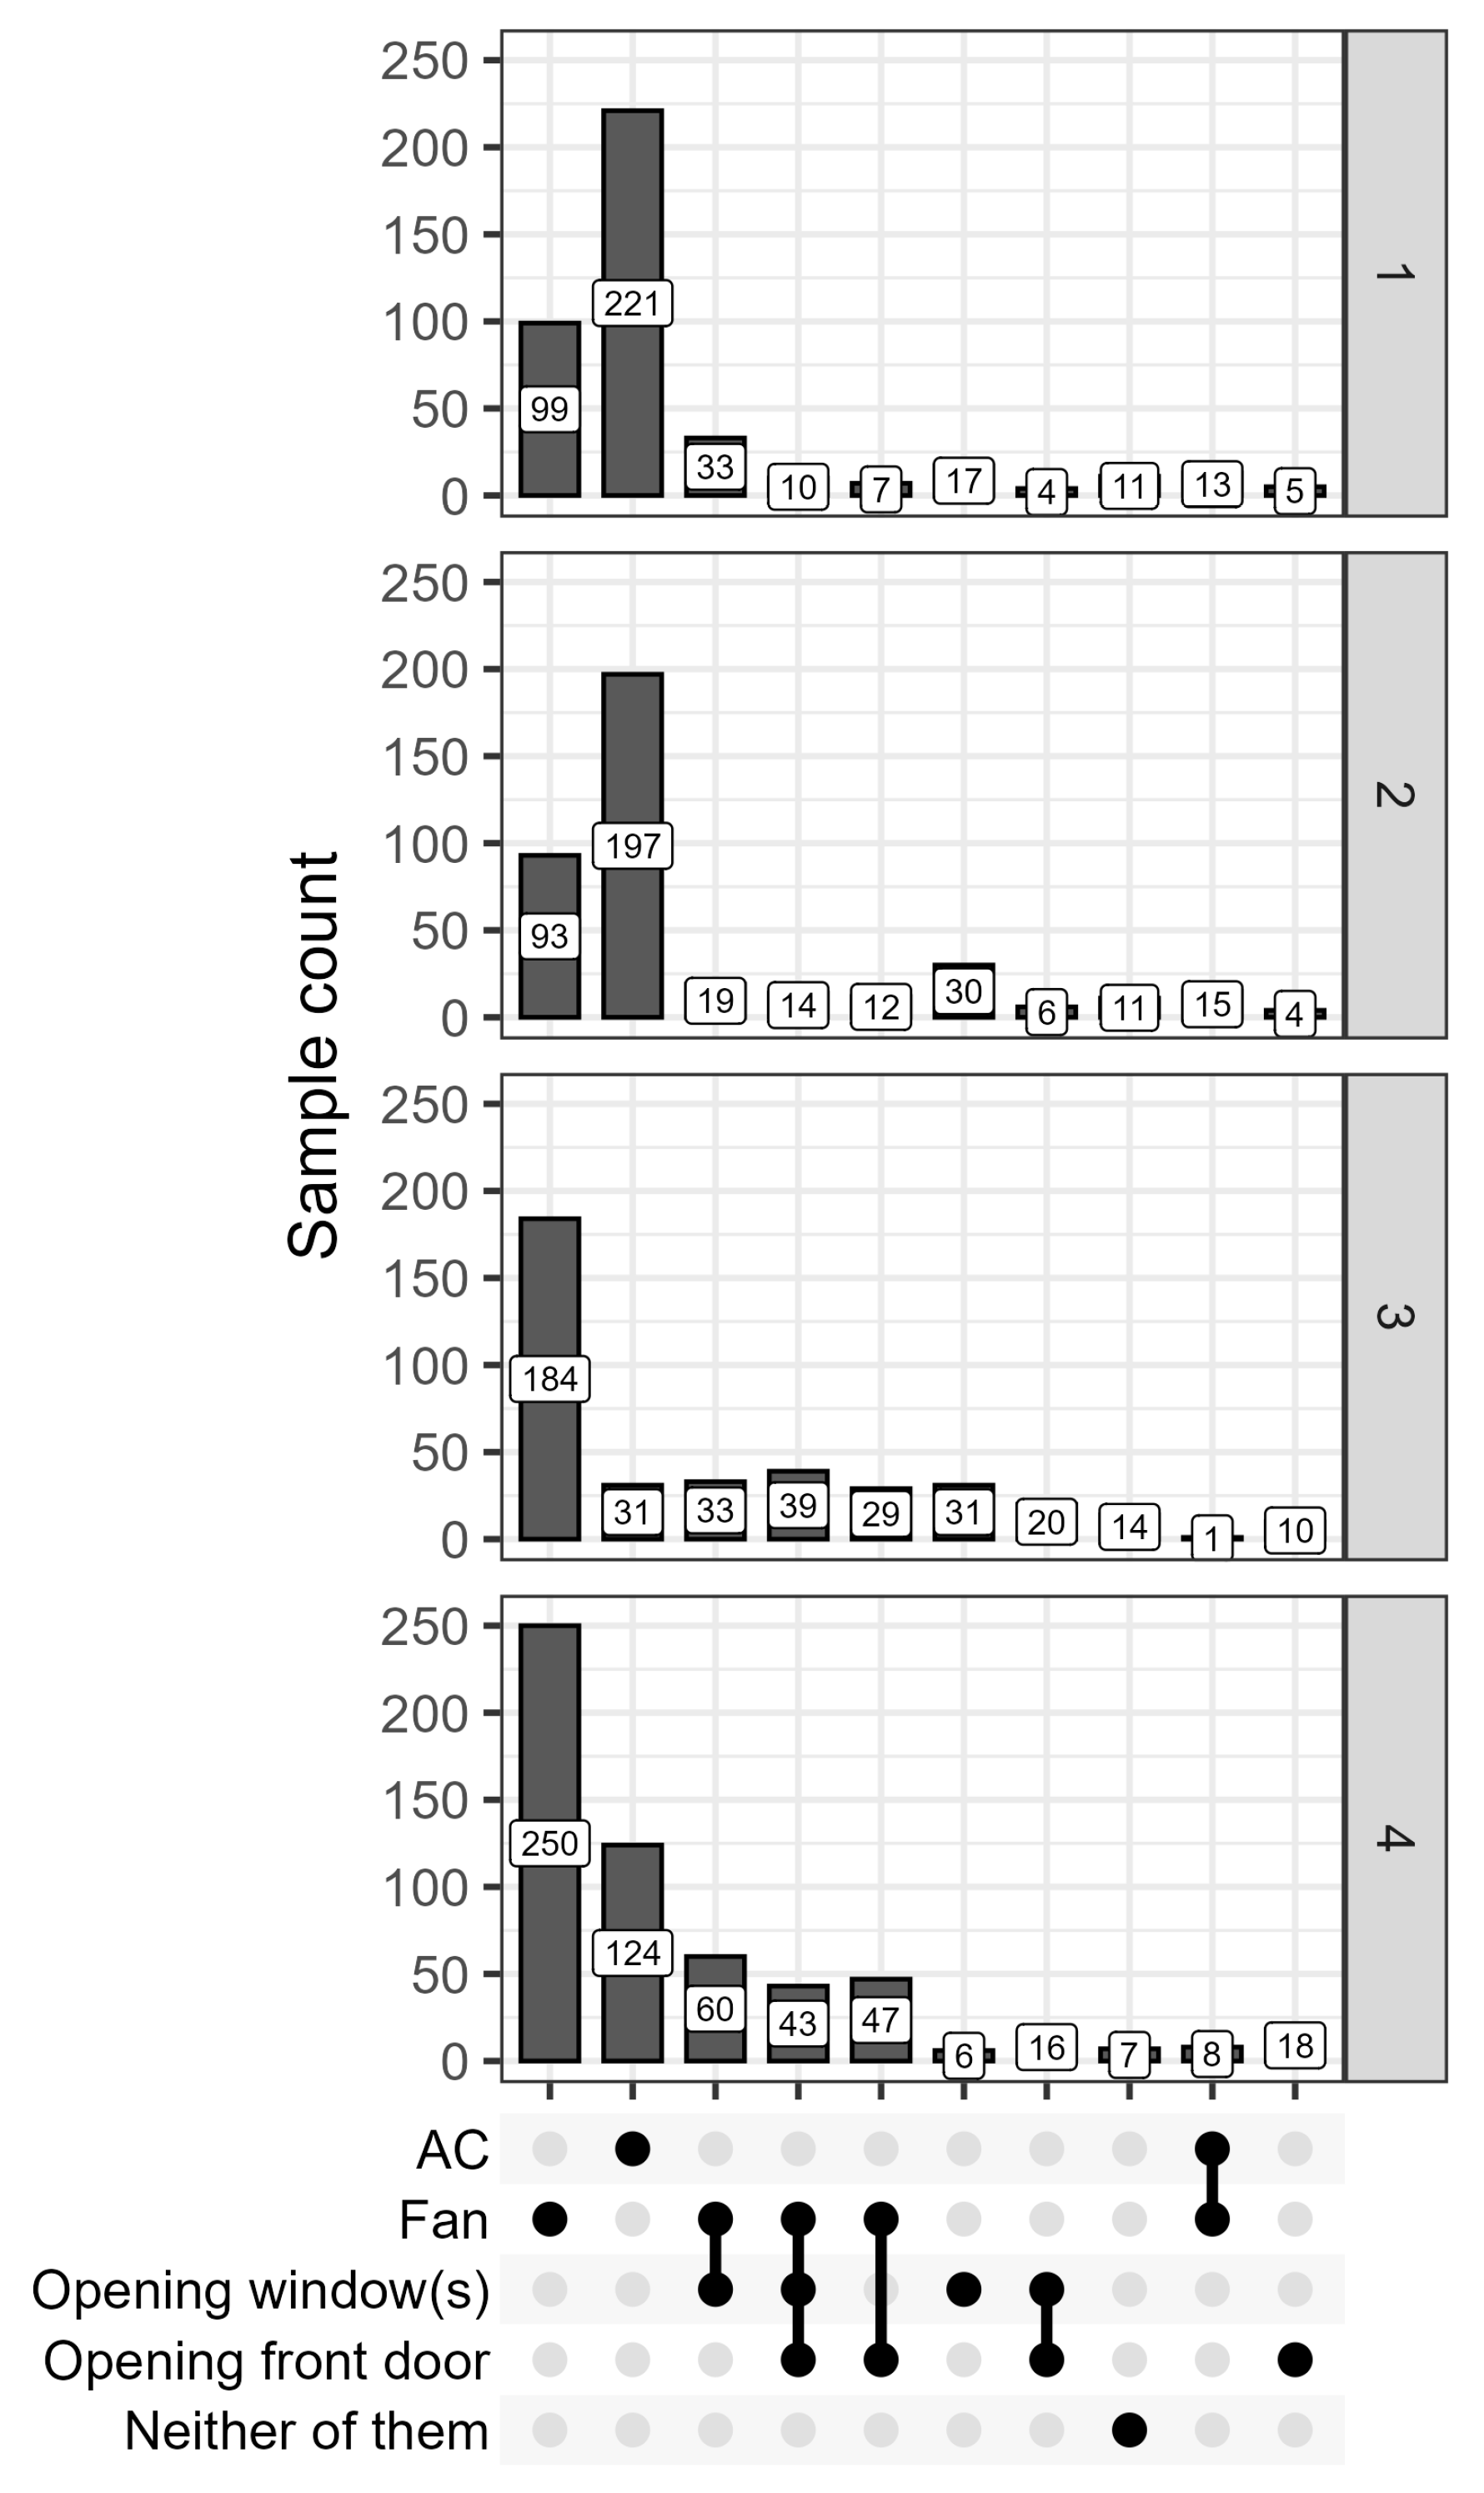
3.3. Energy Consumption and Thermal Adaptations

This section analyzes household average electricity consumption and thermal adaptative behaviors for each cluster. Figure 5 shows the annual electricity consumption in each cluster. Clusters C1 and C2 depict nearly normal distributions, whereas those of C3 and C4 skewed toward the lower portion of the box plot. The narrowest variance can be seen in C3, with a median of approximately 6 GJ/year. Meanwhile, C1 and C2 showed similar ranges and medians (11 GJ/year), whereas C3 and C4 had similar medians (6–7 GJ/year). C3 had the lowest energy consumption among all clusters.
Figure 6 shows the number of thermal adaptations used in each cluster. The main adaptation was AC in C1 and C2 and a fan in C3 and C4. AC usage was the lowest in C3, which also had the lowest electricity consumption. This indicates that the groups that consumed more electricity tended to demonstrate the behavior of sitting on chairs and mainly used AC for space cooling. The lower electricity consumption groups with floor-sitting behavior mainly utilized a fan for thermal adaptation during gathering activities. Window and door openings were indicated in all clusters.
The above results imply that natural ventilation with opening windows/doors alone was probably not satisfactory to achieve thermal comfort in their houses. AC, or fans, might be used as a supplemental means to ensure thermal comfort. Generally, in the Indonesian market, the mean wattage is apparently different for AC (382–1928 W) and a fan (<30–79 W) [55]. The difference primarily caused significant differences in household electricity consumption among the clusters.

3.4. Psychological Factors

In this section, the behavior of floor contact is analyzed with psychological factors. In particular, we elaborate on how individuals prefer (or do not prefer) floor-sitting and perceive thermal sensation, thermal comfort and satisfaction in their residential units, especially during gathering activities, through statistical analyses.

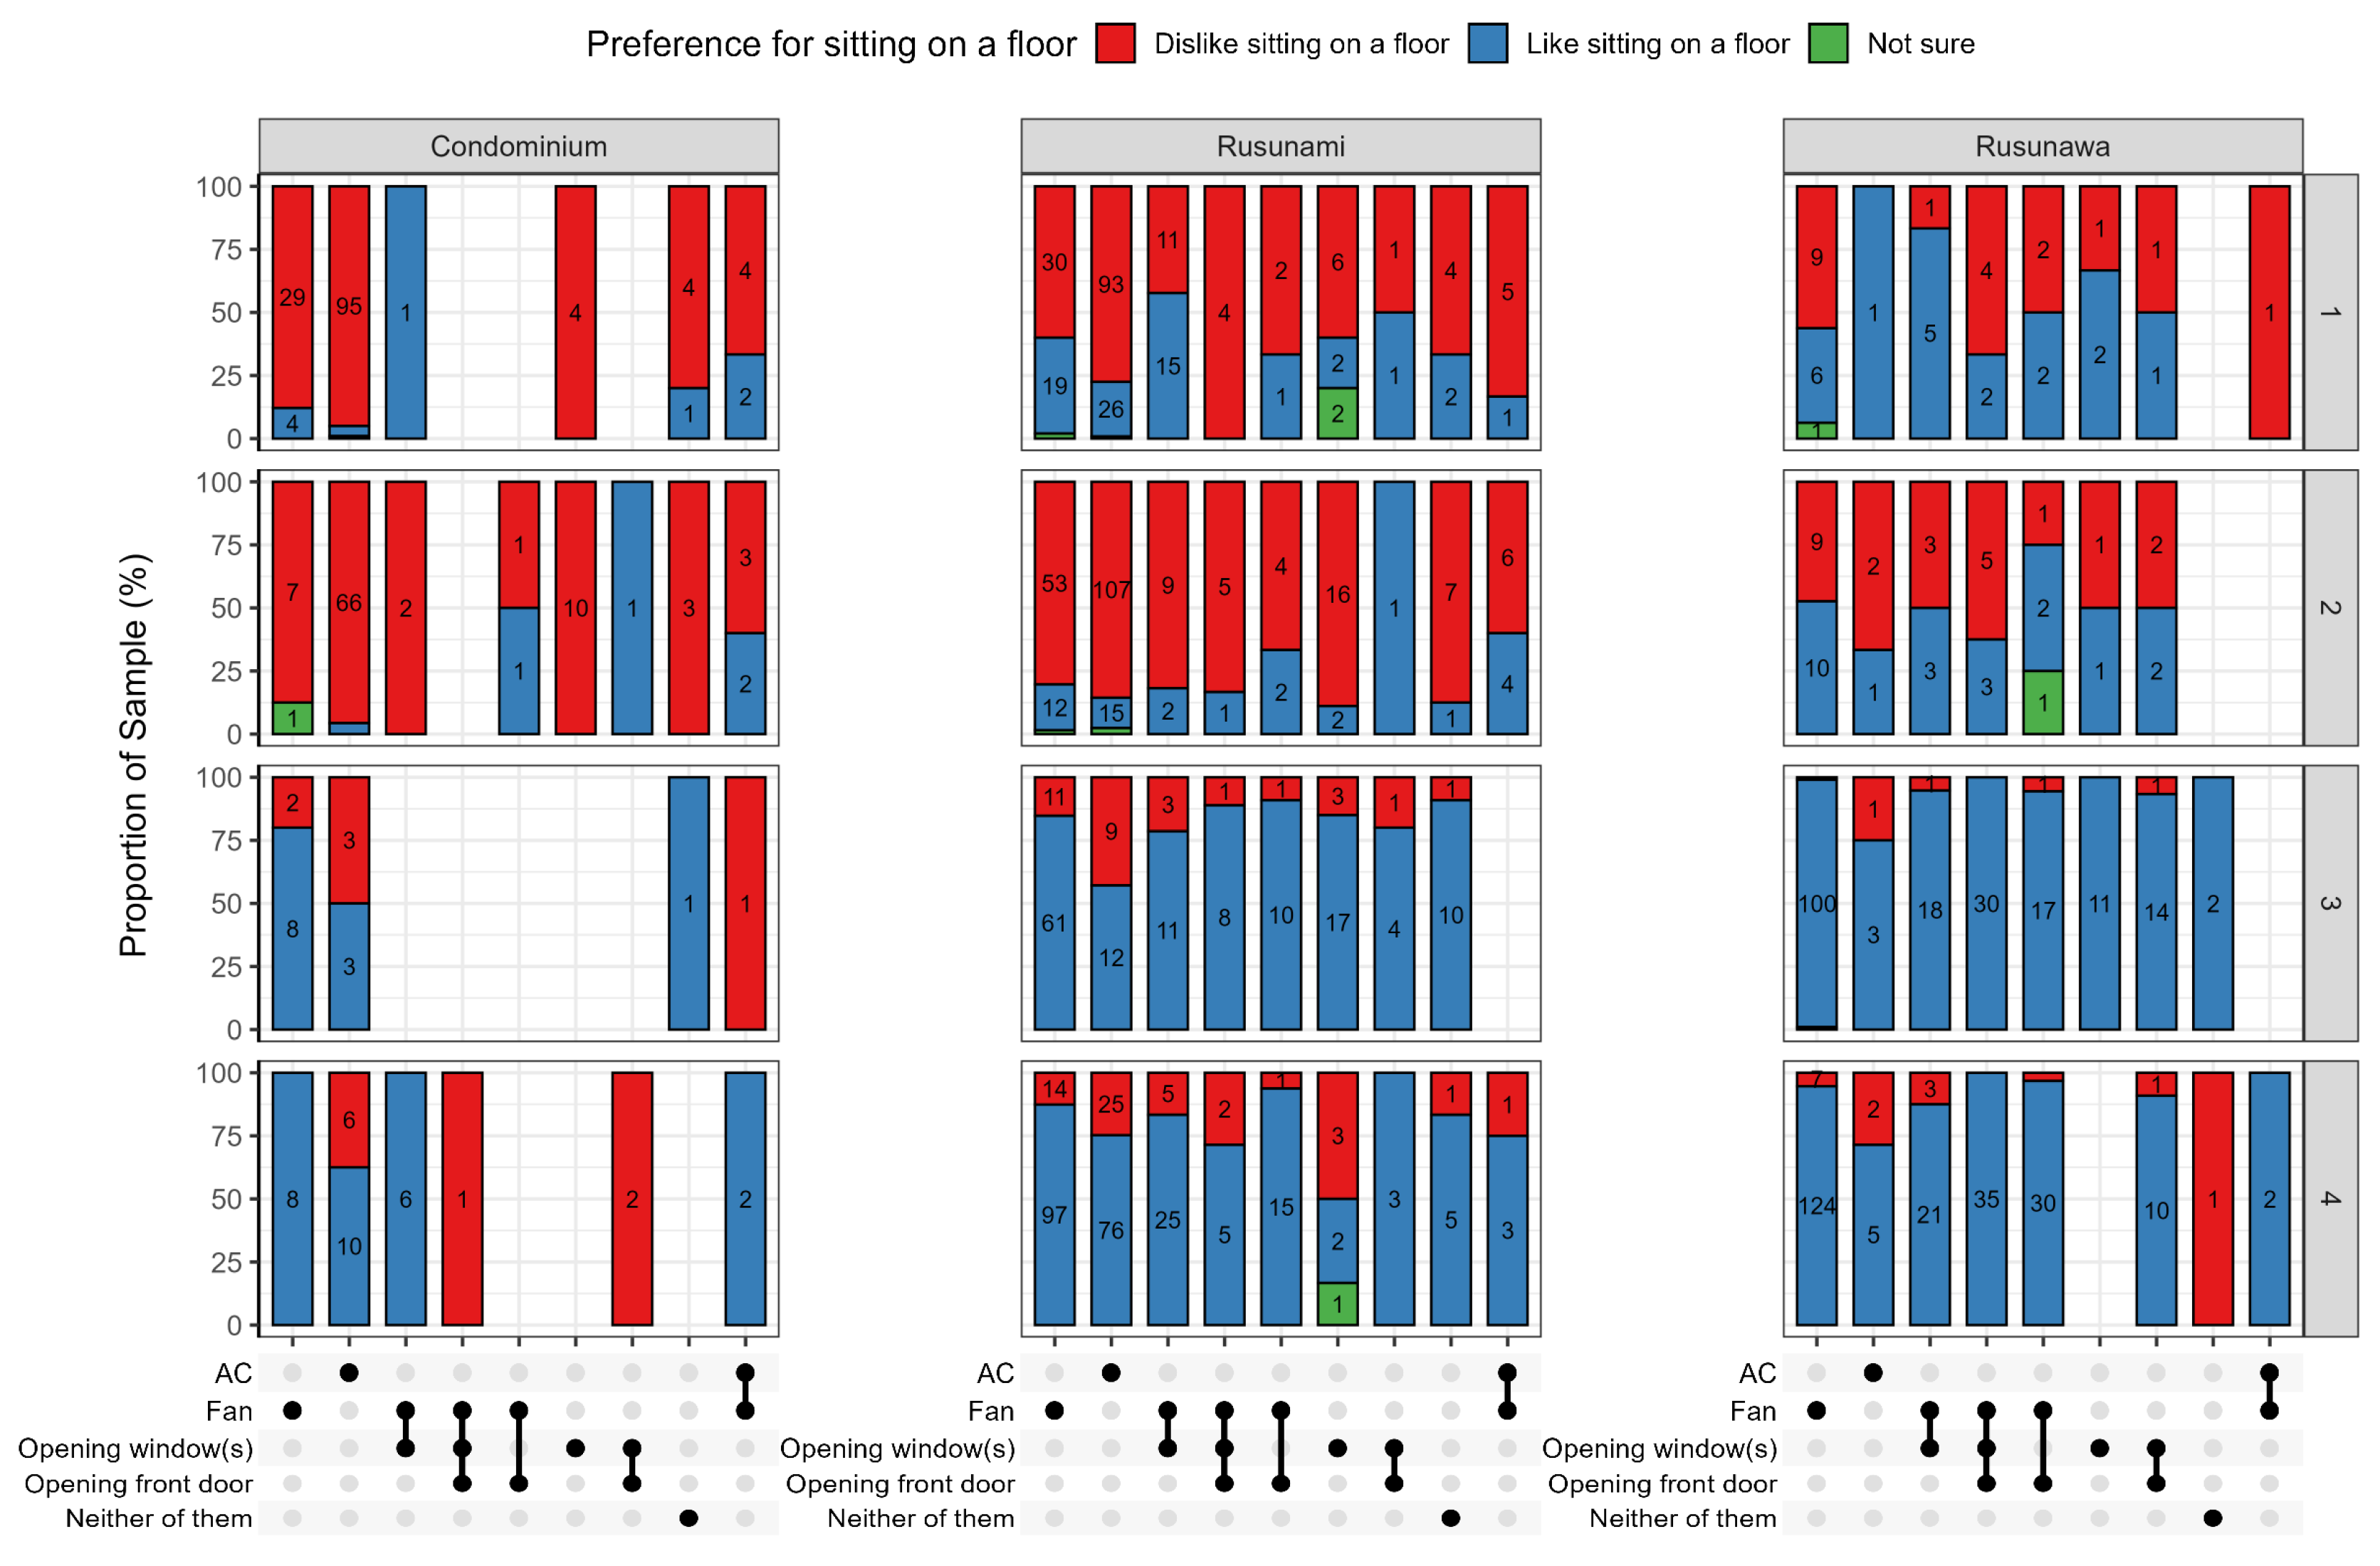
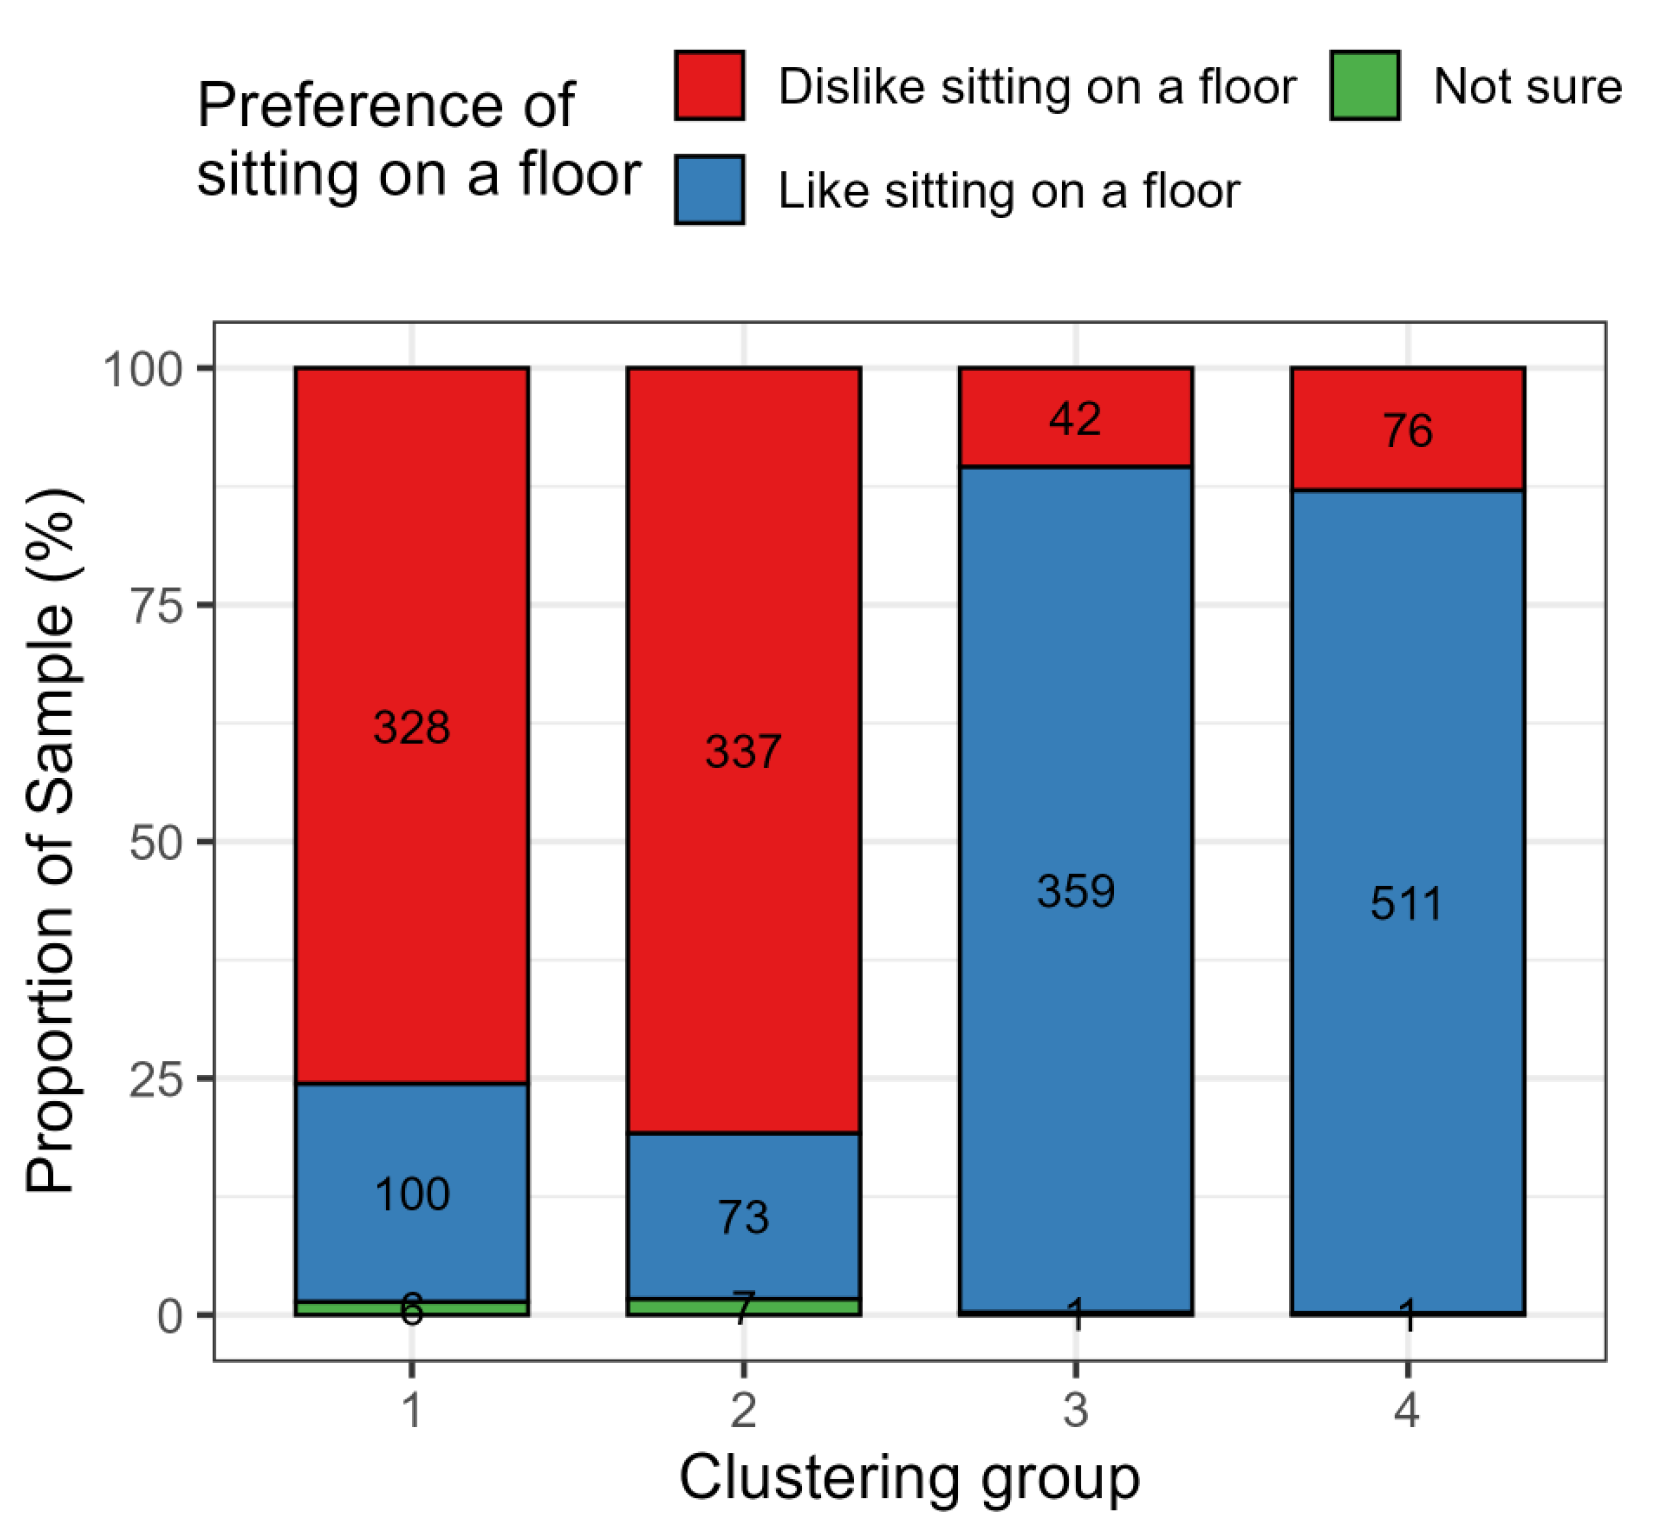
3.4.1. Preference of Floor-Sitting

This section analyzes the preferences and reasons for floor-sitting behaviors during gathering activities. As shown in Figure 7, there were clear differences in the floor-sitting preferences among the clusters. C3 and C4 show a stronger preference for floor-sitting, whereas a higher percentage of “dislike sitting on the floor” was found in C1 and C2. These tendencies are the same as the actual postures shown in Figure 3.
Figure 8 shows the reasons for preferring and not preferring floor-sitting during gathering activities in each cluster. The main reasons for preferring it include “comfortable,” “cool” and “habit” for all clusters. The reason for “habit” was particularly high in C3, while “cool” was high in C1 and C2. Even in C1 and C2, who mainly had chair/sofa-sitting behaviors and used AC (see Figure 3 and Figure 6), approximately 20% of the respondents still preferred floor-sitting for its comfort and coolness. Nevertheless, the main reason for not preferring floor-sitting was “uncomfortable” for all clusters, followed by “too hot”, except for C2.
Table 2 shows the results of the odds ratios in the binary logistic regression analysis for the preferences and reasons for floor-sitting. An odds ratio greater than 1 indicates a positive correlation between the objective and explanatory variables, while a ratio of less than 1 indicates a negative correlation between them. Significant differences (p < 0.05 *, 0.01 **, 0.001 ***) are highlighted (“Odds ratio > 1” is highlighted in red and “Odds ratio < 1” in blue). The results show that the respondents who owned an AC were less likely to prefer floor-sitting, while those who owned a fan were likely to prefer the same. The respondents in Rusunawa and Rusunami showed a higher preference for floor-sitting than those in condominiums. The respondents with more family members showed a higher preference for floor-sitting than those without family members. The respondents who lived in two- to three-bedroom units and/or had a higher income were less likely to prefer floor-sitting.
Regarding the reasons for preferring floor-sitting, “cool” and “comfortable” were less likely for respondents who did not use a mat/carpet on the floor, whereas “habit” was a more likely reason. In Rusunawa and Rusunami, “cool” was a more dominant reason than in condominiums. Furthermore, “comfortable” and “habit” were less likely reasons for respondents who had family members. Finally, the respondents with a higher income gave “cool” as the reason more often than “habit”.
In contrast, the results of disliking floor-sitting are the opposite of those for preferring floor-sitting. The respondents who owned two or more ACs were more likely to give “uncomfortable” as the reason for not preferring floor-sitting. The respondents who owned an AC and/or did not use a mat/carpet on the floor were less likely to answer “too hot” as the reason. However, “furniture is available” showed the opposite trend, and this was given as a reason by the respondents who did not use a mat/carpet. In contrast, the respondents who owned an AC and/or opened the windows/doors were less likely to indicate such a tendency. The respondents who answered feeling hotter (thermal sensation) during nighttime were likely to answer “uncomfortable” and less likely to answer “too hot” as the reasons. Possibly, they may use AC during nighttime and prefer not to sit on the floor.
The distribution of reasons for preferring and not preferring the floor across the clusters reveals a significant relationship with apartment unit size, as shown in Table A1 (Appendix A), which can be broadly categorized into two groups. Smaller units (C3, C4), where space limitations are more evident, tend to show a higher prevalence of floor-sitting behaviors, often driven by restricted furniture availability and the cooling effect of direct floor contact. Conversely, larger units (C1, C2) demonstrate a reduced tendency for floor-sitting, as increased space and greater access to furniture offer alternative sitting options, with thermal comfort and lifestyle preferences becoming more influential.
Notably, cultural factors such as habit and family tradition remain consistent across different unit sizes, suggesting that while spatial constraints affect sitting preferences, traditional practices continue to play a significant role in shaping floor-usage behavior. This result suggests how unit size can influence both thermal comfort strategies and the persistence of cultural habits in Southeast Asia.

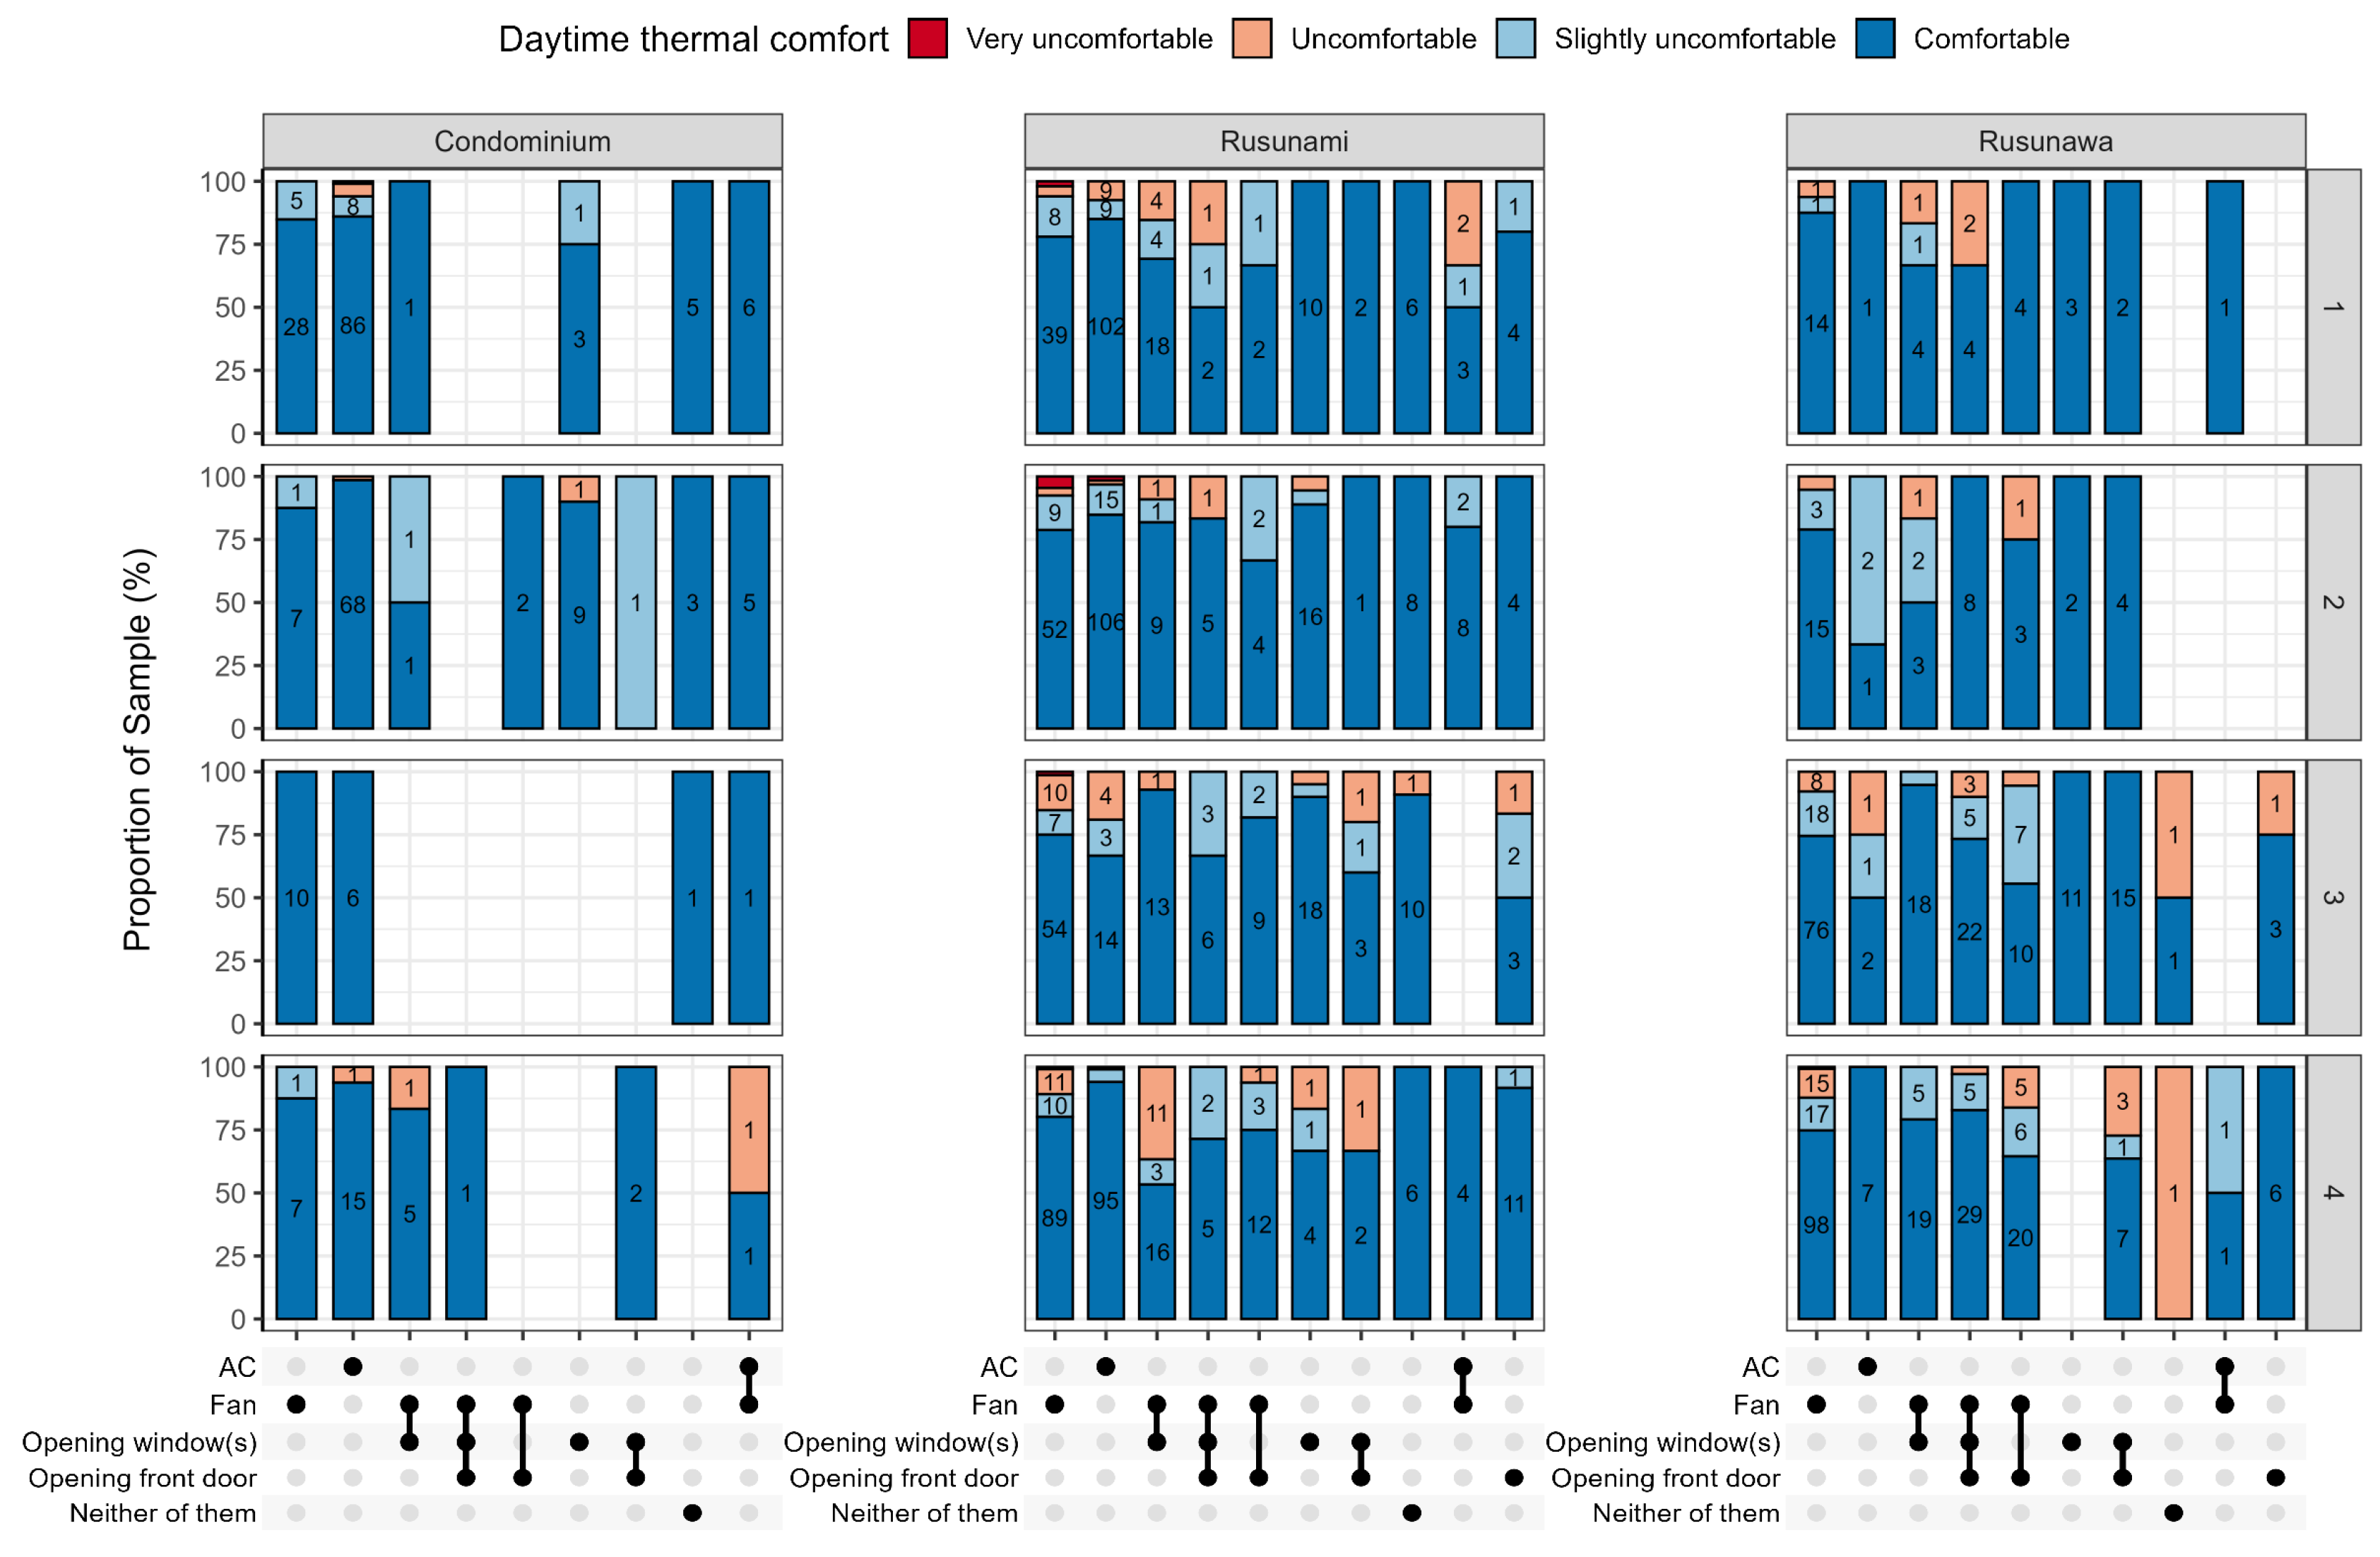
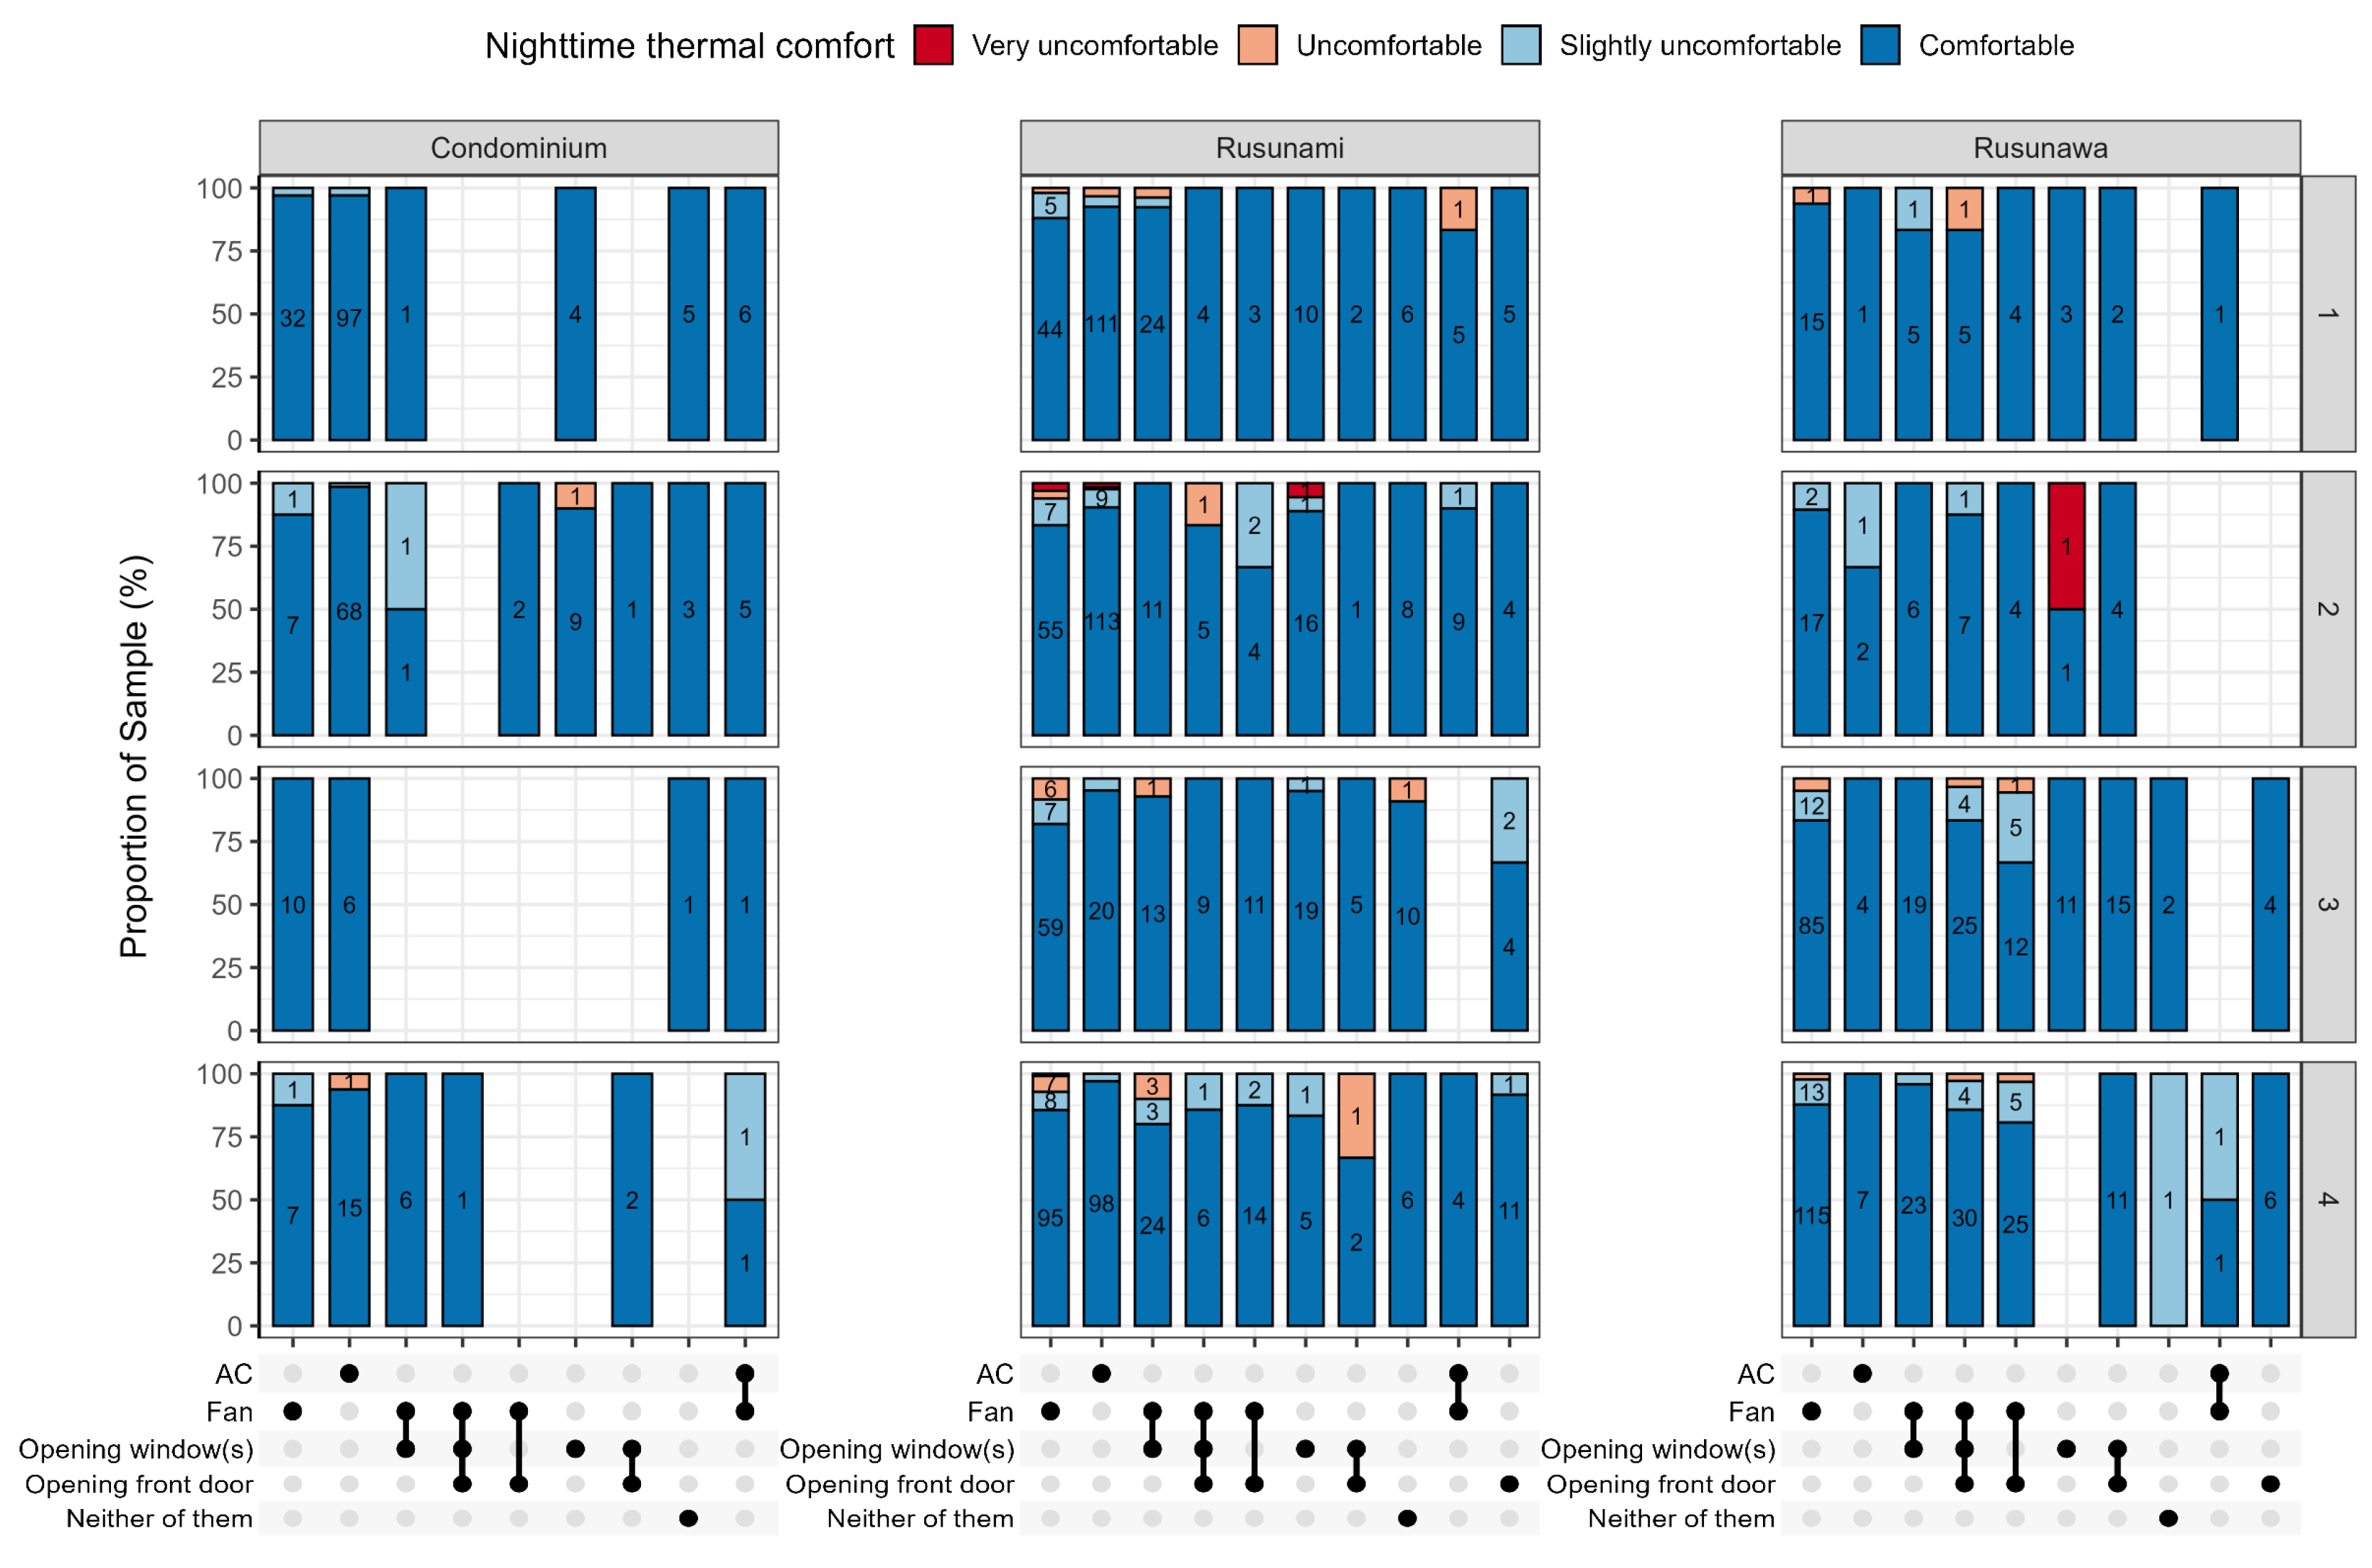
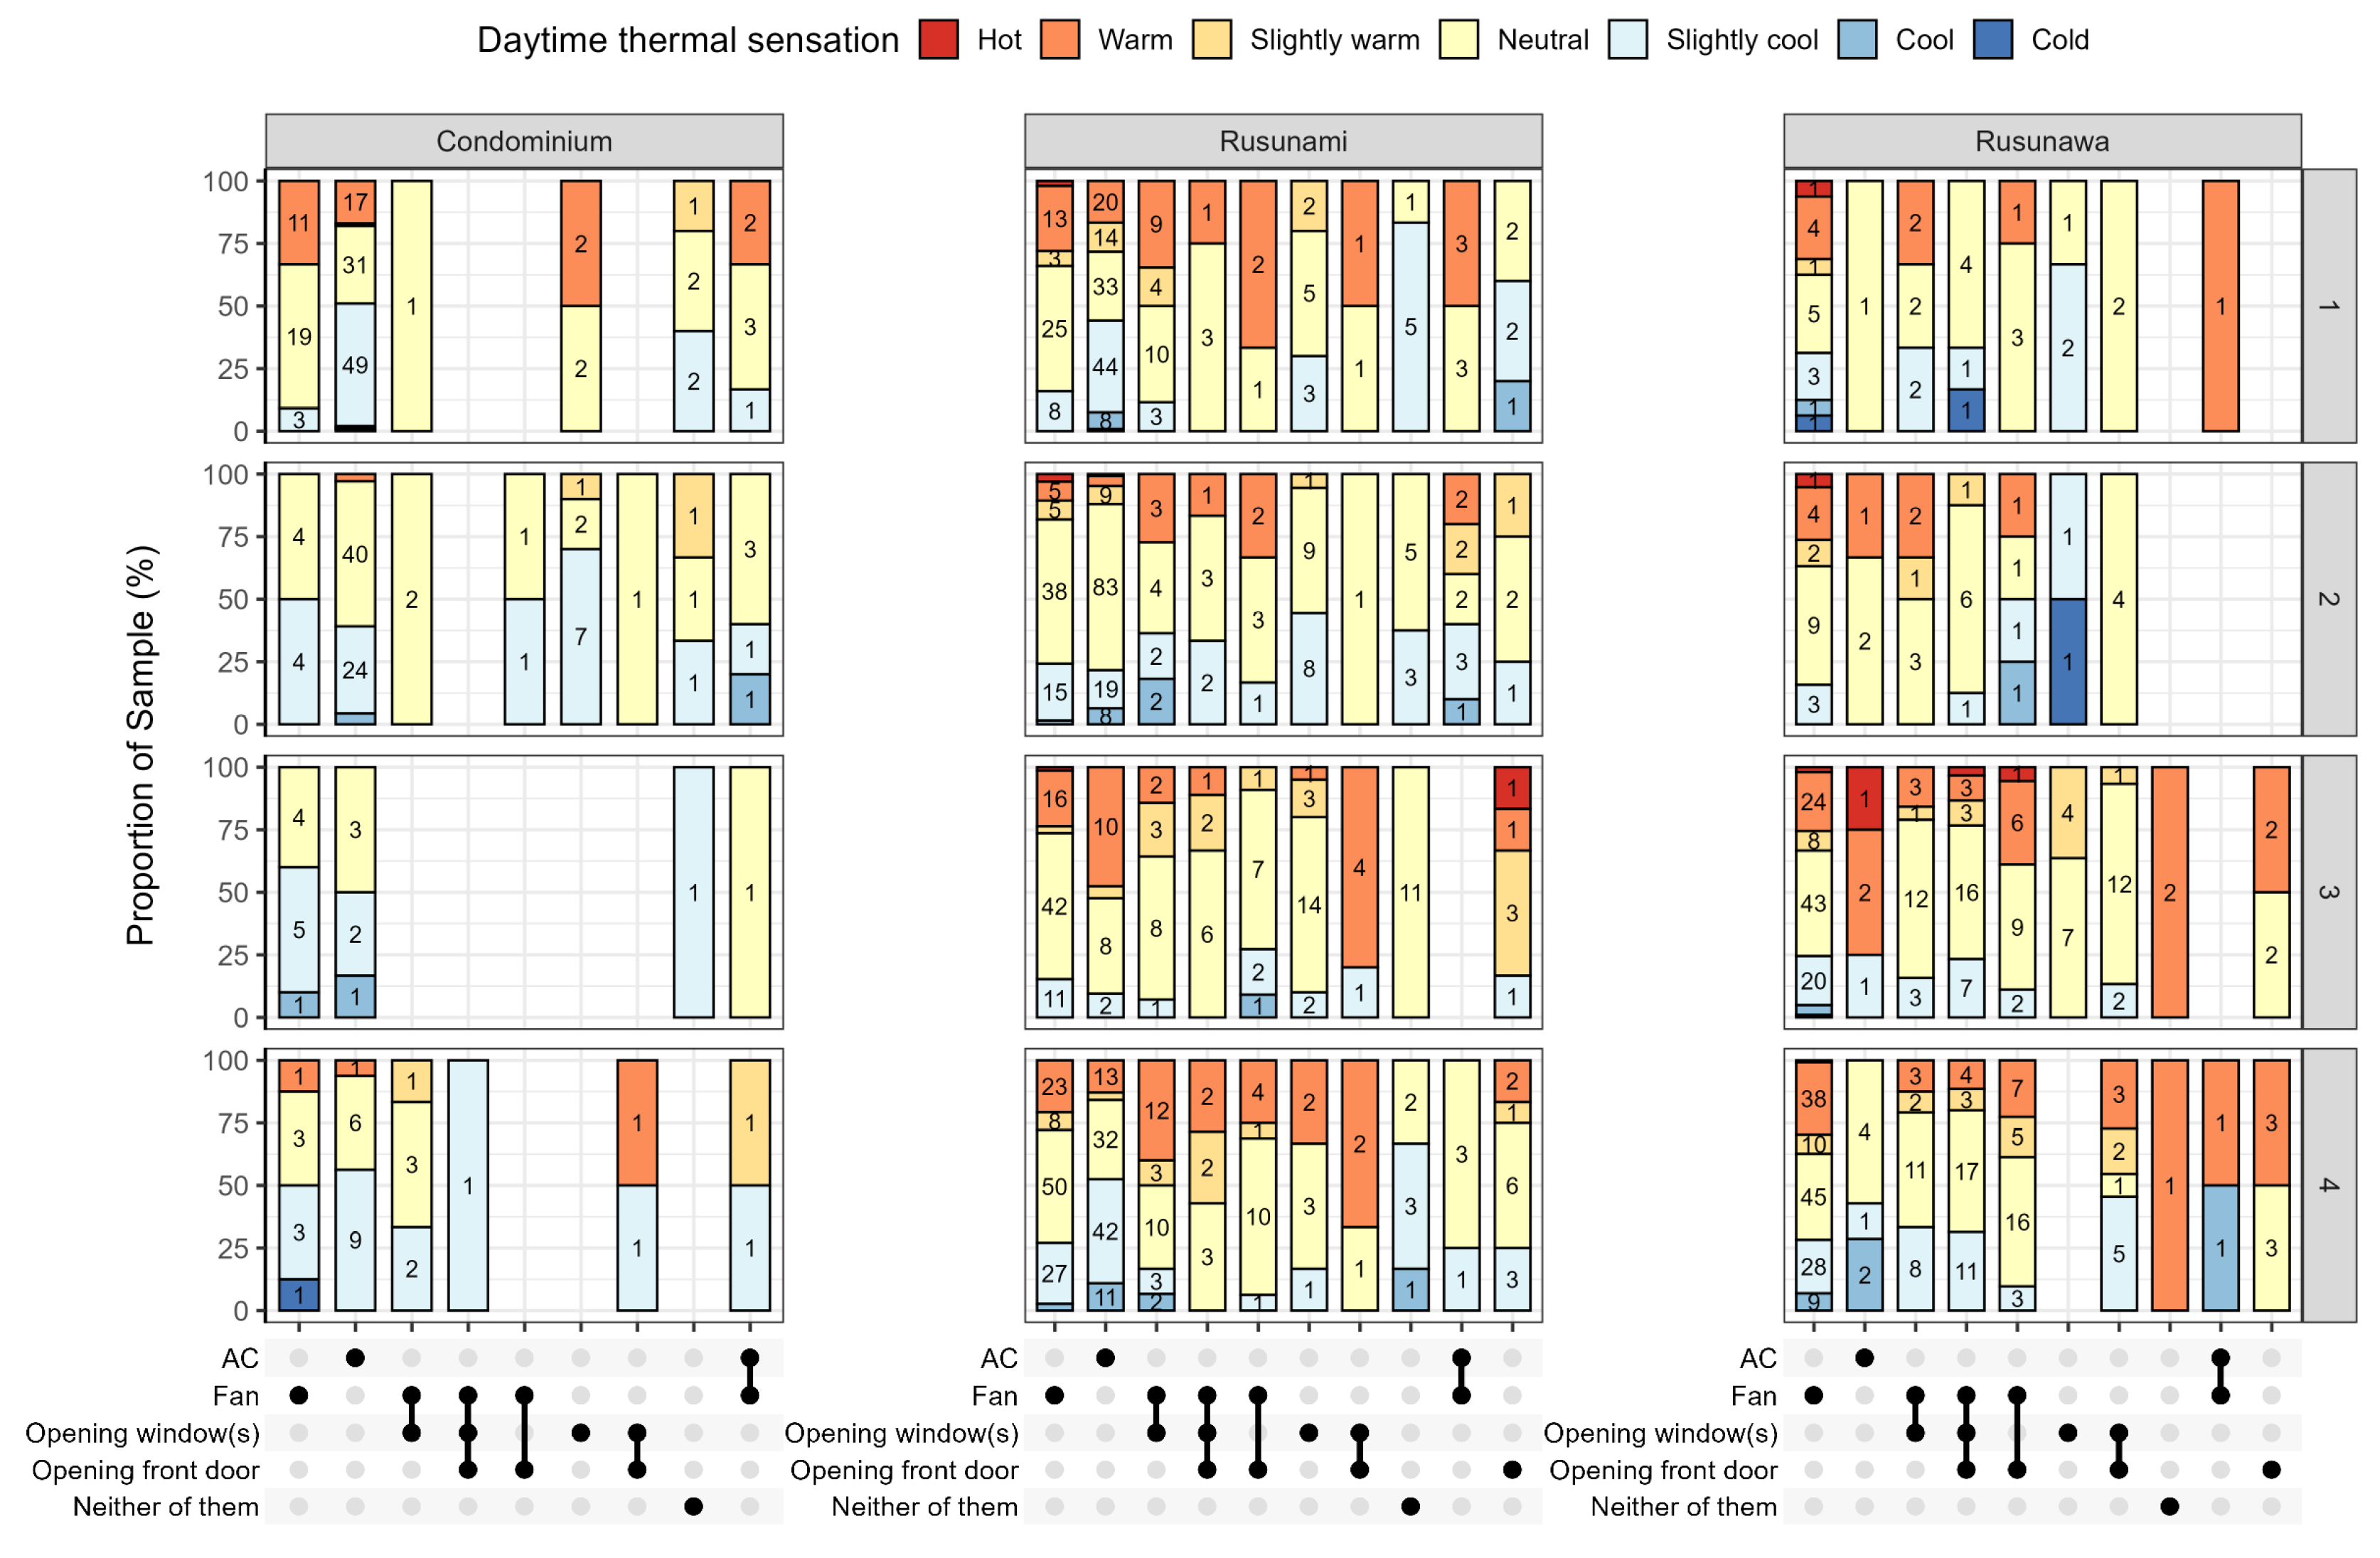
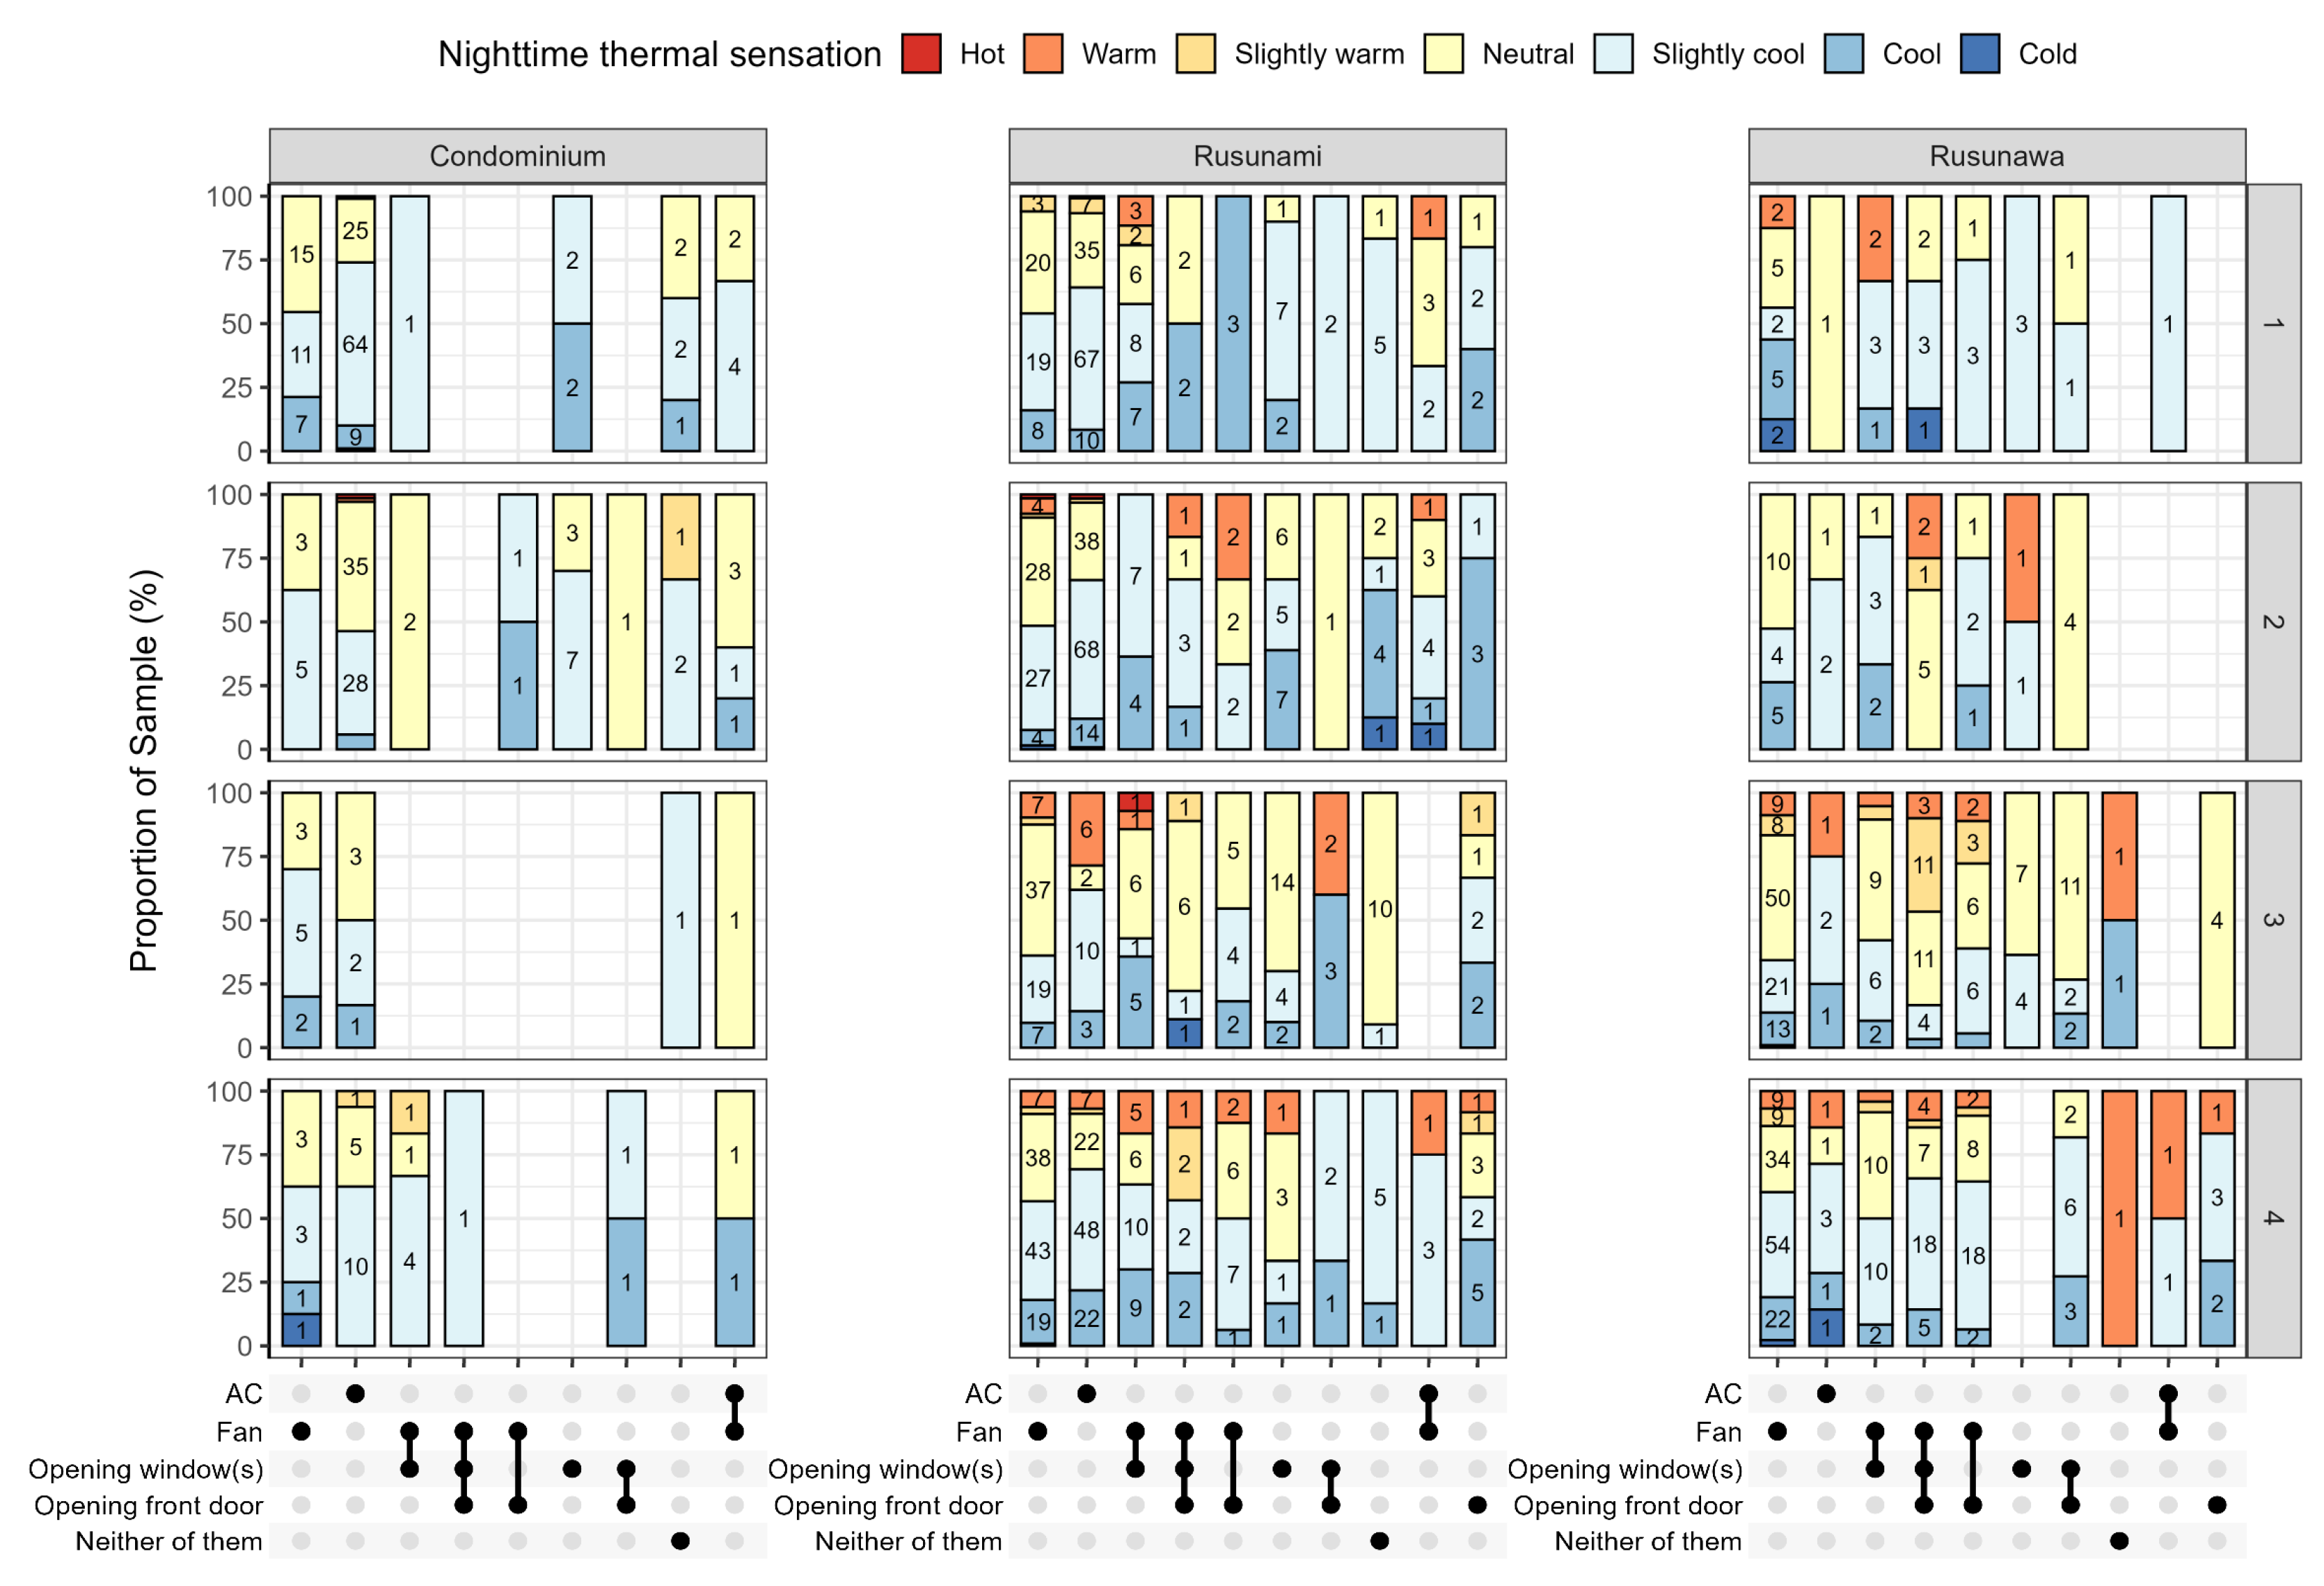
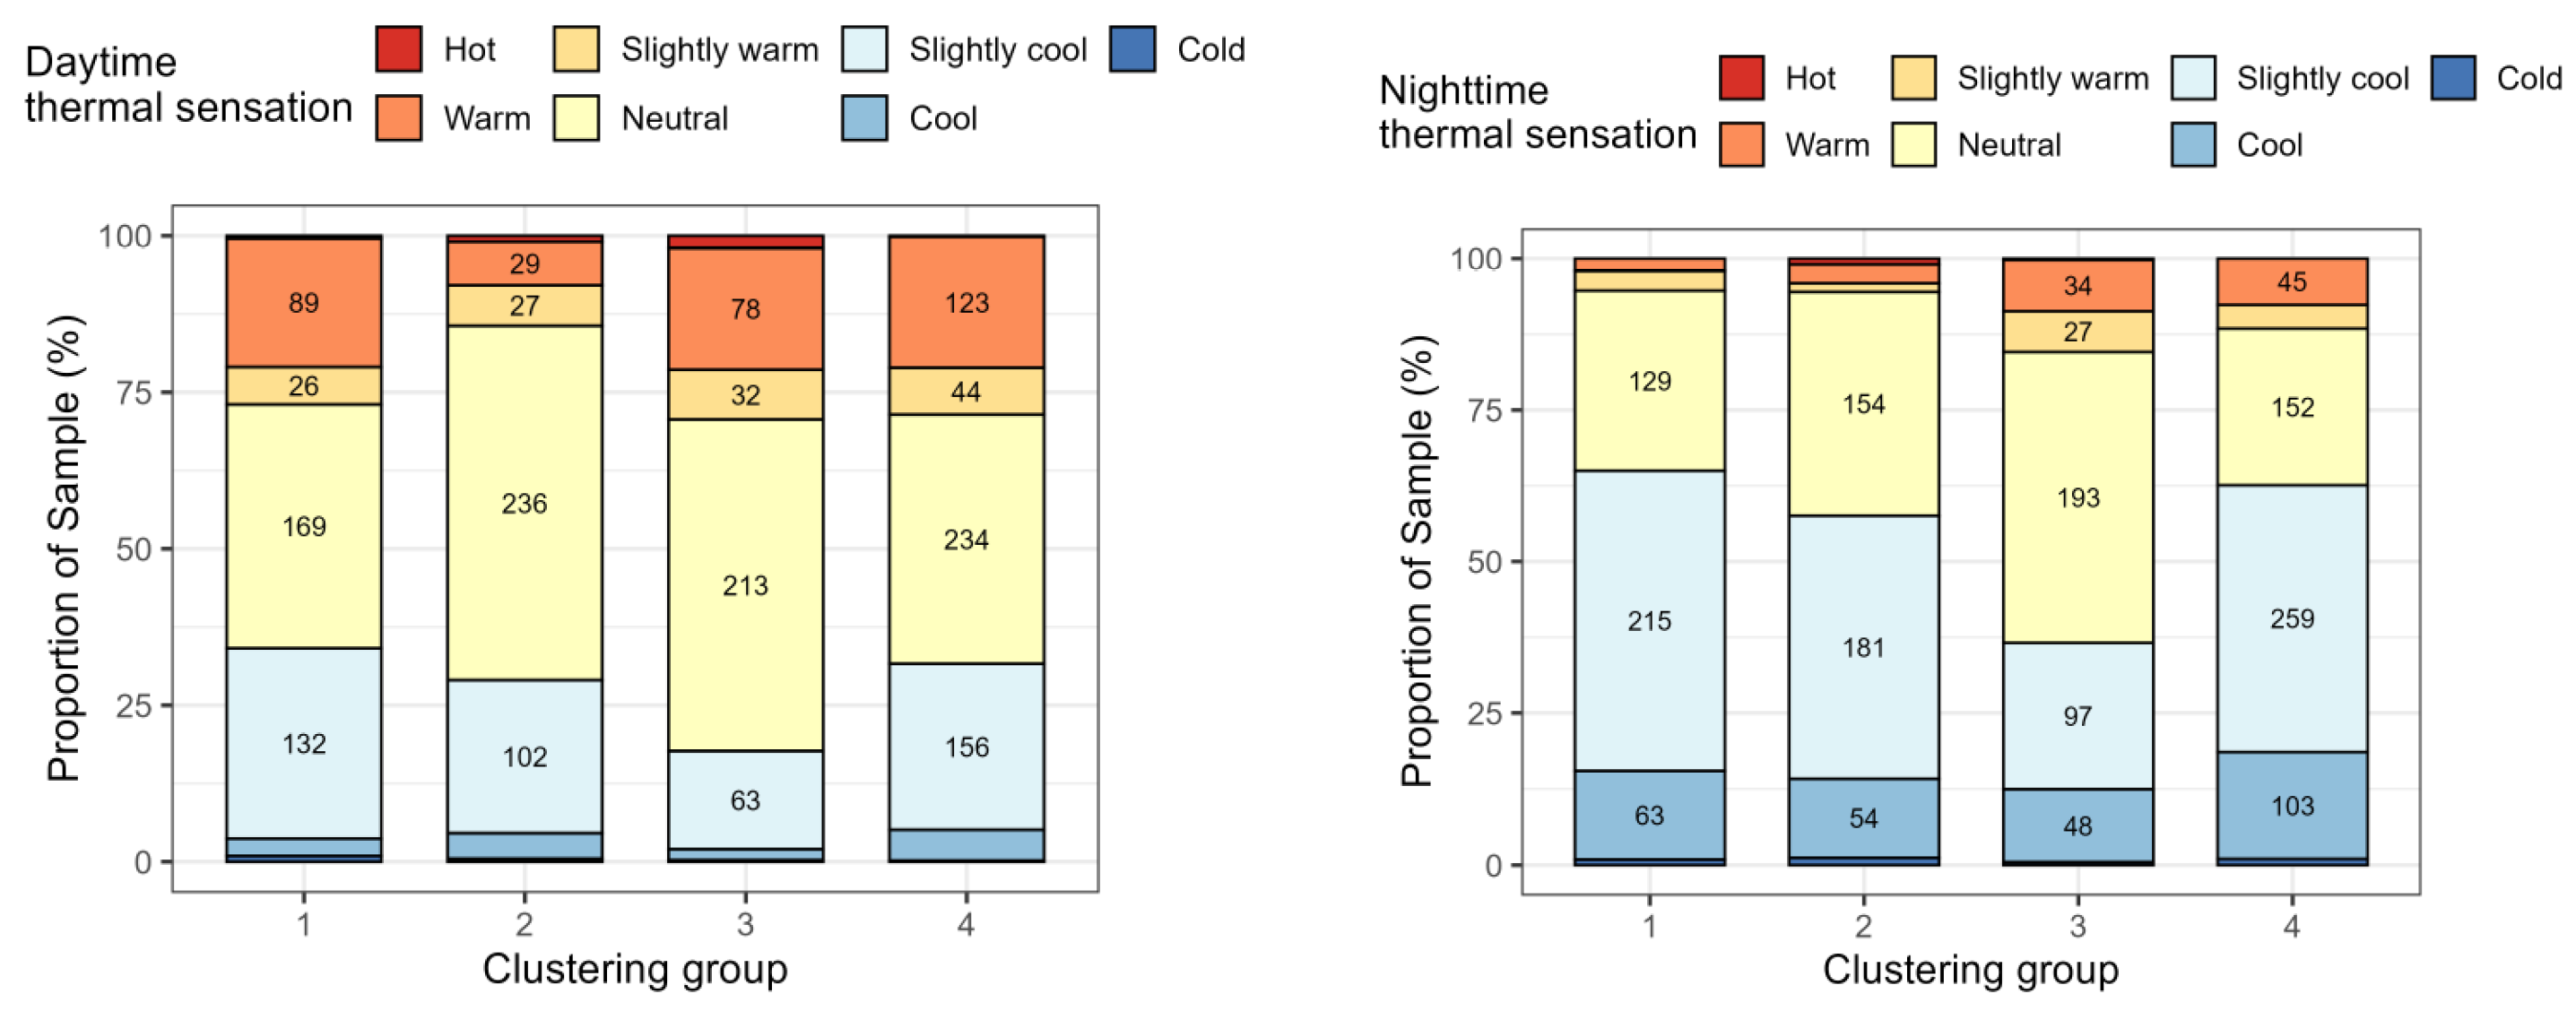
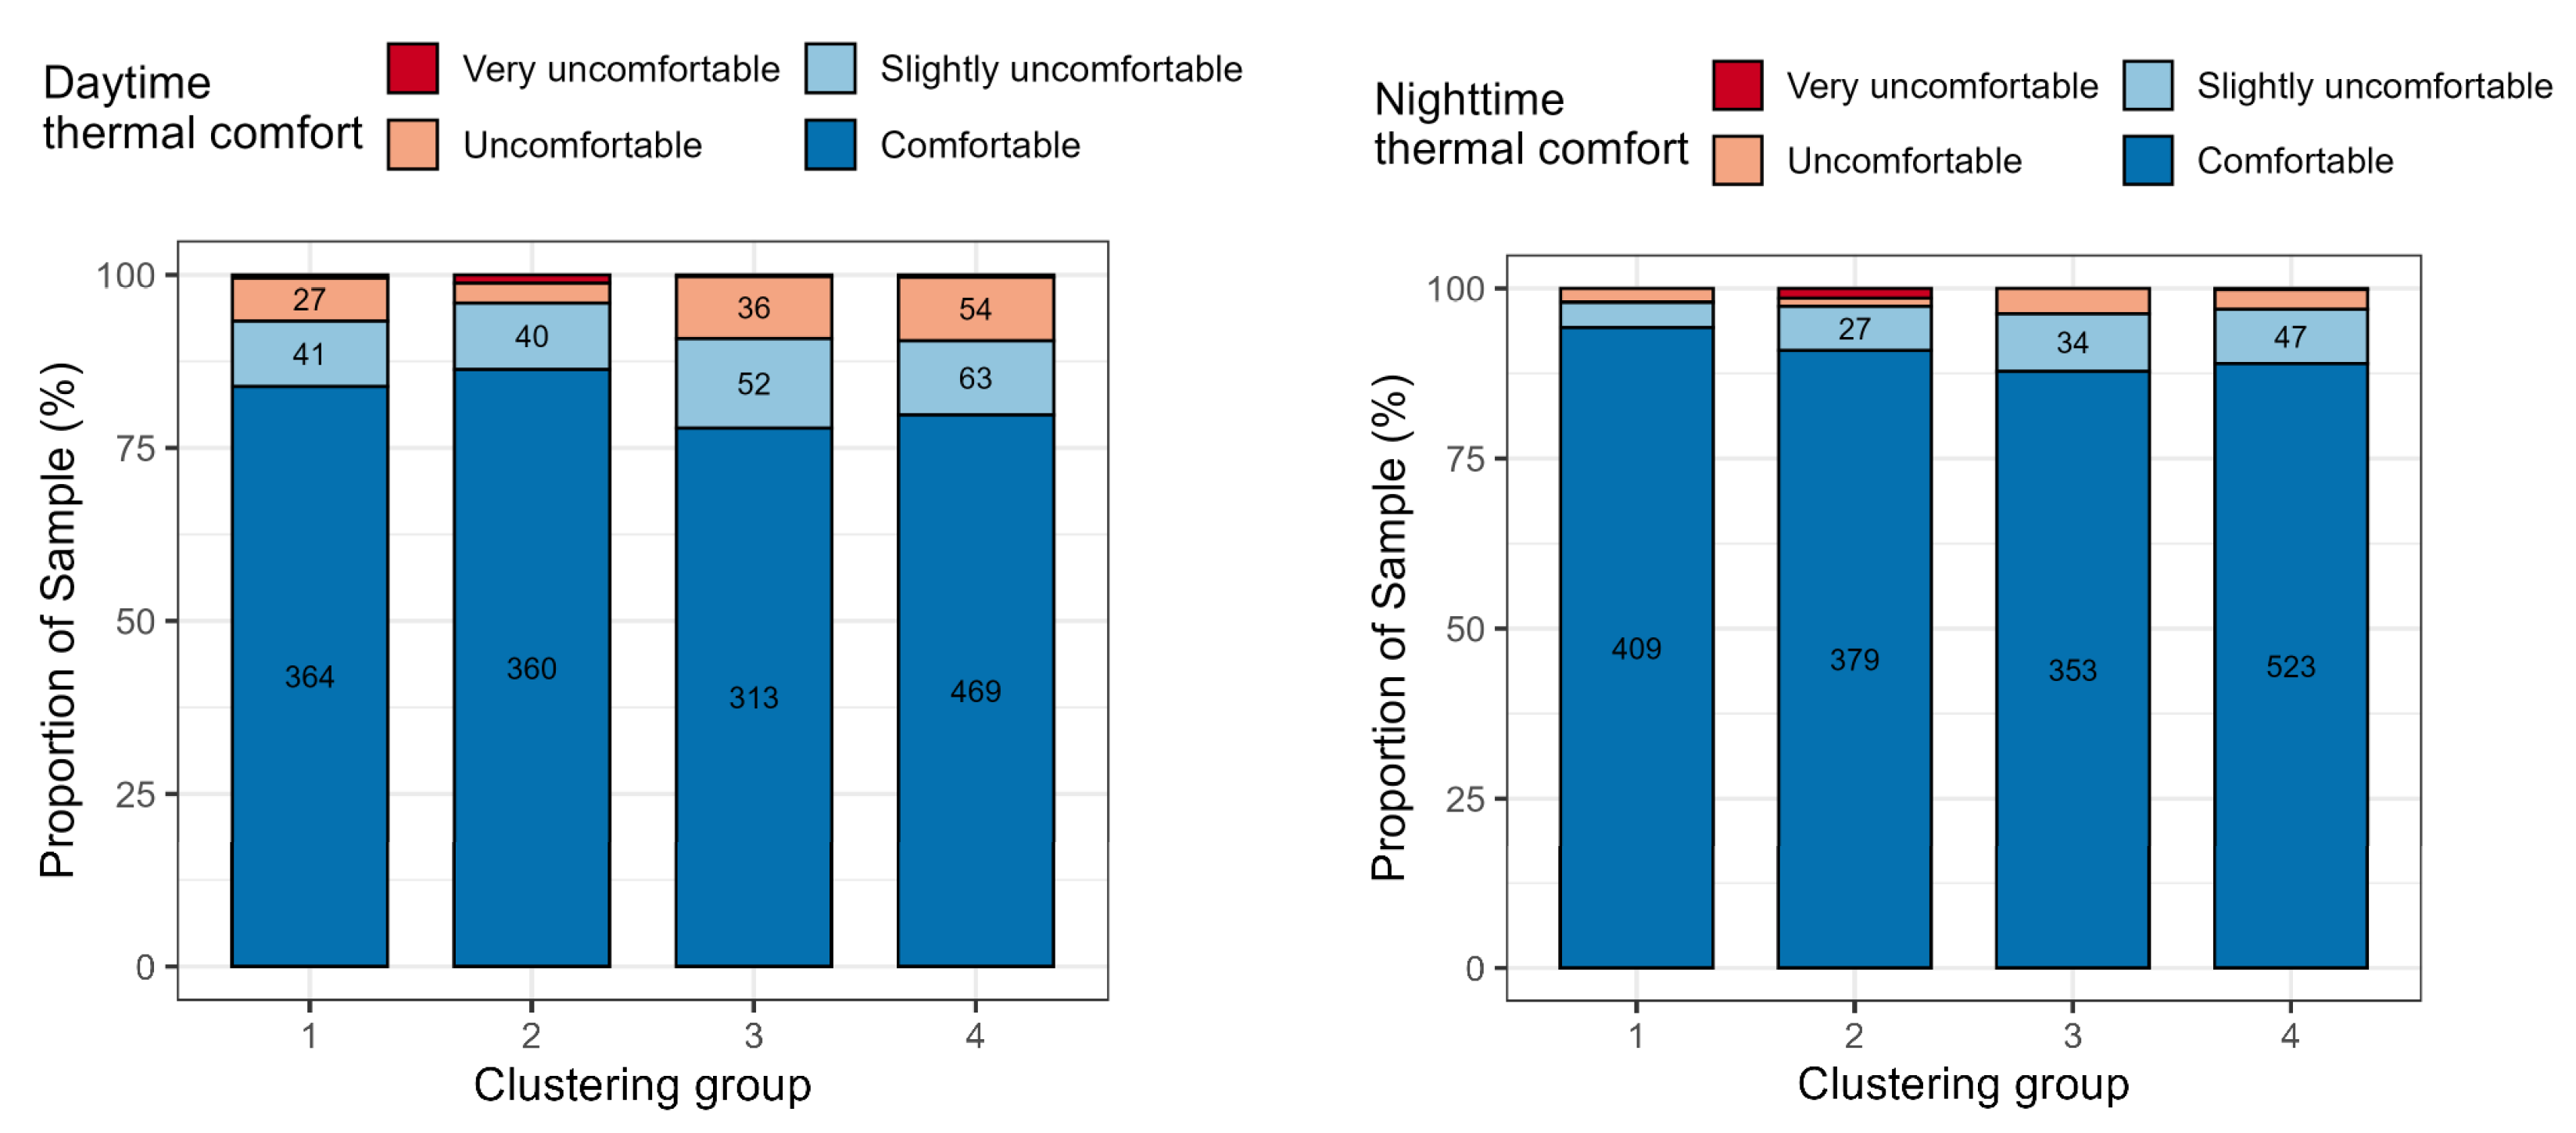
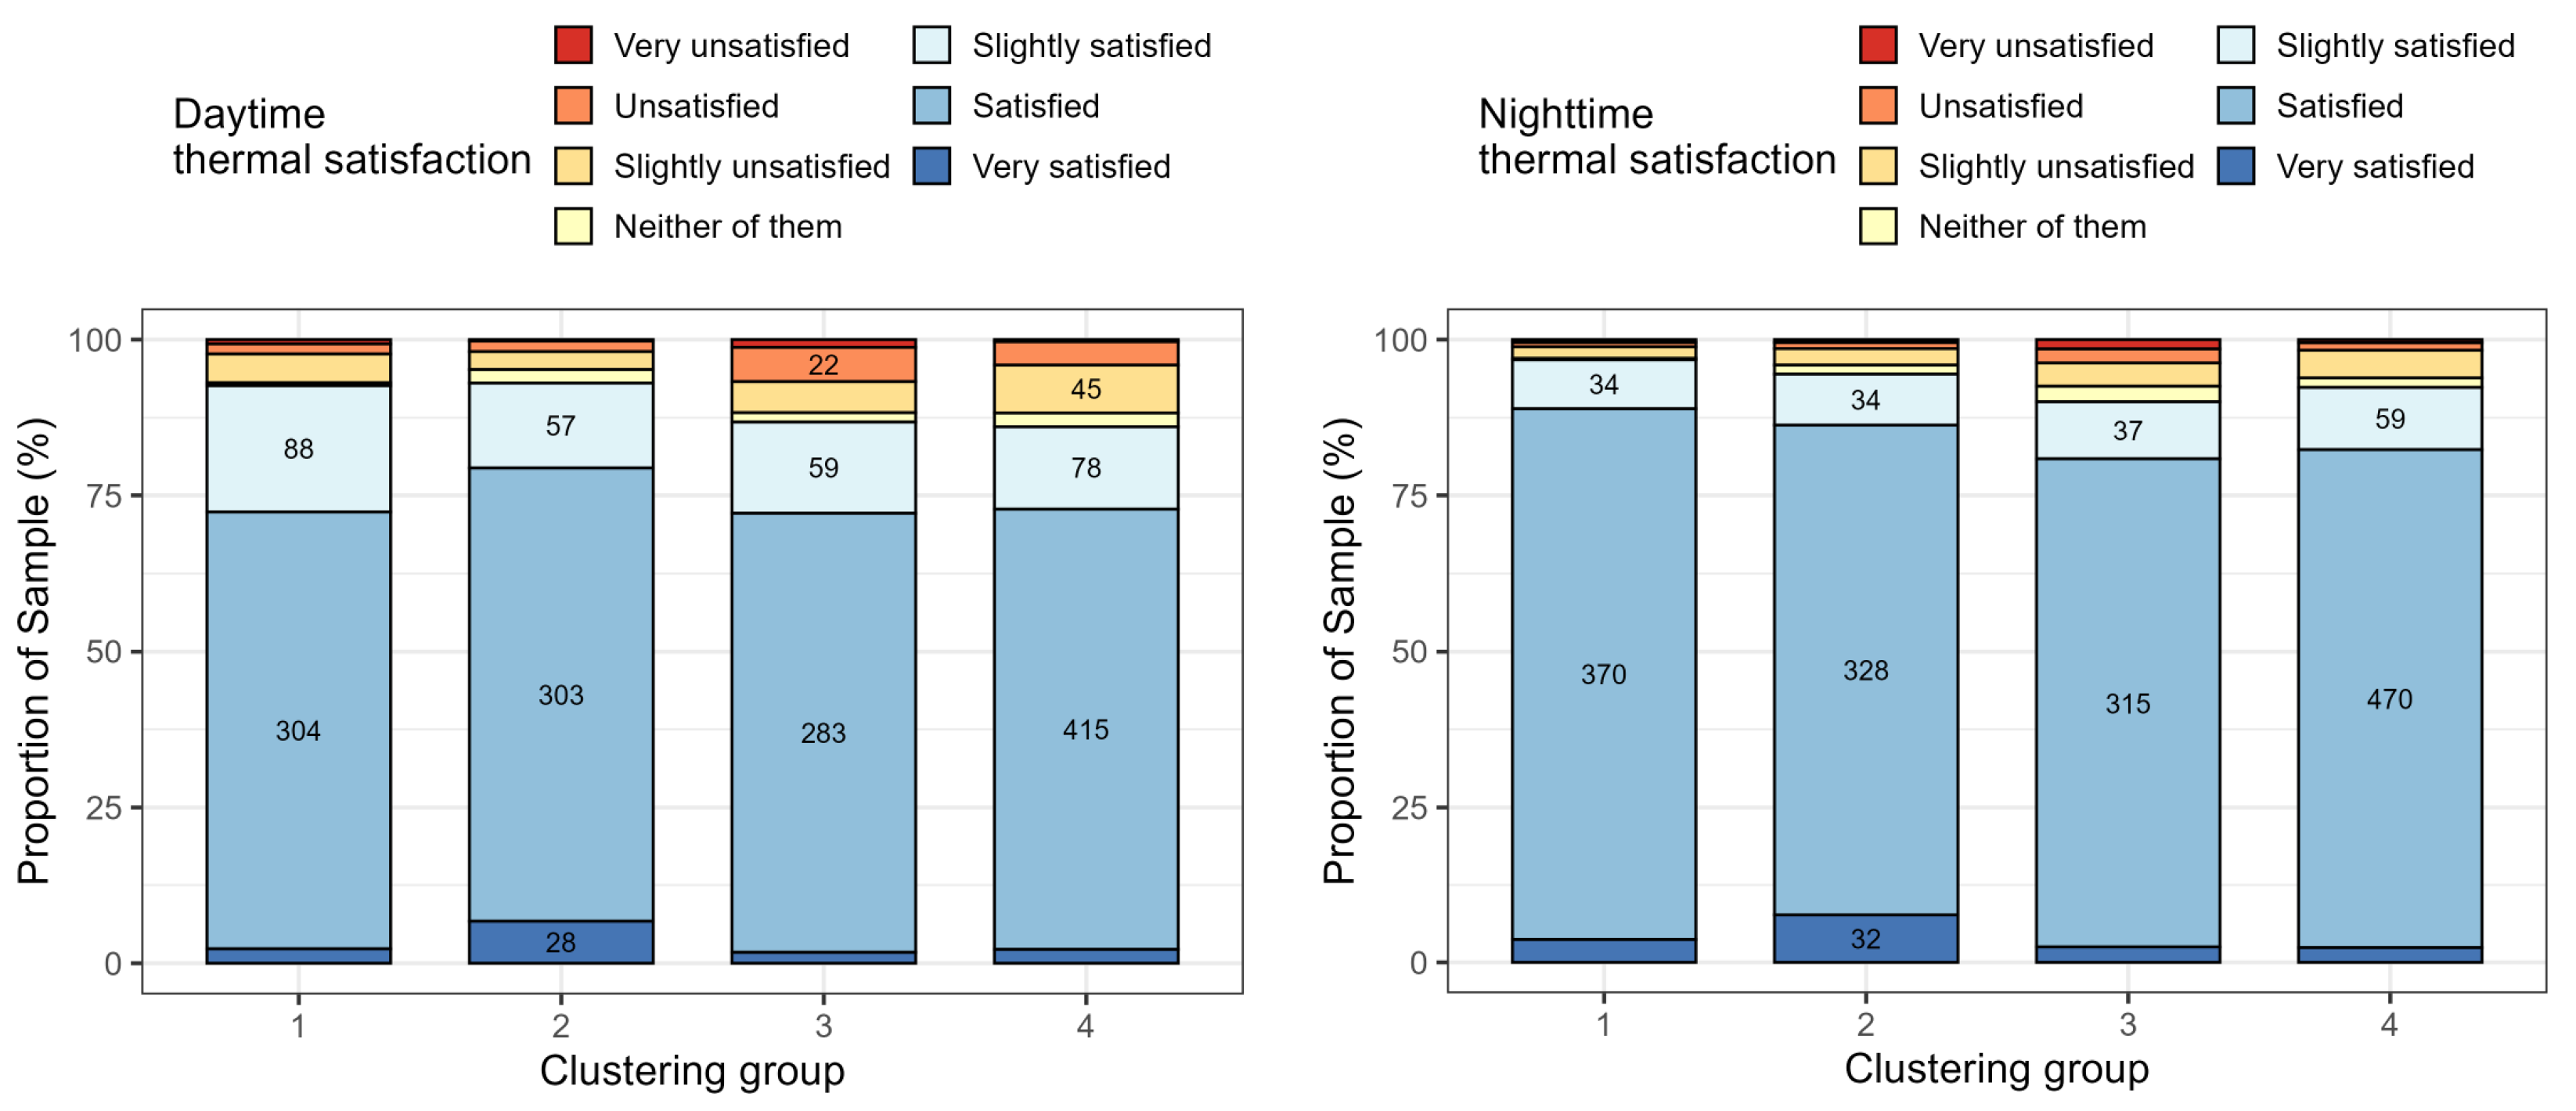
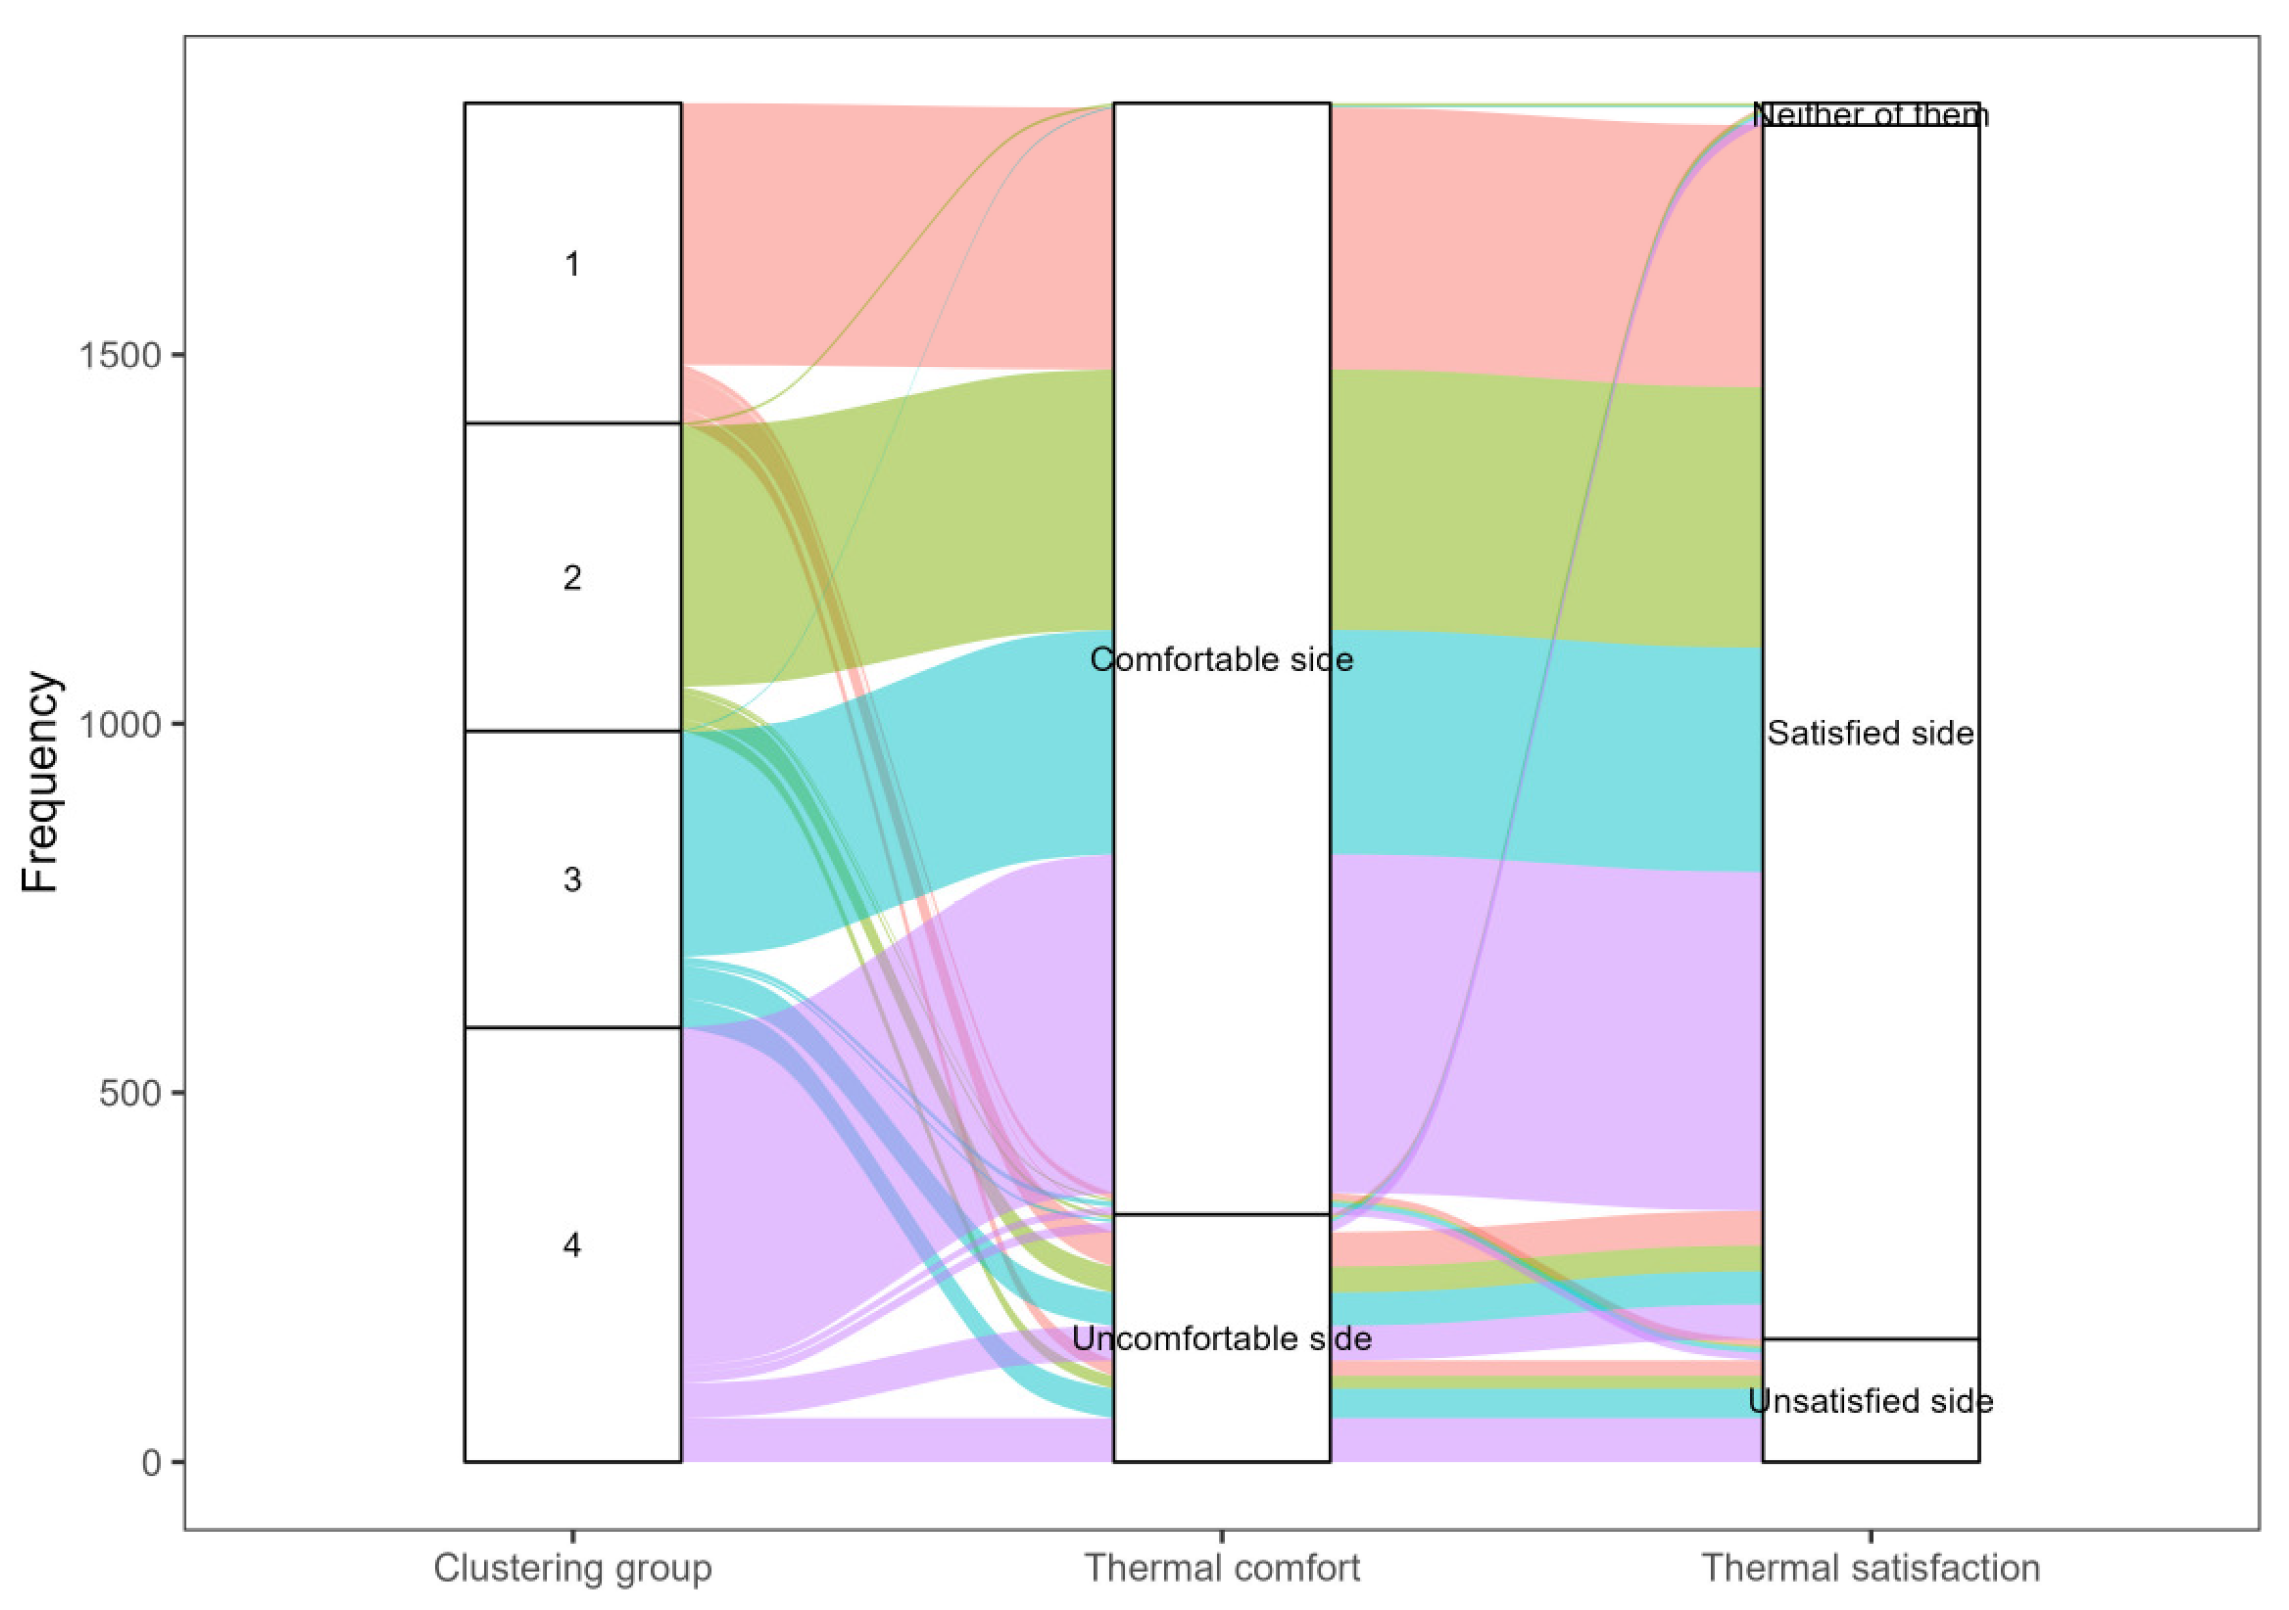
3.4.2. Thermal Sensation, Thermal Comfort, and Satisfaction

This section analyzes the results on occupant thermal sensation, thermal comfort as well as thermal satisfaction. Figure 9 shows the thermal sensation of the respondents during daytime and nighttime. Overall, the warm-side sensations (i.e., hot, warm, slightly warm) were larger in daytime than in nighttime. Cool-side sensations (i.e., cold, cool, slightly cool) were larger in nighttime. Warm-side sensations were the smallest in C2 during daytime. Even in C3 and C4, which had floor-sitting behavior without AC use, warm-side sensations were less than 30% during the daytime, and the majority were neutral and cool-side sensations.
Figure 10 and Figure 11 show thermal comfort and satisfaction during daytime and nighttime. Most respondents in all clusters answered “comfortable” and “satisfied” for both daytime and nighttime. These results corresponded to the thermal sensation that showed a cool-side and neutral sensation with higher proportions. Uncomfortable and unsatisfied sensations were slightly larger in C3 and C4 than in C1 and C2. Comfortable and satisfied sensations were the largest in C2 during daytime. This tendency was the same as thermal sensation, which showed the smallest sensation on the warm side in C2.
Table A2 (Appendix A) shows the statistical results of differences in the preference for floor-sitting, thermal sensation, thermal comfort, and satisfaction between the clusters. The preference for floor-sitting of C1 and C2 differed significantly from that of C3 and C4 (adj. p < 0.001). The effect sizes ranged from 0.64 to 0.72. Thermal sensation in the daytime did not significantly differ between C1 and C4, though there was a significant difference in preference for floor-sitting (adj. p <0.001). Except for C1 and C4, thermal sensation in the daytime differed significantly between the clusters. The effect sizes were around 0.2. Regarding thermal comfort, C1 and C4 in both daytime and nighttime did not differ significantly. There was no significant difference in thermal comfort between C1 and C3 in the daytime as well as C2 and C4 in the nighttime. Moreover, the effect sizes in thermal comfort (C2 and C3 in the daytime and nighttime, C2 and C4 in the daytime, and C1 and C3 in the nighttime) were around 0.1, which was smaller than those for thermal sensation and preference for floor-sitting. Thermal satisfaction in C1 and C3 in the daytime, C1 and C4 in the nighttime, and C2 and C3 in the nighttime did not differ significantly. The effect sizes in thermal satisfaction were less than 0.2 (C1 and C2, C1 and C4, C2 and C3 in the daytime; C2 and C4 in the daytime and nighttime; C1 and C3 in the nighttime). These statistical results showed that even though there were large differences in preference for floor-sitting and AC usage between the clusters, the associations between thermal comfort and satisfaction between the clusters were statistically small.

3.5. Relationship Between Sitting Behavior, Thermal Adaptations and Psychological Factors

This section analyzes the relationships between sitting behaviors and adaptative behaviors with psychological factors in detail. In Figure 12, the clusters represent sitting behaviors (see Figure 3) and thermal adaptations (see Figure 6), whereas psychological factors include thermal comfort and satisfaction. The result shows that most respondents answered comfort sensation, regardless of the thermal adaptation means and postures. There is a clear tendency showing that thermal comfort is strongly correlated with satisfaction. The respondents who felt thermally comfortable were mostly satisfied with their thermal environment, while those perceived discomfort tended to be partly unsatisfied. Half of the uncomfortable sensations were connected to the satisfied sensations, and the other half were connected to the unsatisfied sensations. Large groups of C1 and C2, who had a chair/sofa-sitting style with AC use, showed a significantly higher proportion of comfortable and satisfied responses. However, the non-AC groups (C3 and C4), who had a floor-sitting style, also resulted in higher proportions of comfortable and satisfied responses. The uncomfortable sensations were a minority, but they were seen in all clusters.
The relationships were analyzed in more detail. Figure A7 (Appendix A) shows thermal adaptations and electricity consumption for each apartment type. Focusing on Rusunawa and Rusunami, in which the respondents belonged to low- to middle-income ranges, the AC users clearly showed higher electricity consumption. Figure A2 shows preference for floor-sitting and thermal adaptations during gathering activities for each building type and cluster. Even in clusters C3 and C4 for Rusunawa and Rusunami, in which respondents mainly had floor-sitting behaviors, AC users showed less preference for the floor-sitting behavior than other respondents who used a fan and opened windows/doors. Figure A3 and Figure A4 show thermal comfort and thermal adaptations during gathering activities in daytime and nighttime. In C3 and C4, no clear trends were found regarding thermal comfort between the AC users and non-AC users. In particular, in C3, which had the lowest electricity consumption, the AC users showed a slightly higher proportion of uncomfortable sensation during daytime. The results indicate that AC usage was associated with electricity consumption, whereas AC was not necessary for the respondents who had floor-sitting behaviors to achieve thermal comfort.

4. Discussion

4.1. Lifestyle Trends from the Viewpoint of Behavior, Apartment Type and Energy Consumption

The descriptive analysis indicated that there was a difference in behavior between floor-sitting in Rusunawa (lower income) and chair/sofa-sitting in condominiums (higher income). The residents in Rusunawa mostly used a fan for thermal adaptation and those in condominiums used AC. Rusunami dynamically changed sitting behavior and thermal adaptation means among the range of income levels. Rusunami showed intermediate characteristics between Rusunawa and condominiums.
This result supports the findings of previous studies. Miyamoto et al. [56] demonstrated a correlation between rising household income and increased energy consumption in Indonesian apartments. Their analysis for cooling methods highlighted the significant impact of AC use on energy consumption, in which higher incomes tend to switch their habits to consume more energy. This may suggest that fewer economic constraints increase access to AC. Figure 7 shows that the respondents in C1 and C2, which include a higher percentage of those living in condominiums, did not prefer floor-sitting. In contrast, C3 and C4, which were highly occupied by Rusunawa, prefer floor-sitting. These results indicate that there are two different lifestyles. The first is the Westernized lifestyle of using AC [57] and sitting on a chair/sofa, practiced by those in the high- to middle-income groups. The second is the traditional lifestyle practiced by those in the low-income groups who do not have AC [27] and prefer floor-sitting. However, thermal comfort and satisfaction did not differ significantly between these groups (Figure 11 and Figure 12). As shown in Figure 8, there were mainly three reasons for floor-sitting: comfortable, cool, and habit. It is worth noting that 20% of respondents preferred floor-sitting even in C1 and C2 (mainly AC users), and they answered coolness as the reason. Here, there might be higher motivation to obtain coolness with floor contact regardless of income and AC ownership. These results also correlate with previous findings that floor-sitting is not merely a cultural practice but also affects thermal needs within homes in East Asian countries [40,43,58]. In the present survey, most respondents were barefoot, and the floor materials were ceramic tile, which has relatively high thermal capacity and conductivity [59]. These effects are further discussed in the next section.

4.2. Psychological and Physiological Inheritance of Floor-Sitting Behavior

No footwear (i.e., barefoot) was observed across all clusters in the three apartment types, regardless of the use of mats, carpets, or furniture. The practice of floor-sitting while barefoot might enhance heat dissipation from the body through conductive heat transfer, resulting in a cool sensation upon contact [41]. Hakamada et al. conducted an experiment for the contact cooling effect with bare feet through Japanese participants who engaged in similar behavior (barefoot and floor-sitting) in their residences during the hot summer season. It was demonstrated that when the soles of the feet were in contact with a floor having a temperature of 28 °C, there was a 15.5% decrease in the perception of “very hot” and “hot” across the entire body, even when the ambient room temperature was 30 °C [41]. This temperature condition is expected to be similar to Indonesian climate conditions. Thermal conditions vary during daytime and nighttime in Indonesia, but the difference is generally modest owing to its tropical climate. Daytime temperatures typically range between 30–32 °C, while nighttime temperatures usually drop to around 22–24 °C. High-thermal-capacity materials for buildings like concrete and ceramic tiles retain a stable temperature during the day. This means that floor temperatures are expected to be approximately the average of the daytime and nighttime temperatures (26–28 °C). Therefore, a similar contact cooling effect might be obtained for Indonesian residents.
Based on the physiology and heat transfer of the human body, the body dissipates heat through various processes such as radiation, convection, conduction and evaporation [60]. Due to the characteristics of thermoreceptors and afferent nerve fibers, the body generally exhibits greater sensitivity to cooling than to heating across all body parts. Sensitivity to cool and warm stimuli varies significantly depending on the body part. Regarding a sitting posture, the backside and seat regions are 2–3 times more sensitive than other body parts, and overall, sensitivity to cooling is consistently 1.3–1.6 times stronger than to warming across all body parts [61]. Kurazumi et al. [14,15] studied the heat balance of the human body on a temperature-controlled floor. They revealed that conduction is the primary heat exchange mechanism in various sitting (cross-legged, sideways and legs out) and lying positions. In addition, Sakuragawa [26] found a negative correlation between the thermal conductivity of materials and thermal sensation when participants were in contact with a building surface [20]. It would be easier for bare feet and the lower body to feel cool through contact with materials like ceramic tile, which has relatively high thermal conductivity [21].
Residents in naturally ventilated buildings were tolerant of a wider range of temperatures, owing to a combination of behavioral adjustment and psychological adaptation [43]. Changes in the cooling method from non-AC to AC might significantly impact floor-contact behavior, influencing how residents adjust their posture to achieve thermal comfort in relation to cooling methods. Nevertheless, the results from all clusters showed that comfort levels were nearly the same regardless of the apartment type and AC use. It can be said that the respondents feel comfortable in their own places with their postures at different temperatures regardless of the use of cooling devices.

4.3. Cultural Significance of Floor-Sitting in Indonesia

In the society of Indonesia, floor-sitting is considered a deeply rooted cultural practice, reflecting social norms, communal values, and architectural traditions. One prominent example is the communal dining traditions such as makan bajamba in Minangkabau culture, where participants sit cross-legged on the floor and share food from communal dishes; it plays a significant role in fostering unity and social equality derived from the philosophy of life to train people to share life in togetherness [62]. Similarly, the Javanese tradition of kenduri involves floor-seated gatherings where food is shared as part of religious and social ceremonies. Another widely practiced ritual, selametan, follows a similar structure with people sitting on woven mats (tikar) to offer prayers and distribute food during significant life events, and it is commonly practiced among Javanese, Sundanese and Madurese communities [63]. Specifically, in Sundanese culture, the ngariung tradition emphasizes social harmony and collective decision making, as community members gather on the floor to discuss village matters or resolve conflicts. Meanwhile, in Bali, sitting on the floor is a common practice for daily life, especially for ritual-, custom- and tradition-related activities, with different sitting postures used in various contexts having a specific name, highlighting the importance of floor-sitting [25]. Therefore, cultural aspects, as well as physiological and psychological aspects are all necessary for understanding the importance and effectiveness of floor-sitting behaviors.

4.4. Future Prospects

Floor-sitting habits may persist in smaller apartment units because of space limitations with less furniture. In particular, lower-income groups (C3 and C4), who had smaller unit sizes (see Appendix A1), cannot afford larger apartments as a housing option. With an increase in income level, these lower-income groups (C3 and C4) may experience economic advancement and live in larger units in the future, and gradually align with the behaviors observed in higher-income groups (C1 and C2). This transition could influence lifestyle patterns, particularly in thermal adaptation strategies and floor-usage behaviors. While lower-income groups (C3 and C4) often maintain thermal comfort through floor usage with minimal reliance on AC, higher-income groups (C1 and C2) tend to favor chair-sitting and greater AC use, leading to increased energy consumption. If this trend continues, expanding income levels may drive a rise in AC dependency and elevate residential energy demands. However, the ability of C3 and C4 to remain comfortable without AC through floor contact suggests that traditional practices could still serve as an effective low-energy cooling strategy. It is possible to encourage such traditional floor-sitting practices by combining them with a novel cooling system using radiant floor cooling. For example, Kitagawa et al. [44] have demonstrated the effectiveness of a floor cooling system utilizing phase change materials (PCMs) integrated into the floor in the Indonesian climate. Furthermore, differences between older (Rusunawa) and newer apartments (Rusunami) show that building design and modernization might significantly shape sitting preferences and thermal adaptation strategies. In the context of cultural transition, the development of these strategies can play a vital role in modern sustainability efforts in residential environments across Southeast Asia.

4.5. Limitations and Future Works

Currently, there are no available measurement data on thermal environments such as air temperature, humidity and floor surface temperature. In particular, floor temperature will impact the body and foot skin temperatures and may influence thermal comfort and sensation for different postures. On the other hand, the present survey lacked detailed inquiries on the psychological aspects of comfort and human physiology associated with different sitting behaviors. These measurement data and the detailed survey data would enable more robust comparisons between occupants’ perceived thermal comfort and physical environments.
Future research should also explore the influence of building materials and coverings on floor-usage behavior and thermal comfort. In addition, investigating floor-usage behavior and thermal comfort among diverse ethnic groups, including transmigrated residents and cultures in Indonesia, would provide a more comprehensive understanding of the relationship between these variables.
The current research was not designed to compare the relationship between different postures and thermal comfort in the same respondents. Therefore, the impacts of interventions by changing postures and floor conditions on thermal comfort and other psychological factors should be investigated with the same respondents. It is also important to deeply investigate the energy efficiency of floor-sitting behaviors and influential factors. In addition, the effectiveness of floor cooling systems on thermal comfort and physiological factors of respondents could show the feasibility of such systems in apartments. The energy efficiency of the system with a floor-sitting posture will also be assessed through further research.

5. Conclusions

Thermal comfort and floor-usage behaviors were investigated in apartments in Indonesia. A large-scale questionnaire survey was conducted to obtain information on floor-usage behaviors, the use of thermal adaptations (e.g., AC, fans, window or door opening), energy consumption, preferences for floor-sitting, thermal sensation, thermal comfort, and satisfaction, among others. The data of 3384 respondents in apartments in five major cities in Indonesia were obtained, and the data of Jabodetabek (n = 1841) were analyzed. The findings are summarized as follows:
  • There was a significant difference in behavior between floor-sitting in Rusunawa (lower income) and chair/sofa-sitting in condominiums (higher income). Approximately 80% of the residents in Rusunawa predominantly engaged in floor-sitting behavior and relied on fans for cooling. In contrast, approximately 75% of the residents in condominiums preferred chair-sitting and used air conditioning (AC). In Rusunami (middle income), the sitting behaviors and thermal adaptations dynamically varied across income levels.
  • Based on the cluster analysis incorporating three key variables: primary posture, foot covering and floor covering, the preference for floor-sitting differed between the clusters. Clusters C1 and C2 preferred not to sit on the floor, while C3 and C4 mostly preferred floor-sitting. The former clusters showed approximately 50% higher annual electricity consumption using AC as a thermal adaptation than the latter clusters. The latter clusters showed lower annual electricity consumption with fan use. However, all clusters mostly went barefoot.
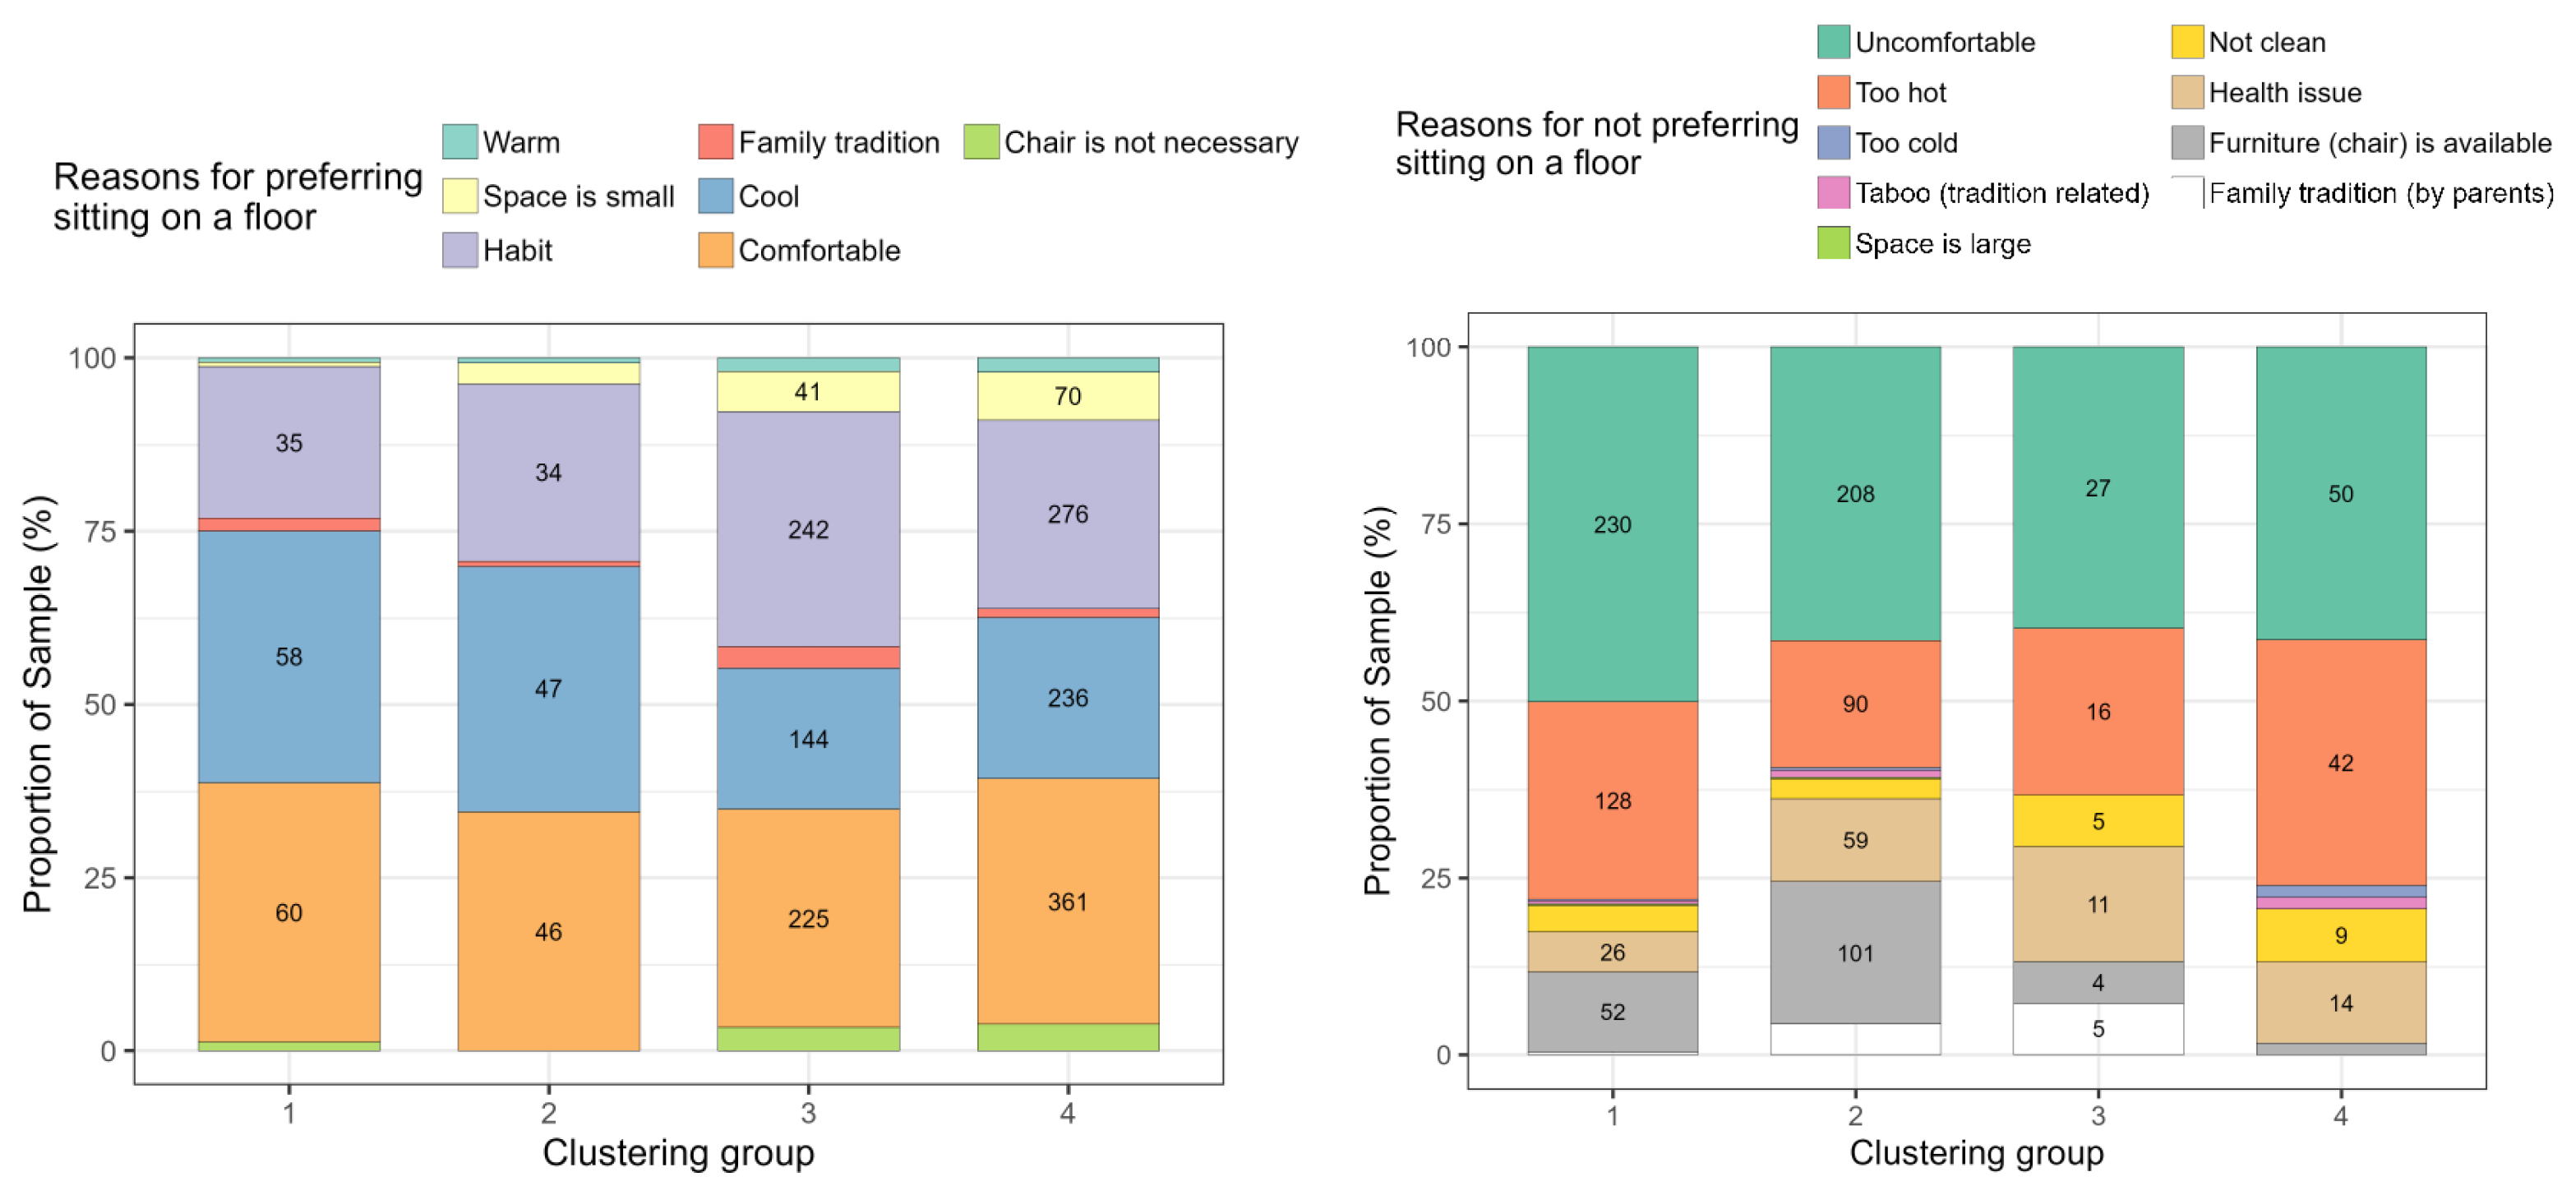
  • While there were large differences in electricity consumption and thermal adaptations between the clusters, thermal comfort and satisfaction were mostly perceived as comfortable and satisfactory for all clusters. The reasons for preferring floor-sitting included comfort, coolness and habit, and therefore, traditional floor-sitting behavior might be an adaptive behavior in apartments in hot and humid climates when AC is not used. The results suggest that behavioral adaptations with floor-sitting are still viable for achieving thermal comfort.
In conclusion, even in the context of cultural transition alongside economic growth, floor-sitting can be a sustainable practice while achieving thermal comfort in residential buildings in the hot and humid climates of Southeast Asia. Given its potential as a sustainable and low-energy cooling practice, future research should be conducted to explore how it can be integrated into modern residential design and urban housing policies to promote energy efficiency and well-being in tropical environments.

Author Contributions

Conceptualization, C.E. and T.A.; methodology, C.E., T.A. and T.K.; software, C.E., K.K. and H.A.; validation, C.E. and K.K.; formal analysis, C.E., K.K. and H.A.; investigation, C.E. and T.A.; resources, T.A.; data curation, C.E.; writing—original draft preparation, C.E.; writing—review and editing, K.K., T.A. and T.K.; visualization, C.E. and K.K.; supervision, T.A.; project administration, T.A. and T.K.; funding acquisition, T.A. and T.K. All authors have read and agreed to the published version of the manuscript.

Funding

This research was supported by the Science and Technology Research Partnership for Sustainable Development (SATREPS) in collaboration between the Japan Science and Technology Agency (JST, JPMJSA1904) and Japan International Cooperation Agency (JICA). This work was also supported by JSPS KAKENHI Grant Number 24KK0092.

Institutional Review Board Statement

The study was conducted according to the guidelines of the Declaration of Helsinki and approved by the Institutional Ethics Committee of Hiroshima University (Approval number: ASE-2022-0809(2), Approved date: 9 August 2022).

Informed Consent Statement

Informed consent was obtained from all respondents involved in the study.

Data Availability Statement

Data sharing is not available for this article.

Acknowledgments

This research was conducted by the Building Research Group as part of the Development of Low-carbon Affordable Apartments in the Hot-Humid Climate of Indonesia Project toward the Paris Agreement 2030, Science and Technology Research Partnership for Sustainable Development (SATREPS), which is collaboratively supported by the Japan Science and Technology Agency (JST), The Japan International Cooperation Agency (JICA). The questionnaire survey was collaboratively conducted by the Institute of Science Tokyo, Hiroshima University, and Waseda University with support from Institut Teknologi Sepuluh Nopember and the Ministry of Public Works and Housing (PUPR) of Indonesia.

Conflicts of Interest

The authors declare no conflicts of interest.

Appendix A

Figure A1. Silhouette width and gap statistic of the cluster analysis.
Sustainability 17 02775 g0a1
Table A1. Description of clusters.
VariableOverall, N = 1841 1C1, N = 434 1C2, N = 417 1C3, N = 402 1C4, N = 588 1
Age (years old), mean (SD)39, (11)37, (11)40, (10)39, (10)38, (10)
Age category, n (%)
  10s46, (2.5)18, (4.1)10, (2.4)5, (1.2)13, (2.2)
  20–24155, (8.4)58, (13)28, (6.7)24, (6.0)45, (7.7)
  25–29222, (12)59, (14)42, (10)43, (11)78, (13)
  30–34245, (13)47, (11)51, (12)56, (14)91, (15)
  35–39292, (16)51, (12)68, (16)72, (18)101, (17)
  40–44256, (14)58, (13)62, (15)60, (15)76, (13)
  45–49254, (14)53, (12)52, (12)67, (17)82, (14)
  50–54240, (13)57, (13)68, (16)45, (11)70, (12)
  +55131, (7.1)33, (7.6)36, (8.6)30, (7.5)32, (5.4)
Gender, n (%)
  Female1286, (70)270, (62)285, (68)298, (74)433, (74)
  Male555, (30)164, (38)132, (32)104, (26)155, (26)
Number of family members living together, n (%)
  1531, (29)210, (48)112, (27)85, (21)124, (21)
  2826, (45)150, (35)219, (53)186, (47)271, (46)
  3309, (17)51, (12)62, (15)74, (19)122, (21)
  499, (5.4)13, (3.0)14, (3.4)33, (8.3)39, (6.7)
  549, (2.7)8, (1.8)8, (1.9)14, (3.5)19, (3.2)
  616, (0.9)1, (0.2)1, (0.2)6, (1.5)8, (1.4)
  73, (0.2)0, (0)0, (0)0, (0)3, (0.5)
Occupation, n (%)
  Army/Police3, (0.2)1, (0.2)1, (0.2)1, (0.2)0, (0)
  Business owner/Executive level or above24, (1.3)12, (2.8)8, (1.9)3, (0.7)1, (0.2)
  Educator29, (1.6)5, (1.2)8, (1.9)7, (1.7)9, (1.5)
  Entrepreneur/Store owner416, (23)130, (30)117, (28)58, (14)111, (19)
  Housewife with side job172, (9.3)30, (6.9)35, (8.4)39, (9.7)68, (12)
  Housewife without side job463, (25)47, (11)83, (20)165, (41)168, (29)
  Laborer (farmer, stone mason, maid)32, (1.7)2, (0.5)3, (0.7)14, (3.5)13, (2.2)
  Laborer with license (driver, mechanic, carpenter)68, (3.7)2, (0.5)10, (2.4)30, (7.5)26, (4.4)
  Normal employee507, (28)166, (38)116, (28)64, (16)161, (27)
  Not working/Unable to search for work9, (0.5)1, (0.2)1, (0.2)5, (1.2)2, (0.3)
  Professional28, (1.5)9, (2.1)6, (1.4)6, (1.5)7, (1.2)
  Retiree17, (0.9)5, (1.2)4, (1.0)2, (0.5)6, (1.0)
  Student58, (3.2)22, (5.1)20, (4.8)3, (0.7)13, (2.2)
  Unable to work4, (0.2)1, (0.2)1, (0.2)0, (0)2, (0.3)
  Workers with license (nurse)11, (0.6)1, (0.2)4, (1.0)5, (1.2)1, (0.2)
Unit type, n (%)
  Family 1 bedroom (1BR)187, (10)33, (7.6)30, (7.2)56, (14)68, (12)
  Family 2 bedrooms (2BR)1238, (68)341, (79)326, (78)260, (65)311, (53)
  Family 3 bedrooms (3BR)10, (0.5)5, (1.2)5, (1.2)0, (0)0, (0)
  Studio398, (22)54, (12)55, (13)82, (21)207, (35)
Unit size (m2) 2, mean (SD)32, (13)34 (19)34, (8)30, (8)29, (13)
Locations during gathering, n (%)
  Living room1737, (94)410, (94)379, (91)390, (97)558, (95)
  Bedroom54, (2.9)14, (3.2)25, (6.0)6, (1.5)9, (1.5)
  Outdoor area8, (0.4)1, (0.2)3, (0.7)4, (1.0)0, (0)
  Terrace/Veranda/Balcony28, (1.5)4, (0.9)7, (1.7)0, (0)17, (2.9)
  Others14, (0.8)5, (1.2)3, (0.7)2, (0.5)4, (0.7)
Floor material in the living room, n (%)
  Carpet20, (1.1)3, (0.7)0, (0)1, (0.2)16, (2.7)
  Ceramic tile1556, (85)375, (86)380, (91)357, (89)444, (76)
  Concrete167, (9.1)15, (3.5)15, (3.6)34, (8.5)103, (18)
  Granite tile27, (1.5)16, (3.7)5, (1.2)2, (0.5)4, (0.7)
  Vinyl21, (1.1)7, (1.6)3, (0.7)0, (0)11, (1.9)
  Wooden6, (0.3)1, (0.2)3, (0.7)1, (0.2)1, (0.2)
  Others44, (2.4)17, (3.9)11, (2.6)7, (1.7)9, (1.5)
Total energy consumption [GJ/year], mean (SD) 14, (7)18, (7)16, (6)12, (6)12, (6)
Total energy consumption [GJ/person-year], mean (SD)8.6, (6.5)13.2, (7.3)9.7, (5.5)6.1, (5.9)6.1, (4.7)
Electricity consumption [GJ/year], mean (SD)9.6, (5.7)12.1, (5.4)11.5, (5.6)7.2, (4.9)7.9, (5.2)
Electricity consumption [GJ/person-year], mean (SD)5.8, (4.9)8.8, (5.6)6.7, (4.4)4.0, (4.2)4.3, (3.8)
Gas consumption [GJ/year], mean (SD)4.67, (3.03)5.58, (3.32)4.61, (2.38)4.53, (3.46)4.13, (2.75)
Gas consumption [GJ/person-year], mean (SD)2.71, (2.33)3.94, (2.72)2.70, (1.91)2.37, (2.60)2.03, (1.65)
1 Mean (SD); n (%); 2 excluding the samples that did not know the unit size.
Table A2. Multiple comparisons of each variable among the four clusters.
ItemTimeGroup 1Group 2p-ValueAdjusted_p-ValueEffect Size
Preference for sitting on the floor-120.13040.78230.049
13<0.001<0.0010.664
14<0.001<0.0010.643
23<0.001<0.0010.718
24<0.001<0.0010.692
340.48221.00000
Thermal sensationDaytime12<0.001<0.0010.220
13<0.001<0.0010.191
140.18871.00000.052
23<0.001<0.0010.200
24<0.001<0.0010.212
34<0.001<0.0010.179
Nighttime120.03540.21260.094
13<0.001<0.0010.295
140.00160.00960.119
23<0.001<0.0010.246
24<0.001<0.0010.163
34<0.001<0.0010.256
Thermal comfortDaytime120.08020.48130.066
130.13600.81570.055
140.28751.00000.027
23<0.0010.00150.141
24<0.0010.00170.126
340.75241.00000
Nighttime120.01310.07850.096
130.00430.02600.103
140.02160.12930.081
230.00600.03580.107
240.02130.12800.082
340.72851.00000
Thermal satisfactionDaytime120.00110.00650.138
130.01340.08060.110
140.00180.01080.121
23<0.0010.00130.157
24<0.0010.00150.140
340.22221.00000.047
Nighttime120.06870.41200.082
130.00380.02280.126
140.03460.20730.086
230.00860.05180.117
240.00580.03500.110
340.44281.00000
Figure A2. Preference for sitting on the floor and thermal adaptations during gathering activities.
Sustainability 17 02775 g0a2
Figure A3. Daytime thermal comfort and thermal adaptations during gathering activities.
Sustainability 17 02775 g0a3
Figure A4. Nighttime thermal comfort and thermal adaptations during gathering activities.
Sustainability 17 02775 g0a4
Figure A5. Daytime thermal sensation and thermal adaptations during gathering activities.
Sustainability 17 02775 g0a5
Figure A6. Nighttime thermal sensation and thermal adaptations during gathering activities.
Sustainability 17 02775 g0a6
Figure A7. Thermal adaptations and electricity consumption.
Sustainability 17 02775 g0a7

References

  1. IEA. Southeast Asia Energy Outlook; IEA: Paris, France, 2022; Available online: https://www.iea.org/reports/southeast-asia-energy-outlook-2022 (accessed on 10 February 2025).
  2. Shaw, R.; Luo, Y.; Cheong, T.S.; Halim, S.A.; Chaturvedi, S.; Hashizume, M.; Insarov, G.E.; Ishikawa, Y.; Jafari, M.; Kitoh, A.; et al. Asia. In Climate Change 2022: Impacts, Adaptation and Vulnerability; Pörtner, H.-O., Roberts, D.C., Tignor, M., Poloczanska, E.S., Mintenbeck, K., Alegría, A., Craig, M., Langsdorf, S., Löschke, S., Möller, V., et al., Eds.; Contribution of Working Group II to the Sixth Assessment Report of the Intergovernmental Panel on Climate, Change; Cambridge University Press: Cambridge, UK; New York, NY, USA, 2022; pp. 1457–1579. Available online: https://www.ipcc.ch/report/ar6/wg2/chapter/chapter-10/ (accessed on 15 March 2025).
  3. Pavanello, F.; De Cian, E.; Davide, M.; Mistry, M.; Cruz, T.; Bezerra, P.; Jagu, D.; Renner, S.; Schaeffer, R.; Lucena, A.F.P. Air-conditioning and the adaptation cooling deficit in emerging economies. Nat. Commun. 2021, 12, 6460, Erratum in Nat. Commun. 2022, 13, 1978. [Google Scholar] [CrossRef] [PubMed] [PubMed Central]
  4. IEA. An Energy Sector Roadmap to Net Zero Emissions in Indonesia; IEA: Paris, France, 2022; Available online: https://www.iea.org/reports/an-energy-sector-roadmap-to-net-zero-emissions-in-indonesia (accessed on 10 February 2025).
  5. Uno, T.; Hokoi, S.; Ekasiwi, S.N.E. Survey on Thermal Environment in Residences in Surabaya, Indonesia: Use of Air Conditioner. J. Asian Archit. Build. Eng. 2003, 2, b15–b21. [Google Scholar] [CrossRef]
  6. Badan Pusat Statistik Indonesia. Available online: https://www.bps.go.id/id/statistics-table/1/OTQwIzE=/persentase-rata-rata-pengeluaran-per-kapita-sebulan-untuk-makanan-dan-bukan-makanan-di-daerah-perkotaan-menurut-provinsi--2007-2023.html (accessed on 7 January 2024).
  7. Aspiring Indonesia—Expanding the Middle Class. Available online: https://documents1.worldbank.org/curated/en/519991580138621024/pdf/Aspiring-Indonesia-Expanding-the-Middle-Class.pdf (accessed on 10 February 2025).
  8. Mcneil, M.; Karali, N.; Letschert, V. Forecasting Indonesia’s electricity load through 2030 and peak demand reductions from appliance and lighting efficiency. Energy Sustain. Dev. 2019, 49, 65–77. [Google Scholar] [CrossRef]
  9. Dewi, O.C.; Rahmasari, K.; Salsabila, N.D.; Ardini, C.P.; Fitriatulamal, H. Assessing the building performance of a 35-year-old multi-story housing: Is it still relevant to the current climate? IOP Conf. Ser. Earth Environ. Sci. 2024, 1419, 012063. [Google Scholar] [CrossRef]
  10. Sejarah. Available online: https://mediaindonesia.com/weekend/276256/sejarah (accessed on 10 February 2025).
  11. Alfata, M.N.F.; Oktiawati, U.Y.; Asawa, T. Experiments on human thermal physiology and sensation of contact cooling for barefoot in hot-humid climates of Indonesia. In Proceedings of the 14th International Symposium on Architectural Interchanges in Asia (ISAIA), Kyoto, Japan, 10–12 September 2024. [Google Scholar]
  12. Quintana, D.I.; Cansino, J.M. Residential Energy Consumption-A Computational Bibliometric Analysis. Buildings 2023, 13, 1525. [Google Scholar] [CrossRef]
  13. Bal, M.; Stok, F.M.; Van Hemel, C.; De Wit, J.B.F. Including Social Housing Residents in The Energy Transition: A Mixed-Method Case Study on Residents Beliefs, Attitudes, and Motivation Toward Sustainable Energy Use in a Zero-Energy Building Renovation in the Netherlands. Front. Sustain. 2021, 3, 656781. [Google Scholar] [CrossRef]
  14. Kurazumi, Y.; Matsubara, N.; Nagai, H.; Furukawa, N.; Fujiwara, M.; Ue, A.; Ueki, Y.; Yamamoto, S. The Effect of Conductive Heat Exchange for Evaluation of the Thermal Environment on the Human Body. Trans. Soc. Heat. Air-Cond. Sanit. Eng. Jpn. 1999, 72, 23–34. [Google Scholar]
  15. Kurazumi, Y.; Tsuchikawa, T.; Matsubara, N.; Horikoshi, T. Effect of posture on the heat transfer areas of the human body. Build. Environ. 2008, 43, 1555–1565. [Google Scholar] [CrossRef]
  16. Pramesti, P.; Hasan, M.; Ramandhika, M. Locality values in thermal comfort embodied in traditional Indonesian houses: A literature review. IOP Conf. Ser. Earth Environ. Sci. 2021, 894, 012009. [Google Scholar] [CrossRef]
  17. Samodra, F.; Irvansyah, I. Livable of the past-rural affordable settlement in current urban environment. IOP Conf. Ser. Earth Environ. Sci. 2021, 780, 012001. [Google Scholar] [CrossRef]
  18. Sari, D.; Sudirman, M.; Chiou, Y. Modernity in Javanese tradition: Adapting vernacular design and local culture to Indonesian urban living. Archit. Sci. Rev. 2022, 67, 105–119. [Google Scholar] [CrossRef]
  19. Uno, T.; Hokoi, S.; Ekasiwi, S. Passive Cooling Strategies to Reduce the Energy Consumption of Cooling in Hot and Humid Climates in Indonesia. In Sustainable Houses and Living in the Hot-Humid Climates of Asia; Springer: Singapore, 2018; pp. 407–418. [Google Scholar] [CrossRef]
  20. Sakuragawa, S.; Kaneko, T.; Miyazaki, Y. Effects of contact with wood on blood pressure and subjective evaluation. J. Wood Sci. 2008, 54, 107–113. [Google Scholar] [CrossRef]
  21. Effting, C.; Güths, S.; Alarcon, O. Evaluation of The Thermal Comfort in Contact with Ceramic Tiles. Rev. de Eng. Térmica 2018, 5, 92–98. [Google Scholar] [CrossRef]
  22. Fitriaty, P.; Zubaidi, F.; Zulfitriah, M.; Bassaleng, A.J.R.; Burhany, N.R.; Syahrullah, M.R.; Alfani. Energy Efficient Features of Vernacular Houses in Tropical Hilly Area of Indonesia. IOP Conf. Ser. Earth Environ. Sci. 2023, 1157, 012010. [Google Scholar] [CrossRef]
  23. Erwindi, C.; Kondo, K.; Asawa, T. Behaviour and comfort during floor usage in gathering activities on Indonesia Apartments. IOP Conf. Ser. Earth Environ. Sci. 2024, 1351, 012028. [Google Scholar] [CrossRef]
  24. Lukman, M.Y.; Suzuki, T.; Kita, M.; Yoshizumi, Y.; Matsubara, S.A. Study of the gathering styles of Indonesian culture. J. Archit. Plan. (Trans. AIJ) 2015, 80, 999–1008. [Google Scholar] [CrossRef]
  25. Nilotama, S. Understanding Sitting Culture of Balinese Traditional Society. In Proceedings of the 3rd International Conference on Creative Media, Design and Technology (REKA 2018), Surakarta, Indonesia, 25 September 2018; Atlantis Press: Dordrecht, The Netherlands, 2018; pp. 251–256. [Google Scholar] [CrossRef]
  26. Sakuragawa, S. The Tactile Warmth/Coldness Sensation of Wood, Mokuzai no sesshoku onreikan. Wood Ind. 2015, 70, 376–381. [Google Scholar]
  27. Parsons, K. Human Thermal Environments: The Effects of Hot, Moderate, and Cold Environments on Human Health, Comfort, and Performance, 3rd ed.; CRC Press: Boca Raton, FL, USA, 2014. [Google Scholar] [CrossRef]
  28. Humphreys, M.; Nicol, F. Principles of Adaptive Thermal Comfort. In Sustainable Houses and Living in the Hot-Humid Climates of Asia; Springer: Singapore, 2018. [Google Scholar] [CrossRef]
  29. Gifford, R.; Steg, L.; Reser, J. Environmental Psychology. In IAAP Handbook of Applied Psychology; Blackwell Publishing Ltd.: Oxford, UK, 2011. [Google Scholar] [CrossRef]
  30. Kim, S.; Chung, K.; Kim, Y. A Study on the Thermal Comfort Zone and Energy Use of Radiant Floor Heating by Residential Style and Clothing Level. J. Energy Eng. Asce 2015, 24, 24–31. [Google Scholar] [CrossRef]
  31. Sugiyantoro; Christian, B.; Arianto, R. The Study of Attachment between Distribution Pattern of Land Price and Apartments Price (Case Study: Vertical Housing Development in Administration City of South Jakarta). IOP Conf. Ser. Earth Environ. Sci. 2018, 152, 012004. [Google Scholar] [CrossRef]
  32. Rosenberg, L. Urbanising the Rural. Local strategies for creating “new style” communities in China. China Perspect. 2013, 2013, 63–71. [Google Scholar] [CrossRef]
  33. Kwon, H.; Kim, S. Variation in the Characteristics of Everyday Life and Meaning of Urban Housing Due to the Transition of Social Structure: Focusing on Articles Published in Lifestyle Magazines. Sustainability 2017, 9, 1298. [Google Scholar] [CrossRef]
  34. Tanabe, S.; Kimura, K. Effects of air temperature, humidity, and air movement on thermal comfort under hot and humid conditions. ASHRAE Trans. 1994, 100, 953–969. [Google Scholar]
  35. Jing, S.; Li, B.; Tan, M.; Liu, H. Impact of Relative Humidity on Thermal Comfort in a Warm Environment. Indoor Built Environ. 2013, 22, 598–607. [Google Scholar] [CrossRef]
  36. Zhou, X.; Liu, Y.; Luo, M.; Zhang, L.; Zhang, Q.; Zhang, X. Thermal comfort under radiant asymmetries of floor cooling system in 2 h and 8 h exposure durations. Energy Build. 2019, 188–189, 8–110. [Google Scholar] [CrossRef]
  37. Luo, M.; Arens, A.E.; Zhang, H.; Wang, Z. Thermal comfort evaluated for combinations of energy-efficient personal heating and cooling devices. Build. Environ. 2018, 143, 201–216. [Google Scholar] [CrossRef]
  38. Wang, Z.; Ning, H.; Ji, Y.; Hou, J.; He, Y. Human thermal physiological and psychological responses under different heating environments. J. Therm. Biol. 2015, 52, 177–186. [Google Scholar] [CrossRef]
  39. Kim, S.H.; Joung, K.S.; Kim, Y.I. Thermal Comfort Range of Radiant Floor Heating System by Residential Style. Trans. Korea Soc. Geotherm. Energy Eng. 2015, 11, 7–14. [Google Scholar] [CrossRef]
  40. Kim, D.G.; Kim, S.H. The study of human response for floor surface temperature and resident’s posture change. Korean J. Air Cond. Refrig. Eng. 2015, 24, 846–851. [Google Scholar]
  41. Hakamada, K.; Asawa, T.; Kitagawa, H.; Aoshima, H.; Kawamura, R. Contact cooling for bare feet using floor cooling systems: Experiment on human thermal physiology and sensation in Japanese hot environment. Build. Environ. 2024, 253, 111256. [Google Scholar]
  42. Lim, J.; Jo, J.; Kim, Y.; Yeo, M.; Kim, K. Application of the control methods for radiant floor cooling system in residential buildings. Build. Environ. 2006, 41, 60–73. [Google Scholar] [CrossRef]
  43. Lee, J.; Isoda, N.; Mitsuda, M. The Effects of Water-Cooled Floor on Thermal Comfort of the Human Body. J. Korean Soc. Living Environ. Syst. 2000, 7, 20–26. [Google Scholar]
  44. Kitagawa, H.; Asawa, T.; Kubota, T.; Trihamdani, A.R.; Mori, H. Thermal storage effect of radiant floor cooling system using phase change materials in the hot and humid climate of Indonesia. Build. Environ. 2021, 207, 108442. [Google Scholar] [CrossRef]
  45. Jablonski, N.G. Living Color: The Biological and Social Meaning of Skin Color; University of California Press: Berkeley, CA, USA, 2012. [Google Scholar]
  46. Johnson, B.; Dunlap, E.; Benoit, E. Organizing “Mountains of Words” for Data Analysis, both Qualitative and Quantitative. Subst. Use Misuse 2010, 45, 648–670. [Google Scholar] [CrossRef] [PubMed]
  47. Almalki, S. Integrating Quantitative and Qualitative Data in Mixed Methods Research–Challenges and Benefits. J. Educ. Learn. 2016, 5, 288–296. [Google Scholar] [CrossRef]
  48. World Population Review. Available online: https://worldpopulationreview.com/countries/indonesia-population (accessed on 10 February 2025).
  49. All About Indonesia: Indonesia Fast Facts. Available online: https://www.indonesiad.com/all-about-indonesia-indonesia-fast-facts/ (accessed on 15 March 2025).
  50. Kwok, A.G. Thermal comfort in tropical classrooms. ASHRAE Trans. 1998, 104, 1031–1046. [Google Scholar]
  51. Undang-Undang (UU) Nomor 20 Tahun 2011 Tentang Rumah Susun. Available online: https://peraturan.bpk.go.id/Details/39256/uu-no-20-tahun-2011 (accessed on 10 February 2025).
  52. Rusunawa: A Closer Look at Affordable Housing Options in Jakarta. Available online: https://jpi.or.id/en/news/rusunawa-a-closer-look-at-affordable-housing-options-in-jakarta/ (accessed on 10 February 2025).
  53. Jakarta—Urban Challenges in a Changing Climate; World Bank Group: Washington, DC, USA, 2020; (In English). Available online: https://documents.worldbank.org/curated/en/132781468039870805/Jakarta-Urban-challenges-in-a-changing-climate (accessed on 10 February 2025).
  54. Peduzzi, P.; Concato, J.; Kemper, E.; Holford, T.R.; Feinstein, A.R. A simulation study of the number of events per variable in logistic regression analysis. J. Clin. Epidemiol. 1996, 49, 1373–1379. [Google Scholar] [CrossRef] [PubMed]
  55. Indonesia Residential End Use Survey. Available online: https://www.clasp.ngo/wp-content/uploads/2021/01/Indonesia-Residential-End-Use-Survey.pdf (accessed on 5 March 2025).
  56. Miyamoto, K.; Pratiwi, S.N.; Nishiiri, S.; Takaguchi, H.; Kubota, T. Relationship between Cooling Methods and Energy Consumption for the Development of Low-Carbon Collective Housing in Indonesia. Sustainability 2024, 16, 1635. [Google Scholar] [CrossRef]
  57. Lundgren-Kownacki, K.; Hornyánszky, E.; Chu, T.; Olsson, J.; Becker, P. Challenges of using air conditioning in an increasingly hot climate. Int. J. Biometeorol. 2017, 62, 401–412. [Google Scholar] [CrossRef]
  58. Watanabe, S. A Review of Floor Heating Research in Japan. J. Hum.-Environ. Syst. 2001, 5, 13–23. [Google Scholar] [CrossRef]
  59. García, E.; Pablos, Á.; Bengoechea, M.; Guaita, L.; Osendi, M.; Miranzo, P. Thermal conductivity studies on ceramic floor tiles. Ceram. Int. 2011, 37, 369–375. [Google Scholar] [CrossRef]
  60. Energy and Heat Balance. Available online: https://courses.lumenlearning.com/suny-ap2/chapter/energy-and-heat-balance/ (accessed on 10 February 2025).
  61. Luo, M.; Wang, Z.; Zhang, H.; Arens, E.; Filingeri, D.; Jin, L.; Ghahramani, A.; Chen, W.; He, Y.; Si, B. High-density thermal sensitivity maps of the human body. Build. Environ. 2020, 167, 106435. [Google Scholar] [CrossRef]
  62. Mardatillah, A. The enterprise culture heritage of Minangkabau cuisine, West Sumatra of Indonesia as a source of sustainable competitive advantage. J. Ethn. Food 2020, 7, 34. [Google Scholar] [CrossRef]
  63. Setyawan, B.W.; Aziz, A.; Teguh, T.; Jazeri, M. Selametan Day of the Dead from a Javanese Cultural Perspective among Santri and Abangan: A Case Study in Tulungagung District. IBDA J. Kaji. Islam Dan Budaya 2022, 20, 25–43. [Google Scholar] [CrossRef]
Figure 1. Proportion of main postures during gathering activities for each apartment type and monthly household income. The number in each bar shows the sample size. Currency conversion is based on an approximate exchange rate of IDR 1 = USD 0.000061 as of 22 January 2025. For example, IDR 900 K equals approximately USD 55.16.
Sustainability 17 02775 g001
Figure 2. The proportion of thermal adaptations during gathering activities for each apartment type and monthly household income. Currency conversion is based on an approximate exchange rate of IDR 1 = USD 0.000061 as of 22 January 2025. For example, IDR 900 K equals approximately USD 55.16.
Sustainability 17 02775 g002
Figure 3. Main posture, main foot covering and floor covering for each cluster during gathering.
Sustainability 17 02775 g003
Figure 4. The proportion of apartment types and monthly household income for each cluster.
Sustainability 17 02775 g004
Figure 5. Box plot of annual electricity consumption in each cluster.
Sustainability 17 02775 g005
Figure 6. Thermal adaptations during gathering activities in each cluster.
Sustainability 17 02775 g006
Figure 7. Preference for sitting on the floor during gathering activities in each cluster.
Sustainability 17 02775 g007
Figure 8. Reasons for preferring and not preferring floor-sitting during gathering activities in each cluster.
Sustainability 17 02775 g008
Figure 9. Thermal sensation during the daytime and nighttime.
Sustainability 17 02775 g009
Figure 10. Thermal comfort during the daytime and nighttime.
Sustainability 17 02775 g010
Figure 11. Thermal satisfaction during the daytime and nighttime.
Sustainability 17 02775 g011
Figure 12. Summary of sitting behavior, thermal adaptation, thermal comfort, and thermal sensation in the clusters.
Sustainability 17 02775 g012
Table 1. Large-scale survey questions.
I. GeneralBasic Information (4)Monthly income and expenses (1)Building information (1)Weekly working time (3)
II. Energy—LifestyleThermal adaptation during activity (AC & Fan usage schedule) (5)Electronic appliances owned (2)Hot water usage (3)Energy-saving action and passive behavior indicator (2)Lifestyle: weekend & weekdays (2)Lifestyle and living environment—Including contact cooling (4)
III. ActivityDaily activity area during: mealtime, gathering, studying, relaxing, sleeping (5)
IV. Foot & Floor coverFloor cover during daily activity area (surface cover) (5)Foot cover during daily activity (5)
V. Posture & PreferencesCommon sitting posture (2)Common laying posture (2)Common sleeping posture (2)Preference (like/dislike) sitting, laying, sleeping on the floor & reason (3)Common surface for sitting, laying, sleeping posture (6)Frequency of sitting, laying or sleeping on the floor (6)Common area for sitting, laying, sleeping posture (6)Psychological factors: thermal comfort, satisfaction, sensation (6)
VI. Body parts in contact with the floorBody parts in contact during daily activity (5)Preference (like/dislike) on foot sole floor contact (4)Common clothing during contact with the floor (2)
Note: The number in brackets indicates the number of questions for each category.
Table 2. Odds ratios in the binary logistic regression analysis for the preferences and reasons for floor-sitting.
(a)
Like sitting on the floor and reasons
Explanatory variablesLikeReasons for preferring sitting on a floor
CoolCoolCool
Number of AC owned: 10.6 (0.44–0.82) **1.08 (0.78–1.49)0.79 (0.57–1.1)0.74 (0.54–1.02).
Number of AC owned: 2–30.47 (0.28–0.77) **1.24 (0.58–2.63)1.28 (0.56–2.94)0.5 (0.24–1.06).
Owning FAN2.62 (1.99–3.44) ***0.83 (0.56–1.22)0.83 (0.56–1.24)0.94 (0.64–1.39)
Floor cover while gathering: Without mat0.81 (0.64–1.04)0.68 (0.51–0.9) **0.65 (0.49–0.87) **1.52 (1.15–2.02) **
Frequency of Opening windows/doors1.06 (0.95–1.18)1.13 (0.99–1.28).0.92 (0.8–1.05)0.95 (0.84–1.08)
Thermal sensation in the daytime0.95 (0.84–1.06)1.18 (1.05–1.33) **1.01 (0.89–1.15)1.01 (0.89–1.14)
Thermal sensation in the nighttime1 (0.88–1.14)1.05 (0.92–1.19)1 (0.87–1.15)1.13 (0.99–1.28).
Number of family member living together1.31 (1.15–1.48) ***0.94 (0.82–1.06)1.17 (1.02–1.34) *1.22 (1.07–1.39) **
House type: Rusunami1.8 (1.25–2.58) **1.96 (1.02–3.76) *0.8 (0.42–1.54)1.12 (0.61–2.06)
House type: Rusunawa6.01 (3.7–9.76) ***4.99 (2.47–10.09) ***1.28 (0.64–2.58)0.95 (0.49–1.85)
Unit type: Family 1 bedroom0.83 (0.53–1.29)0.42 (0.26–0.7) ***1.34 (0.82–2.17)1.67 (1.03–2.72) *
Unit type: Family 2–3 bedrooms0.39 (0.28–0.53) ***0.68 (0.47–0.97) *1.94 (1.36–2.76) ***2.64 (1.85–3.77) ***
Age0.99 (0.98–1) *0.98 (0.97–0.99) **1 (0.99–1.01)0.99 (0.98–1.01)
Gender: Male0.94 (0.73–1.21)0.76 (0.56–1.04).0.95 (0.7–1.31)0.87 (0.64–1.19)
Income0.74 (0.66–0.82) ***1.27 (1.12–1.45) ***1.05 (0.92–1.2)0.81 (0.71–0.92) **
(Intercept)4.76 (1.76–12.87) **0.15 (0.04–0.51) **1.3 (0.37–4.5)1.04 (0.31–3.44)
(b)
Dislike sitting on the floor and reasons
Explanatory variablesDislikeReasons for not preferring sitting on a floor
UncomfortableToo hotFurniture
Number of AC owned: 11.66 (1.22–2.26) **1.59 (0.93–2.73).0.56 (0.34–0.94) *2.85 (1.34–6.05) **
Number of AC owned: 2–32.13 (1.29–3.52) **3.23 (1.61–6.5) ***0.45 (0.23–0.87) *3.06 (1.26–7.4) *
Owning FAN0.38 (0.29–0.5) ***2.34 (1.6–3.41) ***1.34 (0.94–1.91)0.92 (0.61–1.4)
Floor cover while gathering: Without mat1.23 (0.96–1.57)0.8 (0.57–1.11)0.51 (0.36–0.71) ***1.94 (1.32–2.84) ***
Frequency of Opening windows/doors0.95 (0.85–1.06)0.98 (0.84–1.14)1.1 (0.94–1.27)0.78 (0.65–0.92) **
Thermal sensation in the daytime1.05 (0.94–1.18)1.13 (0.95–1.33)0.97 (0.82–1.14)0.83 (0.67–1.04)
Thermal sensation in the nighttime1 (0.88–1.13)1.41 (1.16–1.72) ***0.79 (0.65–0.95) *1.25 (0.98–1.59)
Number of family member living together0.77 (0.67–0.87) ***0.93 (0.78–1.12)0.79 (0.66–0.95) *0.86 (0.68–1.08)
House type: Rusunami0.56 (0.39–0.8) **0.86 (0.59–1.26)1.19 (0.82–1.74)3.03 (1.9–4.82) ***
House type: Rusunawa0.17 (0.1–0.27) ***0.73 (0.35–1.54)1.35 (0.66–2.76)1.99 (0.73–5.47)
Unit type conbine: Family 1 bedroom1.2 (0.77–1.87)0.5 (0.25–0.99) *1.41 (0.71–2.79)0.9 (0.39–2.08)
Unit type conbine: Family 2–3 bedrooms2.58 (1.88–3.56) ***0.56 (0.34–0.93) *1.57 (0.95–2.6).1.37 (0.75–2.48)
Age1.01 (1–1.02) *0.99 (0.98–1.01)1 (0.99–1.02)1.01 (0.99–1.03)
Gender: Male1.06 (0.83–1.37)1.66 (1.18–2.34) **1.03 (0.74–1.44)0.72 (0.48–1.08)
Income1.36 (1.21–1.52) ***0.93 (0.8–1.09)1.03 (0.88–1.2)1.16 (0.96–1.39)
(Intercept)0.21 (0.08–0.57) **0.58 (0.14–2.42)1.56 (0.39–6.24)0.02 (0–0.13) ***
Reference category:
House type: Condominium, Unit type: Studio type, Number of AC: 0, Floor cover: With mat
Income Scale:
1: Under IDR 900K; 2: 900–1250K; 3: 1250–2500K; 4: 2500–4000K; 5: 4000–7500K; 6: 7500–12,000K; 7: 12,000–20,000K; 8: 20,000–40,000K; 9: Over 40,000K
Note: * p < 0.05, ** p < 0.01, *** p < 0.001; “Odds ratio > 1” with statistical difference is highlighted in red and “Odds ratio < 1” with statistical difference in blue.
Disclaimer/Publisher’s Note: The statements, opinions and data contained in all publications are solely those of the individual author(s) and contributor(s) and not of MDPI and/or the editor(s). MDPI and/or the editor(s) disclaim responsibility for any injury to people or property resulting from any ideas, methods, instructions or products referred to in the content.

