1. Introduction
The rapid aging of China’s population has elevated cardiovascular health among elderly individuals to a critical public health concern, particularly regarding interactions between gender differences and environmental factors [
1]. This concern is well-founded, as China Chronic Disease and Risk Factor Surveillance data reveal a hypertension prevalence of 58.3% in people aged 65+ years compared to just 32.4% in those aged 45–54 years [
2]. Such a stark contrast demonstrates how environmental factors and lifestyle changes accumulate with age, progressively affecting cardiovascular health. Consequently, establishing supportive environments represents a promising approach to improving cardiovascular outcomes in older adults.
Within this context, temperature emerges as a particularly significant environmental factor. Recent studies confirmed that cold conditions substantially impact elderly cardiovascular health, with research in northern China demonstrating that each 1 °C decrease in outdoor temperature corresponds to increases of 0.29 mmHg and 0.15 mmHg in systolic and diastolic blood pressures, respectively [
3]. These findings align with global observations showing elevated cardiovascular mortality risk during winter cold spells [
4], highlighting the season-specific vulnerability of elderly populations.
When examining these environmental effects more closely, gender differences emerge as an important dimension. Research has documented distinct gender-specific vascular response patterns in cold environments [
5], with studies on Cold-Induced Vasodilation mechanisms highlighting females’ enhanced environmental sensitivity [
6]. Building on these observations, recent advances in gender medicine have identified females’ higher cardiovascular reactivity to environmental stressors, attributing these differences to hormonal fluctuations and specific vascular regulatory mechanisms [
7]. Recent studies have identified distinctive gender-specific reactions to cold conditions, with females demonstrating different vasoconstriction patterns and thermal perception thresholds [
8]. Furthermore, psychological adaptation processes show gender differentiation, with females often exhibiting stronger emotional responses to environmental stressors but potentially greater resilience through social engagement mechanisms [
9].
To better understand these complex relationships, researchers have developed theoretical frameworks such as the Environmental Health Impact Pathway Model, which integrates direct physiological and indirect psychological effects of environmental exposure [
10]. However, this framework, while valuable, lacks systematic empirical validation regarding gender differences. This gap is particularly significant because the interaction between physiological and psychological responses becomes especially complex in cold environments, where they form an integrated functional system through neuroendocrine networks [
11].
Despite growing interest in this field, current research faces three significant limitations. First, while some studies have explored winter green space usage through subjective assessments [
12], empirical research examining actual physiological and psychological responses under low-temperature conditions remains scarce. Second, although dynamic monitoring technologies show promise, their implementation in cold environments presents challenges regarding equipment reliability and participant comfort [
13]. Third, our understanding of gender-specific environmental adaptation mechanisms under cold conditions remains insufficient, limiting the development of inclusive urban design strategies.
To address these gaps, this study investigates how different outdoor spaces in cold urban communities influence elderly individuals’ physiological indicators and their gender-specific characteristics through a novel “static–dynamic” dual-temporal analysis framework (
Figure 1). This innovative approach distinguishes between static analysis, which examines isolated physiological states across different environments, and dynamic analysis, which tracks adaptation processes during environmental transitions, as illustrated in
Figure 2.
Specifically, the research examines four interconnected questions: (1) how different outdoor environments (activity areas, green walkways, and streets) affect elderly individuals’ blood pressure indicators; (2) what gender-specific characteristics emerge in these environmental exposure effects; (3) what underlying mechanisms connect environmental exposure to physiological responses; and (4) how these effects manifest across temporal phases of immediate response, adaptation, and after-effects during environmental transitions.
This comprehensive approach enables assessment of both acute and cumulative effects while providing methodological support for exploring gender-specific characteristics in cold urban environments. By recognizing the cumulative nature of environmental health effects, our framework allows for simultaneous examination of long-term exposure patterns alongside short-term physiological responses.
Based on the experimental results, we have constructed a conceptual framework that elucidates the hypothesized relationships among key variables (
Figure 3). This framework articulates both direct physiological pathways and indirect psychological pathways through which environmental characteristics influence elderly individuals’ responses. Throughout our investigation, we placed special emphasis on identifying gender-specific patterns in environmental adaptation, thereby enriching our understanding of these dynamics and providing a foundation for gender-responsive urban design.
2. Research Methods
2.1. Research Trial Overview
This study examined the effects of three distinct outdoor spaces on blood pressure indicators among elderly individuals residing in cold urban communities. The study focused specifically on healthy participants aged 60 to 70, and the age range was selected based on three criteria: (1) this demographic represents the fastest growing segment of the urban elderly population in cold regions; (2) people in this age group generally maintain adequate outdoor activity at the onset of age-related cardiovascular changes; (3) this range minimizes the confounding effects of age-related diseases while capturing the target population for preventive environmental interventions [
14]. Participant recruitment followed ethical research protocols approved by Shenyang Jianzhu University Ethics Committee (approval code: 2023SJZUA005). To ensure robust findings, the study implemented a systematic site selection process, which unfolded in three comprehensive stages.
The first stage identified the Hunnan District of Shenyang as a representative cold urban region. According to the Shenyang Planning, this district’s characteristics closely match regional averages, with a green space ratio of 38.2% (regional average: 36.5%) and elderly population proportion of 16.8% (regional average: 15.9%). The area’s winter temperatures (−12.5 °C to 2 °C) and relative humidity (45–65%) typify cold urban climates.
The second stage selected the Jindi Community from 24 residential communities based on comprehensive indicators including construction age, housing type, population structure, and green space configuration. As shown in
Table 1, this community’s characteristics align closely with regional mean values.
In the third stage, three representative outdoor environments were identified according to relevant design criteria, as detailed in
Table 2. These settings were chosen based on elderly residents’ typical usage patterns, offering diverse characteristics in spatial scale, green coverage, and openness (
Figure 4). Site validation through comparison with 10 similar communities confirmed strong representativeness, with all key indicators falling within 15% of median values.
The experiments spanned 44 days across two winter periods (19 November–10 December 2023, and 20 November–8 December 2024), conducted between 10:00 and 14:00 under controlled environmental conditions (temperature: 4–8 °C, wind speed: below Beaufort scale 3, relative humidity: 33%). Following standard protocols [
15], the study recruited approximately 300 participants meeting specific health criteria: non-smoking status, absence of severe cardiovascular conditions or pulmonary surgery history, ability to walk slowly for 30 min, and regular outdoor activity participation.
This methodology, while comprehensive, has limitations in terms of seasonal coverage and sample size, potentially affecting the generalizability of findings to extreme winter conditions.
Figure 4 illustrates the test sites and aerial photos of the study area.
2.2. Physiological and Psychological Indicators Collection
To comprehensively assess the impact of environmental changes on older adults, this study employed a combination of physiological and psychological indicators. Physiological responses were primarily measured through blood pressure (BP) using the clinically validated OMRON HEM7718 automatic blood pressure monitor. The study focused on three key BP components: systolic blood pressure (SBP), diastolic blood pressure (DBP), and pulse pressure (PP). SBP, reflecting the heart’s contraction force, is sensitive to environmental changes, particularly in the 60–70 age group [
16,
17]. DBP provides insights into blood vessel elasticity and autonomic nervous system function during heart relaxation [
18]. PP, the difference between SBP and DBP, serves as a comprehensive indicator of cardiovascular health, with lower values associated with improved well-being in older adults [
19]. A three-component evaluation system was chosen over Heart Rate Variability (HRV) due to HRV’s requirements for static measurements, sensitivity to low temperatures, and high sensitivity to physical and emotional states, which are less practical for outdoor settings [
20,
21,
22,
23].
Psychological responses were assessed using three standardized scales: the Profile of Mood States (POMS), Recovery Experience Scale (ROS), and Environmental Naturalness Perception Questionnaire (ENPQ). POMS evaluates immediate emotional changes induced by environmental exposure, utilizing the Chinese version validated in related studies [
24]. ROS assesses psychological recovery effects, comprising four dimensions—“psychological detachment”, “relaxation”, “control”, and “mastery experiences”—with good structural validity (CFI = 0.95) and internal consistency (α = 0.91) [
25]. ENPQ evaluates subjective perceptions of environmental characteristics, such as natural richness, diversity, and tranquility, using a five-point Likert scale and validated across multiple language versions [
26,
27]. To ensure data quality, psychological measurements underwent rigorous validation through test–retest reliability assessment (n = 30, r = 0.78–0.86,
p < 0.001) and convergent validity testing with established scales.
This integrated approach ensures a thorough evaluation of both physiological and psychological responses, providing a comprehensive understanding of environmental health impacts.
2.3. Experimental Procedure and Analysis Methods
This study employed a standardized protocol, with experimental phases timed to physiological adaptation dynamics. Physiological adaptation theory identifies three stages in cardiovascular responses of older adults to environmental changes: immediate response (0–5 min), stable adaptation (5–10 min), and post-effect (10–15 min). A 15 min observation period captures primary adaptations, despite potential individual variations [
28].
Figure 5 illustrates the entire experimental procedure, which was designed based on the findings from Kabisch’s study [
29]. The experimental procedure was divided into four consecutive phases:
Participants began with a preparation phase, where they were briefed on the experimental process, sat quietly for five minutes, and completed the SF-12 and POMS questionnaires. Following a five-minute rest, their baseline blood pressure was measured. In the subsequent sitting phase, participants selected a comfortable location within the experimental site to sit for 15 min, after which they completed the POMS, ROS, and ENPQ. A five-minute rest period followed, during which their blood pressure was measured again, with researchers absent to simulate a natural environment. During the walking phase, participants walked at a leisurely pace for 15 min within the site, then completed the same set of questionnaires, rested for five minutes, and had their blood pressure measured once more—again without researcher supervision. Finally, in the conclusion phase, participants rested for 15 min; completed the POMS, ROS, and ENPQ for the last time; rested for five minutes; and had their blood pressure measured for the final time. Throughout the experiment, participants were allowed to socialize with others (who were not researchers) and were instructed to keep their phones on silent and refrain from using them.
To account for potential baseline psychological differences, participants completed initial POMS assessments during the preparation phase. In order to minimize potential legacy effects between experimental phases, the study employed a balanced design of randomized environmental exposure sequences with enforced rest periods between experimental phases that allowed physiological markers to return to baseline levels (as validated by initial testing). These baseline measurements were considered when interpreting environmental effects on psychological outcomes. Statistical comparisons confirmed no significant differences in baseline psychological states between participant groups (p > 0.05), indicating that observed changes during environmental exposure primarily reflected environmental influences rather than pre-existing conditions.
Following data collection, analyses were conducted to explore both static and dynamic responses. Gender-specific differences in physiological and psychological indicators were examined using Mann–Whitney U tests. Mixed variance analysis assessed immediate effects and adaptation patterns across environmental transitions. Additionally, structural equation modeling with bootstrap methods was employed to investigate the mediating roles of psychological states in the relationship between environmental exposure and blood pressure responses (
Figure 6).
3. Data Analysis
3.1. Sample Characteristics Description
The study involved a thorough analysis of data collected from 345 valid participants, comprising 165 males and 180 females, with a mean age of 63.4 years (±4.7). Statistical analysis and visualization were conducted using SPSS version 21.0 and Python version 3.11. Initially, the study began with a pool of 383 participants; however, 38 individuals were excluded due to incomplete participation or behavioral interference. SF-12 Survey results revealed mean Physical Component Summary (PCS) and Mental Component Summary (MCS) scores of 45.37 ± 5.96 and 47.12 ± 5.73, respectively, indicating typical health status for this age demographic. Exploratory age-stratified analysis comparing participants aged 60–64 (n = 187) and 65–70 (n = 158) revealed no statistically significant differences in environmental response patterns (p > 0.05 for all key indicators), supporting the treatment of the sample as a single cohort for primary analyses.
Reliability analyses yielded Cronbach’s α coefficients of 0.649 for males and 0.633 for females (
Table 3). While these values fell below the conventional 0.7 threshold, they were deemed acceptable based on Taber’s study that coefficients exceeding 0.6 suffice for social science research [
30]. The reliability was further validated by strong test–retest results (r = 0.782,
p < 0.001) from 30 participants, supporting Bonett and Wright’s recommendation for multiple reliability indicators [
31]. Factor analysis suitability was confirmed through KMO and Bartlett’s tests (
Table 4), with males showing KMO = 0.891 and χ
2 = 12567.326 (df = 1128,
p < 0.001), and females showing KMO = 0.903 and χ
2 = 14286.752 (df = 1231,
p < 0.001), establishing a robust foundation for subsequent analyses.
3.2. Descriptive Statistical Analysis
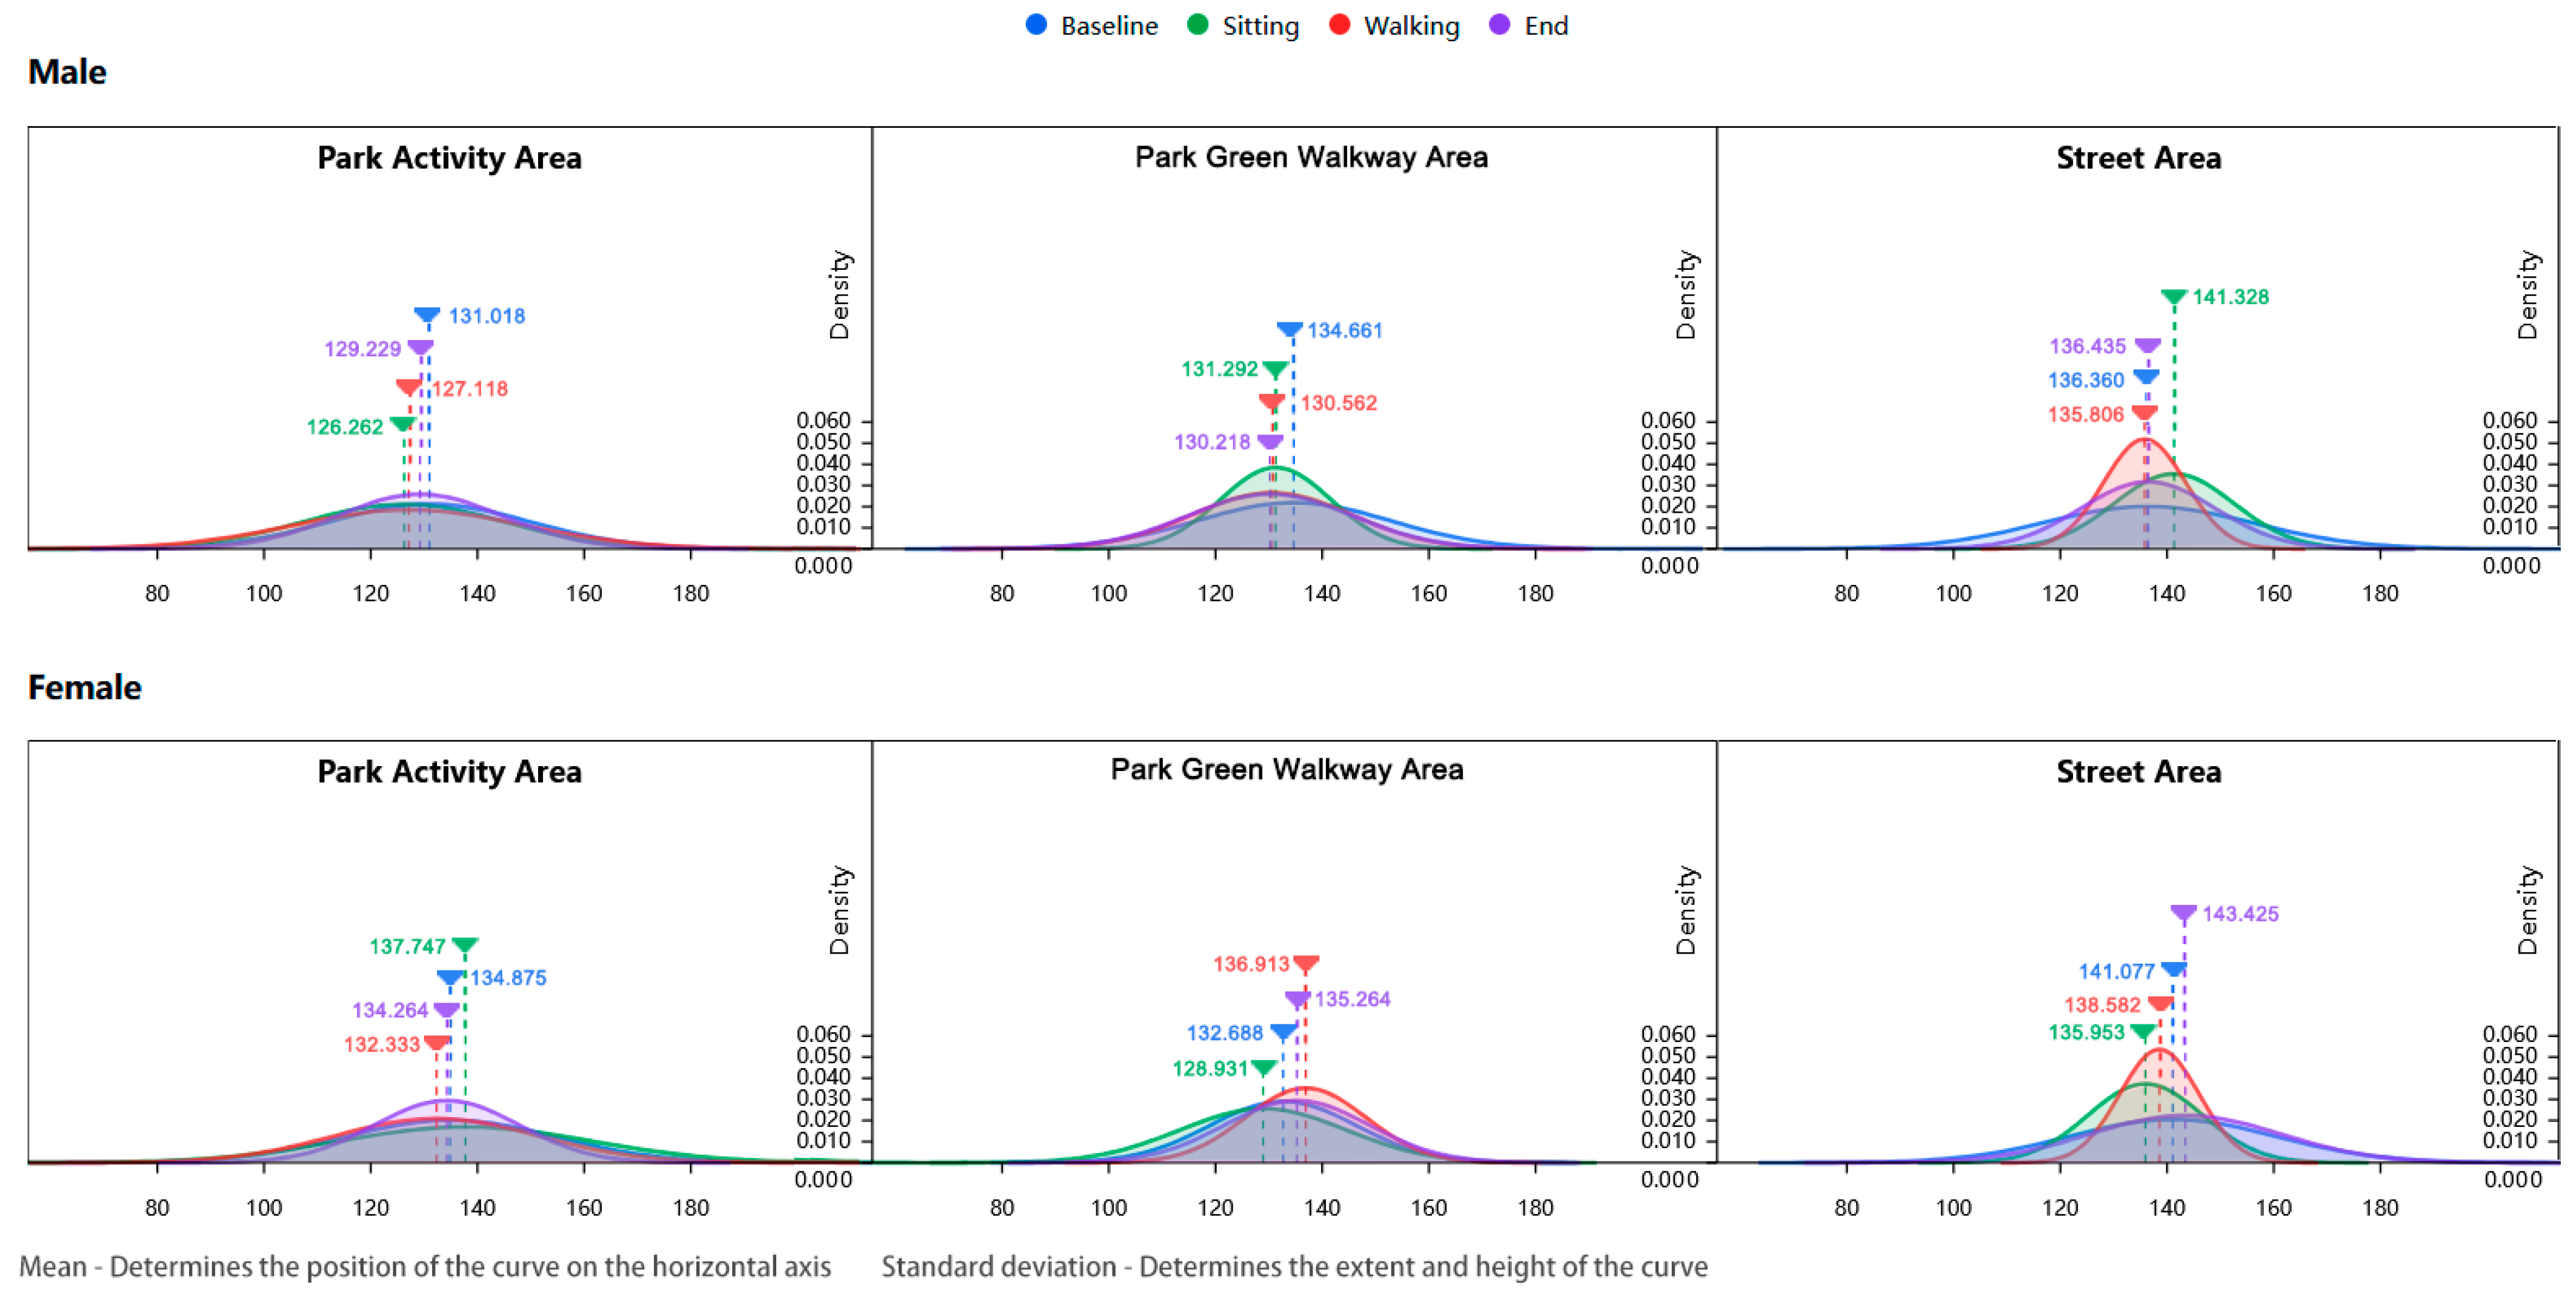
Analysis of physiological indicators (
Table 5) demonstrated distinct environmental impacts on participants’ blood pressure measurements. In street environments, male participants exhibited significantly elevated systolic blood pressure (SBP), particularly during the sedentary phase (street area: 141.33 mmHg, compared to community park: 126.26 mmHg and green trail: 131.29 mmHg). Female participants showed similar trends, with notably high SBP during the final phase (143.43 mmHg in street areas). Gender-specific differences were observed in blood pressure indicators: females demonstrated higher Pulse Pressure (PP) values during both baseline and sedentary phases (e.g., community park baseline: 55.21 mmHg for females versus 45.09 mmHg for males), while males consistently showed higher Diastolic Blood Pressure (DBP) values.
Density distribution analysis of blood pressure measurements provided further insights into these patterns (
Figure 7 and
Figure 8). Blood pressure indicators in street environments consistently displayed lower peaks and broader distributions, particularly evident among female participants during the final phase (mean SBP of 143.43 mmHg with a notably dispersed distribution curve). This distribution pattern confirms that street environments may trigger greater physiological variations. The temporal progression of blood pressure distributions across activity phases, illustrated through density curves, revealed more pronounced “high sensitivity–rapid recovery” characteristics in female participants during environmental transitions, supporting the observed gender-specific adaptation patterns.
Analysis of psychological indicators (
Table 6) revealed significant environmental effects. Street environments consistently induced elevated POMS scores in both genders, indicating deteriorated emotional states. During the completion phase, street area POMS scores were substantially higher (males: 11.13, females: 12.12) than those in community parks (males: 7.11, females: 6.28) and green trails (males: 5.84, females: 6.39). The density distributions of POMS scores exhibited notably wider and right-skewed patterns in street areas (
Figure 9), especially among female participants (mean POMS score of 11.54 during walking phase with extended distribution), suggesting both elevated negative emotional states and greater individual response variations.
Recovery Experience Scale (ROS) scores demonstrated superior outcomes in green environments, with participants achieving higher scores in green trail areas during the walking phase (males: 2.96, females: 2.99) compared to street areas (males: 2.12, females: 1.75). A notable finding emerged in male participants’ ROS scores during the sedentary phase in park areas (
Figure 10), where the density distribution showed a distinct high-peak, narrow-base pattern (mean 2.25, SD 0.22). This distribution characteristic indicates highly consistent recovery experiences among male participants during static activities, revealing a previously unidentified gender-specific environmental response pattern.
Environmental Naturalness Perception Questionnaire (ENPQ) scores during the sedentary phase similarly favored green trail areas (males: 6.02, females: 5.53) over street areas (males: 4.26, females: 4.49). Green walkway environments demonstrated more concentrated and left-skewed POMS score distributions (mean 7.37 for females during walking phase, with narrower distribution curve), indicating that natural environments provide more consistent emotional improvement effects.
The analysis revealed clear correlations between physiological and psychological responses across different environments. Street areas consistently showed elevated blood pressure levels corresponding to higher POMS scores and lower ROS scores, while green environments demonstrated the opposite pattern. Gender-specific responses emerged across environments, with females showing higher ENPQ scores in green walkways, suggesting enhanced sensitivity to natural environments. The impact of activity phases varied by environment and gender, with green environments improving ROS scores during walking periods and street areas elevating POMS scores throughout different phases.
3.3. Static Analysis Results
The study employed Mann–Whitney U tests to analyze environmental effects on elderly individuals’ physiological and psychological indicators across genders. This nonparametric approach was selected for its three key advantages in environmental exposure studies: its ability to handle non-normally distributed data common in physiological measurements, its effectiveness in comparing independent samples across different environments, and its robustness against outliers in behavioral response data.
The smaller U value served as the test statistic for significance testing.
Table 7 presents the comprehensive Mann–Whitney U test results, with findings visualized in a Significance Matrix Plot (
Figure 11).
- (1)
Physiological indicators
Blood pressure responses showed distinct gender-specific patterns across environments. In street settings, females demonstrated higher systolic blood pressure than males (141.077 mmHg vs. 136.36 mmHg), and this difference approached but did not reach statistical significance (p = 0.231). Diastolic blood pressure revealed significant gender differences in activity areas (p = 0.017), with males showing higher values (85.932 mmHg vs. 79.663 mmHg). Pulse pressure exhibited significant gender differences in both activity areas (p = 0.001) and street areas (p = 0.011), with females consistently demonstrating higher values.
- (2)
Psychological indicators
The Profile of Mood States analysis revealed significant gender differences in both walkway areas (p = 0.043) and street areas (p = 0.044), with females showing higher scores, suggesting enhanced emotional sensitivity to environmental conditions. The Recovery Experience Scale demonstrated significant gender differences, specifically in street areas (p = 0.022), with females showing higher scores. The Environmental Naturalness Perception Questionnaire results indicated significant gender differences in activity areas (p = 0.017) and walkway areas (p = 0.033), with males scoring higher, suggesting stronger positive perceptions of natural elements.
These static analysis findings provide valuable insights into environmental influences on elderly individuals’ physiological and psychological responses. However, the static approach has inherent limitations in capturing immediate effects and short-term adaptation processes, necessitating complementary dynamic analysis for a more comprehensive understanding of environmental impacts on elderly health.
3.4. Dynamic Analysis Results
This study utilized Mixed Analysis of Variance (Mixed ANOVA) to examine how environmental settings influenced physiological and psychological indicators in elderly populations, with gender as a between-subjects factor. The analytical framework incorporated four essential components: fixed effects (environmental categories and gender), random effects (individual response variations), interaction effects (location–gender interactions), and effect size measurements using partial eta-squared (η2p). The results of Mauchly’s sphericity test are as follows: SBP: χ2(2) = 15.32, p = 0.018, DBP: χ2(2) = 12.45, p = 0.024, PP: χ2(2) = 9.87, p = 0.1
Given the sphericity violations for SBP and DBP (
p < 0.05), Greenhouse–Geisser corrections were applied (εSBP = 0.83, εDBP = 0.87). These ε values (0.75–1.00) indicated moderate sphericity deviation, validating the correction approach.
Figure 12 and
Figure 13 present forest plots of the Mixed ANOVA results (
Table 8), illustrating effect relationships among variables.
- 1.
In terms of physiological indicators (
Figure 12)
Location demonstrated significant main effects on systolic blood pressure (F(2.132) = 8.532, p < 0.001, η2p = 0.114), indicating substantial environmental influence through transitions. Gender exhibited significant main effects (F(1.66) = 15.247, p < 0.001, η2p = 0.188), revealing distinct regulatory mechanisms between males and females. For diastolic blood pressure, both location (F(2.132) = 12.654, p < 0.001, η2p = 0.161) and gender (F(1.66) = 8.943, p = 0.004, η2p = 0.119) showed significant main effects. Pulse pressure demonstrated significant main effects for both location (F(2.132) = 3.991, p = 0.021, η2p = 0.057) and gender (F(1.66) = 4.567, p = 0.036, η2p = 0.065).
- 2.
In terms of psychological indicators (
Figure 13)
Location demonstrated significant main effects on POMS scores (F(2.132) = 18.743, p < 0.001,η² p = 0.221), indicating substantial emotional responses to environmental transitions. Gender exhibited marginal effects on ENPQ ratings (F(1.66) = 3.234, p = 0.076), revealing potential differences in how males and females perceive natural environments. For ROS measurements, location showed strong main effects (F(2.132) = 20.543, p
< 0.001, η²p = 0.237), while gender differences did not reach statistical significance (F(1.66) = 1.876, p = 0.175). ENPQ assessments demonstrated pronounced location effects (F(2.132) = 15.876, p < 0.001, η² p = 0.194), with males showing marginally higher sensitivity to green space characteristics across different environmental settings. These findings highlight the importance of considering environmental design features when creating spaces that promote psychological well-being for elderly populations.
From a dynamic analysis perspective, these findings highlight the immediate effects of environmental transitions on elderly individuals’ physiological and psychological responses. While location consistently demonstrated significant main effects across multiple indicators, gender effects were more limited, with no significant location–gender interactions observed. These results provide crucial insights into the mechanisms of environmental exposure’s impact on physiological indicators and underscore the importance of considering environmental transitions in age-friendly community design.
3.5. Path Analysis Results
Utilizing both static and dynamic analyses, this study uncovered various pathways by which environmental exposure affects the health of the elderly, particularly highlighting gender-specific responses in cold urban settings. These results offer fresh insights into the relationship between environment and health, elucidated through two fundamental mechanisms:
The research demonstrated distinct gender-specific patterns in physiological responses to environmental exposure. In street environments, female participants exhibited notably higher baseline blood pressure levels compared to males (SBP: 141.077 mmHg vs. 136.36 mmHg). When transitioning from green spaces to street environments, females showed moderate blood pressure increases (136.913 mmHg to 138.582 mmHg) while males demonstrated more pronounced changes (130.562 mmHg to 135.806 mmHg). These findings indicate that natural environments may help mitigate stress responses by suppressing sympathetic nervous system activation, whereas urban environments may intensify both physiological and psychological stress states. When environmental stressors such as noise and cold coexist, the protective effects of green spaces on health demonstrate notable gender-specific characteristics, aligning with the gender-specific physiological responses observed in our experiments.
The study revealed a cascade effect whereby environmental characteristics trigger psychological changes that lead to physiological responses affecting health outcomes. This was evidenced by synchronized patterns in the data—in street environments, diminished emotional states (POMS: females 11.539 vs. males 10.055) corresponded with elevated blood pressure (SBP: females 138.582 mmHg vs. males 135.806 mmHg). Conversely, green walkways with higher environmental perception quality (ENPQ: females 6.375 vs. males 6.195) correlated with lower blood pressure readings (SBP: females 136.913 mmHg vs. males 130.562 mmHg).
Gender-specific characteristics emerged strongly in this cascade effect. Females exhibited more robust psychological–physiological coupling during transitions, with greater POMS increases (4.168 vs. males’ 2.687) and more pronounced SBP changes. During the 15 min recovery period, females also demonstrated greater blood pressure reduction (ΔSBP = −4.318 mmHg vs. males’ −2.187 mmHg) and emotional improvement (ΔPOMS: −5.264 vs. −3.922), with recovery experience scores showing a stronger negative correlation with blood pressure (females r = −0.51 vs. males r = −0.38; overall r = −0.42, p < 0.01).
To verify the mediating role of psychological states between environmental exposure and physiological responses, this study employed structural equation modeling (SEM) for path analysis. The study designated environmental type (naturalness score) as the independent variable and blood pressure indicators (SBP) as the dependent variable, examining the mediating effects of POMS and ROS while excluding ENPQ. Although ENPQ provided valuable information in assessing environmental characteristics, this study utilized it as a supplementary measurement indicator for environmental characteristics rather than a mediating variable. The analysis employed maximum likelihood estimation for parameter estimation and utilized the Bootstrap method to calculate confidence intervals for mediating effects.
The model fit indices demonstrated good model compatibility (χ
2/df = 2.43, CFI = 0.962, TLI = 0.951, RMSEA = 0.048, SRMR = 0.032). The path analysis results indicated that environmental factors influence health outcomes through both physiological and psychological pathways (
Table 9 and
Table 10). These results provide direct evidence for the environment–psychological–physiological cascade effects.
Regarding the verification of mediating effects, as illustrated in
Figure 14, both emotional states (POMS) and recovery experiences (ROS) played significant mediating roles in the process through which environmental exposure influences blood pressure. The total mediating effect reached −0.238, accounting for 56.3% of the total effect.
In terms of gender differences in mediating effects, as illustrated in
Figure 15, the female sample exhibited a significantly larger total mediating effect (β = −0.302) compared to the male sample (β = −0.185), indicating that psychological states exerted a stronger mediating influence among female participants. The mediating effect of POMS (β = −0.142) was slightly larger than that of ROS (β = −0.096), suggesting that emotional state may serve as the primary psychological mediating pathway through which environmental factors influence physiological indicators (
Figure 16).
The research findings confirmed that environmental factors simultaneously influence health outcomes through both physiological and psychological pathways, as validated by path analysis in the structural equation model. This dual-pathway influence was particularly pronounced in the female group, where psychological pathway mediation showed significantly stronger effects. These findings support the multi-pathway influence model proposed by Markevych’s study while revealing its gender-differentiated manifestation [
8]. The interaction between environmental and physiological mechanisms appears more complex than initially hypothesized. In cold urban environments, temperature as a physical factor not only directly affects cardiovascular function but also indirectly modulates physiological responses by altering environmental perception and psychological states.
4. Discussion
The study revealed complex patterns in elderly individuals’ physiological and psychological responses to different environments, with notable gender-specific characteristics emerging through integrated static and dynamic analyses.
In terms of physiological responses, street environments consistently induced higher blood pressure levels compared to green spaces, particularly among female participants. This finding aligns with environmental exposure dose–effect theory [
32], demonstrating that higher exposure intensity to typical urban street environments corresponds to more pronounced cardiovascular stress responses. This effect was especially evident among female participants, whose systolic blood pressure in street areas (141.077 mmHg) significantly exceeded measurements in activity areas (134.875 mmHg,
p < 0.001).
Gender differences were particularly pronounced in pulse pressure (PP) measurements, with females exhibiting significantly higher values than males in both activity areas (55.212 vs. 45.086 mmHg,
p = 0.001) and street areas (56.897 vs. 49.164 mmHg,
p = 0.011). These differences align with research attributing such variations to postmenopausal changes in vascular elasticity and cardiovascular reactivity due to decreased estrogen levels [
33]. James’s study further demonstrated that green environments may protect cardiovascular health by improving vascular endothelial function, thereby mitigating the negative impacts of environmental stressors on the vascular system [
34].
Dynamic analysis revealed distinctive gender-specific adaptation patterns during environmental transitions. When moving from walkway areas to street environments, females demonstrated more sensitive blood pressure responses (increasing from 136.913 mmHg to 138.582 mmHg), while males showed more gradual changes (130.562 mmHg to 135.806 mmHg). This pattern supports findings regarding gender-differentiated environmental stress responses through multiple physiological pathways [
35]. Additionally, females demonstrated greater cardiovascular fluctuations during post-environmental stress recovery phases, potentially attributable to differences in autonomic nervous system regulation [
36].
The study also uncovered significant psychological adaptation patterns. The Profile of Mood States showed a significant main effect of location (F = 18.743,
p < 0.001, η
2p = 0.221). During transitions from green walkways to street environments, POMS scores increased markedly (males: 7.368 to 10.055; females: 7.371 to 11.539), indicating immediate emotional responses to environmental changes. As theorized in the Attention Restoration Theory [
37], natural environments facilitate attention recovery and enhance perception quality by providing “soft fascination” and reducing cognitive load. The Recovery Experience Scale similarly demonstrated environment-dependent variations (F = 20.543,
p < 0.001, η
2p = 0.237), with both genders maintaining higher scores in green walkway areas (males: 2.959, females: 2.993) compared to street environments (males: 2.123, females: 1.750).
Under cold climate conditions, these effects became particularly pronounced. At an ambient temperature of 4 °C, females exhibited lower coefficients of variation in blood pressure in street environments (CV = 0.054 compared to males’ 0.057), yet their final blood pressure levels (143.425 mmHg) were significantly higher than those of males (136.435 mmHg). This finding aligns with research indicating that females may exhibit more sensitive blood flow regulation in cold environments, likely due to gender-specific differences in vasoconstriction responses and thermoregulatory mechanisms [
8]. Environmental temperature influences psychological adaptation processes through its impact on thermal comfort, triggering various adaptation mechanisms including behavioral adjustments, cognitive reappraisal, and emotional regulation strategies [
38]. Additional research indicates that the effectiveness of natural environments in alleviating environmental stress and enhancing psychological well-being may vary in intensity and pattern between genders [
9].
5. Conclusions
This research utilized an innovative dual-temporal analysis framework to examine gender-specific environmental adaptation processes among elderly residents in cold urban settings. The study established a “perception–emotion–physiology” cascade pathway through which environmental exposure influences health outcomes, with distinct gender-specific characteristics. Structural equation modeling demonstrated stronger psychological mediating effects in female participants (β = −0.302) compared to males (β = −0.185), providing mechanistic evidence for gender-differentiated environmental health impacts. The analysis revealed distinctive temporal dynamics in physiological adaptation to cold environments, with female participants exhibiting both heightened immediate stress responses (blood pressure elevation: 8.76 ± 2.31 mmHg) and enhanced environmental adaptability (blood pressure reduction rate: 42.3%).
The research further revealed a sophisticated cascade pathway through which environmental factors influence health outcomes, operating through both direct physiological and indirect psychological mechanisms. Path analysis through structural equation modeling demonstrated that psychological states serve as significant mediators between environmental exposure and physiological responses, with total mediating effects reaching -0.238 and accounting for 56.3% of the total effect. The emotional state pathway (POMS) emerged as the primary psychological mediating mechanism (β = −0.142), surpassing the recovery experience pathway (ROS, β = −0.096) in magnitude of effect and providing empirical evidence for the environment–psychological–physiological cascade model in elderly populations.
- 1.
Theoretical Implications
The study extends the Environmental Health Impact Pathway Model by providing empirical validation of gender-differentiated responses in cold climate settings. Our findings demonstrate that the model’s core pathways operate with varying intensities between genders, with psychological mediation showing significantly stronger effects in female participants. This gender-specific validation advances the theoretical understanding of environmental exposure effects beyond general population models.
The research contributes substantially to understanding environmental stress adaptation mechanisms in vulnerable populations by illuminating the “high sensitivity–rapid recovery” pattern in elderly females. This pattern provides a theoretical framework for examining how physiological vulnerability intersects with psychological adaptation capacity, which is essential for modeling health outcomes in aging populations facing climate challenges.
The work advances sustainable urban design theory through the integration of health equity considerations, demonstrating how gender-responsive environmental design simultaneously addresses environmental sustainability and social equity goals. The dual-temporal analysis framework establishes a theoretical basis for examining both immediate and longitudinal adaptation processes, creating a more nuanced understanding of how sustainable environments support healthy aging.
- 2.
Practical Implications
Implementation of the identified “high sensitivity–rapid recovery” pattern provides compelling evidence for gender-differentiated environmental interventions. Green environments were particularly effective in stress mitigation, especially among female participants who demonstrated significantly higher environmental sensitivity (blood pressure variability coefficient: 0.171 versus 0.079 for males). This finding directly supports the integration of green space transition zones in cold urban community design, particularly in areas with high pedestrian traffic.
These research findings can be implemented through strategic design approaches in cold urban communities. Microclimate transition zones should prioritize implementing 3–5 m wide vegetation belts along primary walking routes, with covered rest areas strategically placed at 50–70 m intervals (
Figure 17). These rest areas should be oriented for optimal sun exposure and incorporate integrated windbreak elements that combine natural and built features to create graduated microclimate transitions. The design should enhance visual connectivity between activity spaces while offering flexible path systems with varying levels of environmental exposure to accommodate different adaptation needs.
Based on these findings, the study proposes the following policy recommendations for cold-climate cities:
- 1.
Integration of gender-responsive design standards into urban planning codes, requiring transition zones between high-stress street environments and community green spaces.
- 2.
Implementation of microclimate management regulations requiring wind protection and solar exposure optimization in elderly-focused recreational areas.
- 3.
Establishment of environmental health impact assessments as mandatory components of urban renewal projects in neighborhoods with high elderly populations.
- 4.
Development of design guidelines specifying minimum requirements for green infrastructure spatial configuration based on identified gender-specific environmental responses.
6. Research Limitations and Prospect
This study faced several interconnected methodological challenges that warrant consideration. While the SF-12 questionnaire served as an initial health status screening tool, our research design did not fully address how pronounced seasonal changes might influence physiological adaptation patterns. The relatively brief 15 min monitoring period also presented limitations, as it often proved insufficient to capture complete environmental adaptation patterns, particularly among participants who required longer recovery times. The current experimental design is overly focused on short-term physiological and psychological measures due to the methodological limitations of maintaining controlled environmental conditions over a long period of time and the ethical considerations of long-term exposure of older participants to different environments. It also needs to be clarified as to whether the established scientific basis for using acute responses as predictors of long-term adaptation patterns is justified. However, we acknowledge this limitation and propose future longitudinal studies to compare the cumulative effect over the seasonal cycle between two groups of older adults living in different environments. Moreover, the extended two-year data collection period introduced additional complexities, as variations in elderly participants’ communication patterns and on-site behavior made it challenging to maintain consistent experimental conditions across seasonal changes. While the study controlled for key variables such as smoking habits and cardiovascular conditions, other potential confounding variables including nutritional habits, medication usage, and socioeconomic status were not explicitly incorporated. Future research should implement comprehensive lifestyle and socioeconomic assessments to further isolate environmental effects from these potential confounders.
These limitations point toward promising avenues for future research. Longitudinal investigations focusing on how seasonal variations moderate gender differences could address the temporal constraints of our current study, with particular attention to responses under cold climate conditions. Such research would benefit from implementing continuous monitoring protocols across multiple seasons, enabling a more comprehensive understanding of adaptation pattern variations and facilitating robust frameworks for comparing inter-seasonal environmental responses. Understanding the underlying mechanisms would require deeper investigation of physiological factors, especially neuroendocrine functions, through comprehensive biomarker measurements. This approach necessitates collaborative efforts between environmental design researchers, medical professionals, and specialists in environmental physiology, chronobiology, and cardiovascular medicine to enable sophisticated analyses of stress response pathways and adaptation mechanisms. Moreover, this study was conducted within a single city (Shenyang), which limits generalization to other urban environments, even those with similar climatic conditions. Regional variations in urban design, cultural factors, and infrastructure quality may influence elderly residents’ environmental responses. To address this limitation, future research should implement multi-city comparative studies across different cold climate regions to establish broader applicability of findings. Furthermore, broadening the participant age range would allow for examination of age–gender interactions, offering deeper insights into these relationships and their seasonal variations.


