Article

Evolution Trends in Carbon Emissions and Sustainable Development Paths in China’s Planting Industry from the Perspective of Carbon Sources

1
School of Business, Hubei University, Wuhan 430062, China
2
Research Center for China Agriculture Carbon Emission Reduction and Carbon Trading, Hubei University, Wuhan 430062, China
3
School of Business, Wuhan College, Wuhan 430212, China
4
School of Economics and Management, Huazhong Agricultural University, Wuhan 430070, China
5
Carbon Emission Registration and Settlement (Wuhan) Co., Ltd., Wuhan 430071, China
*
Author to whom correspondence should be addressed.
Sustainability 2025, 17(6), 2772; https://doi.org/10.3390/su17062772
Submission received: 25 January 2025 / Revised: 6 March 2025 / Accepted: 6 March 2025 / Published: 20 March 2025

Abstract

:
Reducing agricultural carbon emissions is key to promoting the sustainable development of agriculture. Carbon sources play a significant role in the carbon emissions of China’s planting industry. Researching the principles of evolutionary trends of carbon sources regarding carbon emissions in China’s planting industry helps formulate scientific policies to control such emissions in the industry. This paper adopted an emission factor approach from the IPCC to estimate the CO2 emissions of all kinds of carbon sources in China’s planting industry from 1997 to 2017. On the basis of the data, the principles of dynamic evolution in China’s planting industry and six carbon sources were analyzed by the kernel density estimation approach. Notably, the study discovered that carbon emissions peaked in 2015. In terms of the contributions of various carbon sources to the carbon emissions of the planting industry, sorted by chemical fertilizers, agricultural diesel oil, agricultural films, pesticides, agricultural irrigation, and seeding, their contribution rates were 60.82%, 13.95%, 12.88%, 9.83%, 1.88%, and 0.64%. At the same time, the kernel density results show that there was an increasing trend in carbon emissions across the whole of China’s planting industry and six kinds of carbon sources nationwide, with apparent “multipolarization”. From the perspective of various regions, the carbon emissions of chemical fertilizers, diesel oil, films, and pesticides in China’s planting industry had an evolutionary trend of multipolarization in central regions, while there was an evolutionary trend of monopolarization in eastern and western regions. The carbon emissions of seeding and irrigation had a similarly evolutionary trend in eastern, central, and western regions. Basically, they all had a double increase pattern in carbon emissions and regional differences. Therefore, China’s government needs a target to set up long-term mechanisms to ensure a stable and orderly reduction in carbon emissions in the planting industry, leading its development from the traditional planting industry to a climate-smart planting industry.

1. Introduction

Global warming is an indisputable truth. According to the research report of the World Meteorological Organization, the average temperature from 2015 to 2019 and average temperature from 2010 to 2019 reached the highest level on record [1]. For one thing, climate warming results in glacier melting and a rise in sea level and sea acidity, severely destroying marine ecosystems [2]. What is more, it leads to increases in the intensity and frequency of extreme meteorological events, having seriously negative effects on food production, social stability, and people’s health [3,4]. One key measure taken to face climate change and control climate warming is the reduction of greenhouse gas emissions. It was fully illustrated in the United Nations Framework Convention on Climate Change in 1992 and the Paris Agreement in 2015 that international society is determined and making efforts to reduce greenhouse gas emissions and face the difficult situation of climate warming.
Agriculture is an important emission source of greenhouse gas [5]. Due to production and soil-related activities, agriculture makes up roughly 17% of global greenhouse gas emissions, which has led to a general deterioration of ecosystems [6]. With the continuous growth of the world’s population and mounting pressure on food supplies, agricultural carbon emissions are bound to keep rising, thereby imposing tremendous pressure on agri-ecosystems [7]. Therefore, it is vital for us to take effective measures to regulate carbon emissions. China is a large agricultural country, and the carbon emissions caused by its implant system account for about 16% of the total greenhouse gas emissions in China [8]. To achieve the promises made in the Paris Agreement, China ought to reduce carbon emissions in agriculture. Nevertheless, agriculture is a broad concept that encompasses animal husbandry, fishery, forestry, and related agricultural services, with the planting industry being a crucial component. The planting industry involves various planting entities, which refer to organizations or individuals engaged in planting activities, including individual farmers, specialized planting households, agricultural enterprises, and agricultural cooperatives. These entities are responsible for production decision-making, resource input, and product harvesting in planting activities. Considering China’s extensive territory, basic agricultural production factors such as water, soil, temperature, and sunshine vary remarkably among different regions. Consequently, there are apparent regional differences in the carbon emission level and the developing level of the planting industry in China’s different regions. Meanwhile, with economic development, industrial chain transferring among different regions, and the diffusion of technology, the planting industry’s developing level in China’s different regions ought to dynamically change. Therefore, correctly recognizing the principles of dynamic evolution in the carbon emissions of China’s planting industry is the premise behind controlling the planting industry’s carbon emissions scientifically.
Carbon emissions in the planting industry are mainly produced by agricultural activities [9], and many studies focus on the calculation of agricultural carbon emissions [10,11,12]. However, different methods may lead to different results. According to the opinions of Cui et al. [13] and the IPCC, the planting industry’s carbon emissions mainly stem from the inputs of six kinds of agricultural production factors, namely, chemical fertilizers, pesticides, agricultural tillage, agricultural irrigation, agricultural films, and agricultural diesel oil. Scholars mainly use methods recommended by the IPCC to multiply the inputs of these six kinds of agricultural factors by the carbon emission coefficient and accumulate them to obtain the total carbon emissions in the planting industry. Then, they analyze temporal changes, regional differences, influencing factors, etc. In recent studies, many scholars have researched the carbon emissions in the planting industry. Ma et al. [14] calculated the carbon emissions and intensity of cultivated land use between 2010 and 2020, finding that the total carbon emissions from cultivated land use in China increased. Huan et al. [15] indicated that the primary sources of agricultural carbon emissions are agricultural material inputs and the enteric fermentation of ruminants. However, the existing literature shows that few scholars pay attention to the effects that carbon emission from different carbon sources have on the principles of dynamic changes in the total carbon emissions of the planting industry and the carbon emission of different carbon sources in the planting industry. This might be detrimental to the green development of agriculture. It is necessary for us to detect various carbon sources.
From the perspective of methods, Liu et al. [16] adopts the kernel density estimation approach to investigate the dynamic evolution trend of China’s Agricultural Green Total Factor Productivity, which is based on carbon emissions. Zhang et al. [17] uses the kernel density to measure the dynamic evolution of carbon sinks in Hubei province. It can be observed from the above-mentioned studies that numerous scholars have employed kernel density estimation in the realm of agricultural carbon emissions to explore the dynamic evolution trend. However, few scholars use this method to investigate the trend in the carbon emission of China’s planting industry. Therefore, this study tries to research the evolutionary trend in China’s planting industry from the perspective of carbon resources.
In summary, we will calculate the carbon emissions in China’s planting industry based on the carbon sources and use the kernel density to find the dynamic evolution in different regions of China. The potential contributions are as follows: Firstly, based on the perspective of carbon sources, this paper can fill in the gaps in the previous research on agricultural carbon emissions and broaden the research. Then, this paper identifies the differences in the evolutionary trends of carbon sources, which can provide a theoretical basis for the following research on agricultural emission reduction. Lastly, investigating the carbon sources will promote the sustainable and environmentally friendly development of agriculture.
The remainder of this paper is structured as follows: At first, carbon emissions in China’s planting industry are measured and calculated on the basis of six kinds of carbon sources to analyze the contributions that the carbon emission of different carbon sources made to total carbon emissions in the planting industry. Then, kernel density analysis is used to perform an evolutionary analysis of carbon emissions in China’s planting industry and from six kinds of carbon sources in the eastern, central, and western regions of China. It contributes to analyzing the principles of the evolutionary trends in the carbon emissions of China’s planting industry systematically.

2. Theories and Research Methods

2.1. Measuring Theories and Models of Planting Industry’s Carbon Emission

Drawing on relevant practices in the 2016 IPCC Guidelines for National Greenhouse Gas Inventories, this study adopted the emission factor approach to measure the carbon emissions of the planting industry. It means that the carbon emissions of different carbon sources can be obtained by multiplying the use of different carbon sources and their corresponding emission factors in the planting industry. Then, the total carbon emissions can be obtained by summing carbon emissions from different carbon sources. The specific formula is as follows (1):
E = E i = T i δ i
where E represents the total carbon emissions of the planting industry; E i represents the carbon emissions of class i carbon sources in the planting industry; T i represents the usage of class i carbon sources in the planting industry; and δ i represents the carbon emission factors of class i carbon sources. According to practices recommended by the IPCC (2006, 2007) and in the ‘Guidelines for the Preparation of Greenhouse Gas Inventories at Provincial Level (Trial)’ launched by the National Development and Reform Commission in 2011, in addition to the research results of relevant scholars [17,18,19,20,21,22,23,24], this study divided the main carbon sources into six kinds: chemical fertilizers, pesticides, agricultural films, agricultural diesel oil, agricultural seeding, and agricultural irrigation. Table 1 illustrates their carbon emission factors and resources.

2.2. Kernel Density Analysis

Kernel density analysis is a classic analyzing method. It can use continuous curves to depict changes of variables without functional form setting [16,17]. The formula of kernel density estimation can be seen in Formula (2).
f ( x ) = 1 n h i = 1 n K ( X i x h )
where n represents the number of observed samples; h represents the bandwidth; X i represents the carbon emissions of the planting industry in i province (including municipalities); and K ( ) represents the kernel function. Gaussian kernel function was used to analyze the dynamic evolution principles of carbon emissions in China’s planting industry in this study.

3. Data Resources and Processing

The data used in this paper are mainly from the China Statistic Yearbook, China Rural Statistic Yearbook, and China Agricultural Yearbook. According to the National Bureau of Statistics’ division principles in China, regions in this paper will be divided into three parts: the eastern region, central region, and western region. The eastern region includes 12 provinces (including municipalities): Beijing, Tianjin, Hebei, Liaoning, Shanghai, Jiangsu, Zhejiang, Fujian, Shandong, Guangdong, Guangxi, and Hainan; the central region includes 9 provinces (including municipalities): Shanxi, Inner Mongolia, Jilin, Heilongjiang, Anhui, Jiangxi, Henan, Hubei, and Hunan; the western region includes 10 provinces (including municipalities): Sichuan, Chongqing, Guizhou, Yunnan, Tibet, Shaanxi, Gansu, Ningxia, Qinghai, and Xinjiang. The carbon emissions of the planting industry in the different regions and the whole of China were obtained by accumulating data from the corresponding provinces (including municipalities).

4. Research Results and Analysis

4.1. Measuring Results of Carbon Emissions in China’s Planting Industry

Table 2 illustrates the measuring results of all kinds of carbon sources’ CO2 emissions in China’s planting industry from 1997 to 2017. It can be seen that there was an overall increasing trend with fluctuations in the carbon emissions in China’s planting industry, and carbon emissions peaked in 2015. According to the time series data of the six carbon sources’ carbon emissions, there was a decreasing trend in the carbon emissions of chemical fertilizers, pesticides, diesel oil, and films after 2015. It shows that the “Chemical Fertilizers and Pesticides Reduction” Campaign, officially started by the Ministry of Agriculture and Rural Affairs of the CPC in 2015, had positive effects which effectively controlled the growth of carbon emissions in China’s planting industry. Then, the measuring data of all kinds of carbon sources’ carbon emissions in the planting industry illustrate that they can be sorted, with decreasing contributions of carbon emissions in the planting industry, in the following order: chemical fertilizers, diesel oil, films, pesticides, agricultural irrigation, and agricultural seeding. According to the contribution degree, the six carbon sources can be divided into three types: Class 1 is chemical fertilizers, which is the largest carbon source of the planting industry’s carbon emissions, making an average contribution of 60.82% to the planting industry’s carbon emissions. Class 2 contains diesel oil, films, and pesticides. They made contributions of 13.95%, 12.88%, and 9.83% to the carbon emissions in the planting industry, respectively. Class 3 includes agricultural irrigation and seeding, and they made contributions of 1.88% and 0.64% to the planting industry’s carbon emissions, respectively.

4.2. Carbon Emissions’ Evolutionary Trend in China’s Planting Industry from the Perspective of Carbon Sources

4.2.1. The Overall Evolutionary Trend of Carbon Emissions

Figure 1 illustrates the evolutionary process of the planting industry’s carbon emissions in the eastern, central, and western regions of China between 1997 and 2017. The kernel density curves of carbon emissions in China’s planting industry had the apparent right-drag phenomenon from 1997 to 2017. The right-drag range expanded apparently and the curve centers obviously moved to the right with certain increases in curve width. The main peak’s kernel density height “rose at first and then went down”, which shows a clear increasing trend in the national carbon emission level of the planting industry. It also shows that there were obvious differences, which expanded apparently, between provinces (including municipalities) with high carbon emissions and provinces (including municipalities) with low carbon emissions. Furthermore, the clear “multi-peak” existed in the kernel density curve of the national carbon emissions in the planting industry, which illustrates the multipolarization distribution existing in the carbon emissions of China’s planting industry.
In various regions, there were apparent differences and similarities in the kernel density curves of carbon emissions in the planting industry of eastern, central, and western regions. As for similarities, they all had an obvious right-drag phenomenon with a clear expansive right-drag range and right-moving curve centers. It reflects that it was fairly different between provinces (including municipalities) with high carbon emissions and provinces (including municipalities) with low carbon emissions in China’s eastern, central, and western planting industry. As for differences, the height of the main peak of the kernel density in the eastern and western regions generally decreased, with increases in the curve width and small peaks on the right vanishing gradually, which shows that the carbon emissions in the eastern and western regions tended to evolve from “multipolarization” to “single polarization”. It means that provinces (including municipalities) with higher carbon emissions in the planting industry took efficient measures, controlling the increase in carbon emissions so the regional differences in carbon emissions may go up as a whole. The height of the main peak of the kernel density in the central region generally went up, with a certain decrease in the width, gradually forming pointed peaks on the right of the curves. It means that there was a trend from “single polarization” to “multipolarization” in the carbon emissions of the central region’s planting industry. Also, provinces (including municipalities) with lower carbon emissions tended to converge toward higher ones so regional differences of carbon emissions may go down in general.

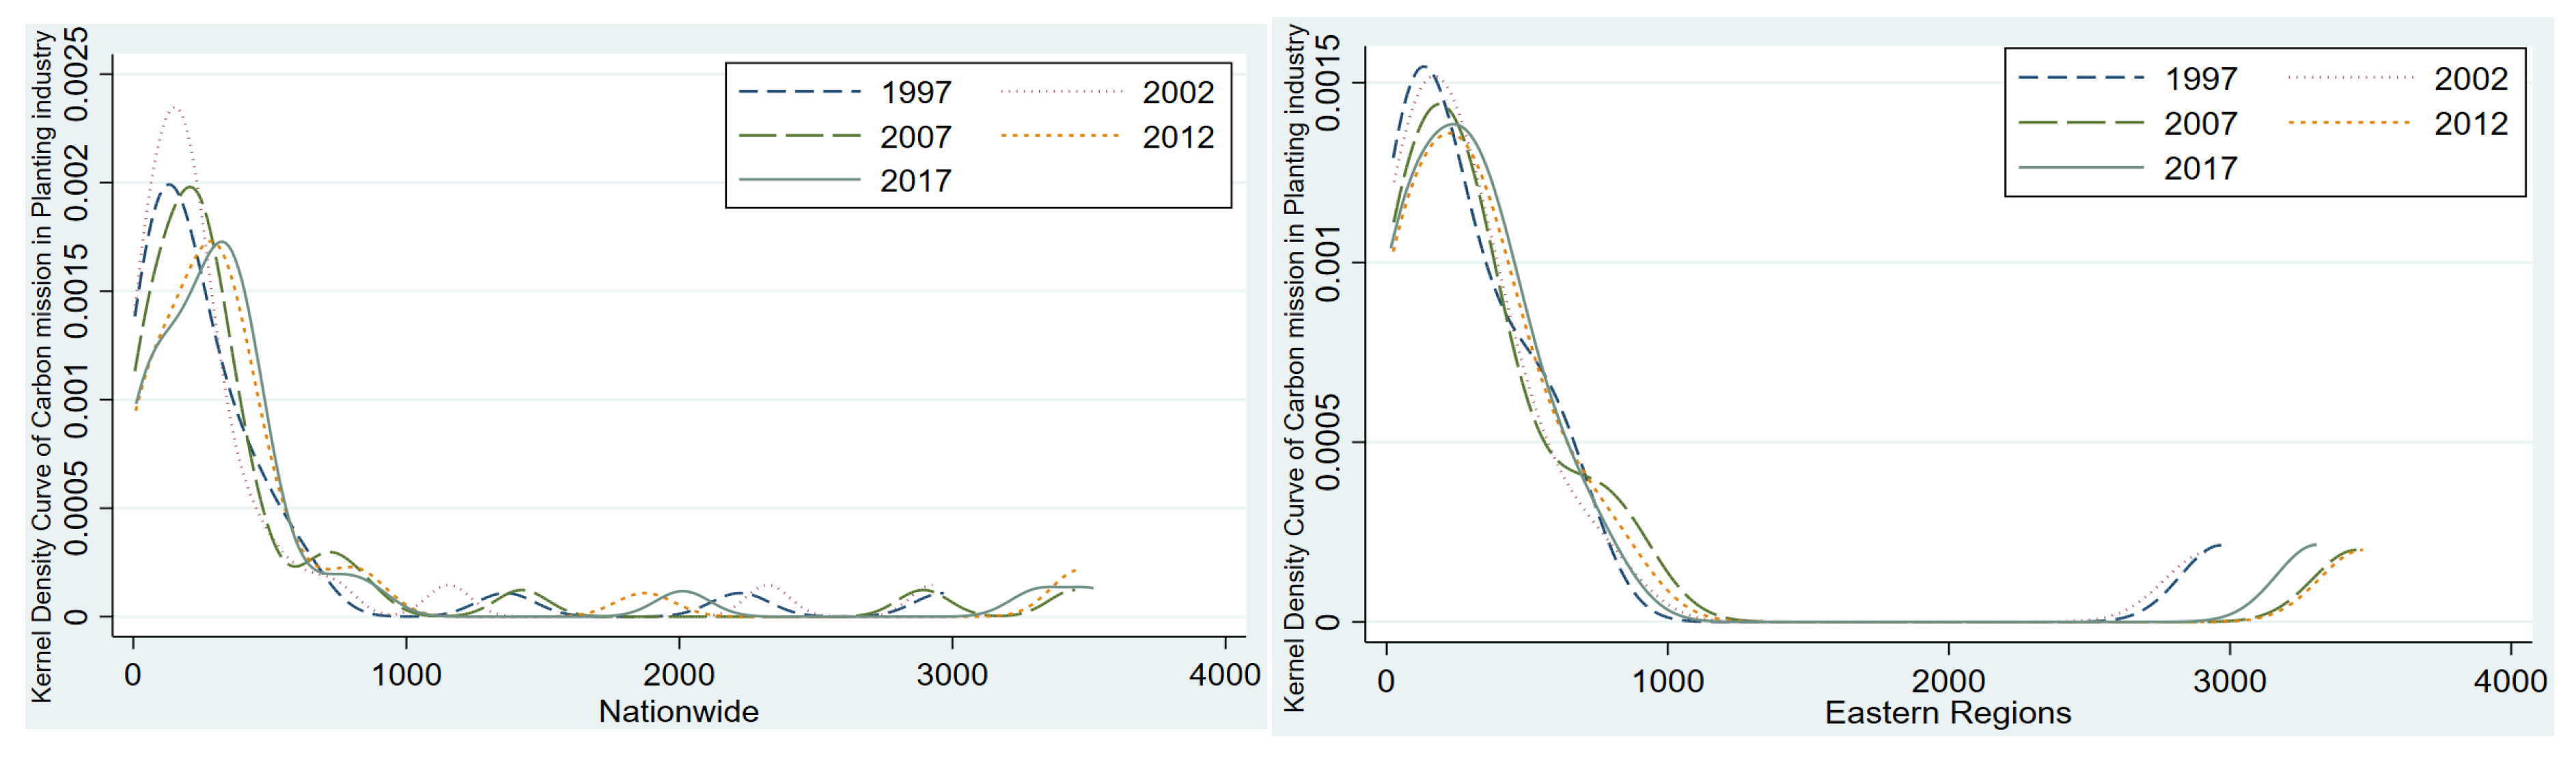
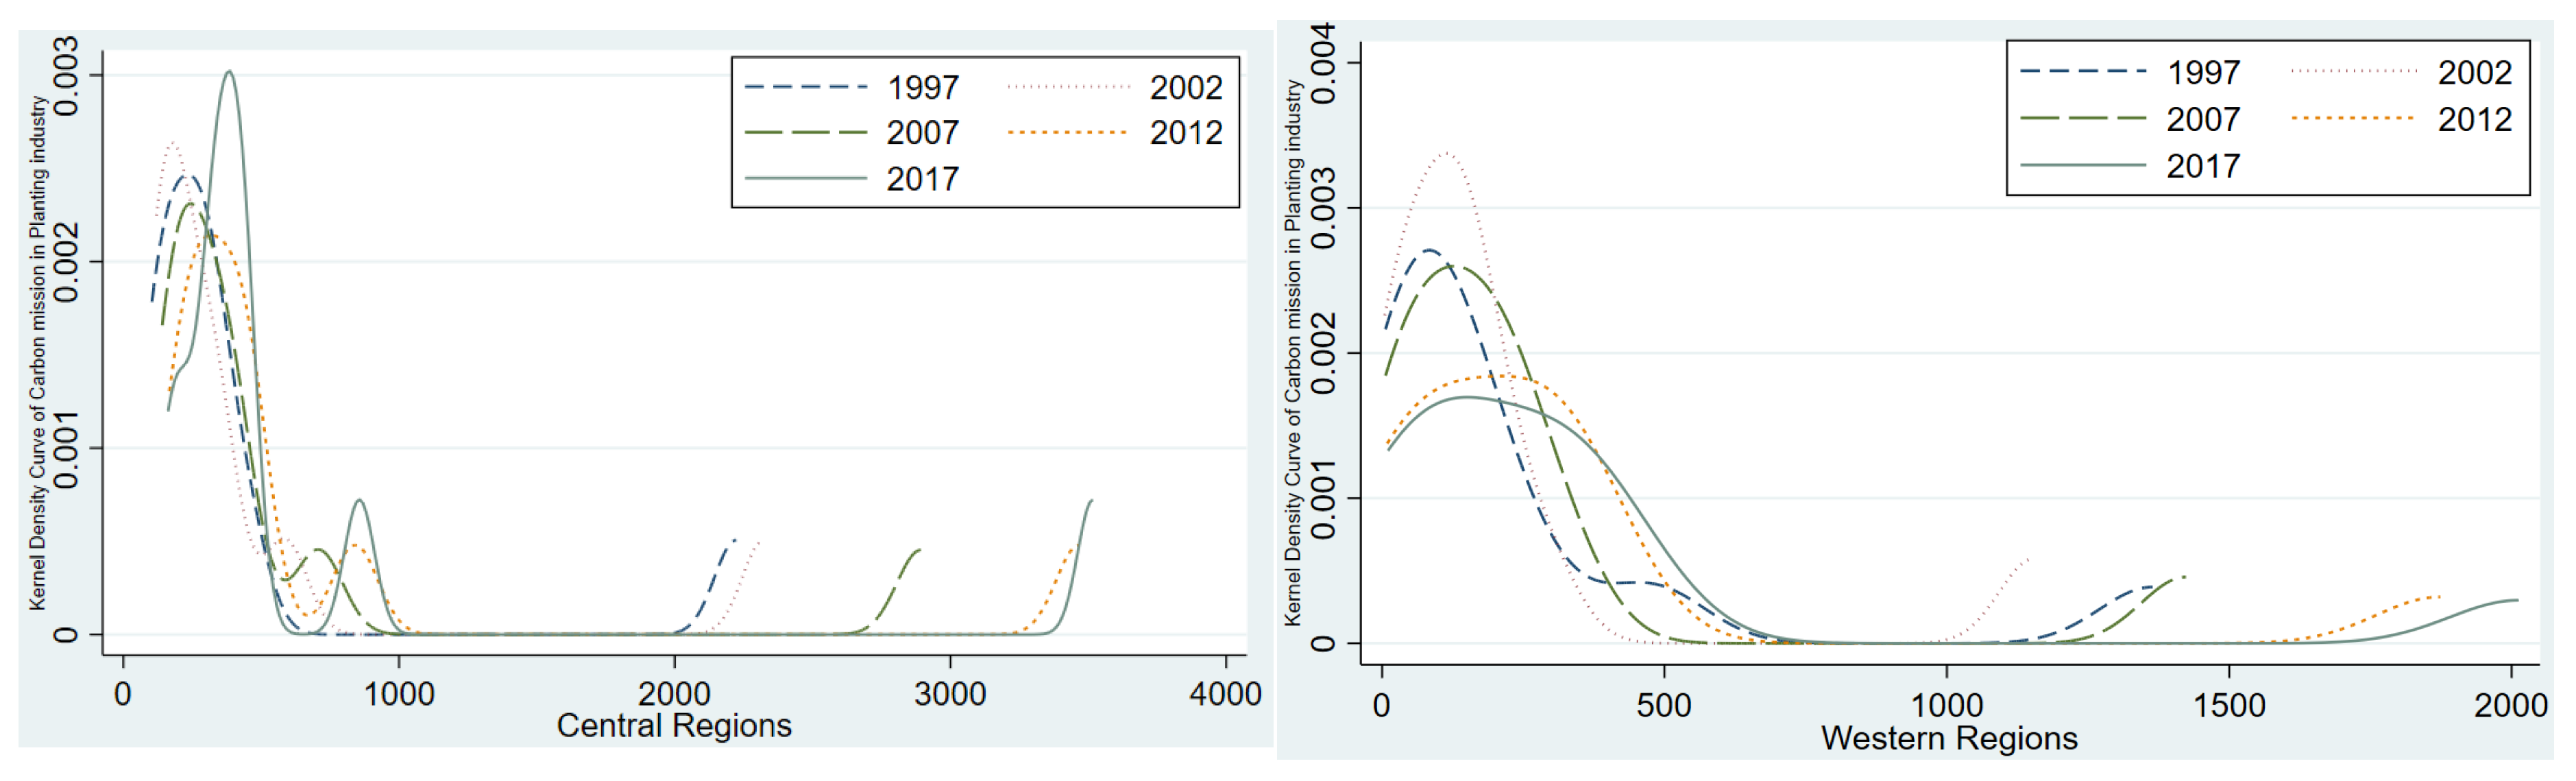
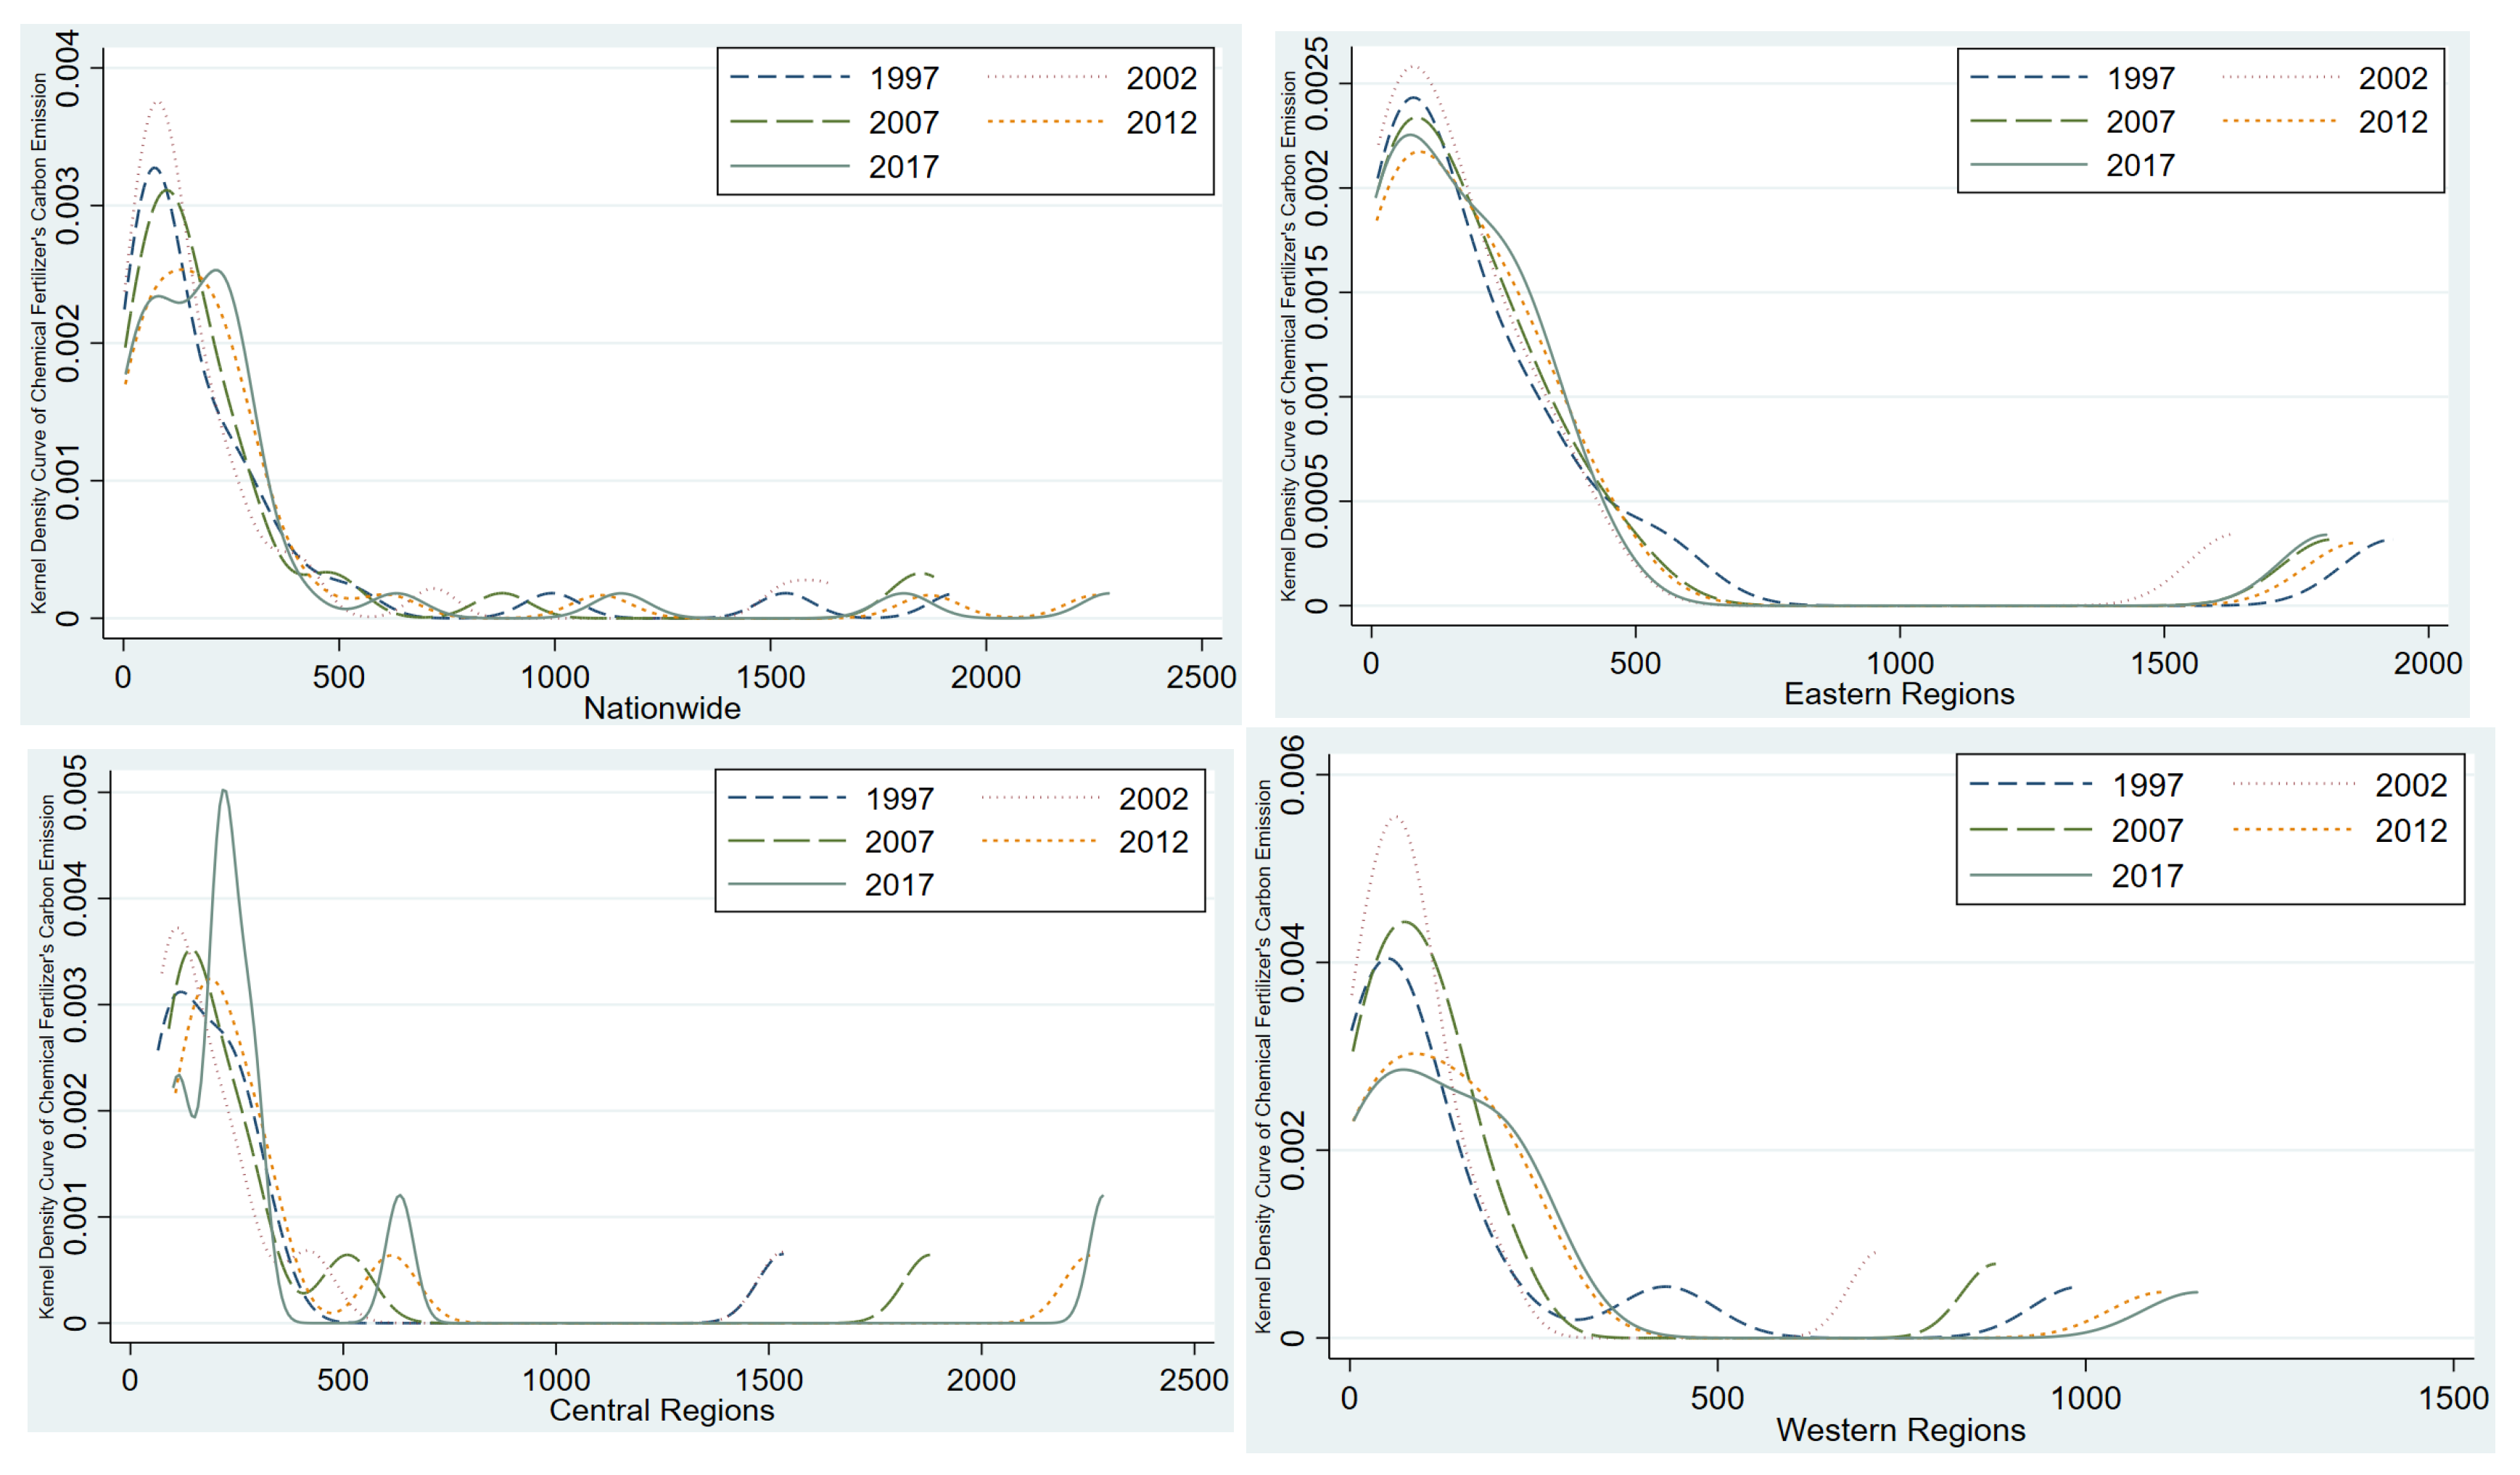
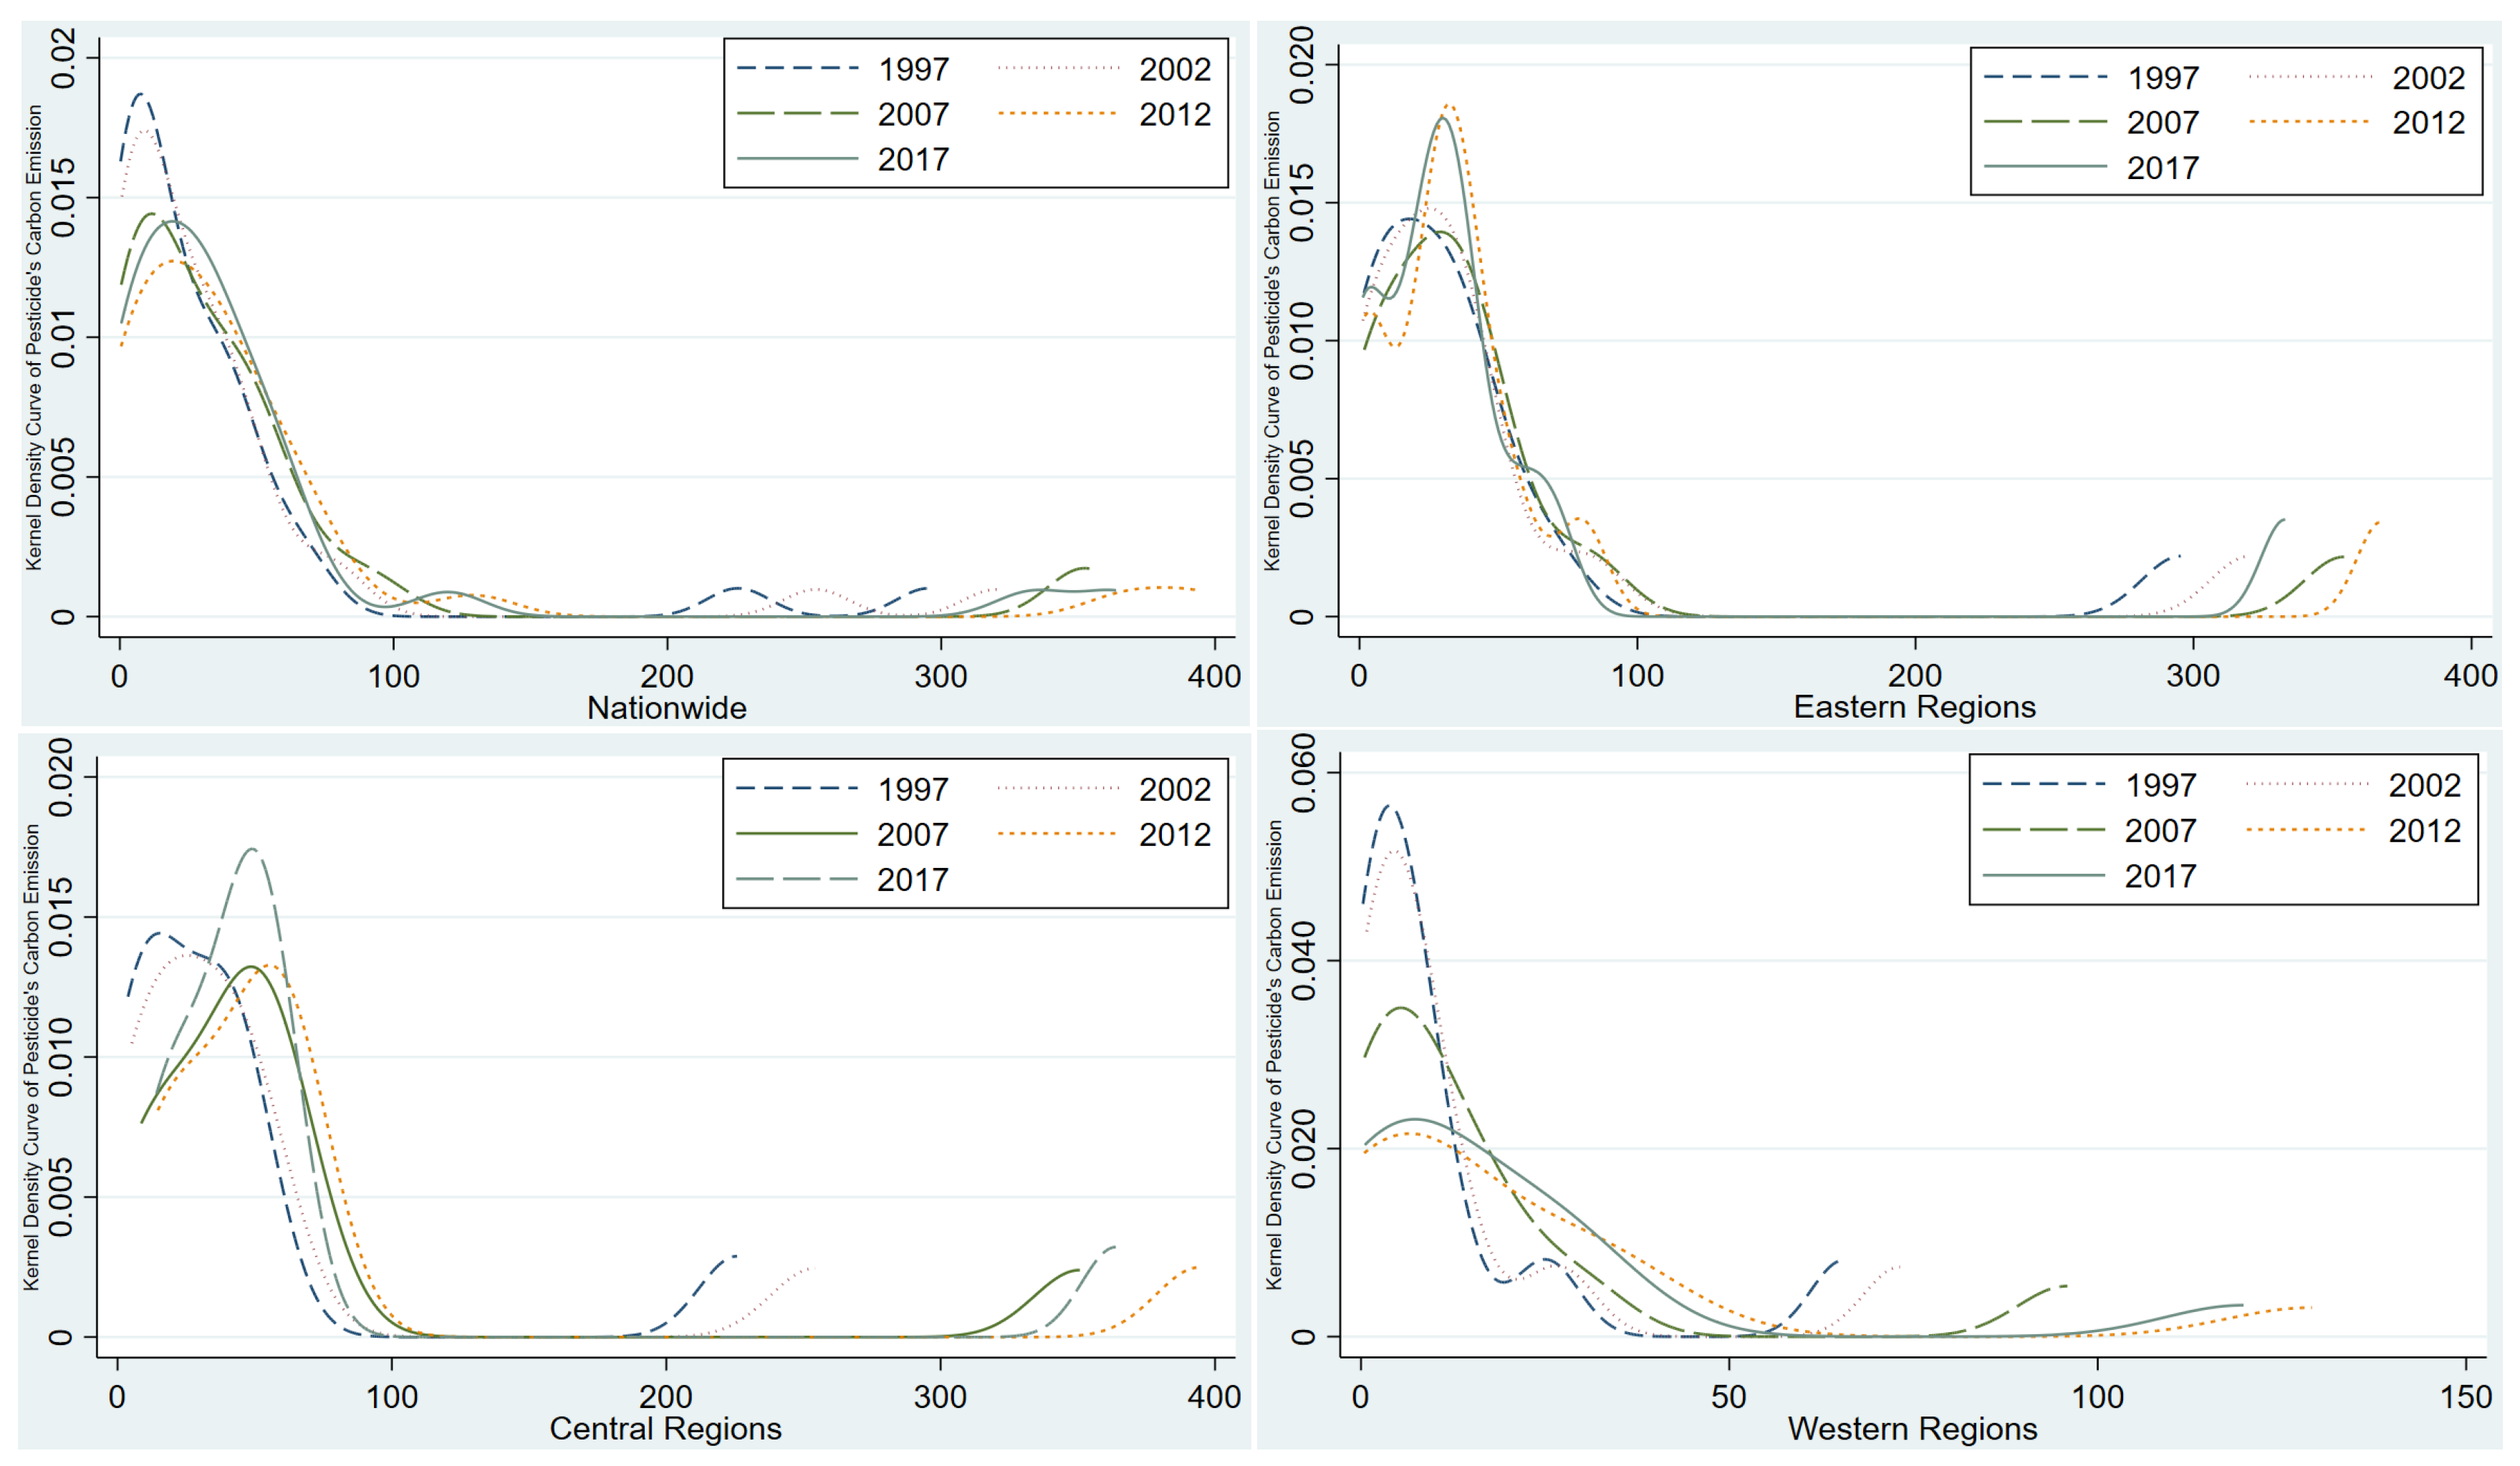
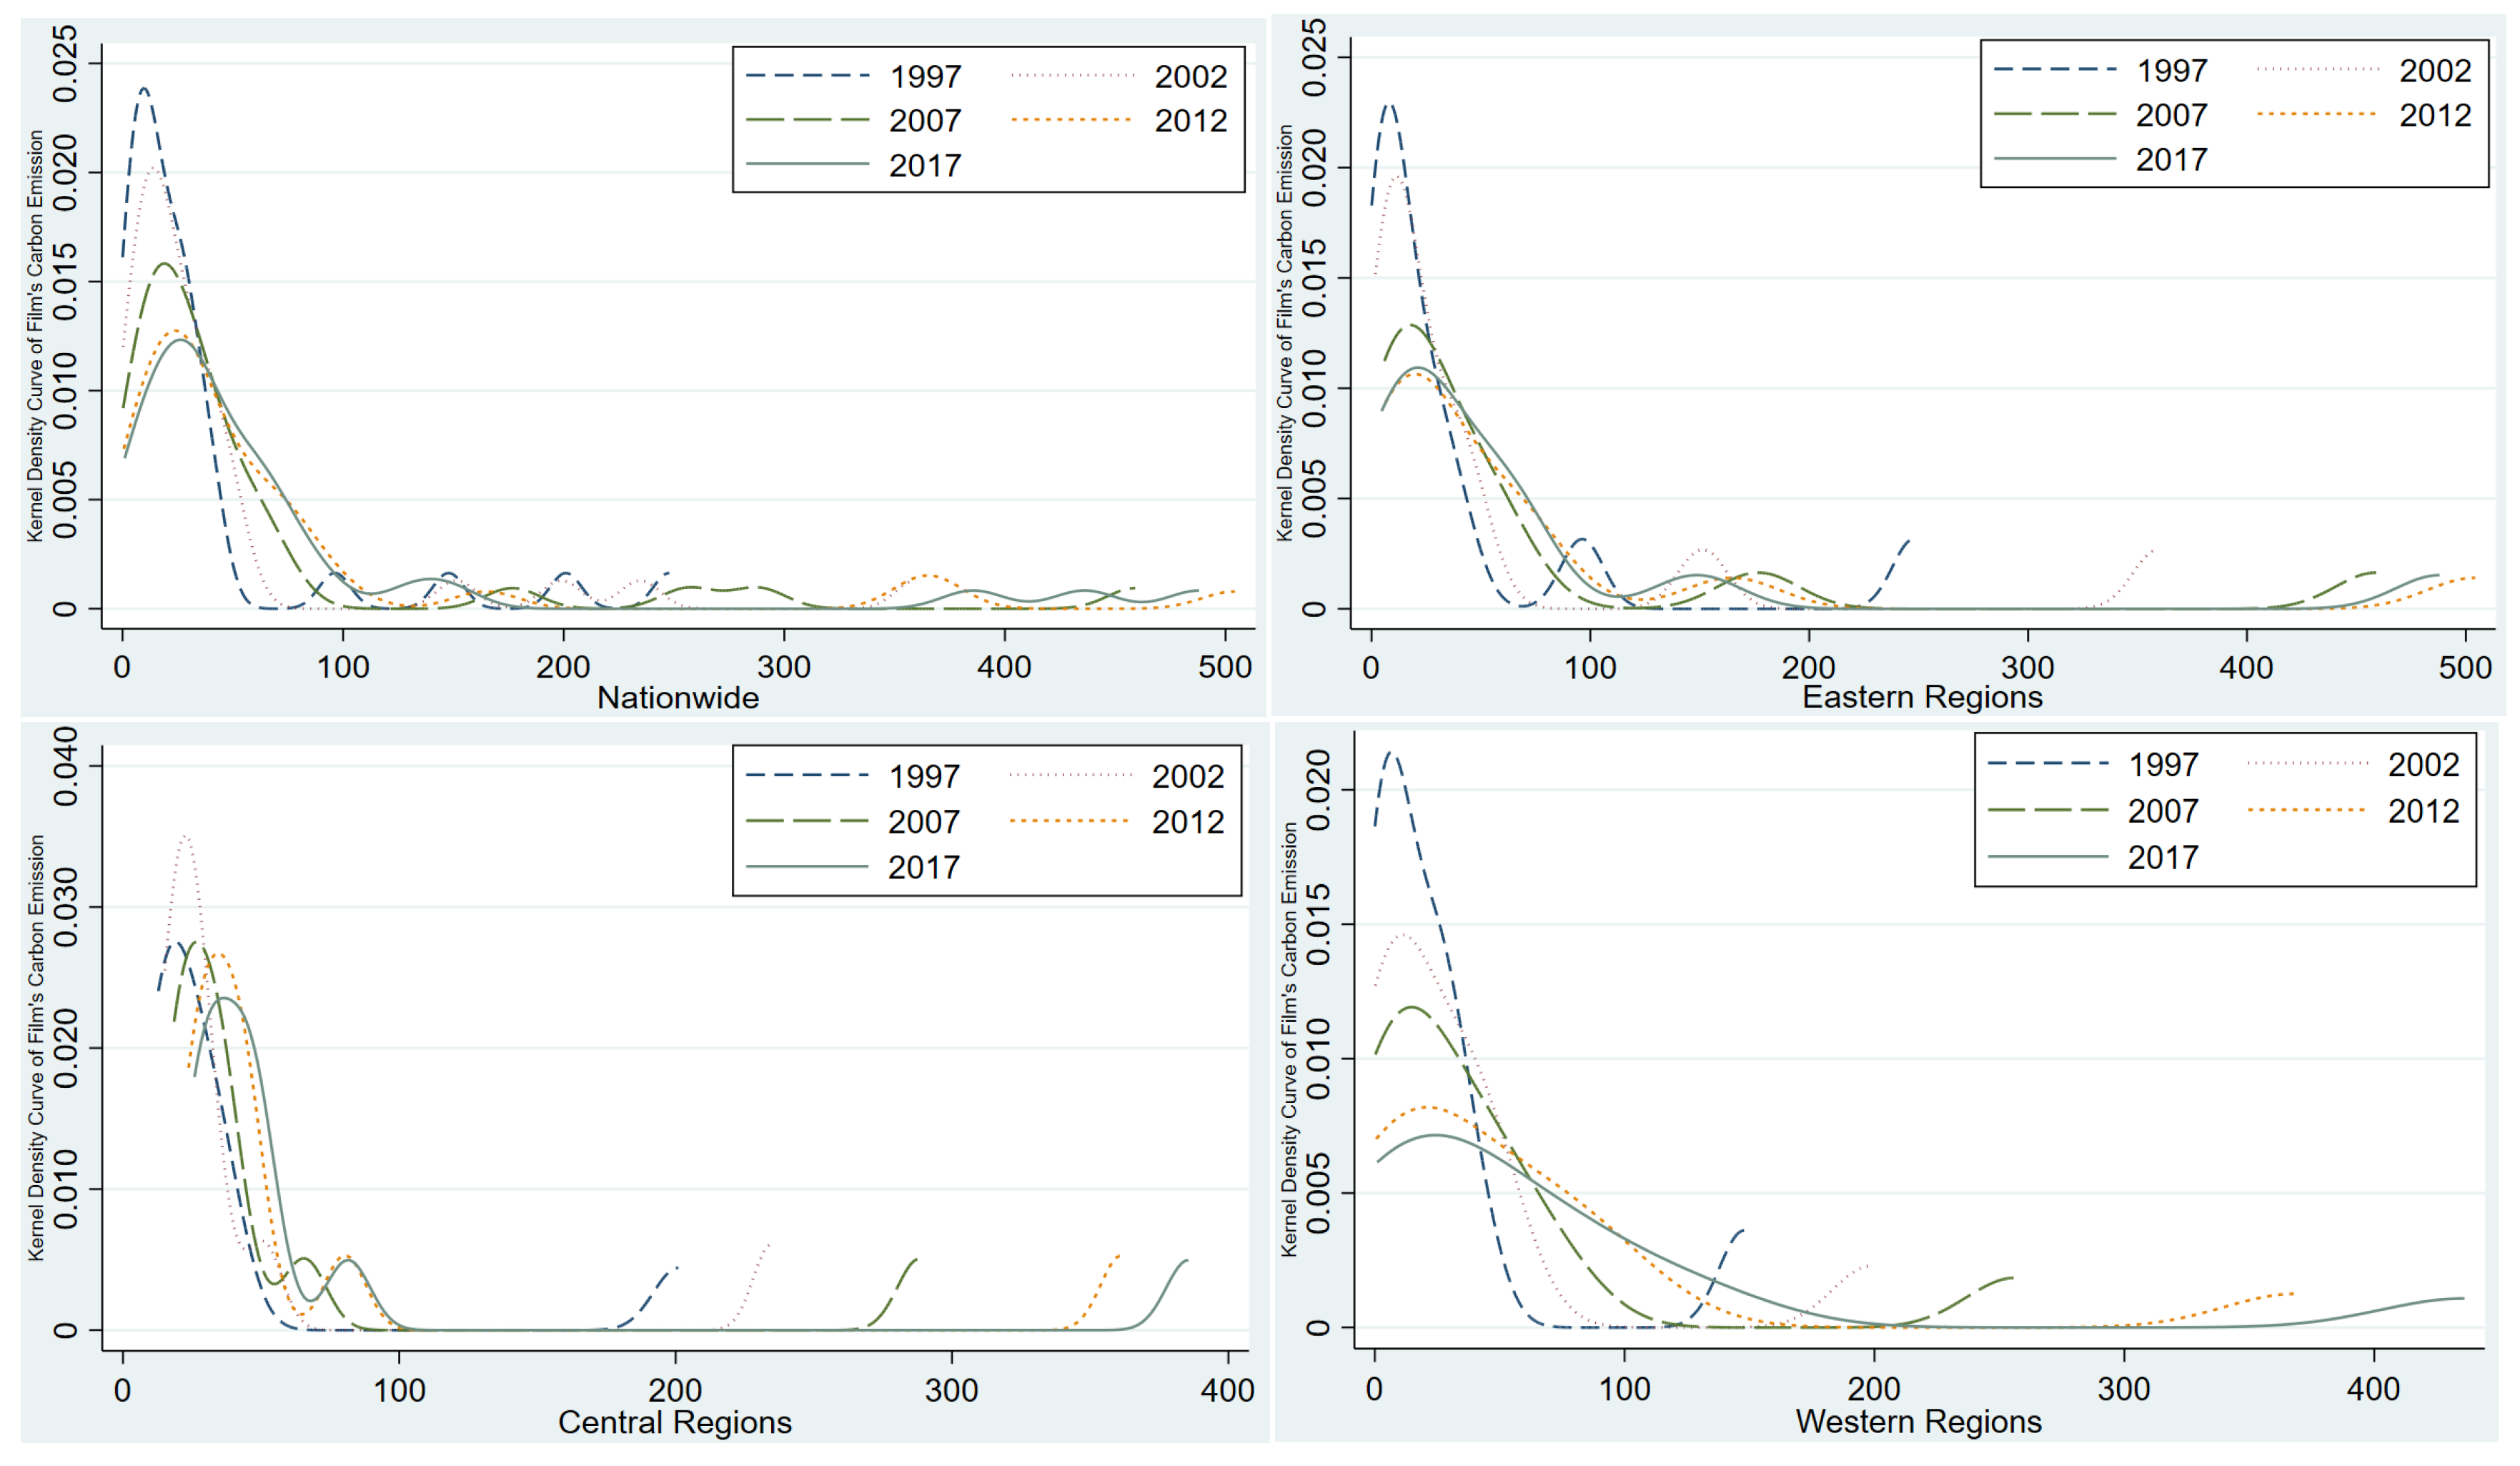
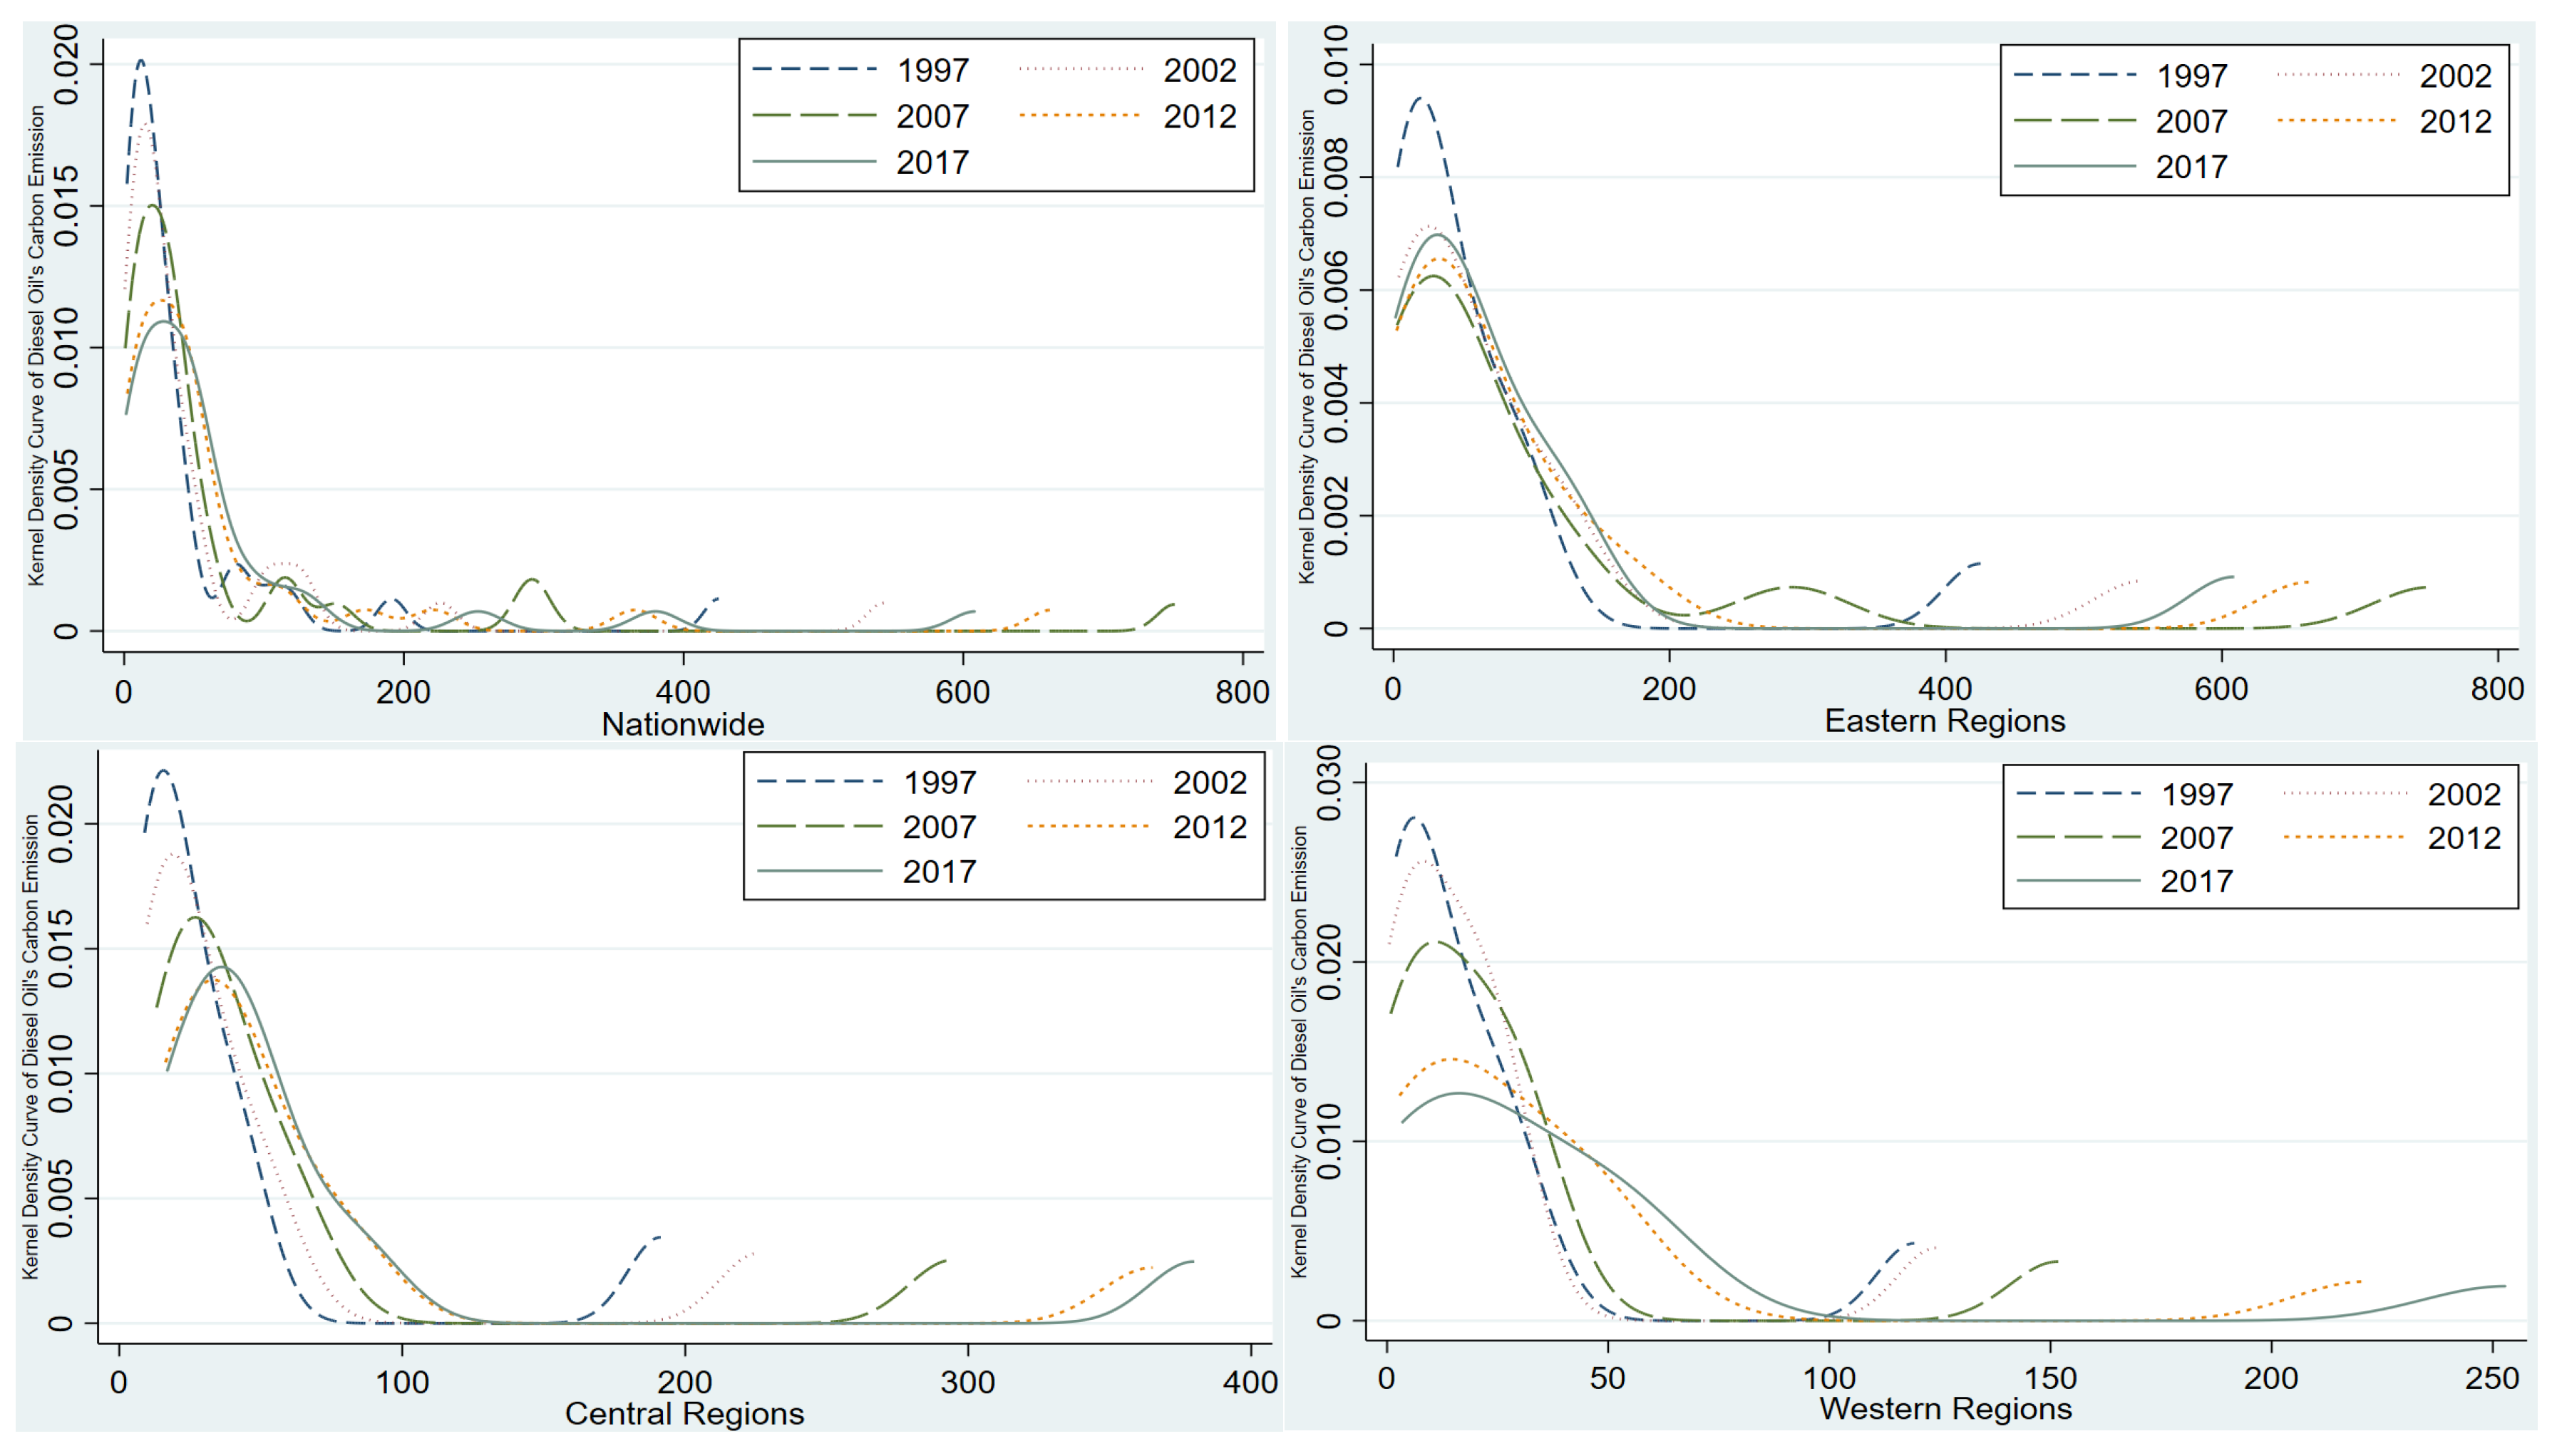
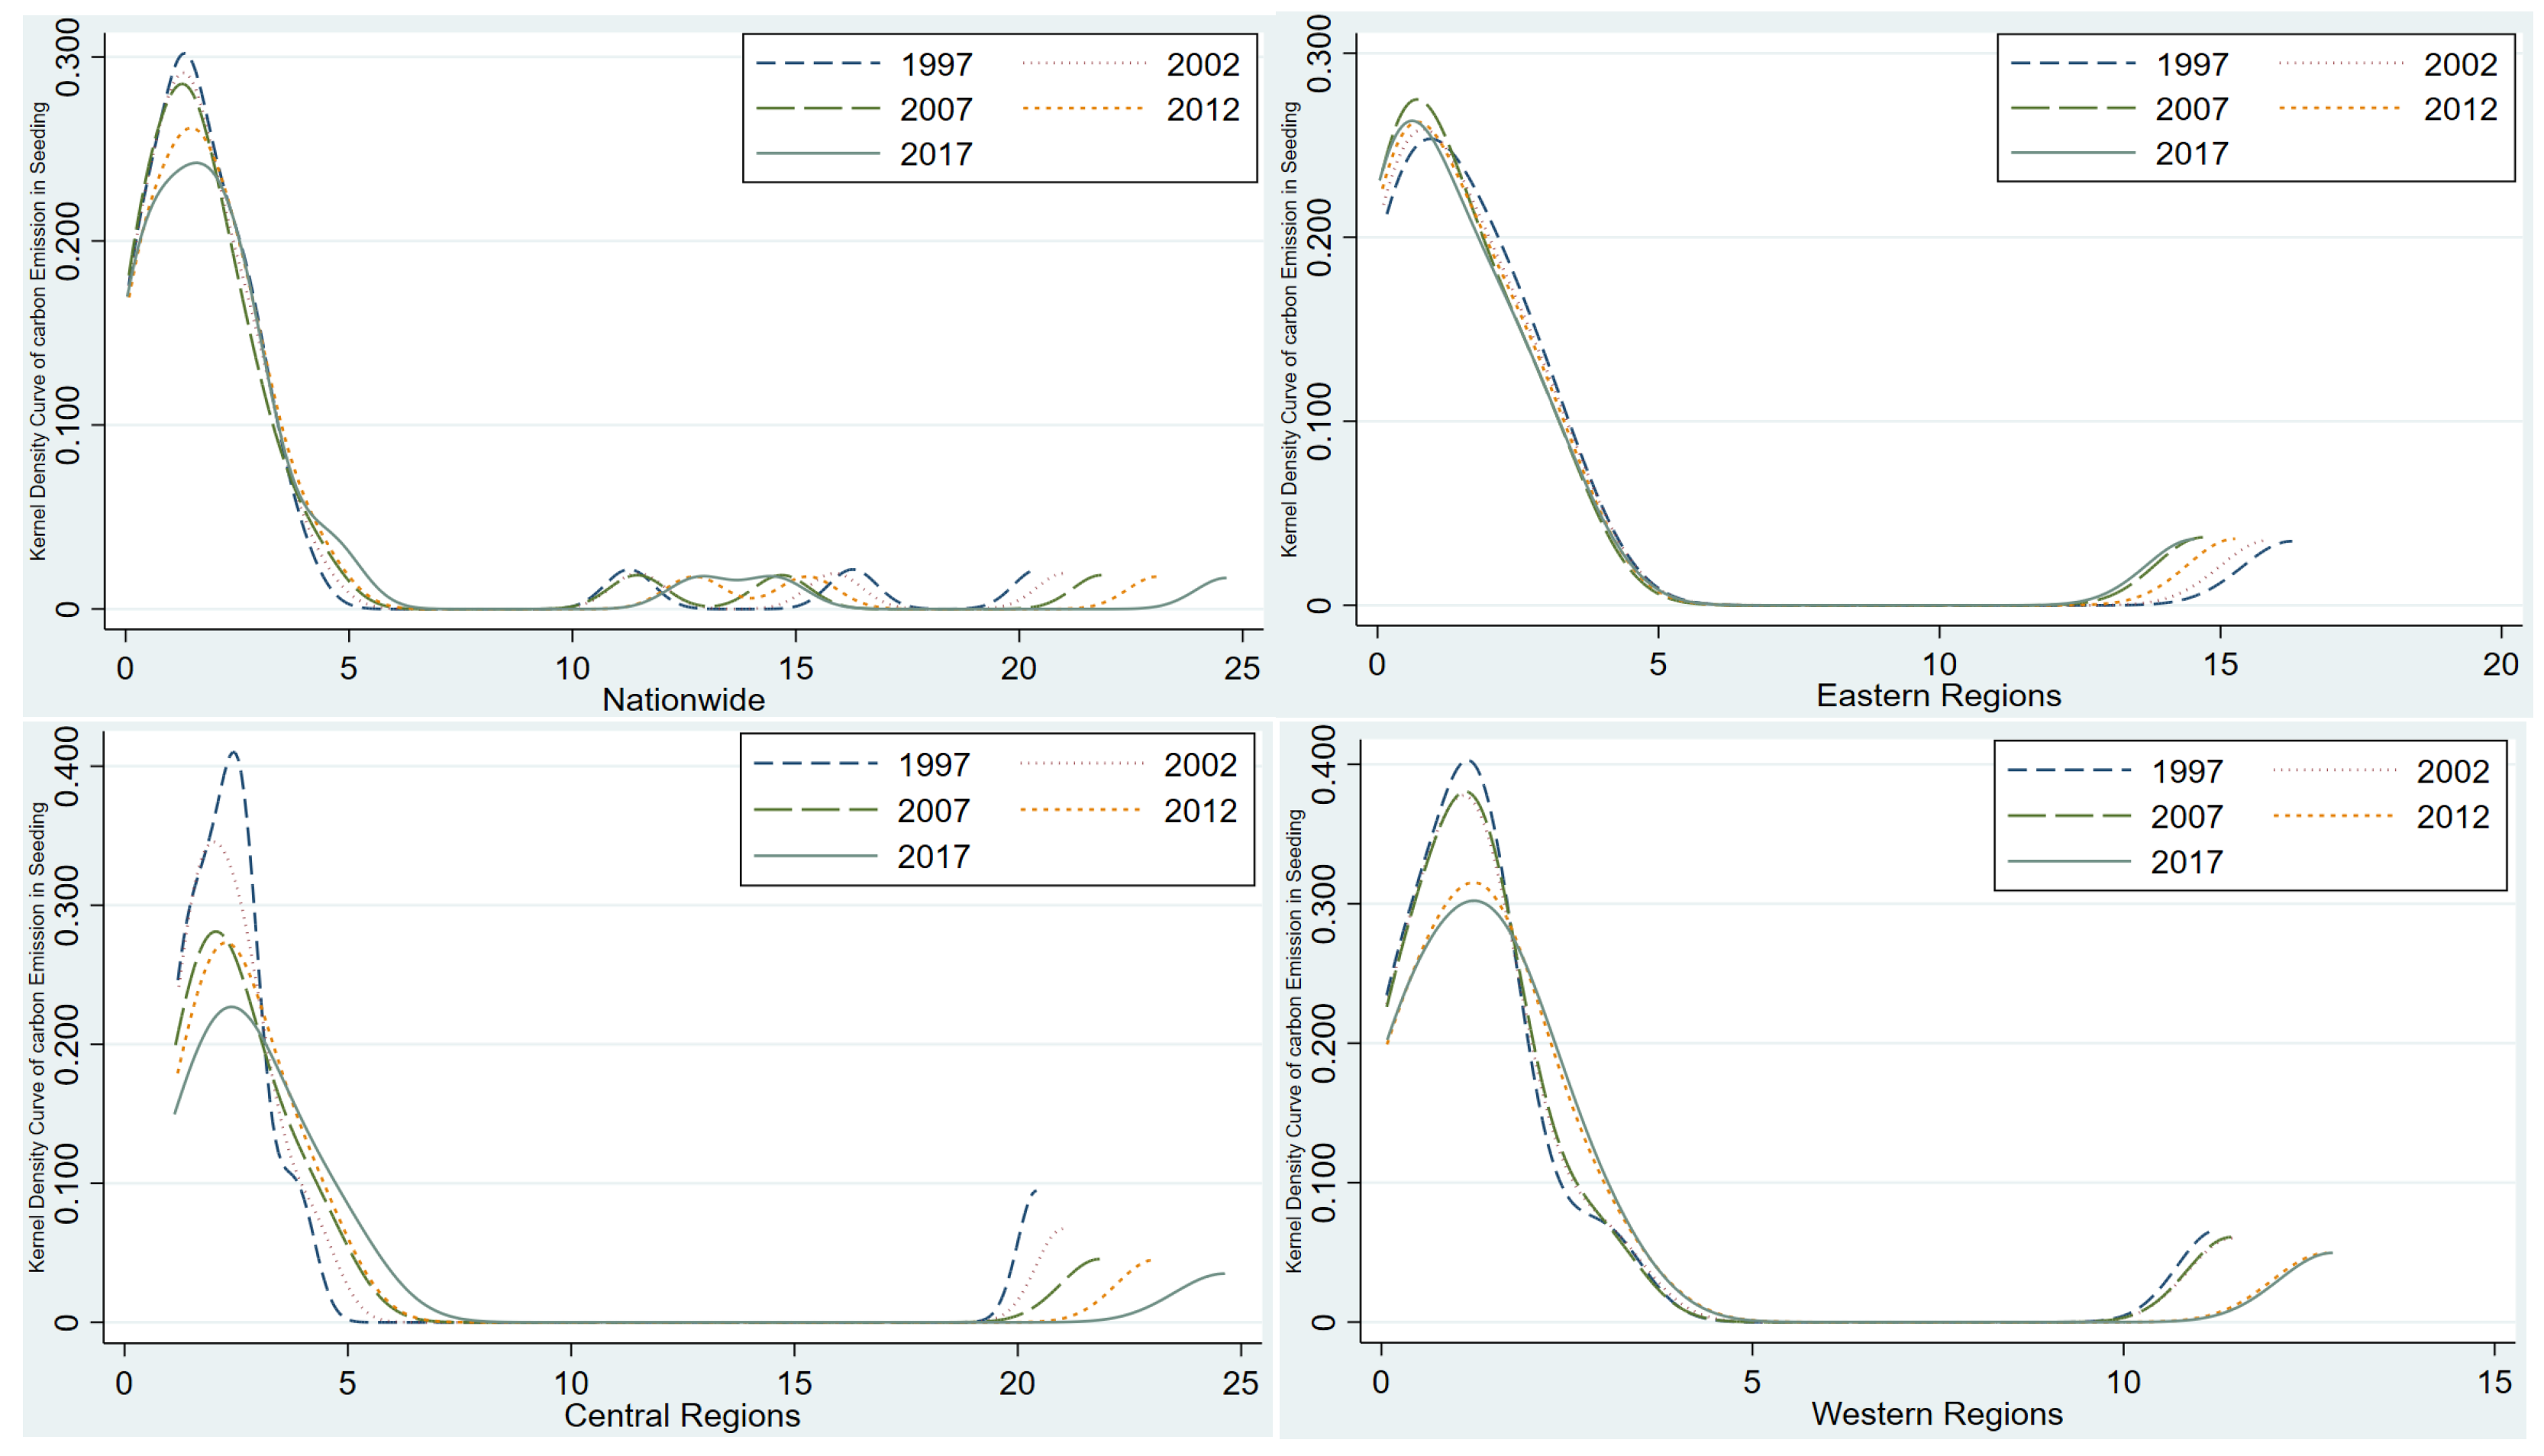
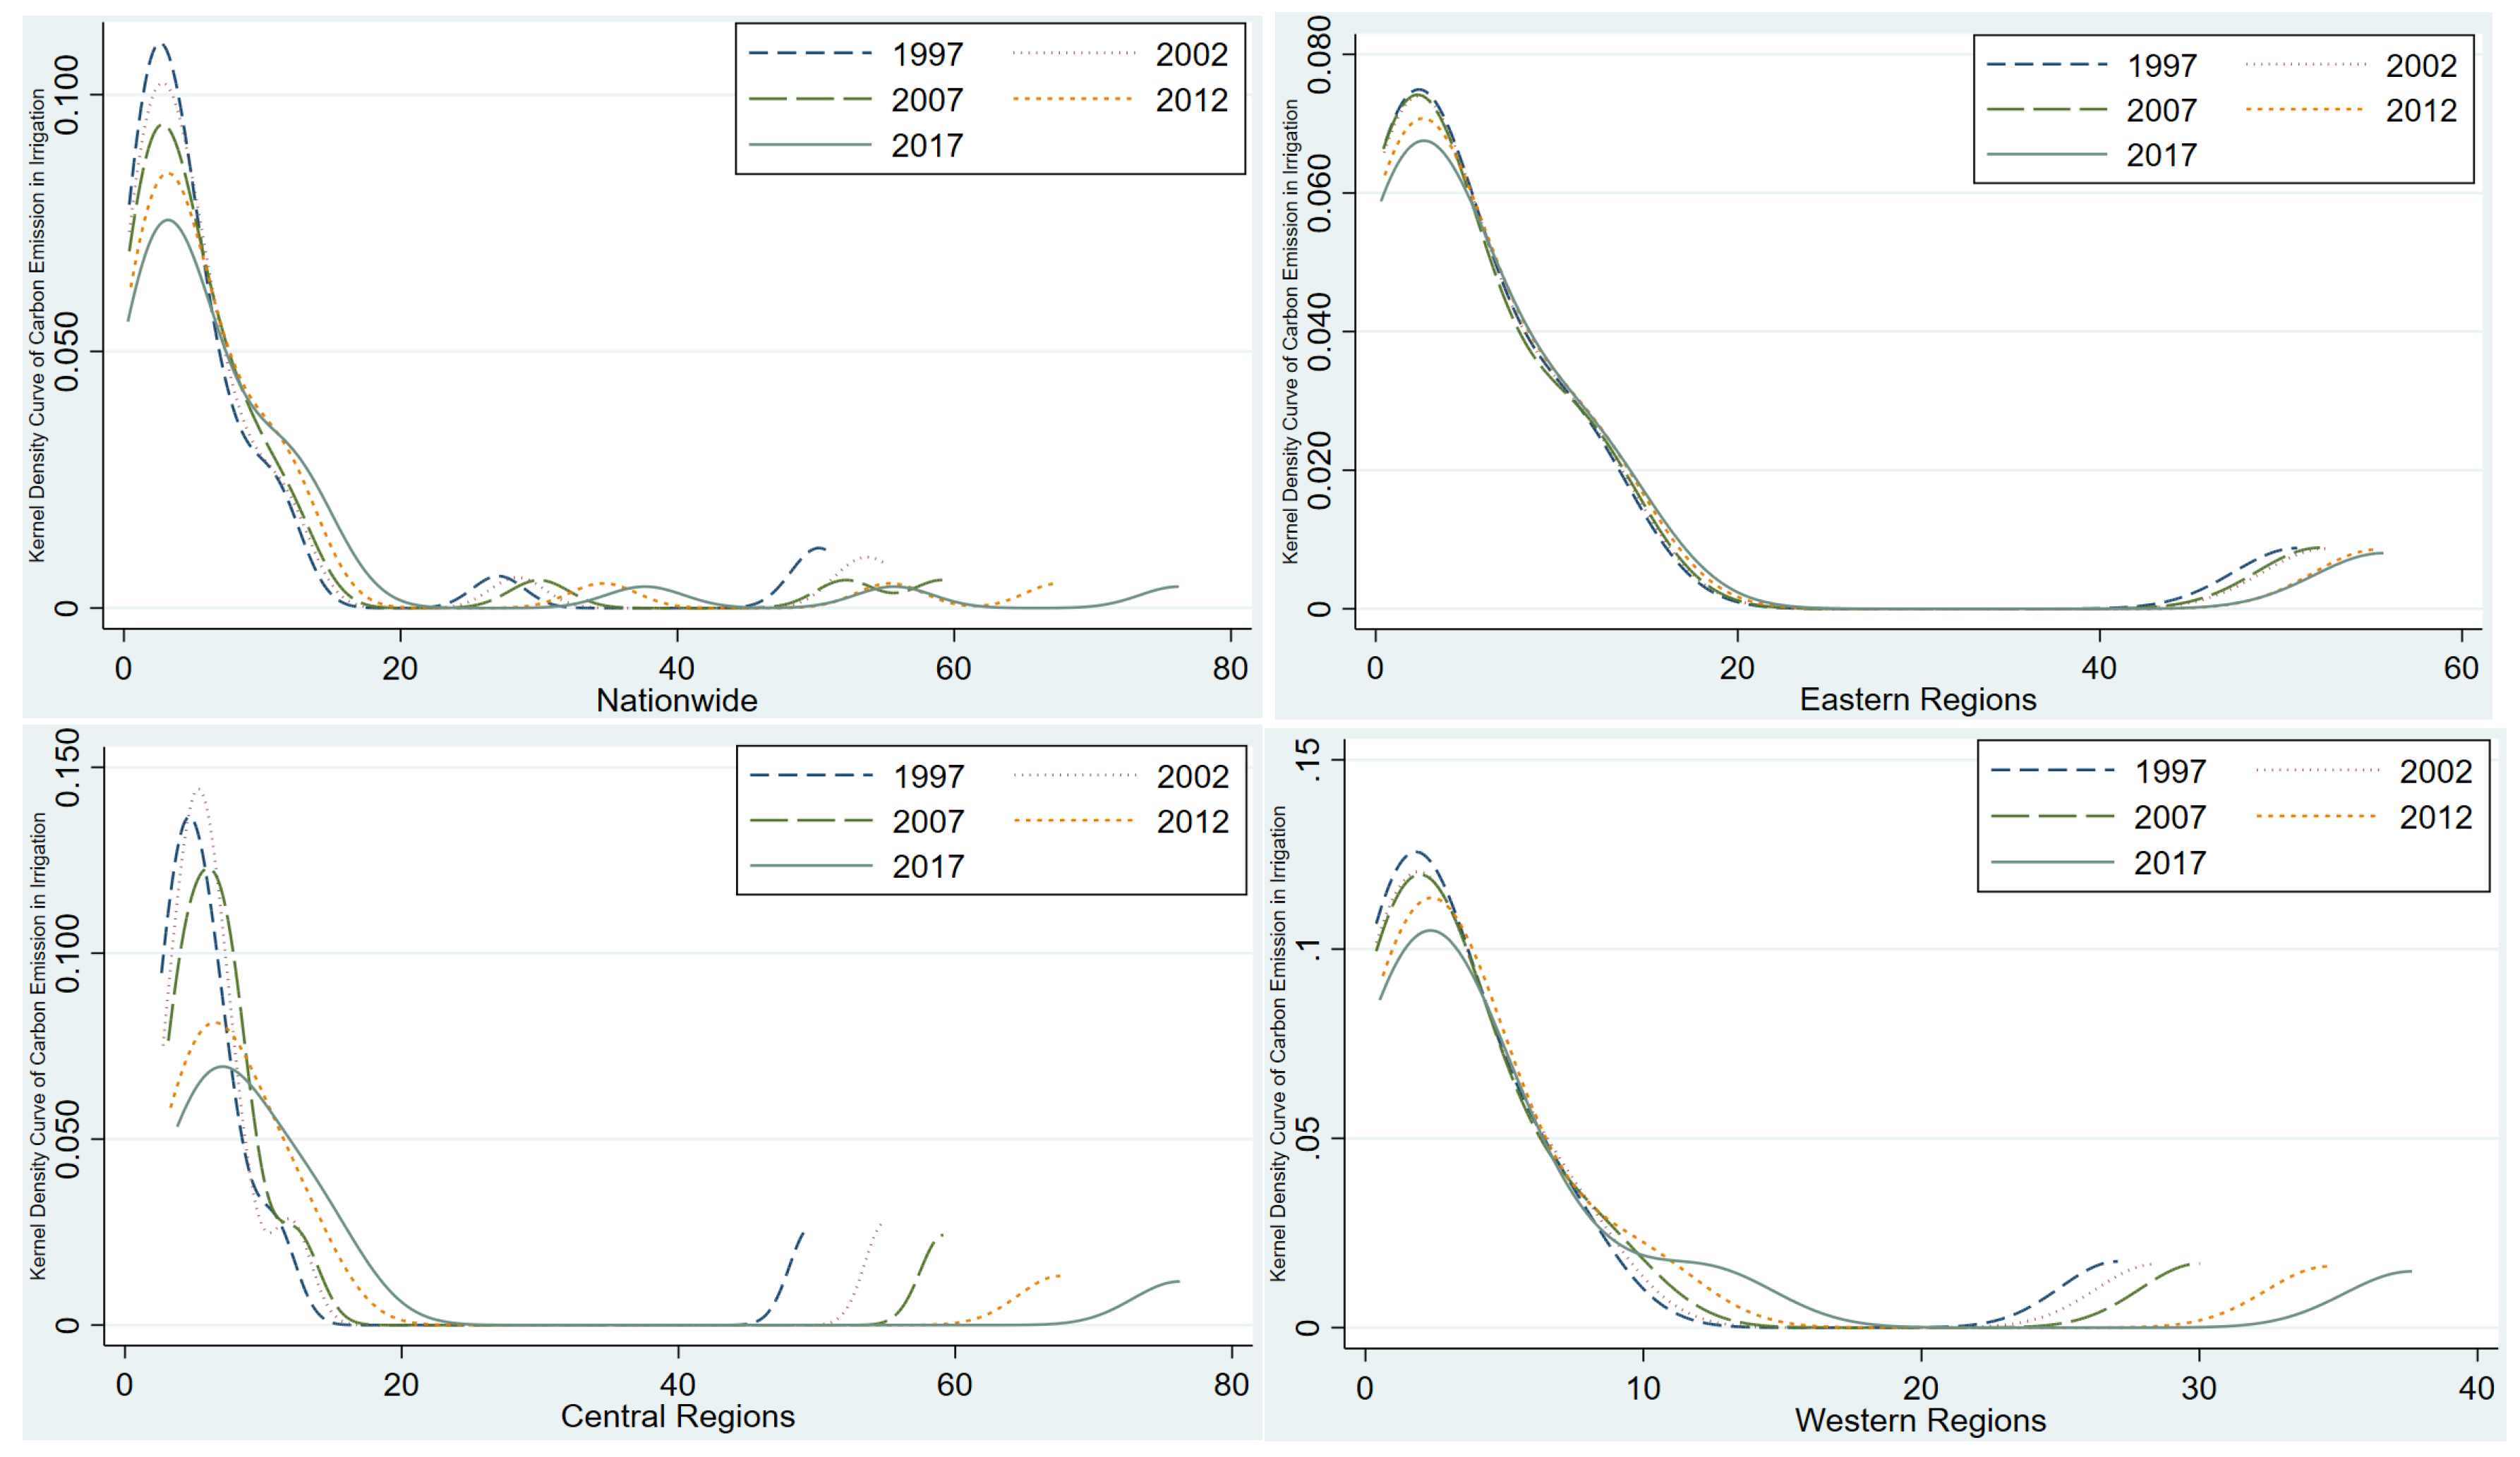
4.2.2. Evolutionary Trends of All Kinds of Carbon Sources’ Carbon Emissions in Agriculture

Figure 2 illustrates the evolutionary process of the planting industry’s carbon emissions from chemical fertilizers in the eastern, central, and western regions of China between 1997 and 2017. It can be seen from Figure 2 and Figure 3 that the evolutionary process of chemical fertilizer’s carbon emissions was fairly similar to that of overall carbon emissions because chemical fertilizers are the largest carbon source in the planting industry. From 1997 to 2017, there was the apparent right-drag phenomenon in the kernel density curves of chemical fertilizer’s carbon emission nationwide. The main peak’s kernel density height “rose at first and then declined”. It shows that there was a distinct increasing trend in the national level of chemical fertilizer’s carbon emissions. There were distinct “multi-peaks” in the kernel density curves of chemical fertilizer’s carbon emissions nationwide and they gradually evolved to “double high peaks” with several “small peaks”. It illustrates the multipolarization distribution in the carbon emissions of chemical fertilizers nationwide, and distinct differences existed which expanded between provinces (including municipalities) with high carbon emissions and provinces (including municipalities) with low carbon emissions.
There was the apparent right-drag phenomenon in the kernel density curves of chemical fertilizer’s carbon emissions in the planting industry of the eastern, central, and western regions, which illustrates distinct differences between provinces (including municipalities) with high chemical fertilizer carbon emissions and provinces (including municipalities) with low chemical fertilizer carbon emissions in the planting industry of China’s eastern, central, and western regions. The right-drag range expanded obviously in the central and western regions while it narrowed apparently in the eastern region. It shows that there was an expanding trend in the differences between provinces (including municipalities) with high chemical fertilizer carbon emissions and provinces (including municipalities) with low chemical fertilizer carbon emissions in the central and western regions, while, in the eastern region, it was the opposite. In the eastern region, chemical fertilizer’s carbon emissions generally evolved to a “single peak” in a stable manner. In the central region, it apparently evolved from a “single peak” to “multi-peak”, and, in the western region, it apparently evolved from a “double peak” to a “single peak”. It illustrates that there were different patterns in carbon emission’s evolution in the eastern, central, and western regions; carbon emission gathering in the eastern region was comparatively stable; there were several gathering areas in the central region; and there was a changing process from double gathering areas to a single gathering area.
Figure 3 illustrates the evolutionary process of the planting industry’s carbon emissions from pesticides in the eastern, central, and western regions of China between 1997 and 2017. The kernel density curves of pesticide’s carbon emissions nationwide had an apparent right-drag phenomenon from 1997 to 2017. Their right-drag range expanded at first and then narrowed, with clear right-moving curve centers and a certain increase in width. The main peak’s kernel density height “went down at first and then went up”, with a clear “multi-peak” and an increasing number of “small peaks” on the right of the curves. It illustrates that the national level of pesticide’s carbon emissions had an obviously increasing trend. Furthermore, the kernel density of pesticide’s carbon emission nationwide shows the multipolarization in pesticide’s carbon emissions nationwide and it tended to gather in provinces (including municipalities) with higher carbon emissions.
There was a distinct right-drag phenomenon in the kernel density curves of pesticide’s carbon emission in the eastern, central, and western regions. Their right-drag range expanded at first and then narrowed. It shows distinct differences which had the tendency to expand at first and then narrowed, between provinces (including municipalities) with high pesticide carbon emissions and provinces (including municipalities) with low pesticide carbon emissions in China’s eastern, central, and western regions. The main peak’s kernel density height in the eastern region generally went up with decreasing curve width, which shows that there was a certain decrease in the regional differences in pesticide’s carbon emissions in the eastern region. The main peak’s kernel density height apparently went down with increasing curve width in the central and western regions, which shows a certain increase in the regional differences in pesticide’s carbon emissions in the central and western regions. It shows that the gradient distribution pattern of pesticide’s carbon emissions in the eastern region was increasingly obvious. The slight “small peaks” on the right of the curves in the central region gradually disappeared, which shows that the gathering trend in pesticide’s carbon emission in the central region was apparent. The trend that evolved from “multi-peak” to “single peak” in the western region illustrates the gathering process from “multipolarization” to “monopolarization” in pesticide’s carbon emissions in the western region.
Figure 4 illustrates the evolutionary process of the planting industry’s carbon emissions from films in the eastern, central, and western regions of China between 1997 and 2017. The kernel density curves of film’s carbon emissions nationwide had an apparent right-drag phenomenon from 1997 to 2017. Their right-drag ranges all expanded at first and then narrowed, with obvious right-moving curve centers and a certain increase in curve width. The main peak’s kernel density height went down year by year with several “small peaks” on the right of the curves. It means that there was a distinctly increasing trend in the national level of film’s carbon emissions, with apparent differences between provinces (including municipalities) with high carbon emissions and provinces (including municipalities) with low carbon emissions. Differences between each province expanded at first and then narrowed, and a tendency to gather in regions with a higher carbon emission level and form multipolarization existed.
There was the distinct right-drag phenomenon in the kernel density curves of film’s carbon emission in the eastern, central, and western regions, which shows distinct differences between provinces (including municipalities) with high film carbon emissions and provinces (including municipalities) with low film carbon emissions in China’s eastern, central, and western regions. The curve centers of the kernel density in the eastern region was slightly right-moving with a general decrease in the main peak’s height, an apparently expansive curve width, and several “small peaks” on the right. It shows a certain increase in regional differences and the carbon emissions of films in the eastern region, and that the pattern of multipolarization had formed. The curve centers of the kernel density in the central region moved to the right apparently and the height of main peak went up at first and then went down. The width of the curves expanded as a whole and distinct “small peaks” gradually formed on the right. It shows that film’s carbon emissions in the central region increased as a whole and regional differences had a tendency that decreased at first and then increased, with a trend of gathering to regions with a higher level of carbon emissions. The curve centers of the kernel density in the western region moved to the right slightly and the height of main peak apparently went down year by year, with a generally expansive curve width. It illustrates the slight increase in film’s carbon emissions in the western region, but there was an expansive trend in regional differences year by year.
Figure 5 illustrates the evolutionary process of the planting industry’s carbon emissions from diesel oil in the eastern, central, and western regions of China between 1997 and 2017. The kernel density curves of diesel oil’s carbon emissions nationwide had an apparent right-drag phenomenon from 1997 to 2017. Their right-drag ranges all experienced the “expanded—narrowed—expanded” trend, with generally right-moving of curve centers and a certain increase in curve width. The main peak’s kernel density height decreased year by year, with several “small peaks” on the right of the curves. It illustrates the obviously increasing trend in the national level of diesel oil’s carbon emissions, with distinct differences between provinces (including municipalities) with high carbon emissions and provinces (including municipalities) with low carbon emissions. Differences between each province experienced the “expanded—narrowed—expanded” trend, exhibiting the apparent phenomenon of gathering in regions with a higher carbon emission level.
There was the distinct right-drag phenomenon in the kernel density curves of diesel oil’s carbon emission in the eastern, central, and western regions, which shows distinct differences between provinces (including municipalities) with high diesel oil carbon emissions in seeding and provinces (including municipalities) with low diesel oil carbon emissions in seeding in China’s eastern, central, and western regions. The curve centers of the kernel density in the eastern region slightly moved to the right, and the height of the main peak decreased at first and then increased. Meanwhile, the width of the curve expanded in some way, and “small peaks” on the right turned up at first and then disappeared. It illustrates that there was a certain increase in diesel oil’s carbon emissions in the eastern region, and regional differences increased at first and then decreased with dynamic changes from “single peak” to “double-peak” to “single peak”. The curve centers of the kernel density in the central region apparently moved to the right, and the height of the main peak went down at first and then rose with a generally expansive curve width. It shows that there was a general increase in diesel oil’s carbon emissions in the central region, and there was a tendency of regional differences to increase at first and then decrease, without the trend of multipolarization. The curve centers of the kernel density in the western region moved to the right slightly, and the height of the main peak went down year by year apparently with a generally expansive curve width. It illustrates that there was not a large increase in the total diesel oil carbon emissions in the western region but there was a distinct increase in regional differences.
Figure 6 illustrates the evolutionary process of the planting industry’s carbon emissions from seeding in the eastern, central, and western regions of China between 1997 and 2017. The kernel density curves of carbon emission nationwide in seeding had the apparent right-drag phenomenon from 1997 to 2017. Their right-drag ranges all expanded year by year with slightly right-moving curve centers and a basically unchanged curve width. The main peak’s kernel density height went down year by year, with several “small peaks” on the right of the curves. It illustrates a slight increase in the national level of carbon emissions in seeding, and there were distinct differences between provinces (including municipalities) with high carbon emissions and provinces (including municipalities) with low carbon emissions. Differences between each province kept expanding, exhibiting the apparent phenomenon of gathering in regions with a higher carbon emission level. Also, it had the comparatively apparent multipolarization.
There was the distinct right-drag phenomenon in the kernel density curves of carbon emissions in seeding in the eastern, central, and western regions, which shows distinct differences between provinces (including municipalities) with high carbon emissions in seeding and provinces (including municipalities) with low carbon emissions in seeding in China’s eastern, central, and western regions. The curve centers of the kernel density in the eastern region moved to the left slightly with a generally rising main peak height and basically unchanged curve width. It illustrates that the carbon emissions of seeding and regional differences reduced to a certain extent, which has certain correlations with the more developed economy in the eastern region, comparatively high level of technologies in the planting industry, and comparatively narrowed scales. The curve centers of the kernel density in the central region were basically unchanged with a decreased main peak height year by year and slightly expanded width. It shows that there was not a large change in the general carbon emissions of seeding in the central region, whereas there was a tendency to expand in regional differences, which has certain correlations with the imbalanced development level of the planting industry in each province (including municipality) in the central region. As for the western region, kernel density curve centers generally moved to the right slightly and the main peak’s height apparently decreased year by year, with a generally expansive curve width. It shows that there was a certain increase in the total carbon emissions of seeding in the western region, with a comparatively clear increasing trend in regional differences.
Figure 7 illustrates the evolutionary process of the planting industry’s carbon emissions from irrigation in the eastern, central, and western regions of China between 1997 and 2017. The kernel density curves of carbon emissions in irrigation nationwide had an apparent right-drag phenomenon from 1997 to 2017. The right-drag range expanded year by year, with basically unchanged curve centers and curve width. Meanwhile, the height of the kernel density’s main peaks decreased year by year with several “small peaks” on the right of the curves. It shows that there was not a large change range in the national level of irrigation’s carbon emissions. There were distinct differences, which kept expanding, between provinces (including municipalities) with high carbon emissions and provinces (including municipalities) with low carbon emissions, forming the comparatively apparent multipolarization.
There was the distinct right-drag phenomenon in the kernel density curves of carbon emissions in irrigation in the eastern, central, and western regions, which shows distinct differences between provinces (including municipalities) with high carbon emissions in seeding and provinces (including municipalities) with low carbon emissions in irrigation in China’s eastern, central, and western regions. In the eastern region, the kernel density’s curve centers and width were basically unchanged and the height of the main peak went down as a whole, which shows that the carbon emissions of irrigation in the eastern region were basically unchanged but regional differences increased in some way. The centers of the kernel density curves in the central region apparently moved to the right and the height of the main peak declined year by year with a slightly expansive curve width. It illustrates that there was an expansive trend in the carbon emissions of irrigation and regional differences in the central region. As for the western region, the kernel density’s curve centers and width were basically unchanged, with a clear decrease year by year in the height of the main peak. It shows that there was not a large change in the total carbon emissions of irrigation in the western region, while there was an obviously increasing trend in regional differences. Furthermore, slight “small peaks” turned up on the right of the kernel density curves of irrigation’s carbon emissions in the western region in 2017, which means there was a tendency to change from “monopolarization” to “dual polarization” in irrigation in the western region.

5. Discussion

5.1. Thoughts on the Evolutionary Trends of Carbon Emissions in the Planting Industry and the Adaptability of Policies

This paper deeply analyzes the evolutionary trends of carbon emissions in China’s planting industry and finds that they show a complex situation in terms of total quantity and regional distribution. This trend poses challenges to the adaptability of existing policies and also indicates the direction for policy optimization.
From the perspective of total quantity change, the carbon emissions of the planting industry reached their peak in 2015 and then began to decline, but the overall emission reduction situation remains severe. This shows that, although the current emission reduction policies have achieved certain results, continuous enhancement is still needed. In terms of policy-making, more investment should be made in the research and development of agricultural green technologies. It is important to encourage cooperation between scientific research institutions and enterprises to develop more efficient and environmentally friendly agricultural production technologies, such as new fertilizers, low-toxicity pesticides, and intelligent irrigation systems, to reduce carbon emissions at the source. At the same time, it is also essential to establish a long-term policy support mechanism to provide incentives such as subsidies and tax preferences to farmers and agricultural enterprises that adopt low-carbon production technologies, and boost their enthusiasm for participating in emission reduction.
In terms of regional distribution, there are significant differences in the evolutionary trends of carbon emissions in the planting industry among the eastern, central, and western regions. The emissions of some carbon sources in the eastern and western regions tend to be monopolar, while the central region shows a multipolar trend. This difference means that a unified policy would make it difficult to meet the actual needs of different regions. For the eastern region, due to its developed economy and strong scientific and technological strength, policies should focus on guiding the upgrading of the agricultural industry, encouraging the development of high-value-added and low-carbon precision agriculture and smart agriculture. It is important to improve resource utilization efficiency through technological innovation to reduce carbon emissions. As the main agricultural production area, the central region has a large planting scale and diverse carbon emission sources. Policies should focus on integrating regional resources, strengthening agricultural infrastructure construction, and promoting standardized low-carbon planting models to improve the overall emission reduction effect. The western region lags behind in agricultural development and has a fragile ecological environment. Based on increasing financial and technical support, policies should prioritize the development of eco-friendly agriculture, such as ecological planting and water-saving agriculture, to achieve coordinated progress in agricultural development and ecological protection.
In addition, the implementation of policies also needs to consider the acceptance level and practical operation difficulties of farmers in different regions. First, we need to strengthen the training and education of farmers, and improve their awareness and skills of low-carbon agriculture, so that policies can be better implemented. Second, we need to establish an inter-regional policy coordination mechanism to promote the exchange of experiences and cooperation in the field of emission reduction in the planting industry among the eastern, central, and western regions, and jointly address the carbon emission challenge to promote the low-carbon development of the national planting industry.

5.2. Thoughts on the Differences in Carbon Source Contributions and Targeted Emission Reduction Strategies

This paper clarifies the differences in the contributions of different carbon sources to carbon emissions in the planting industry. Chemical fertilizers contribute the most, followed by diesel, agricultural films, and pesticides. This difference provides a key basis for formulating more targeted emission reduction strategies.
For chemical fertilizers, the main carbon source, strict control measures should be implemented. On the one hand, we need to strengthen the supervision of the production and sales of chemical fertilizers, control the total amount of chemical fertilizers, and improve the quality standards of chemical fertilizers to reduce the entry of highly polluting and high-emission chemical fertilizer products into the market. On the other hand, we need to increase the promotion of chemical fertilizer reduction and substitution technologies, and encourage farmers to use alternative products such as organic fertilizers and bio-fertilizers. The government can reduce the use cost of alternative products through subsidies, and, at the same time, carry out technical training to enable farmers to master scientific fertilization methods, improve fertilizer utilization efficiency, and reduce chemical fertilizer waste and carbon emissions.
For other important carbon sources such as diesel, agricultural films, and pesticides, corresponding targeted strategies are also needed. In terms of diesel use, it is significant to promote energy-saving agricultural machinery, encourage agricultural producers to update old equipment, and improve the energy utilization efficiency of agricultural mechanization. At the same time, it is also important to increase the research, development, and promotion of the application of clean energy in the field of agricultural machinery, such as in the development of electric agricultural machinery, to reduce carbon emissions caused by diesel consumption. Regarding agricultural films, measures need to be taken to develop and promote degradable agricultural films, strengthen the management of the use and recycling of agricultural films to avoid soil pollution caused by agricultural film residues, and at the same time reduce the carbon emissions generated during the production and treatment of traditional agricultural films. For pesticides, we need to strengthen the construction of pest and disease monitoring and early warning systems, and promote green prevention and control technologies, such as biological control and physical control, to reduce the use of pesticides and thus lower the carbon emissions during the production and use of pesticides.
It is crucial to recognize that, within the context of agricultural production, farmers play a significant role primarily in the selection and application of planting technologies. In contrast, advancements in the production of fertilizers, pesticides, and agricultural machinery rely heavily on the progress of industrial and scientific–technological sectors external to agriculture. Meanwhile, a clear differentiation must be made between the impact of carbon dioxide emissions and those associated with the utilization of pesticides, fertilizers, and other agricultural inputs. Carbon dioxide emissions, once released into the atmosphere, have a far-reaching and profound influence on the global climate, which is at the core of current climate change research. On the other hand, the use of pesticides and fertilizers can lead to a series of problems. Not only can it cause pollution to local soil and water resources, but it may also result in food pollution, thereby causing food safety issues. These consequences differ markedly from the impact of carbon dioxide emissions and thus should be emphasized in the research related to agricultural sustainable development and policy-making. For example, during the process of formulating policies aiming to promote the low-carbon transformation of agriculture, it is necessary to take a comprehensive approach. Instead of solely concentrating on reducing carbon dioxide emissions, we should also give due consideration to the rational use of pesticides and fertilizers, enhance environmental supervision across the entire agricultural production chain, and ultimately ensure both ecological environmental security and food quality safety [25].
In addition, the implementation of emission reduction strategies requires the joint participation of the whole society. The government should play a leading role in formulating and improving relevant laws and regulations to guide the transformation of agricultural production methods. Scientific research institutions should continuously conduct relevant research to support the innovation of emission reduction technologies. Agricultural enterprises and farmers, as the main bodies of agricultural production, should enhance their environmental awareness, actively respond to emission reduction policies, and adopt green production technologies and methods to jointly promote the low-carbon transformation of the planting industry.

6. Research Conclusions and Revelations

Agricultural carbon emission reduction has an important impact on facing climate change worldwide [26]. This study measured and calculated the planting industry’s carbon emission in China’s 31 provinces (including municipalities) from 1997 to 2017 by methods recommended by the IPCC (2006), analyzing resources and the evolutionary trend of regional differences in the carbon emission of China’s planting industry from the perspective of carbon sources. The paper’s basic conclusions are as follows:
Firstly, the carbon emissions of China’s planting industry reached their peak in 2015. The contributions of different carbon sources to carbon emissions in the planting industry vary significantly. Chemical fertilizers are the largest carbon source, with an average contribution rate as high as 60.82%, playing a dominant role in the carbon emissions of the planting industry, followed by diesel, agricultural films, and pesticides, with contribution rates of 13.95%, 12.88%, and 9.83%, respectively, while the contributions of agricultural irrigation and seeding are relatively small, accounting for 1.88% and 0.64%, respectively.
Then, the results of the kernel density analysis show that there are obvious “multi-peak” phenomena in the carbon emissions of China’s planting industry as a whole and those of the six carbon sources. From 1997 to 2017, the kernel density curves exhibited a distinct right-tailing phenomenon, and the centers of the curves generally shifted to the right. This indicates that the carbon emissions of the national planting industry and the six carbon sources showed an overall upward trend, and there was a significant “multipolarization” feature. Carbon emissions were distributed and concentrated in multiple regions at different levels.
Lastly, the evolutionary trends of carbon emissions in the planting industry vary across different regions. In the central region, the carbon emissions of the planting industry as a whole, as well as those from chemical fertilizers, diesel, agricultural films, and pesticides, show a multipolarization trend, meaning that the carbon emission distribution is gradually dispersing, and multiple emission-concentrated regions are emerging. In contrast, in the eastern and western regions, these carbon emissions show a monopolarization trend, that is, carbon emissions are gradually concentrating in a few regions. In addition, the evolutionary trends of carbon emissions from seeding and irrigation in the eastern, central, and western regions are similar, basically showing a pattern of double increase in carbon emissions and regional differences.
Based on the above-mentioned research conclusions, the revelations are as follows: Firstly, chemical fertilizer is the largest carbon source in China’s planting industry, making the biggest contribution to carbon emissions in China’s planting industry and regional differences in carbon emissions. Therefore, the key to reducing the planting industry’s carbon emissions and narrowing regional differences in the planting industry’s carbon emission is to reduce the usage of chemical fertilizers. Strict policies should be made and implemented by China’s government to control the usage of chemical fertilizers. It is also necessary to improve utilization technologies relating to chemical fertilizers and enhance the usage efficiency of chemical fertilizers. Also, other measures such as promoting the use of organic fertilizers and circular agriculture can be taken to achieve goals that curb the growth of absolute chemical fertilizer use. Secondly, the carbon emission of China’s planting industry peaked in 2015 and it decreased gradually in 2016 and 2017. On the basis of the truth, China’s government is supposed to make long-term mechanisms to ensure the stable and orderly reduction of carbon emissions in the planting industry without rebounds. Scientific polices should be made in accordance with the real situation regarding regional differences in the planting industry’s carbon emissions, improving the operability of policies. Thirdly, due to the obvious imbalanced phenomenon with the prominent “multipolarization” existing in China’s planting industry and the six carbon sources’ carbon emissions, China’s government ought to focus on carbon emission control in major planting provinces, especially thinking highly of the control of chemical fertilizer usage. Technological and capital investments should be increased, leading the development of the traditional planting industry to a climate-smart planting industry. Then, the output efficiency of the planting industry can be improved, reducing investments in carbon sources such as chemical fertilizers and pesticides.

7. Limitations and Reflection

In terms of research methods, although the carbon emission factor method recommended by the IPCC and the kernel density estimation method were used, these methods may not fully and accurately reflect the actual situation. For example, carbon emission factors can be affected by various factors such as regions, soil conditions, and differences in planting varieties. In the calculation process of this study, general emission factors were used, and these complex practical differences were not fully considered, which may lead to certain deviations in the calculation results of carbon emissions. In addition, the kernel density estimation method mainly focuses on describing the distribution characteristics and evolutionary trends of data, and is insufficient in exploring the deep-seated causal relationships that affect carbon emissions in the planting industry.
From the perspective of the research scope, this study only covers the data from 1997 to 2017, with a relatively limited time span, making it difficult to comprehensively reflect the long-term trends of carbon emission changes. Moreover, the research mainly focuses on 31 provinces (municipalities) in China, without involving the differences in carbon emissions among different planting patterns and farmers of different scales, and thus is unable to provide targeted emission reduction strategies for different types of planting entities.
Future research can further optimize the carbon emission calculation method, combine more detailed field survey data, and construct a carbon emission model that is more in line with the actual situation. At the same time, measures need to be taken to expand the time and space scope of the research, incorporate data from more years as well as information on different planting patterns and farmer scales, and deeply analyze the influencing mechanisms of different factors on carbon emissions in the planting industry, providing a more solid theoretical support for formulating more precise and effective emission reduction policies.

Author Contributions

X.Z., writing—original draft; writing—review and editing; methodology; conceptualization; resources; project administration. C.L., writing—original draft; writing—review and editing; methodology; conceptualization; supervision; validation. J.Z., writing—original draft; data curation; investigation; supervision; formal analysis. J.L., writing—review and editing; investigation; data curation; validation. W.H., writing—review and editing; resources; visualization. All authors have read and agreed to the published version of the manuscript.

Funding

This research was funded by the Major Project of the National Social Science Fund, the Key R&D project of the Hubei Provincial Department of Science and Technology, the National Undergraduate Innovation and Entrepreneurship Project, and the Soft Science Project of the Hubei Provincial Department of Science and Technology, numbers 19ZDA085, 2023BCB042, 202410512014, and RKX202400296.

Institutional Review Board Statement

Not applicable.

Informed Consent Statement

Not applicable.

Data Availability Statement

The datasets used and analyzed during the current study are available from the corresponding author on reasonable request.

Conflicts of Interest

Author Wanling Hu was employed by the company Carbon Emission Registration and Settlement (Wuhan) Co., Ltd. The remaining authors declare that the research was conducted in the absence of any commercial or financial relationships that could be construed as a potential conflict of interest.

References

  1. China Meteorological Administration. World Meteorological Organization: Temperature in the 2010-to-2019 Period is the Highest on Record [EB/OL]. Available online: http://news.weather.com.cn/2019/12/3263864.shtml (accessed on 4 December 2019).
  2. Wei, X.; Shi, F.; Fan, J.; Yang, Q. Climate Change Impacts on Marine Lives and Ecosystems. Adv. Mar. Sci. 2011, 29, 241–252. [Google Scholar]
  3. Piao, S.; Zhang, X.; Chen, A.; Liu, Q.; Lian, X.; Wang, X.; Peng, S.; Wu, X. The impacts of climate extremes on the terrestrial carbon cycle: A review. Sci. China Earth Sci. 2019, 49, 1321–1334. [Google Scholar] [CrossRef]
  4. Li, Y.; Wang, C.; Zhao, B.; Liu, W. Effects of climate change on agricultural meteorological disaster and crop insects diseases. Trans. Chin. Soc. Agric. Eng. 2010, 26, 263–271. [Google Scholar]
  5. Hu, C.; Wei, Y.Y.; Hu, W. Research on the Relationship between Agricultural Policy, Technological Innovation and Agricultural Carbon Emissions. Issues Agric. Econ. 2018, 9, 66–75. [Google Scholar]
  6. Laborde, D.; Mamun, A.; Martin, W.; Piñeiro, V.; Vos, R. Agricultural subsidies and global greenhouse gas emissions. Nat. Commun. 2021, 12, 2601. [Google Scholar] [CrossRef]
  7. Fukase, E.; Martin, W. Economic growth, convergence, and world food demand and supply. World Dev. 2020, 132, 104954. [Google Scholar] [CrossRef]
  8. FAO. The State of Food and Agriculture 2016 (SOFA): Climate Change, Agriculture and Food Security; FAO: Rome, Italy, 2016. [Google Scholar]
  9. Chen, J.; Cheng, S.; Song, M. Changes in energy-related carbon dioxide emissions of the agricultural sector in China from 2005 to 2013. Renew. Sustain. Energy Rev. 2018, 94, 748–761. [Google Scholar] [CrossRef]
  10. Dalgaard, T.; Olesen, J.E.; Petersen, S.O.; Petersen, B.M.; Jørgensen, U.; Kristensen, T.; Hermansen, J.E. Developments in greenhouse gas emissions and net energy use in Danish agriculture–How to achieve substantial CO2 reductions? Environ. Pollut. 2011, 159, 3193–3203. [Google Scholar] [CrossRef]
  11. Yun, T.; Zhang, J.; He, Y. Research on spatial-temporal characteristics and driving factor of agricultural carbon emissions in China. J. Integr. Agric. 2014, 13, 1393–1403. [Google Scholar]
  12. Bennetzen, E.H.; Smith, P.; Porter, J.R. Decoupling of greenhouse gas emissions from global agricultural production: 1970–2050. Glob. Change Biol. 2016, 22, 763–781. [Google Scholar] [CrossRef]
  13. Cui, Y.; Khan, S.U.; Deng, Y.; Zhao, M. Regional difference decomposition and its spatiotemporal dynamic evolution of Chinese agricultural carbon emission: Considering carbon sink effect. Environ. Sci. Pollut. Res. 2021, 28, 38909–38928. [Google Scholar]
  14. Ma, J.; Feng, X.; Wang, S.; Liu, F.; Li, Y. Drivers and reduction potential of carbon emissions from cultivated land use. Catena 2024, 247, 108508. [Google Scholar]
  15. Huan, H.; Wang, L.; Zhang, Y. Regional differences, convergence characteristics, and carbon peaking prediction of agricultural carbon emissions in China. Environ. Pollut. 2025, 366, 125477. [Google Scholar] [CrossRef] [PubMed]
  16. Liu, D.; Zhu, X.; Wang, Y. China’s agricultural green total factor productivity based on carbon emission: An analysis of evolution trend and influencing factors. J. Clean. Prod. 2021, 278, 123692. [Google Scholar]
  17. Zhang, J.; Peng, X.; Zhang, J.; Liu, J.; Lu, W. Stage characteristics, spatial differences and dynamic evolution of crop carbon sink in Hubei Province based on the crop data from 1997 to 2022. J. Environ. Eng. Technol. 2024, 14, 1513–1522. [Google Scholar]
  18. Li, B.; Zhang, J.; Li, H. Research on Spatial-temporal Characteristics and Affecting Factors Decomposition of Agricultural Carbon Emission in China. China Popul. Resour. Environ. 2011, 21, 80–86. [Google Scholar]
  19. Liu, H.; Bao, Z.; Yang, Q. Evolution of Regional Differences and Dynamic Distribution in Carbon Emission of China’s agriculture: Empirical Researches Based on Dagum Gini Coefficient Decomposition and Nonparametric Method for Estimation. J. Agrotech. Econ. 2013, 3, 72–81. [Google Scholar]
  20. Tian, Y.; Zhang, J.; Li, B. Agricultural Carbon Emissions in China: Calculation, Spatial-Temporal Comparison and Decoupling Effects. Resour. Sci. 2012, 34, 2097–2105. [Google Scholar]
  21. Zhang, G.; Wang, S. China’s Agricultural Carbon Emission: Structure, Efficiency and Its Determinants. Issues Agric. Econ. 2014, 35, 18–26+110. [Google Scholar]
  22. Chen, W.; Yin, T.; Li, H. Spatiotemporal distribution characteristics of carbon emission from plant industry and the relationship with agriculture development in China from 1997 to2015. J. Arid. Land Resour. Environ. 2019, 33, 37–44. [Google Scholar]
  23. Wang, X.; Ma, S.T.; Pu, C.; Zhao, X.; Wang, Y.Q.; Zhang, H.L. Trends and influencing factors of agricultural carbon emissions in the Southwest China. China Popul. Resour. Environ. 2017, 27, 231–234. [Google Scholar]
  24. Wen, Q.; Tian, Y.; Wang, Y. Provincial differences and driving mechanism of agricultural carbon emission in China. J. Arid. Land Resour. Environ. 2015, 29, 1–6. [Google Scholar]
  25. Hong, K.; Zhu, Z. Temporal and spatial characteristics and influential factors of agricultural land use carbon emissions in Pearl River Delta: Based on the data from 1996 to 2014. J. Hunan Agric. Univ. (Soc. Sci.) 2017, 18, 70–76. [Google Scholar]
  26. Leahy, S.; Clark, H.; Reisinger, A. Challenges and prospects for agricultural greenhouse gas mitigation pathways consistent with the Paris Agreement. Front. Sustain. Food Syst. 2020, 4, 69. [Google Scholar]
Figure 1. The evolutionary trend of carbon emissions in China’s planting industry.
Sustainability 17 02772 g001aSustainability 17 02772 g001b
Figure 2. The evolutionary trend of chemical fertilizer’s carbon emission.
Sustainability 17 02772 g002
Figure 3. The evolutionary trend of pesticide’s carbon emission.
Sustainability 17 02772 g003
Figure 4. The evolutionary trend of film’s carbon emission.
Sustainability 17 02772 g004
Figure 5. The evolutionary trend of diesel oil’s carbon emission.
Sustainability 17 02772 g005
Figure 6. The evolutionary trend of carbon emission in seeding.
Sustainability 17 02772 g006
Figure 7. The evolutionary trend of carbon emission in irrigation.
Sustainability 17 02772 g007
Table 1. Emission factors of carbon sources in planting industry’s carbon emission.
Carbon SourcesEmission FactorsReference Sources
Chemical Fertilizers0.8956 kg/kgOak Ridge National Laboratory [17]
Pesticides4.9341 kg/kgOak Ridge National Laboratory [17]
Agricultural Films5.1800 kg/kgAgricultural Resource and Ecological Environment Research Institute, Nanjing Agricultural University [18,19]
Agricultural Diesel Oil0.5927 kg/kgIPCC (2006) [20]
Agricultural Seeding3.1260 kg/hm2College of Biological Sciences and Technology, China Agricultural University [21]
Agricultural Irrigation25.0000 kg/hm2[22,23,24]
Table 2. Measuring results of all kinds of carbon sources’ CO2 emissions in China’s planting industry from 1997 to 2017 (unit: ten thousand tons).
YearChemical FertilizerPesticideFilmDiesel OilSeedingIrrigationCarbon Emissions in Agriculture
Carbon EmissionsProportionCarbon EmissionsProportionCarbon EmissionsProportionCarbon EmissionsProportionCarbon EmissionsProportionCarbon EmissionsProportion
19974478.6068.00%589.858.96%601.679.14%739.6911.23%48.130.73%128.311.95%6586.26
19984605.0167.76%607.738.94%625.169.20%779.3411.47%48.670.72%130.321.92%6796.23
19993693.7461.74%652.1010.90%651.9910.90%802.8113.42%48.880.82%132.902.22%5982.42
20003713.5261.35%631.3310.43%691.7611.43%832.8013.76%48.860.81%134.552.22%6052.83
20013809.6760.92%629.0110.06%750.7312.00%880.3414.08%48.670.78%135.622.17%6254.04
20023886.4560.68%647.4910.11%792.9312.38%893.5513.95%48.340.75%135.892.12%6404.65
20034580.7663.84%653.889.11%824.4911.49%933.5013.01%47.640.66%135.031.88%7175.30
20044765.7962.85%683.889.02%870.2311.48%1078.5414.22%48.000.63%136.191.80%7582.63
20054888.1862.39%720.359.19%912.8811.65%1127.7914.39%48.610.62%137.501.75%7835.31
20064572.2460.04%758.429.96%955.9612.55%1139.5814.97%49.080.64%139.421.83%7614.71
20074574.5858.91%800.7210.31%1003.6112.92%1197.5515.42%47.970.62%141.301.82%7765.73
20084692.0859.61%825.1110.48%1039.5913.21%1119.0814.22%48.850.62%146.181.86%7870.88
20094840.1459.61%843.2410.38%1077.2813.27%1161.5714.31%49.590.61%148.151.82%8119.98
20104981.0559.48%867.5210.36%1125.6113.44%1199.1514.32%50.230.60%150.871.80%8374.43
20115108.7259.38%881.7210.25%1188.5713.82%1219.4814.17%50.730.59%154.201.79%8603.43
20125229.2859.34%891.1310.11%1234.4014.01%1249.3514.18%51.080.58%157.591.79%8812.83
20135294.6559.08%889.069.92%1291.4714.41%1277.2114.25%51.460.57%158.681.77%8962.53
20145369.9559.00%891.559.80%1336.5514.69%1290.1914.18%51.720.57%161.351.77%9101.31
20155393.8659.00%879.739.62%1348.6414.75%1302.5814.25%52.010.57%164.681.80%9141.50
20165359.2859.28%858.769.50%1348.1514.91%1254.8613.88%52.090.58%167.851.86%9041.00
20175247.6859.38%816.639.24%1309.6914.82%1241.7114.05%52.000.59%169.541.92%8837.24
Average Value4718.3460.82%762.829.83%999.1112.88%1081.9413.95%49.650.64%146.011.88%7757.87
Disclaimer/Publisher’s Note: The statements, opinions and data contained in all publications are solely those of the individual author(s) and contributor(s) and not of MDPI and/or the editor(s). MDPI and/or the editor(s) disclaim responsibility for any injury to people or property resulting from any ideas, methods, instructions or products referred to in the content.

