Article

Comprehensive Plastic Waste Characterisation to Enhance Landfill Diversion in New Zealand’s Construction Industry

1
Environmental Innovation Centre, Auckland 0620, New Zealand
2
Research and Enterprise, Unitec Institute of Technology, Auckland 1025, New Zealand
3
School of Future Environments, Auckland University of Technology, Auckland 1010, New Zealand
*
Author to whom correspondence should be addressed.
Sustainability 2025, 17(6), 2742; https://doi.org/10.3390/su17062742
Submission received: 14 February 2025 / Revised: 6 March 2025 / Accepted: 13 March 2025 / Published: 19 March 2025
(This article belongs to the Section Waste and Recycling)

Abstract

:
The plastic profile of construction waste is varied and complex, particularly when compared to other waste streams such as timber, concrete, metals, and plasterboard. There are fewer incentives for recycling this low-density, low-value waste stream. Plastic waste generated by construction activities remains poorly characterised, obstructing efforts to optimise reduction, reuse, and recycling practices. To understand its types and sources, and better address plastic waste management, this study audited plastic waste produced across six new-build construction sites in Auckland, New Zealand. A total of 7.2 tonnes of plastic construction waste was collected on-site and audited. Plastics were separated, weighed, and categorised by function and construction stage. Polymer type was determined using Fourier transform infrared (FTIR) spectroscopy. In total, 62% of plastic waste was diverted from landfill through reuse or recycling. On average, 0.61 kg of plastic was generated per m2 of construction. Soft plastics were the most generated by mass (33%), followed by PVC and HDPE pipes (22%), shrink wrap (12%), and expanded polystyrene (5%). The majority of plastic waste was generated in the final stages of the projects. The authors recommend the separation of soft plastic, pipes, shrink wrap, and polystyrene on construction sites, particularly towards the finishing stages of construction.

1. Introduction

The construction industry encompasses construction, renovation, and demolition (CRD) activities, which are energy-intensive and the most significant contributors to waste on a global scale [1]. CRD waste ranks among the most contaminated varieties of waste streams [2], resulting in further issues with land contamination and disposal. As a result of New Zealand (NZ)’s prolonged urbanisation and population growth, investments in construction works are significant, amounting to NZD 7.2 billion in 2021 [3]. About 88% of new buildings are residential dwellings [4]. CRD waste is prolific and unlikely to reduce soon—construction waste generation is estimated to be 943.5 kg/capita [3]. In Auckland, commercial waste to landfill grew significantly between 2010 and 2016, due to a spike in construction and demolition (C&D) waste, which accounts for about 40% of all landfilled waste [5].
On a global scale, the construction industry is one of the largest users of plastics, consuming about 19% of all plastics and 69% of all PVC [6]. NZ’s construction industry accounts for about 16% of the country’s polymer use and 63% of NZ’s PVC consumption [7]. This high plastic use drives the industry’s plastic waste generation. One estimate puts the plastic component of NZ C&D waste at 4% by volume [8], which is similar to the 3% reported in Victoria, Australia [9], 3.8% reported in Galicia, Spain [10], and 1% in Florida, USA [11].
Plastic waste is only a small proportion of the overall C&D waste sent to landfills; however, its disposal can be problematic due to its potential toxicity. In some Nordic countries, landfilling PVC waste is banned or restricted due to the toxicity of its additives [1,12]. PVC recycling has been found to have a lower environmental impact than using virgin PVC [13]. Additionally, the extraction of petroleum, of which 20% is estimated to be used for plastics globally in 2050 [14], is energy-intensive. The plastic manufacturing process itself released 390 million tonnes of CO2-eq in 2015 [15]. Landfilling plastic waste is also problematic due to its often high volumes [1].
In comparison to other construction materials, plastic waste is usually not sorted or addressed on-site [1]. It is often considered a low-value material; of the 300 million tonnes of plastic waste generated globally, only 9% is recycled [16]. Common recyclable plastics used in construction include polyvinyl chloride (PVC), expanded polystyrene (EPS), high-density polyethylene (HDPE), low-density polyethylene (LDPE), polyethylene terephthalate (PET), and polypropylene (PP) [1,17]. Common sources of plastic waste in NZ construction include: sub-floor insulation (EPS); ‘soft plastic’ bags; film and wrap used for product packaging (made mostly of LDPE and some PP); ‘shrink wrap’ which creates a weather-resistant enclosure around a building (made of LDPE); ‘damp-proof membranes’ (DPMs); moisture barriers (made of LDPE); and pipes (made of PVC and HDPE) [4,18,19]. Some plastics are relatively easy to recognise and keep clean—for example, PP electrical cable reels and PVC pipes. LDPE can be more difficult as it may appear similar to other plastic films and has a wide range of uses (e.g., building protection, material packaging, building componentry), which provide opportunities for contamination.
In NZ, there are plastic recyclers who accept certain construction materials made from plastics, including LDPE, PVC and HDPE pipes, PP, and EPS, for recycling [20]. Materials must be sorted correctly and be relatively free from soil, concrete, paint, chemicals, food, and other contaminants and materials. They must also be relatively pure (not composites). The plastics are either recycled locally, put back into building materials (e.g., pipes, timber wrap, DPM, and EPS), or sent offshore for recycling.
Despite the need to reduce plastic construction waste sent to landfills, little is known about the types of plastic C&DW generated worldwide and in NZ. Existing research has investigated plastic C&DW from landfills or waste companies [21,22,23], as well as non-plastic types from construction sites [24,25,26,27,28]. However, studies rarely focus on the types of plastic waste produced on construction sites. When investigated, construction plastic waste is usually grouped into broad or few categories—such as a singular ‘plastics’ category—or combined with other materials [23,25,29,30]. Yet, there are many different forms and sources of plastic waste—treating it as only a single category or merging it with other materials offers limited benefits for waste management. More detailed characterisation of plastic C&DW waste streams is needed to understand the diverse sources and develop effective management strategies [1,31].
Llatas [25], González Pericot et al. [32], and González Pericot and Del Río Merino [33] have investigated plastics from construction waste as packaging materials. These either contain and protect products, group products together, or protect products during transportation. Llatas [25] noted that plastic packaging was used to protect the bricks supplied. González Pericot et al. [32] found a large amount of plastic packaging came from pallet wraps, which were common on incoming palletised materials used during structural and partitioning works. As a result, plastic packaging was generated at similar stages to wood waste. For three construction projects, ranging from 5 to 7 storeys and including housing, storage areas, commercial premises, and garages, the average plastic film WGR was 0.127 kg/m2 [33].
Chauhan et al. [34] investigated the generation of plastic film waste during the construction of three apartment buildings in Finland (7–9 storeys). Plastics were collected on-site in designated bins. The most film waste was generated during the final stages of construction (including interior work, mechanical, electrical and plumbing installation, and finishes). Similarly, in González Pericot et al.’s study [32], most plastic packaging waste was generated in the final stages (interior work, building services, thermal and moisture protection), followed by the mid stages (building structure and envelope). None was generated in the foundation stage. The overall plastic packaging WGR of both studies was 0.34 kg/m2 and 0.53 kg/m2, respectively.
There have been few studies investigating non-packaging plastic waste, such as building products and material offcuts. Wu et al. [29] audited plastic waste from three Hong Kong construction sites, which was sorted into three categories: plastic and rubble, styrofoam (EPS), and nylon. All plastic waste types were mostly generated during the final stages of construction (including installation of sanitary fittings, screeding, and tiling). In NZ, Berry et al. [35] and Low et al. [19] investigated all plastic waste produced from the construction of a school and terraced residential housing; the latter reported a plastic waste generation rate (WGR) of 0.85 kg/m2. Hernandez et al. [36] also investigated plastic waste from an NZ construction site, with PE being the most common, followed by PVC and PP.
In this study, six newly built construction sites in Auckland, NZ, were selected for auditing. The plastic waste generated by each site was separated and audited—weighed, analysed, and categorised. This allowed the research team to understand the composition of plastic waste being generated on-site and, in turn, how it could be diverted from landfills.
This research aims to identify types and sources of plastic waste across six new-build construction sites in Auckland, NZ. It seeks to provide practical suggestions for stakeholders in the construction industry to better manage their plastic waste, particularly on-site. While the case studies are in Auckland, NZ, the challenges identified on NZ construction sites are likely to have some similarities to sites in other countries, especially those that have similar building typologies such as England, Ireland, Sweden, and Australia [37,38].

2. Methodology

2.1. Site Selection and Setup

Sites were selected based on the following criteria: they were new buildings (to avoid risks associated with asbestos in demolition/deconstruction); construction companies approved the presence of research teams on their sites and could accommodate them safely; companies were willing to pay for plastic waste recycling and transport if required; and the intended construction timeframe was within one year. Six was considered to be large enough to have an overview of a range of building types (residential, institutional, small, and large) in Auckland.
Characteristics of the six study sites are shown in Table 1. The sites varied in size, in terms of the company size and the building itself, as well as building type.
The site setup and auditing were similar to that reported by Berry et al. [35] who reported on the findings of Site 1, as well as Low et al. [19], who reported on Site 2.
An initial waste management training session was conducted for both staff and subcontractors as part of the research project. This training took place when the physical construction works began and before construction waste was generated. The training encompassed the classification of several types of plastics, waste storage conditions, and proper sorting procedures. During daily ‘toolbox talks’, most sites had a brief discussion with their staff about the waste management programme. The exception was Site 1; because it was our pilot site, staff did not receive training or site separation guidance from the research team—only from the company’s own sustainability team.
To enable on-site waste separation, sites had an area for plastic waste collection. At these ‘stations’, plastics were placed into assigned cubic metro bags or bins, labelled with signage. For most sites (excluding Site 1), plastics were sorted into some or all of the following categories. The first four categories are plastics which can be recycled locally in NZ and are generally recycled around the world. The final category, ‘all other plastics’, was provided for materials that staff were unsure about.
1.
Pipes (PVC and HDPE);
2.
Soft plastics (primarily LDPE);
3.
Polystyrene (EPS);
4.
Polypropylene (PP);
5.
All other plastics.
Signage had specific images and details to assist with waste sorting. As new information emerged from the study (regarding the plastic materials’ polymer types and recyclability), updated versions of the signage were used. These expanded on the types of acceptable plastics for each category and the conditions they needed to meet.

2.2. Waste Separation, Auditing, and Recycling

Site staff sorted plastic waste on-site to preserve material quality and recyclability. Once bags/bins on-site were full, the research team audited the waste either on-site or off-site—this occurred about once a month. This sorting process was carried out to both characterise the waste stream and ensure the waste was in the correct condition before being sent for recycling. While contaminated materials were not sent to recyclers, they were still recorded.
The waste audit included weighing the waste materials, recording the plastic type, and retrieving a sample for Fourier transform infrared (FTIR) spectroscopy analysis off-site. Volumes were calculated based on polymer type and mass. Plastic materials were analysed using FTIR spectroscopy, with either a ThermoFisher Nicolet iS50R (Scoresby, VIC, Australia) (Site 1) or an Agilent 4500 Series (sourced from Agilent, Mulgrave, VIC, Australia) (Sites 2–6) FTIR spectrometer in the attenuated total reflectance (ATR) mode, equipped with a diamond ATR crystal (method described by Berry et al. [35]). This analysis identified the polymer type for each plastic material, which was used to categorise them and find suitable recyclers. For Sites 5 and 6, PVC and HDPE pipes were collected by recycling operators. These data were recorded by the operators and given to the research team.
The criteria for acceptable materials and contamination thresholds were confirmed with local recyclers chosen by the site. These criteria varied among recyclers; for example, some LDPE recyclers required stickers to be removed and only accepted clear or uncoloured films. Another LDPE recycler accepted small amounts of PP film. These differences depend on the recyclers’ intended end product, and whether their process includes washing. Materials with excessive contamination from soil, concrete, paint, or food were deemed unacceptable. Small amounts of dirt and water were generally acceptable. Some materials currently do not have a local reuse or recycling option, such as cross-linked PE pipes, woven plastics, PET strapping, and composite materials. Once sorted, recyclable plastics (categories 1–4 above) were sent for reuse, or transported by the site to the selected plastic recycler. Non-reusable and non-recyclable plastics were sent to landfill.

2.3. Waste Categorisation

Plastic materials were also categorised with respect to time, e.g., month from start date of construction and the construction stage. While construction stages can overlap, they were divided into three key stages: (1) initial stage (foundations), (2) mid stages (structure/framing and roofing), and (3) final stages (finishings and interior fitout). These are similar to the stages defined by Wang et al. [30].
The general function of each plastic material was also considered and split into three categories:
1.
Product packaging—used for packaging componentry, materials, and tools (e.g., soft plastic bags, polystyrene, hard plastic packaging);
2.
Building componentry—used within the building itself (e.g., pipes, reinforcing bar chairs, damp-proof course, polystyrene pods, vinyl flooring);
3.
Building protection and/or tools—used to construct and protect the building (e.g., tools, shrink wrap, safety fences).

3. Results and Discussion

3.1. Qualitative Factors Impacting On-Site Waste Management

Plastic waste sorting and waste management varied between the sites. On-site waste separation and management was observed to be successful on Site 2—one of the smaller sites. More effective management by the primary waste operator and site owner was largely the reason for this, with quick and efficient transportation of waste to recyclers being undertaken by the site owner after each audit. In contrast, larger sites such as 4, 5, and 6 faced challenges despite staff enthusiasm and the presence of well-constructed, covered waste stations. High staff turnover and the size of the sites hindered successful waste sorting. Furthermore, audited plastics were not immediately transported to recyclers every time, resulting in accidental disposal.
Most sites had a staff member dedicated to overseeing waste sorting and organising for waste to be taken away once bags were full. However, Site 3 did not have such a staff member, which may have contributed to the lack of waste sorting and incomplete dataset for this site. Villoria Sáez et al. [39] interviewed construction stakeholders, who also identified the importance of having someone dedicated to on-site waste management for it to be successful.
In general, waste management tended to deteriorate towards the end of the project when there was greater pressure to meet deadlines. Waste stations were often disassembled or moved to allow work to continue, which caused some disruption. As such, the waste separation programme became more neglected, with plastics not being sorted properly and sometimes going into the commingled general waste bins. The consistent engagement from site management was a crucial factor, especially towards the end stages, as this influenced the engagement of site staff. ‘Poor supervision’ and ‘lack of management’ were leading causes of poor waste management reported by Arshad et al. [40]. Similarly, Yuan et al. [41] found management effort and project stakeholders’ attitudes to be the most critical factors perceived to affect on-site waste management in Hong Kong.
Plastic building components are useful and can make construction efficient and cost-effective. However, the lack of regulations, combined with poor management of plastic product use and their waste streams, often result in high volumes of plastic waste ending up in landfill [41,42]. Although government initiatives currently support research around construction plastics and plastic recycling facilities [43,44], regulation supporting sustainable waste management for C&D remains limited, particularly for plastic waste. Waste disposal charges to landfill (based on quantity, per tonne) have been steadily increasing since 2021 [35,45], which should encourage waste reduction from a financial standpoint; yet for lightweight plastics, this is unlikely to make a major difference. In addition to these initiatives, stronger regulations are needed to prioritise on-site waste reduction and diversion from landfill. Nationwide mandatory waste management plans and reduction targets for construction sites could support this effort—an approach which has been proposed previously [46] and is currently adopted in some regions [47,48] but not consistently across the country. Improving waste transportation networks to encourage recycling, especially in more remote areas of the country, would also support better outcomes by reducing both the logistical and financial burdens of plastic waste management.

3.2. Plastic Waste Types and Quantities

A total of 7.2 tonnes of plastic waste was audited across the six sites, with 62% of this diverted from landfill through reuse or recycling. A total of 677 samples were categorised into 46 plastic materials based on their plastic type and source.
In terms of total plastic waste generated, the hospital building (Site 5) generated the most and had the highest waste diversion rate (Table 2). All building sites differed slightly in terms of materials used, thus affecting waste generated. Site 1 used a roll of vinyl flooring, Site 5 used shrink wrap, and Site 6 used woven plastics for building protection—as such, these made up a substantial proportion of their total waste (28%, 23%, and 24%, respectively). For Sites 2, 4, and 5, pipes comprised 22%, 21%, and 26% of their total plastic waste, respectively (Table 3; see Supplementary Materials Table S1 for results of all plastic waste streams). Note that the amounts of pipe waste were not recorded for Site 6 (due to a miscommunication). Due to their incomplete datasets, Sites 3 and 6 have been excluded from the averaged results below (Figure 1, Figure 2, Figure 3 and Figure 4). Recycling endpoints for plastics were not consistently recorded for Site 1; therefore, the diversion rate has not been included (Table 2).
By mass and volume (Figure 1a,b, respectively), the four most common plastics were soft plastics, pipes, shrink wrap, and polystyrene/EPS. EPS accounted for a significantly higher proportion of the waste when considering volume rather than mass, as it has a relatively low density. During audits, a full cubic metre bag containing only EPS offcuts and packaging waste weighed between 7.2 kg and 13.1 kg.
We would recommend construction sites to target soft plastics, pipes (PVC and HDPE), polystyrene, and shrink wrap for on-site plastic waste separation. Sorting these plastics for recycling will have the largest impact, as they are widely recyclable and easy to identify. Cable reels made up 4–5% of the plastic waste. Since they are relatively easy to sort, we recommend also separating them at the source when generated on-site.
Prestes et al.’s [22] audit of plastic C&D waste at a Brazilian landfill found plastic films to account for 36.1% of plastics, and rigid PVC accounted for 32.7%. The contribution of soft plastics is similar to the findings of this study (33%). Sites 2, 4, and 5 produced slightly less pipe waste (21–25%) than reported by Prestes et al. [22].

3.3. Assessment of Plastic Polymer Type

The most common polymer (as identified using FTIR spectroscopy) was PE, followed by PVC (with a calcium carbonate filler, used for pipes) and PP. ‘NA’ refers to plastics that could not be identified, either because they were too contaminated or were composite materials made of a few different materials. PE plastics were primarily soft plastics, shrink wrap, drainage pipes, woven plastics, and DPM. PVC with calcium carbonate filler was mostly from pipes. PP was from electrical cable reels and woven plastics. PS was expanded polystyrene for insulation or packaging; PVC from vinyl flooring; PET from strapping; silicone polymers from the backing film of self-adhesive products (such as building wrap, or wall underlay); polycarbonate (PC) from translucent building facades; and PP/PE copolymers from woven plastics.
Prestes et al. [22] investigated the plastic proportion of C&D waste from a Brazilian landfill. Their data were similar to this study’s, showing polyethylene (PE) to be the most common polymer (54.5%), followed by PVC (32.7%), PET (7.2%), and PP (5.3%). Hernandez et al.’s [36] audit of NZ C&D sites reported PE to be the most common (77%), followed by PVC (19%) and PP (2%).

3.4. Assessment of Plastic Material Functionality

About half of plastic waste came from product packaging, which included soft plastic waste, cable reels, timber covers (made of woven plastics), polystyrene packaging, and adhesive backing film (Figure 3). Construction components were the second largest category, with pipes making up more than half, alongside DPM, vinyl flooring, and expanded polystyrene insulation. Plastics used for building protection and/or tools were mostly shrink wrap and woven plastics (used for carpet and window protection during final stages). Li et al. [49] categorised construction waste into four main types: (1) extracted materials (such as excavated soil), (2) construction materials (used to form the building), (3) target building elements (designed elements of a building), and (4) packaging materials. They estimated these categories to account for 96.47%, 2.60%, 0.91%, and 0.02% of the total waste used in a building’s substructure, respectively. These results differ heavily to the results of this study, as non-plastic waste types were considered. While the categories also differ, there is some overlap between construction materials and packaging.

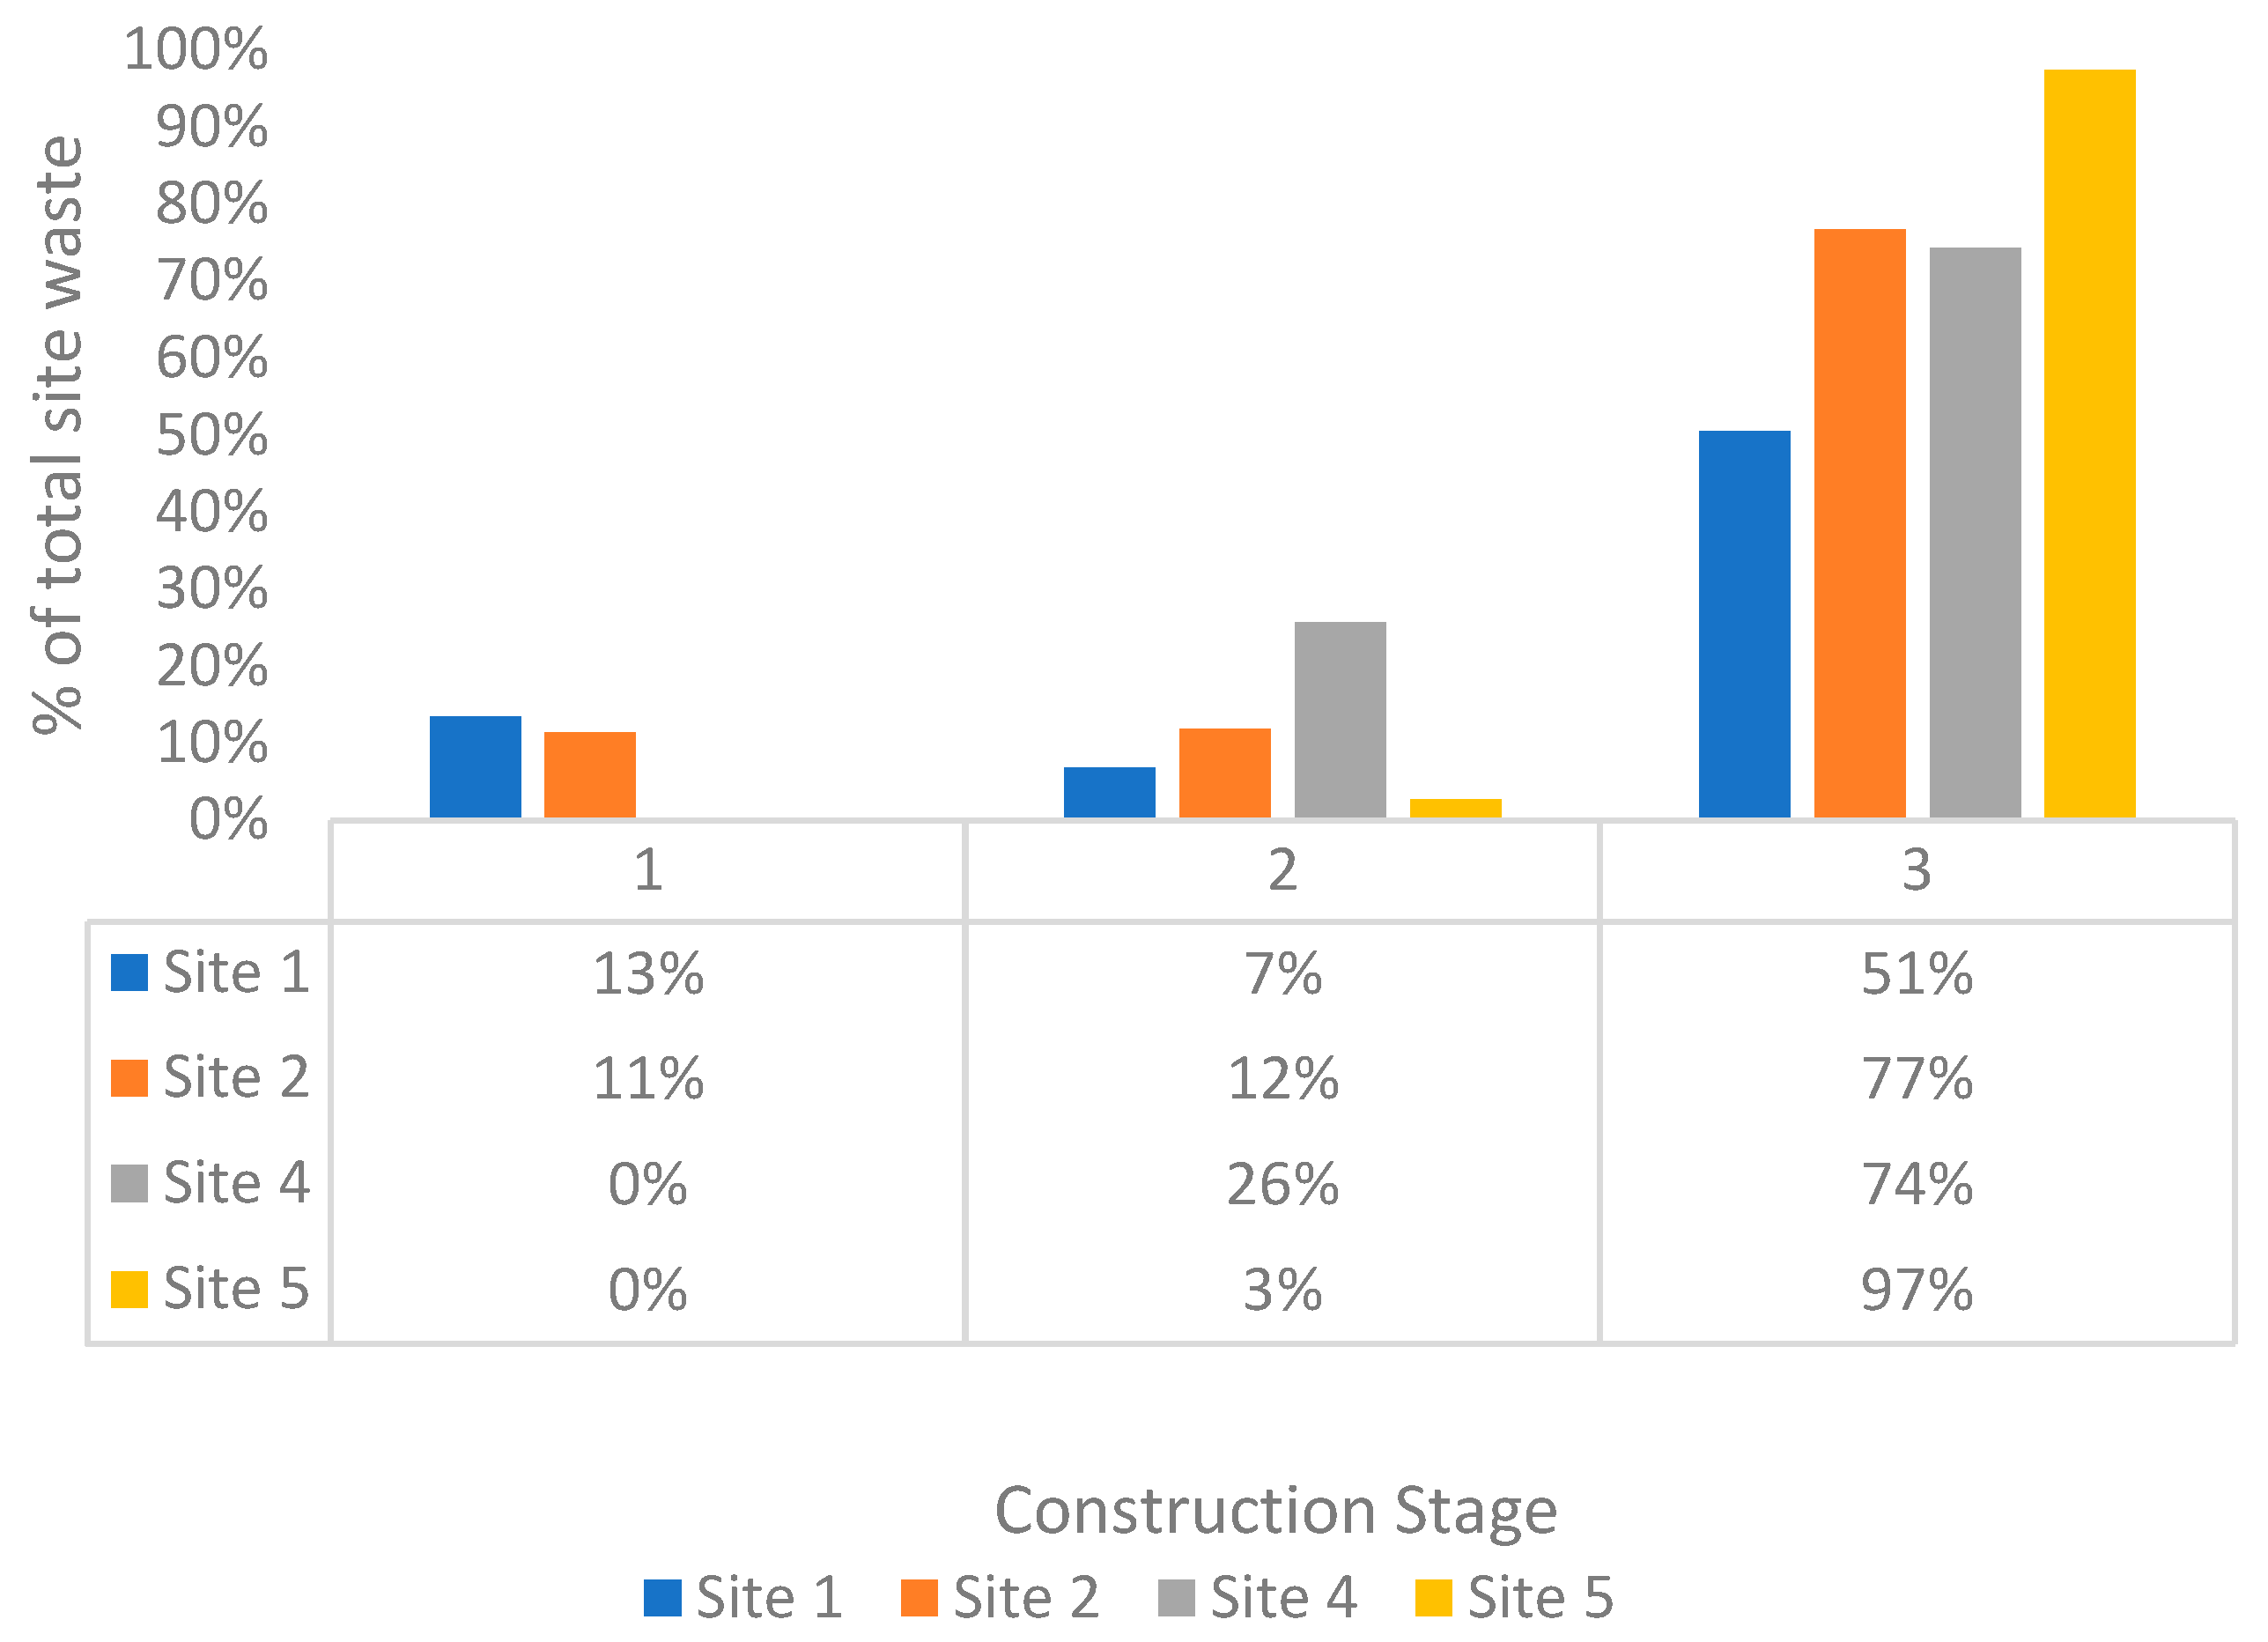
3.5. Impact of Construction Stage on Plastic Waste Generation

All four sites generated most of their waste in the final stages of construction (Figure 4). A total of 86% of soft plastics and 85% of all plastics (for four sites) were generated in the final stages. Sites 1 and 2 generated plastics in the initial building stage—this was mostly soft plastic packaging for Site 1 and EPS insulation pods for Site 2. Sites 4 and 5 did not generate any plastic waste during the initial stages.
Similarly, in Wu et al.’s [29] study, the most plastic waste was generated in the final stages of construction (61% of total reported plastic waste). Chauhan et al. [34] and González Pericot et al. [32] also found that the most plastic packaging/film waste was generated during the final stages, accounting for 87% and 58% of the total reported plastics, respectively.
Note that there are limitations to this construction stage analysis, as auditing for each stage was not always consistent due to site or setup limitations. Towards the final stages of construction, it was common for sites to be less effective at waste separation; therefore, not all waste could be audited by the research team. Additionally, the time of collection for pipes was not recorded for Sites 2 and 5, which affects Figure 4.

3.6. Impact of Building Type on Plastic Waste Generation

A range of building typologies (residential, institutional, and educational) were investigated in this study, as the size and type of building may also affect the volumes and types of waste produced [30]. Horizontal construction has been found to generate more waste than vertical construction [50]. Buildings with more architectural detailing (such as mosques) and partitioning and walls (such as public health buildings) can also lead to greater waste generation [40]. In NZ, factors significantly correlated with waste generation were the floor area, external perimeter, number of working days, and number of corners on the building [28]. While a range of building typologies were audited for this research (Table 1), no clear or significant trends were observed in waste generation rates. Further studies are needed to investigate the impact of building typology on plastic waste generation. Nonetheless, by considering a diverse range of building types, this study offers a broad average of waste generation for new buildings in New Zealand.
The average plastic WGR of the four study sites was 0.61 kg/m2 (excluding Sites 3 and 6) (Table 2). Site 2, a residential, terraced housing project, had the highest WGR (0.85 kg/m2), while Sites 4 and 5 were very similar (apartment block and hospital building, respectively). Other studies in the literature have not reported plastic WGRs that represent entire construction projects (i.e., from start to finish). However, in terms of soft plastics, the WGR was on average 0.21 kg/m2, ranging from 0.02 kg/m2 to 0.32 kg/m2 (Table 2). These values are comparable to the rates found in other studies—González Pericot and Del Río Merino [33] reported plastic film waste generation for three multi-storey residential builds, with the average being 0.13 kg/m2. Across 10 multi-storey residential blocks, González Pericot et al. [32] reported a rate of 0.53 kg/m2 for plastic packaging. Chauhan et al. [34] reported an average rate of 0.34 kg/m2 for the construction of three multi-storey apartment blocks.

3.7. Study Limitations

Across the six sites, performance and data collection varied. Not all plastic data and waste data could be collected and analysed, as some plastic waste was accidentally discarded by sites before they could be audited. For all sites, there was inevitably a small proportion of waste that could not be audited due to contamination (i.e., items at the bottom of the bag that were too contaminated with food, water, or soil). Site 1, being the pilot site, did not sort the plastics into the five designated categories. Instead, plastics were placed in a commingled bin and audited off-site by the research team at the end of each construction stage. Consequently, a sizeable portion of the plastics (~30%) from Site 1 could not be audited due to contamination and health and safety concerns (Table 3). Recycling endpoints for plastics were not consistently recorded for Site 1 and were not reported (Table 2). Sites 3 and 6 were excluded from the averaged results due to their incomplete datasets. For Site 3, only 20 kg of plastic waste was collected, and the remainder was discarded accidentally. For Site 6, the total amount of plastic pipe waste was not recorded due to a site error.
While the total mass of pipes was recorded for Site 2 and 5, the time at which they were generated was not recorded; therefore, this will affect the analysis in Section 3.5.

4. Conclusions

In general, waste management on construction sites was observed to deteriorate towards the end of the project, when the pressure to meet deadlines increased. Waste separation setups were often disassembled at this time to allow work to continue, which also disrupted the waste sorting process. Successful on-site waste management was largely dependent on the engagement of management staff and the presence of a dedicated staff member to oversee sorting.
The hospital building generated the most plastic waste, at 3.1 tonnes. Soft plastics were the most common plastic waste generated from four construction sites, followed by PVC and HDPE pipes, shrink wrap, and EPS. Similarly, the most common polymer type was PE, followed by PVC and PP. In terms of waste volume, EPS was a significant waste stream, accounting for 18% of the total plastic waste volume. The majority of plastics came from product packaging, followed by construction components and building protection and tools.
The average WGR for all plastics was 0.61 kg/m2, with most plastics being generated in the final stages of construction—a result which agrees with prior studies. The high generation rates during the final interior fitout stage could be addressed by collaborating with manufacturers/suppliers who would also want to reduce costs and waste production.
This study presents the waste generation profile for a diverse mix of residential and institutional buildings, offering a comprehensive overview of the waste types expected on a typical construction site. Trends were not observed for specific building types; however, the results provide a more representative average than previously reported and includes plastic componentry and building protection in addition to packaging. Further research is needed to investigate the effect of different building typologies on plastic waste generation, enabling better prediction and planning.
We recommend construction sites in NZ to target the main plastic waste streams for landfill diversion, which are also widely recycled—soft plastics (primarily LDPE), pipes (PVC and HDPE), expanded polystyrene insulation and packaging (EPS), and shrink wrap (LDPE). This recommendation may also be valid for other countries, as these plastic wastes and their sources are common around the world. However, access to local recyclers may impact the benefits of separating these waste types.
The C&D waste stream contributes substantially to landfill waste volumes in NZ, which could be improved by targeted education for the sector, better incentives to reduce waste, and more consistent local government policies. For example, nationwide regulations that require the use of waste management plans and diversion targets could improve on-site practices. Improvements in transport networks to move plastic waste from sites to recyclers is needed, especially for more remote regions. The findings of this paper can be used to help reduce plastic waste at the source, in collaboration with suppliers, manufacturers, and future legislation. This also highlights the feasibility, practicalities, and relative benefits of targeting each plastic type; for example, polypropylene waste is not a significant waste contributor from C&D, unlike LDPE. However, LDPE is more difficult to separate and keep clean enough to recycle mechanically without pre-washing. Therefore, regulations to improve recycling of LDPE wastes must set realistic targets, allowing for product contamination, which is, in part, impacted by poor waste management processes on-site.

Supplementary Materials

The following supporting information can be downloaded at https://www.mdpi.com/article/10.3390/su17062742/s1, Table S1: Overview of the six sites—all plastics.

Author Contributions

Conceptualisation, J.K.L. and T.-A.B.; methodology, J.K.L. and T.-A.B.; validation, T.-A.B.; formal analysis, J.K.L., G.H., P.T., G.S., C.B. (Cole Briggs) and C.B. (Ciarán Berry); investigation, J.K.L. and G.H.; data curation, J.K.L., G.H., P.T., G.S., C.B. (Cole Briggs) and C.B. (Ciarán Berry); writing—original draft preparation, J.K.L., S.B. and H.W.; writing—review and editing, J.K.L., S.B. and T.-A.B.; visualisation, T.-A.B.; supervision, T.-A.B.; project administration, J.K.L. and G.H.; funding acquisition, T.-A.B. All authors have read and agreed to the published version of the manuscript.

Funding

This research was funded by the Building Research Levy, granted by the Building Research Association of New Zealand (BRANZ), project number LR14389.

Institutional Review Board Statement

Not applicable.

Informed Consent Statement

Not applicable.

Data Availability Statement

The original contributions presented in this study are included in the article. Further inquiries can be directed to the corresponding author.

Acknowledgments

We would like to thank BRANZ and for their support and financial assistance from the Building Research Levy.

Conflicts of Interest

The authors declare no conflicts of interest. The funders had no role in the design of the study; in the collection, analyses, or interpretation of data; in the writing of the manuscript; or in the decision to publish the results.

References

  1. Santos, G.; Esmizadeh, E.; Riahinezhad, M. Recycling Construction, Renovation, and Demolition Plastic Waste: Review of the Status Quo, Challenges and Opportunities. J. Polym. Environ. 2024, 32, 479–509. [Google Scholar] [CrossRef]
  2. Laadila, M.A.; LeBihan, Y.; Caron, R.-F.; Vaneeckhaute, C. Physical and chemical characterization of construction, renovation and demolition waste in the Quebec province. Clean. Waste Syst. 2022, 1, 100002. [Google Scholar] [CrossRef]
  3. Albsoul, H.; Doan, D.T.; GhaffarianHoseini, A. Estimating construction waste in New Zealand: A focus on urban areas, residential and non-residential building activities. Environ. Res. Commun. 2024, 6, 035009. [Google Scholar] [CrossRef]
  4. Nelson, J.M.B.; Elliot, G.; Pickering, K.L.; Beg, M.D. Preliminary Materials Flow Analysis for Aotearoa New Zealand’s Building Construction Sector; Āmiomio Aotearoa—The University of Waikato: Hamilton, New Zealand, 2022. [Google Scholar]
  5. Rohani, M.; Huang, T.; Hoffman, L.; Roberts, M.; Ribero, B. Cost Benefit Analysis of Construction and Demolition Waste Diversion from Landfill: A Case Study Based on HLC Ltd Development in Auckland (Technical Report TR2019/009). Auckland Council. 2019. Available online: https://knowledgeauckland.org.nz/media/fxwbvcbl/tr2019-009-cba-on-waste-diversion-from-landfill-homes-land-community-auckland.pdf (accessed on 12 March 2025).
  6. Geyer, R.; Jambeck, J.R.; Law, K.L. Production, use, and fate of all plastics ever made. Sci. Adv. 2017, 3, e1700782. [Google Scholar] [CrossRef]
  7. Marston, N.; Jones, M. Weathering of Polymeric Materials in New Zealand; BRANZ Ltd.: Judgeford, New Zealand, 2007; Available online: https://www.branz.co.nz/pubs/research-reports/sr182/ (accessed on 29 January 2025).
  8. Ministry for the Environment. Targets in the New Zealand Waste Strategy: 2006 Review of Progress; ME 802; Ministry for the Environment: Wellington, New Zealand, 2007. Available online: https://environment.govt.nz/publications/targets-in-the-new-zealand-waste-strategy-2006-review-of-progress/ (accessed on 3 February 2023).
  9. Ratnasabapathy, S.; Perera, S.; Alashwal, A.; Lord, O. Assessment of Waste Generation and Diversion Rates in Residential Construction Projects in Australia. In Proceedings of the CIB World Building Congress 2019, Hong Kong, China, 17–21 June 2019; Available online: https://www.researchgate.net/publication/337721147 (accessed on 29 January 2025).
  10. Martínez Lage, I.; Martínez Abella, F.; Herrero, C.V.; Ordóñez, J.L.P. Estimation of the annual production and composition of C&D Debris in Galicia (Spain). Waste Manag. 2010, 30, 636–645. [Google Scholar] [CrossRef]
  11. Cochran, K.; Townsend, T.; Reinhart, D.; Heck, H. Estimation of regional building-related C&D debris generation and composition: Case study for Florida, US. Waste Manag. 2007, 27, 921–931. [Google Scholar] [CrossRef]
  12. Miliute-Plepiene, J.; Fråne, A.; Almasi, A.M. Overview of polyvinyl chloride (PVC) waste management practices in the Nordic countries. Clean. Eng. Technol. 2021, 4, 100246. [Google Scholar] [CrossRef]
  13. Ye, L.; Qi, C.; Hong, J.; Ma, X. Life cycle assessment of polyvinyl chloride production and its recyclability in China. J. Clean. Prod. 2017, 142, 2965–2972. [Google Scholar] [CrossRef]
  14. Nicholson, S.R.; Rorrer, N.A.; Carpenter, A.C.; Beckham, G.T. Manufacturing energy and greenhouse gas emissions associated with plastics consumption. Joule 2021, 5, 673–686. [Google Scholar] [CrossRef]
  15. Jankowska, E.; Gorman, M.R.; Frischmann, C.J. Transforming the Plastic Production System Presents Opportunities to Tackle the Climate Crisis. Sustainability 2022, 14, 6539. [Google Scholar] [CrossRef]
  16. Lamba, P.; Kaur, D.P.; Raj, S.; Sorout, J. Recycling/reuse of plastic waste as construction material for sustainable development: A review. Environ. Sci. Pollut. Res. Int. 2022, 29, 86156–86179. [Google Scholar] [CrossRef] [PubMed]
  17. Al-Sherrawi, M.H.; Edaan, I.M.; Al-Rumaithi, A.; Sotnik, S.; Lyashenko, V. Features of Plastics in Modern Construction Use. Int. J. Civ. Eng. Technol. (IJCIET) 2018, 9, 975–984. Available online: http://www.iaeme.com/ijciet/issues.asp?JType=IJCIET&VType=9&IType=4 (accessed on 1 February 2025).
  18. Jawaid, M.; Singh, B.; Kian, L.K.; Zaki, S.A.; Radzi, A.M. Processing techniques on plastic waste materials for construction and building applications. Curr. Opin. Green Sustain. Chem. 2023, 40, 100761. [Google Scholar] [CrossRef]
  19. Low, J.K.; Hernandez, G.; Berry, T.-A. Plastic waste characterisation to maximise landfill diversion from a New Zealand residential construction site. Front. Sustain. 2024, 5, 1455480. [Google Scholar] [CrossRef]
  20. Plastics, N.Z. Industrial & Commercial Recycling|Plastics New Zealand. Available online: https://www.plastics.org.nz/environment/recycling-disposal/industrial-recycling (accessed on 6 March 2025).
  21. Lahtela, V.; Hyvärinen, M.; Kärki, T. Composition of Plastic Fractions in Waste Streams: Toward More Efficient Recycling and Utilization. Polymers 2019, 11, 69. [Google Scholar] [CrossRef]
  22. Prestes, S.M.D.; Mancini, S.D.; Rodolfo, A.; Keiroglo, R.C. Construction and demolition waste as a source of PVC for recycling. Waste Manag. Res. 2012, 30, 115–121. [Google Scholar] [CrossRef]
  23. da Silva, L.P.; da Costa Marques Neto, J. Analysis and characterization of the Composition of construction waste in the city of Ribeirão Preto-SP. Gest. Prod. 2021, 28, e5237. [Google Scholar] [CrossRef]
  24. Katz, A.; Baum, H. A novel methodology to estimate the evolution of construction waste in construction sites | Elsevier Enhanced Reader. Waste Manag. 2011, 31, 353–358. [Google Scholar] [CrossRef]
  25. Llatas, C. A model for quantifying construction waste in projects according to the European waste list. Waste Manag. 2011, 31, 1261–1276. [Google Scholar] [CrossRef]
  26. Lu, W.; Yuan, H.; Li, J.; Hao, J.J.L.; Mi, X.; Ding, Z. An empirical investigation of construction and demolition waste generation rates in Shenzhen city, South China. Waste Manag. 2011, 31, 680–687. [Google Scholar] [CrossRef]
  27. Kim, Y.-C.; Zhang, Y.-L.; Park, W.-J.; Cha, G.-W.; Kim, J.-W.; Hong, W.-H. Analysis of Waste Generation Characteristics during New Apartment Construction—Considering the Construction Phase. Int. J. Environ. Res. Public Health 2019, 16, 3485. [Google Scholar] [CrossRef] [PubMed]
  28. Domingo, N.; Batty, T. Construction waste modelling for residential construction projects in New Zealand to enhance design outcomes. Waste Manag. 2021, 120, 484–493. [Google Scholar] [CrossRef] [PubMed]
  29. Wu, Z.; Yu, A.T.W.; Poon, C.S. An off-site snapshot methodology for estimating building construction waste composition—A case study of Hong Kong. Environ. Impact Assess. Rev. 2019, 77, 128–135. [Google Scholar] [CrossRef]
  30. Wang, Q.; Chen, L.; Hu, R.; Ren, Z.; He, Y.; Liu, D.; Zhou, Z. An empirical study on waste generation rates at different stages of construction projects in China. Waste Manag. Res. 2020, 38, 433–443. [Google Scholar] [CrossRef]
  31. Li, L.; Zuo, J.; Du, L.; Chang, R. What influences the on-site recycling behaviour of C&D plastic waste in Australia? An action determination model approach. J. Environ. Manag. 2024, 371, 123158. [Google Scholar] [CrossRef]
  32. González Pericot, N.; Villoria Sáez, P.; Del Río Merino, M.; Liébana Carrasco, O. Production patterns of packaging waste categories generated at typical Mediterranean residential building worksites. Waste Manag. 2014, 34, 1932–1938. [Google Scholar] [CrossRef]
  33. González Pericot, N.; Del Río Merino, M. Management of Waste from Packaging of Construction Materials in Building Construction Works. Open Constr. Build. Technol. J. 2011, 5, 149–155. [Google Scholar] [CrossRef]
  34. Chauhan, K.; Peltokorpi, A.; Seppänen, O. Analysing Film Plastic Waste in Residential Construction Project. In Proceedings of the 31st Annual Conference of the International Group for Lean Construction (IGLC 31), Lille, France, 26 June–2 July 2023; pp. 509–520. [Google Scholar] [CrossRef]
  35. Berry, T.-A.; Low, J.K.; Wallis, S.L.; Kestle, L.; Day, A.; Hernandez, G. Determining the Feasibility of a Circular Economy for Plastic Waste from the Construction Sector in New Zealand. IOP Conf. Ser. Earth Environ. Sci. 2022, 1122, 012002. [Google Scholar] [CrossRef]
  36. Hernandez, G.; Low, J.; Nand, A.; Bu, A.; Wallis, S.L.; Kestle, L.; Berry, T.-A. Quantifying and managing plastic waste generated from building construction in Auckland, New Zealand. Waste Manag. Res. 2023, 41, 205–213. [Google Scholar] [CrossRef]
  37. Jonsson, R. Prospects for Timber Frame in Multi-Storey House Building in England, France, Germany, Ireland, the Netherlands and Sweden; Växjö University: Växjö, Sweden, 2009; Available online: https://www.academia.edu/53904984/Prospects_for_timber_frame_in_multi_storey_house_building_in_England_France_Germany_Ireland_the_Netherlands_and_Sweden (accessed on 8 December 2023).
  38. Navaratnam, S.; Humphreys, M.; Mendis, P.; Nguyen, K.T.Q.; Zhang, G. Effect of roof to wall connection stiffness variations on the load sharing and hold-down forces of Australian timber-framed houses. Structures 2020, 27, 141–150. [Google Scholar] [CrossRef]
  39. Villoria Sáez, P.; del Río Merino, M.; San-Antonio González, A. Success Strategies for On-Site Waste Management in Spanish Construction Sites. In Proceedings of the Construction and Building Research; Llinares-Millán, C., Fernández-Plazaola, I., Hidalgo-Delgado, F., Martínez-Valenzuela, M.M., Medina-Ramón, F.J., Oliver-Faubel, I., Rodríguez-Abad, I., Salandin, A., Sánchez-Grandia, R., Tort-Ausina, I., Eds.; Springer: Dordrecht, The Netherlands, 2014; pp. 19–25. [Google Scholar]
  40. Arshad, H.; Qasim, M.; Jamaluddin Thaheem, M.; Gabriel, H.F. (PDF) Quantification of Material Wastage in Construction Industry of Pakistan: An Analytical Relationship between Building Types and Waste Generation. J. Constr. Dev. Ctries. 2018, 22, 19–34. [Google Scholar] [CrossRef]
  41. Yuan, H.; Lu, W.; Jianli Hao, J. The evolution of construction waste sorting on-site. Renew. Sustain. Energy Rev. 2013, 20, 483–490. [Google Scholar] [CrossRef]
  42. Islam, R.; Nazifa, T.H.; Yuniarto, A.; Shanawaz Uddin, A.S.M.; Salmiati, S.; Shahid, S. An empirical study of construction and demolition waste generation and implication of recycling. Waste Manag. 2019, 95, 10–21. [Google Scholar] [CrossRef] [PubMed]
  43. Ministry for the Environment. Four New Plastic Innovation Fund Initiatives Announced. Available online: https://environment.govt.nz/news/four/ (accessed on 5 March 2025).
  44. BRANZ. About Us. Available online: https://www.branz.co.nz/about/ (accessed on 5 March 2025).
  45. Ministry for the Environment. Waste Disposal Levy Expansion. Available online: https://environment.govt.nz/what-government-is-doing/areas-of-work/waste/waste-disposal-levy/expansion/ (accessed on 13 February 2025).
  46. New Zealand Government. Building Act Changes Put the Environment at the Heart of How We Build. Available online: https://www.beehive.govt.nz/release/building-act-changes-put-environment-heart-how-we-build (accessed on 6 March 2025).
  47. New Plymouth District Council. Construction Waste Reduction Plan: A Guide. Available online: https://www.npdc.govt.nz/zero-waste/waste-minimisation/waste-minimisation-at-work/construction-waste/#:~:text=NPDC%20Construction%20Waste%20Reduction%20Plan%20%E2%80%93%20a%20requirement%20for%20commercial%20building%20projects&text=From%20August%202021%2C%20anyone%20applying,Plan%20to%20NPDC%20for%20approval (accessed on 4 October 2024).
  48. Wellington City Council. Solid Waste Management and Minimisation Bylaw 2020. Available online: https://wellington.govt.nz/your-council/plans-policies-and-bylaws/bylaws/solid-waste-bylaw-2020 (accessed on 4 October 2024).
  49. Li, Y.; Zhang, X.; Ding, G.; Feng, Z. Developing a quantitative construction waste estimation model for building construction projects. Resour. Conserv. Recycl. 2016, 106, 9–20. [Google Scholar] [CrossRef]
  50. Carpio, M.; Roldán-Fontana, J.; Pacheco-Torres, R.; Ordóñez, J. Construction waste estimation depending on urban planning options in the design stage of residential buildings. Constr. Build. Mater. 2016, 113, 561–570. [Google Scholar] [CrossRef]
Figure 1. Plastic waste over four sites (excluding Sites 3 and 6) (a) by mass and (b) volume.
Sustainability 17 02742 g001
Figure 2. Waste polymer type over four sites (excluding Sites 3 and 6) by mass.
Sustainability 17 02742 g002
Figure 3. Main functions of plastic waste (excluding Sites 3 and 6) by mass.
Sustainability 17 02742 g003
Figure 4. Plastic waste generation for each construction stage (excluding ‘NA’ plastics).
Sustainability 17 02742 g004
Table 1. Characteristics of the six study sites.
Site 1Site 2Site 3Site 4Site 5Site 6
Building Type Institutional:
school gym + teaching block, multiple storeys
Residential: terraced houses, two to three storeys Residential: detached house, single-storey Residential:
42-unit apartment block, three storeys
Institutional: extension of hospital building, four storeys Institutional: school classroom teaching block, three storeys
Construction TimeframeLate 2020–
Late 2022
September 2021–September 2022February 2022–
November 2022
Mid 2022–
Late 2023
Late 2022–Mid 2024Early 2023–October 2024
Number of unitsGym and
classrooms
814215 beds, consulting rooms, 3 procedure rooms, endoscopy suite30 classrooms
Table 2. Overview of the six sites.
Site 1Site 2Site 3 *Site 4Site 5Site 6 *
DescriptionSchool gym + teaching block constructionResidential—terraced houses, 8 unitsResidential—single-storey, detached houseResidential—42-unit apartment blockHospital Building—4-storey blockSchool building—3-storey classroom block
Size (m2)4800857239240045003224
All plastic waste (kg)76972520 *17083140843 *
% Plastic waste reused/recycledNA *66% (wt.)
481 kg
25% (wt.)
5 kg *
62% (wt.)
1065
80% (wt.)
2515 kg
45% (wt.)
378 kg
Plastic WGR (kg/m2)0.160.850.08 *0.710.700.26 *
Plastic % of total waste0.41%3.23%1.76% *1.98%1.70%0.52%
Soft plastic WGR (kg/m2)0.020.32NA0.110.250.08
* Dataset was incomplete.
Table 3. Overview of the six sites—main plastic waste streams (excluding Sites 3 and 6) **.
Plastic TypeSite 1
Mass (kg)
Site 2
Mass (kg)
Site 4
Mass (kg)
Site 5
Mass (kg)
Grand Total (kg)
TotalLRTotalLRTotalLRTotal
Soft plastic (LDPE)80.9
(11%)
55.5214.5270
(37%)
99.6509.6609.2
(36%)
87.51056.81144.3
(36%)
2363.1
(33%)
Pipes (HDPE and PVC)58.1
(8%)
0.6156.2156.8
(22%)
8.4358.1366.5
(21%)
99.3700.0799.3
(25%)
1394.6
(19%)
Shrink wrap (LDPE)20.6NANANANANANA70.0642.3712.3
(23%)
732.9
(10%)
Woven plastic
(LDPE and PP)
2.015.2NA15.2133.5NA133.5
(8%)
45.6NA45.6400.6
(6%)
Misc227.9
(30%)
NANANA10.7NA10.743.9NA43.9360.2
(5%)
Expanded
polystyrene (EPS)
17.9NA94.994.9
(13%)
NA52.952.925.8113.8139.6
(4%)
327.1
(5%)
Grand
Total
769.1243.8481.2725.1642.71065.21707.9624.92515.33140.27205.2
** L = landfilled; R = reused or recycled. (Percentages of total site plastic waste are shown in brackets).
Disclaimer/Publisher’s Note: The statements, opinions and data contained in all publications are solely those of the individual author(s) and contributor(s) and not of MDPI and/or the editor(s). MDPI and/or the editor(s) disclaim responsibility for any injury to people or property resulting from any ideas, methods, instructions or products referred to in the content.

