Abstract
Efficiency assessment is a pivotal instrument in the pursuit of sustainable operations. It is imperative to evaluate government-funded afforestation initiatives to ensure the optimal utilisation of resources, thereby enhancing sustainability. In this study, a framework for measuring afforestation efficiency at the sub-compartment scale was established based on a Bootstrap-modified Data Envelopment Analysis (DEA) model. The empirical study included 48 afforestation sub-compartments from six districts involved in the Beijing Plains Afforestation Project. The results of the study indicate that the efficiency of the afforestation sub-compartment has much room for improvement and significant individual differences. The mean scores for comprehensive efficiency, pure technical efficiency, and scale efficiency of the sample sub-compartments were 0.646, 0.664, and 0.973, respectively. Compared to the pure technical efficiency, the scale efficiency is higher. Notably, prioritising native or climate-resilient species, adopting long-term ecological maintenance protocols, and fostering financially self-sustaining mechanisms were identified as key drivers for boosting efficiency. These findings underscore the need to embed sustainability principles—including resource optimisation and economic viability—into afforestation planning and governance to strengthen ecological restoration resilience and long-term project continuity.
1. Introduction
Land use has changed significantly due to urbanisation, thereby impacting ecosystem structures, patterns, and functions [1]. Regions with high levels of urbanisation and population density often face more prominent ecological and environmental problems, such as air pollution, urban waterlogging, and the heat island effect [2]. Urban forests provide various ecosystem services to city dwellers, such as reducing storm runoff, carbon sequestration, improving air quality, and weakening the urban heat island effect. They also play an important role in alleviating the environmental pressures brought about by urban expansion and social development, as well as improving the urban ecological carrying capacity and the urban living environment [3,4]. For megalopolises, such as New York, Los Angeles, Shanghai, and Beijing, municipal tree planting has become a sustainable development strategy to increase ecological products and remediate ecological environmental problems [5,6,7,8].
The Beijing Plain Afforestation (BPA) project was initiated in 2012 and aims to improve the quality of the ecological environment. From 2012 to 2017, the project has implemented 78 thousand hectares of plain afforestation, with more than 61 million trees being planted. The forest coverage rate in the Beijing Plain has consequently increased from 14.85% to 27.8% due to afforestation projects, and they have also significantly improved the urban ecological carrying capacity and urban ecological functions and aided the development of suburban forest patterns around cities. The ecological benefits of the BPA, such as PM2.5 particle reduction, carbon sequestration, and the reduction of regional runoff, have been widely studied [9,10,11].
In the case of government-funded afforestation initiatives such as the BPA, it is insufficient to merely evaluate the advantages, as this does not assist public departments in making informed decisions [12]. Prior studies have established a framework that can be used to assess the net benefit of afforestation projects in terms of both cost and benefit [1,6,12]. These assessments encompass the calculation of various costs associated with urban trees, as well as the annual flow of environmental, social, and ecological services provided by trees, which are considered a benefit of afforestation [13,14]. Although resource inputs were considered in these evaluations, previous studies have not focused on the resource utilisation efficiency of afforestation projects.
Efficiency refers to the degree of resource utilisation and goal realisation with given inputs and technological conditions, including technical and resource allocation efficiencies [15]. This is represented by the ratio between the input and output. The ideal output combination is obtained by using the best combination of input factors. Previous studies have compared forestry productivity in different regions [16,17], whereas others have evaluated the operational efficiency of forest management entities, such as public forestry organisations, forest farms, and family farms [18,19]. The definition of input and output is the basis of efficiency studies, and when using the production function model, the input variables can be attributed to land, capital, and labour [16,19]. The output variables of forestry systems are more diverse, and the gross output values for forestry, planted area, and forestry value-added are often used to measure regional forestry productivity [16], whereas total income is used as the output variable for private forestry entities [19]. Comprehensive output variables, including economic, ecological, and social factors, are often used in forestry efficiency research [20]. Although variable systems are diverse, those selected in research studies tend to be consistent with the operational objectives of forestry entities.
Urban afforestation should be approached in a sustainable and efficient manner, including reasonable planning of the afforestation area, the adoption of appropriate afforestation technology, and the planning of a reasonable afforestation scale. The evaluation of afforestation efficiency can measure the implementation effect of afforestation projects and determine the most effective management measures under specific ecological conditions [17]. For the BPA, the landscaping management agency of each administrative district runs the afforestation initiative, and their responsibilities include afforestation planning and design, fund management, services procurement, planting supervision, inspection, acceptance, and tree maintenance. In this study, we defined afforestation efficiency as the performance of the organisation, management, and resource utilisation of afforestation projects by landscaping management agencies, and explored whether public forestry organisations used their resources effectively. The purpose of this study was to provide a theoretical basis by which to improve the management performance and sustainability of afforestation projects.
2. Materials and Methods
2.1. Analytical Framework
Government-funded afforestation is a multi-input, multi-output process. In this study, we defined the resources utilised for the BPA as afforestation inputs and the benefits provided by forests were defined as afforestation outputs. As sub-compartments are the basic unit used for the BPA and sub-compartment-scale tasks are used for management by landscaping management agencies, the performance of the BPA is essentially determined by the resource utilisation efficiency of each afforestation sub-compartment. Therefore, the afforestation sub-compartment of the BPA was treated as a decision-making unit (DMU) in this study. From the perspective of managers, land and funds are the main resource inputs of the DMU, and the consumption of afforestation resources, such as labour, seedlings, machinery, and materials, can be attributed to afforestation expenses. As the primary objective of the BPA is to cultivate a stable urban forest ecosystem and augment the ecological benefits of the city, the ecological products such as carbon sequestration, runoff reduction, pollutant removal, and climate regulation are selected as afforestation outputs. In addition to technical and managerial factors such as planning, design, planting, and maintenance, the growing process of trees and the ecological products they provide are affected by environmental variables such as the natural conditions and residents’ activities [21,22]. Based on the above analysis, an efficiency analytical framework for the afforestation sub-compartment was constructed (Figure 1).
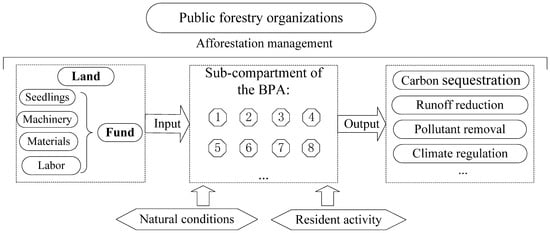
Figure 1.
Efficiency analytical framework for afforestation sub-compartment.
2.2. Methods
2.2.1. Bootstrap–DEA Model
A DEA model evaluates the relative effectiveness of the same type of DMUs according to the input and output variables [23]. DEA result indicators mainly include comprehensive efficiency (CE), pure technical efficiency (PTE), and scale efficiency (SE), of which CE reflects the production efficiency of the input factors of each decision-making unit in the optimal scale and is a comprehensive measure and evaluation of the ability of decision-making units in various aspects, such as resource allocation level and utilisation efficiency. A value of 1 indicates the DMU is on the production frontier. PTE reflects the decision-making unit, management, and technical level of production efficiency. SE reflects the decision-making unit and the scale of factors related to the production efficiency. CE, PTE, and SE function within the following relationship:
CE = PTE × SE
Given that the efficiency scores estimated by DEA come from a limited sample of observations, the estimated results are subject to the interference of random factors and are susceptible to extreme values. Therefore, the DEA method may lead to biased efficiency evaluations under the influence of small samples or random factors, while ignoring the problem of statistical inference. Based on this, Simar and Wilson proposed a Bootstrap–DEA model based on Bootstrap bias correction from the data generation process [24]. The basic idea of the Bootstrap–DEA method is to simulate the original sample data numerically and to calculate the DEA efficiency for a large number of simulated samples generated. The estimation process is as follows.
- (1)
- Take the original input and output data as the initial sample of Bootstrap–DEA, and for each decision-making unit DMUk (k = 1, 2, …, n), calculate the efficiency scores using the DEA method.
- (2)
- Based on the efficiency score (k = 1, 2, …, n), a Naive Bootstrap sample of size n is drawn using the repeated sampling method, where b denotes the bth repeated sampling using the Bootstrap method.
- (3)
- The samples obtained from the plain Bootstrap are smoothed by using the kernel density estimation method to obtain and correct the input index (k = 1, …, n) of the original samples based on the Smoothing Bootstrap to obtain the adjusted (k = 1, …, n):Next, recalculate the efficiency scores using the DEA methodology based on the Bootstrap-adjusted input data and initial output data as a new sample:
- (4)
- Repeat steps (2) and (3) to obtain a series of efficiency scores and calculate the deviation of the corrected efficiency scores , the corrected efficiency scores , and their confidence intervals for each DMU (k = 1, …, n) with the following expressions:The confidence intervals for the level of the corrected DEA efficiency scores are:
2.2.2. Explaining Efficiency
The Bootstrap–DEA method corrects the measured efficiency scores, avoids the bias of small samples, and gives its confidence intervals. However, it cannot explain the cause of inefficiency. The efficiency scores obtained by the DEA belong to the interval (0, 1), some of which are concentrated in the upper bound, and the standard regression analysis will lead to a biased estimate [18]. Therefore, to explain the observed efficiency scores, a Tobit model was established to conduct a regression analysis between the comprehensive efficiency scores and factors that might affect the performance of the afforestation sub-compartments.
where is the latent variable, is the observed dependent variable, is the independent variable, is the correlation coefficient, and is the interference term, which follows the normal distribution.
2.3. Variable Definitions
Based on the efficiency analytical framework, afforestation area and total expenses were selected as input variables, whereas carbon sequestration, runoff reduction, pollutant removal, and climate regulation were selected as output variables. Pollutant removal was measured as the sum of the CO, NO2, O3, SO2, PM2.5, and PM10 removed by the afforestation sub-compartment in a year. The afforestation efficiency of the sub-sequestration is affected by the external environmental conditions and also depends on its planning and design, maintenance, and management. Because the BPA is implemented in plain areas, there is no difference in slope or slope direction, and the differences in natural conditions are mainly reflected in precipitation, sunshine, and air quality. Moreover, as the distribution of residents on the Beijing Plain is concentrated, the degree of disturbance to planted forests is related to the activity intensity of the surrounding residents [21,25]. Therefore, we chose air quality (AQ), annual precipitation (AP), sunshine hours (SH), human activity intensity (HAI), afforestation density (lnAD), number of tree species (NTS), proportion of native trees (PNT), maintenance standard (MS), and proportion of local subsidies (PLS) as independent variables to identify and analyse the main influences affecting afforestation efficiency (Table 1).

Table 1.
Variable systems used to determine afforestation efficiency.
2.4. Research Samples and Data
The BPA was carried out intensively in 2013–2014, mainly planting trees in cultivated land, wasteland, and abandoned sand pits on the plain. Tongzhou, Daxing, Shunyi, Fangshan, Changping, and Yanqing are the six administrative regions in Beijing with the largest afforestation areas, and eight afforestation sub-compartments were selected from each for this study. The screening conditions for sub-compartment selection included: afforestation in 2013, classified as having plain fertile soil, ecological commonweal forest afforestation, and a farmland land type prior to afforestation. A total of 48 afforestation sub-compartments were selected from which to obtain research samples and data (Figure 2).
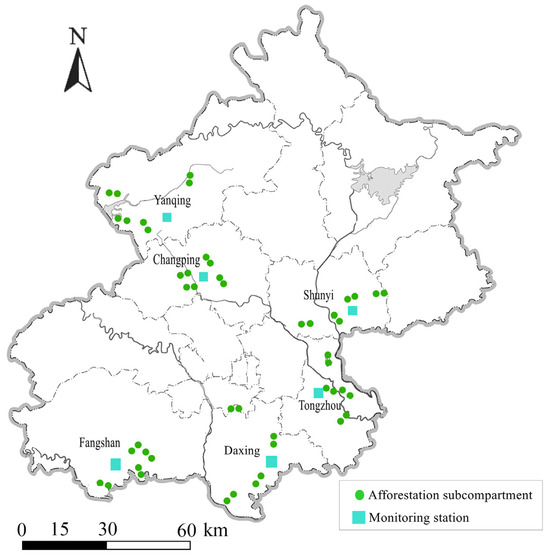
Figure 2.
Locations of the sub-compartments from which samples were obtained for this study and monitoring stations.
We conducted an interview survey with the landscaping management agency of each sub-compartment to grasp the specific information, including afforestation area, total expenses, proportion of local subsidies, maintenance standards, afforestation density, and tree species composition and numbers, all of which were verified through reviews of design proposals and field investigations. In addition, field investigations were conducted in the sample sub-compartments from June to August of 2018 to 2020. For tree species with more than 40 trees in each afforestation sub-compartment, 20 m × 20 m quadrats were arranged, and each tree in the quadrat was investigated and recorded, including tree species, diameter at breast height (DBH), tree height, crown size, crown health, and crown light exposure.
The output variable was computed by the i-Tree Eco, based on the recorded location data of the study area (including longitude, latitude, climate type, etc.), tree-specific information (such as tree species, DBH, height, crown width, health status, etc.), and local environmental data (including hourly meteorological data, air pollution concentration data, etc.) obtained from the monitoring station of each administration district (Figure 2). Input and interpretation variable data were collected from the interviews, surveys, and design proposals. In addition, sunshine hour data were obtained from the statistical yearbook of each administrative district. Human activities intensity data were obtained from the research results of Hu et al. [25] and are represented by HAI = population density (settlements + roads), where the values of settlements and roads are assigned according to the research of Hu et al. [25] and population density refers to the population density of the towns where the sub-compartments are located.
The precondition for using a DEA model is that input and output variables are positively correlated. Since the input and output variables of the sub-compartments are not normally distributed, a Spearman correlation analysis was used to test the correlation between input and output variables on the basis of verifying the monotonicity of input and output variables (Table 2). There is a significant positive correlation between the input variables and output variables, and as verified by a two-tail test at the significance level of 1%, the variables meet the requirements of DEA model. According to the original DEA calculated using MaxDEA 9.0, the number of iterations of Bootstrap self-sampling was set to 2000 and the upper and lower confidence intervals were set to 95%. We then computed the afforestation efficiency of the sub-compartments using a variable-scale smoothed Bootstrap–DEA.
Table 2.
Spearman correlation test results of input and output variables.
3. Results
3.1. Efficiency Analysis
As illustrated in Table 3, a comparison was made between the results of the original DEA analyses and those derived from the Bootstrap–DEA. The mean comprehensive efficiency score calculated by the original DEA model was 0.715, with 7 DMUs classified as fully efficient (score = 1). However, after bias correction, the mean comprehensive efficiency decreased to 0.646, and no DMUs retained full efficiency (maximum score = 0.901). The mean reduction of the comprehensive efficiency score following Bootstrap correction was 9.65%, and 14.58% of the afforestation sub-compartments were adjusted from effective (CE = 1) to non-effective (CE < 1). The mean score of pure technical efficiency estimated by the original DEA was 0.752, indicating that DMUs can achieve 75.2% of the desired output on average under the current management level. However, the mean score of pure technical efficiency corrected by the Bootstrap–DEA decreases to 0.664, indicating that original DEA overestimates the technical and managerial efficiency by about 11.7%. The mean score of scale efficiency calculated by the original DEA model is 0.950, which is close to 1, indicating that the overall size of DMUs is close to optimal. The mean score of scale efficiency corrected by the Bootstrap–DEA rises to 0.973, which further confirms that scale efficiency is high.
Table 3.
Comparison of the initial and final DEA results.
According to the efficiency scores from the Bootstrap–DEA, 48 afforestation sub-compartments were divided into four types based on their pure technical efficiency and scale efficiency scores, with a boundary of 0.8 (Figure 3). Quadrant I signifies the presence of 13 afforestation sub-compartments that exhibit pure technical efficiency and scale efficiency values greater than 0.8. These sub-compartments are characterised by the implementation of advanced management techniques and the utilisation of optimal land and capital scales. Conversely, Quadrant II signifies that there are 32 afforestation sub-compartments with low pure technical efficiency and high scale efficiency. These sub-compartments exhibit near-optimal scale efficiency (mean value of SE = 0.951), yet they demonstrate relatively lax management (mean value of PTE = 0.627). Quadrant IV signifies the presence of a single sub-compartment characterised by high pure technical efficiency and low scale efficiency. This sub-compartment employs optimal management techniques, yet its input scale is deemed unreasonable, likely attributable to the relatively modest size of the plot (0.77 hm2), which hinders the effective distribution of fixed costs. Quadrant III reveals two sub-compartments exhibiting pure technical efficiency and scale efficiency below 0.8. These sub-compartments are identified as management and scale failures within these specific sub-compartments.
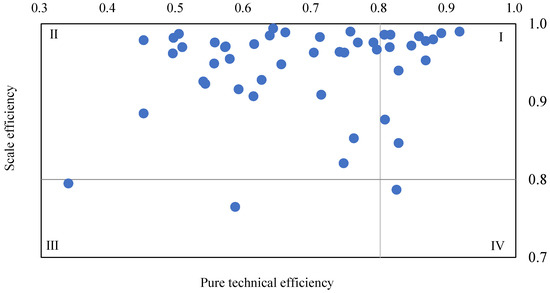
Figure 3.
Distribution of pure technical efficiency and scale efficiency scores for the sub-compartments.
Figure 4 shows that there are differences in the comprehensive efficiency of afforestation sub-compartments in six administrative districts in Beijing. According to the original DEA results, the Fangshan District had the highest median efficiency (0.742), followed by the Daxing District (0.727) and the Yanqing District (0.718). The Shunyi District had the lowest efficiency (median 0.607), but the interquartile range (IQR: 0.523–0.692) was relatively small, suggesting that there is little difference in sub-compartment efficiency within the region. The distribution of afforestation sub-compartment efficiencies corrected by Bootstrap eliminated extreme outliers, the distribution of efficiencies in each administrative region was more centralised, and the stability of the results was improved after correcting the bias. According to the Bootstrap–DEA results, the median efficiencies of all of the administrative regions were corrected downward, but the median ranking of each administrative region did not change, and it was still Fangshan > Daxing > Yanqing > Tongzhou > Changping > Shunyi.
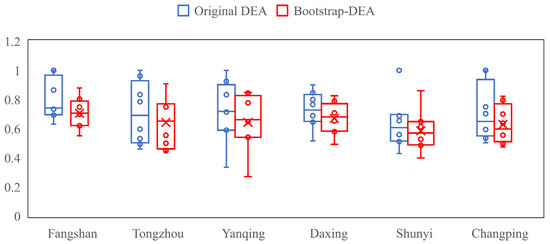
Figure 4.
Comparison of the comprehensive efficiency scores of afforestation sub-compartments in six administrative districts.
3.2. Explaining the Differences in Efficiency
The regression coefficients of the maintenance standards, proportion of native tree species, and proportion of local subsidies were positive and statistically significant, while the regression coefficients of afforestation density, number of tree species, annual precipitation, sunshine hours, air quality, and human activity intensity were not significant (see Table 4). The regression results indicated that the efficiency of sub-compartments was mainly affected by technical and management factors, the enhancement of the tree maintenance standards, and the proportion of native tree species. The proportion of local subsidies had a favourable impact on afforestation efficiency. Conversely, non-management factors, including sunshine, precipitation, air quality, and human activities, were found to have less significant effects on afforestation efficiency.
Table 4.
Estimated results for the Tobit composite efficiency model.
4. Discussion
The DEA model has been extensively utilised in efficiency evaluation studies of forestry management entities and regional forest industries. However, the estimation of efficiency scores measured by the original DEA is derived from limited observation samples, resulting in outcomes that are vulnerable to random factors and extreme values, which may lead to biased efficiency evaluations. To enhance the reliability of the efficiency assessment of afforestation sub-compartments, the Bootstrap method was employed to correct the original efficiency assessment results by calculating the efficiency scores of a large number of simulated samples. The results demonstrate that the decline in the mean score of the comprehensive efficiency of afforestation sub-compartments post-Bootstrap correction signifies the presence of systematic overestimation in the original DEA [24]. The corrected maximum efficiency score was found to be significantly lower than 1, suggesting that the actual comprehensive efficiency of the “frontier unit” in the original DEA may have been overestimated. This is due to the failure to account for the uncertainty in the frontier surface estimates, resulting in the identification of “spuriously efficient units”.
Results showed that the maintenance standard, proportion of local tree species, and proportion of local support subsidies were closely related to the efficiency score, which was in line with expectations. Although Beijing has issued unified technical afforestation regulations and acceptance standards for the BPA, the standards and tasks for tree maintenance by various district landscaping management agencies are inconsistent. Previous studies have shown that the ecological benefits of trees, such as reducing runoff and purifying air, are related to their growth status and health [26,27,28]. Maintenance measures, such as tree shaping and pruning, pest control, forest land inspection, and fire prevention promote forest growth and ecological health and have a positive impact on tree growth, carbon storage, and sequestration [29]. The formation of native tree species is a long-term evolutionary process that adheres to the natural growth patterns observed in forest ecosystems. These species have demonstrated resilience through prolonged exposure to natural selection and competition, and have evolved to adapt effectively to their local soil and climatic conditions [30]. The survival rate of trees planted in afforestation sub-compartments with a higher proportion of native species is higher than in those planted with exotic species. Furthermore, the growth status and ecological function of native trees are often superior to those of exotic species. Consequently, the input-output efficiency of afforestation is greater when native species are used. Moreover, funding is the basis for implementing afforestation projects. In addition to the afforestation funds allocated by Beijing, each district must invest in supporting subsidies for the BPA. To a certain extent, the proportion of capital investment reflects the support and guarantee of each district for afforestation projects, and self-raised funds have greater flexibility in expenditure, which helps improve organisational vitality and management performance.
The findings of this study indicate that there is an absence of a statistically significant correlation between afforestation density, the number of tree species, precipitation, sunshine duration, air pollutant concentration, the intensity of human activities, and efficiency scores. This may be attributed to the fact that the planting density of the BPA is primarily determined in accordance with the coverage requirement and characteristics of the tree species. The current sample density range (500–800 plants/ha) is close to the optimal interval, and the marginal effect tends to zero. Furthermore, to ensure effective afforestation and the provision of adequate shade by the plantation, some sub-compartments designated for tree planting were planted with the same species in either 4 × 4 or 3 × 3 row spacing. This resulted in the narrow-crowned trees exhibiting a higher density, with an excessive pursuit of survival and shade functions. This, in turn, led to an irrational stand structure, the slow growth of trees, and the low resistance of forest land, which in turn restricts the realisation of the ecological benefits of forests. This may explain why afforestation density and the number of tree species had no significant effect on efficiency. Previous studies have suggested that non-environmental factors, such as precipitation, sunshine duration, and air pollutant concentration affect the ecological benefits of trees [7,28]. However, the present study demonstrated that these factors do not exert a significant influence on afforestation efficiency. Although meteorological and air pollutant data recorded at monitoring stations in various administrative districts did vary, the study area generally exhibited favourable environmental conditions. With teams responsible for the maintenance of each afforestation sub-compartment, natural factors are weak constraints on afforestation efficiency and are not the main variables dominating the efficiency scores of the sub-compartments.
Urban forests have the potential to offer recreational opportunities to urban residents, and the aspects of recreation and landscape aesthetics are significant components of the value of urban forests [31]. Studies using a hedonic pricing or willingness-to-pay method suggest afforestation may generate additional welfare gains [32,33]. However, given that the BPA primarily implements urban forestation based on ecological functions and that the samples in this study were concentrated in remote suburban ecological forest areas, the planning and design of which focused on ecological services such as carbon sequestration and pollution blocking while generally lacking recreational service carriers such as walking paths and recreational facilities, the full release of the recreational service functions of the sample sub-compartments was observed. Consequently, this study primarily measured the afforestation efficiency by ecological efficiency indicators such as carbon sequestration and air pollutant removal. It has been recognised that residential activities affect tree growth and its ecological service provision [21,22]. However, the effects of human activity intensity on afforestation efficiency in this study was not significant. This may be due to the dual role of human activities on eco-efficiency, both in terms of potential trampling damage and community stewardship involvement. In the future, Beijing plans to design and construct afforestation plots adjacent to the village centre area according to the park model, with the aim of enhancing the forest landscape and installing additional resting seats and recreational trails [8]. The efficiency assessment of the BPA should expand the indicator dimensions to include social indicators such as the enhancement of residents’ well-being and cultural service provision [34] so as to provide scientific decision support for urban green space planning.
5. Conclusions
By assessing the afforestation efficiency of the BPA sub-compartments, we determined that Bootstrap has a corrective effect on the systematic overestimation present in the original DEA. Following the implementation of the Bootstrap correction, the mean scores for comprehensive efficiency, pure technical efficiency, and scale efficiency for the sample sub-compartments were 0.646, 0.664, and 0.973, respectively. Given the spatial heterogeneity and individual differences in the efficiency scores of the sample sub-compartments, it is recommended that sub-compartments with leading technical efficiency and appropriate land and capital scales should be used as demonstration cases to promote management experience. Sub-compartments with near-optimal scale efficiency but sloppy management should be upgraded on the basis of maintaining stable scales in terms of technology and management. Sub-compartments that demonstrate excellent management technology but unreasonable input scales should be promoted to merge the operations of neighbouring sub-compartments to expand scale efficiency. Sub-compartments that exhibit both management and scale failures should be addressed to enhance stand productivity, and dynamic monitoring and response should be strengthened.
It is recommended that forest management agencies carry out long-term and continuous forest monitoring, implement fine conservation, and set conservation standards at a hierarchical level. The agencies should develop the understory economy and, on the premise of not interfering with the healthy growth of trees and the normal performance of forest ecological functions, moderately carry out understory economic activities such as understory planting, forest tourism, recreation and leisure, science popularisation and education, and forest product collection, etc. Agencies should furthermore establish subsidy-performance linkage systems to provide incentives for significant performance improvement and to reduce subsidies for sub-compartments with persistently low performance to force rectification.
Author Contributions
Study conception and design: Y.W., J.J. and B.C.; data collection: Y.W., J.J. and B.C.; analysis and interpretation of results: Y.W., J.J. and B.C.; draft manuscript preparation: Y.W., J.J. and B.C. All authors have read and agreed to the published version of the manuscript.
Funding
This research was funded by Investigation and Monitoring of the Effectiveness of Ecological Forest Management and Protection in Forest Restoration in Beijing, China, grant number 2024-LYZ-02.
Institutional Review Board Statement
Not applicable.
Informed Consent Statement
Not applicable.
Data Availability Statement
The data that support the findings of this study are available from the corresponding author, upon reasonable request.
Conflicts of Interest
The authors declare no conflicts of interest.
References
- McPherson, E.G.; Simpson, J.R.; Xiao, Q.; Wu, C. Million trees Los Angeles canopy cover and benefit assessment. Landsc. Urban Plan. 2011, 99, 40–50. [Google Scholar] [CrossRef]
- Alberti, M.; Susskind, L. Managing urban sustainability: An introduction to the special issue. Environ. Impact Assess. Rev. 1996, 16, 213–221. [Google Scholar] [CrossRef]
- Escobedo, F.J.; Kroeger, T.; Wagner, J.E. Urban forests and pollution mitigation: Analyzing ecosystem services and disservices. Environ. Pollut. 2011, 159, 2078–2087. [Google Scholar] [CrossRef] [PubMed]
- Moffat, A.J. Communicating the benefits of urban trees: A critical review. Arboricult. J. 2016, 38, 64–82. [Google Scholar] [CrossRef]
- Pincetl, S. Implementing municipal tree planting: Los Angeles Million-Tree initiative. Environ. Manag. 2010, 45, 227–238. [Google Scholar] [CrossRef]
- Jones, B.A.; McDermott, S.M. The economics of urban afforestation: Insights from an integrated bioeconomic-health model. J. Environ. Econ. Manag. 2018, 89, 116–135. [Google Scholar] [CrossRef]
- Cao, H.; Yin, S.; Zhang, X.; Xiong, F.; Zhu, P.; Liu, C. Modeled PM2.5 removal by Urban Forest in Shanghai. J. Shanghai Jiaotong Univ. (Agric. Sci.) 2016, 34, 76–83. (In Chinese) [Google Scholar] [CrossRef]
- Wang, Y. Study on the promotion strategy of plain afforestation landscape in Daxing District from the perspective of landscape architecture. For. Resour. Manag. 2022, 6, 37–43. (In Chinese) [Google Scholar] [CrossRef]
- Chen, L.; Liu, C.; Pan, T.; Chen, C.; Li, Z.; Wang, H.; Pei, X.; Sun, L. Assessment of the effect of PM2.5 reduction by plain afforestation project in Beijing based on dry deposition model. Chin. J. Ecol. 2014, 33, 2897–2904. (In Chinese) [Google Scholar] [CrossRef]
- Yu, H. Carbon accounting for afforestation project in the pain area of Beijing: A case study of Eastern Suburb Forest Park, Beijing. Ecol. Econ. 2022, 38, 110–115. (In Chinese) [Google Scholar]
- Lü, Y.; Wang, Y.; Zheng, X. Influence of forest landscape pattern on flood mitigation in Beijing Plain based on SWAT model. Acta Ecol. Sin. 2021, 41, 4036–4051. (In Chinese) [Google Scholar] [CrossRef]
- Yu, Z.; Liu, X.; Zhang, J.; Xu, D.; Cao, S. Evaluating the net value of ecosystem services to support ecological engineering: Framework and a case study of the Beijing Plains afforestation project. Ecol. Eng. 2018, 112, 148–152. [Google Scholar] [CrossRef]
- Sunderland, T.; Rogers, K.; Coish, N. What proportion of the costs of urban trees can be justified by the carbon sequestration and air-quality benefits they provide? Arboric. J. 2012, 34, 62–82. [Google Scholar] [CrossRef]
- Xue, X.; Zhao, J.; Shi, M.; Wei, S.; Wu, M. Ecological benefit evaluation of street trees in Zhengzhou City based on i-Tree model. Henan Sci. 2018, 36, 1460–1467. (In Chinese) [Google Scholar]
- Liao, W.; Tong, T.; Qin, K.; Gao, X. Efficiency theory, measurement and factors influencing input-output of forest land in China: Summary and prospect. J. Agro For. Econ. Manag. 2018, 17, 545–552. (In Chinese) [Google Scholar] [CrossRef]
- Li, C.; Li, N.; Luo, H.; Wang, B. The efficiency analysis and path optimization of forestry input-output in China based on Data Envelopment Analysis. Chin. Agric. Sci. Bull. 2011, 27, 55–59. (In Chinese) [Google Scholar]
- Huang, A.; Liu, Z.; Xu, J.; Lin, Q.; Lan, Y.; Su, S.; Zhang, C. Forestry total factor productivity under multiple targets in China and its spatiotemporal differences. Sci. Silvae Sin. 2015, 51, 117–125. (In Chinese) [Google Scholar]
- Viitala, E.J.; Hänninen, H. Measuring the efficiency of public forestry organizations. For. Sci. 1998, 44, 298–307. [Google Scholar] [CrossRef]
- Ma, D.; Wang, X. Comparative analysis of management efficiency of family forestry farms in Gansu Province. Issues For. Econ. 2020, 40, 45–52. (In Chinese) [Google Scholar]
- Wei, J.; Zhang, L. Analysis of forestry input-output efficiency in Guangxi based on DEA method. J. Cent. S. Univ. For. Technol. (Soc. Sci.) 2016, 10, 55–60. (In Chinese) [Google Scholar]
- Liu, Y.; Yang, Z.; Xu, G.; Yang, Q.; Liu, S.; He, K. Correlation between ecosystem services value and human activity intensity based on the four-quadrant model: A case study in the International Tourism and Culture Demonstration Area, the South Anhui Province. Acta Ecol. Sin. 2022, 42, 5200–5210. (In Chinese) [Google Scholar] [CrossRef]
- Xu, L.; Gao, G.; Wang, X.; Chen, Y.; Zhou, C.; Wang, K.; Fu, B. Quantifying the contributions of climate change and human activities to vegetation greening in the drylands of northern China. Acta Ecol. Sin. 2023, 43, 7274–7283. (In Chinese) [Google Scholar] [CrossRef]
- Banker, R.D.; Charnes, A.; Cooper, W.W. Some models for estimating technical and scale inefficiencies in Data Envelopment Analysis. Manag. Sci. 1984, 30, 1078–1092. [Google Scholar] [CrossRef]
- Simar, L.; Wilson, P.W. Sensitivity analysis of efficiency scores: How to Bootstrap in Nonparametric Frontier Models. Manag. Sci. 1998, 44, 49–61. [Google Scholar] [CrossRef]
- Hu, Z.; He, X.; Li, Y.; Zhu, J.; Li, X. Human activity intensity and its distribution pattern of Minjiang River. Chin. J. Ecol. 2007, 26, 539–543. (In Chinese) [Google Scholar]
- Wang, R.; Xin, X.; Pei, S.; Guo, J.; Wu, D. Sulfur dioxide absorption and accumulation capacity of 9 common urban greening tree species in Beijing. For. Res. 2017, 30, 392–398. (In Chinese) [Google Scholar] [CrossRef]
- Chang, C.; Wang, S. Effects of rainfall interception and runoff reduction by urban canopy based on i-Tree Eco model. J. Arid. Land Resour. Environ. 2021, 35, 136–142. (In Chinese) [Google Scholar] [CrossRef]
- Dong, X.; Chen, C.; Li, H.; Xie, N.; Zhao, Y.; Fang, K. Effects on Illumination on growth of Pinus densiflora. Prot. For. Sci. Technol. 2018, 172, 36–40. (In Chinese) [Google Scholar] [CrossRef]
- Vaughn, R.M.; Hostetler, M.; Escobedo, F.J.; Jones, P. The influence of subdivision design and conservation of open space on carbon storage and sequestration. Landsc. Urban Plan. 2014, 131, 64–73. [Google Scholar] [CrossRef]
- Xie, X.Y.; Cui, Y.J.; Qiu, E.F.; Fu, Q.C. Analysis on changes of street tree structure in Beijing from 2010 to 2020. J. Beijing For. Univ. 2023, 45, 78–88. [Google Scholar] [CrossRef]
- Li, L. Environmental goods provision and gentrification: Evidence from Million Trees NYC. J. Environ. Econ. Manag. 2018, 120, 102828. [Google Scholar] [CrossRef]
- Blanchette, A.; Lang, C.; VanCeylon, J. Variation in Valuation: Open Space and Geography. Land Econ. 2021, 97, 768–780. [Google Scholar] [CrossRef]
- Black, K.J. Wide open spaces: Estimating the willingness to pay for adjacent preserved open space. Reg. Sci. Urban Econ. 2018, 71, 110–121. [Google Scholar] [CrossRef]
- Lang, C. Assessing the efficiency of local open space provision. J. Public Econ. 2018, 158, 12–24. [Google Scholar] [CrossRef]
Disclaimer/Publisher’s Note: The statements, opinions and data contained in all publications are solely those of the individual author(s) and contributor(s) and not of MDPI and/or the editor(s). MDPI and/or the editor(s) disclaim responsibility for any injury to people or property resulting from any ideas, methods, instructions or products referred to in the content. |
© 2025 by the authors. Licensee MDPI, Basel, Switzerland. This article is an open access article distributed under the terms and conditions of the Creative Commons Attribution (CC BY) license (https://creativecommons.org/licenses/by/4.0/).