Abstract
The solar air collector (SAC) is one of the key technologies for space heating, with various designs proposed to enhance heat collection, but increasing design complexity makes determining the optimal structure more challenging. In this paper, a gradient optimization method, based on heat transfer and optical models, is established for the structural optimization of SAC and applied to the triangular solar air collector (TSAC). With maximum heat collection during the heating season as the objective function, the TSAC side material and the absorber angles are optimized. The performance improvement of the TSAC before and after optimization is analyzed, and the applicability of the optimized TSAC is compared with traditional flat-plate solar air collectors (FSACs) in different climate and solar resource zones. The results indicate that the heat collection of the TSAC increased by 19.2% and the operating time increased by 106 h after optimization. In various zones, the heat collection of TSAC is superior to that of FSAC, with an average increase of 18.1%.
1. Introduction
In China, the carbon emissions caused by winter heating are about 1 billion tons, accounting for 10% of total carbon emissions [1]; thus, actively promoting the development of clean heating technologies is critical to achieving the carbon peaking and carbon neutrality goals [2]. Solar heating is a promising clean heating technology [3] and has been developing rapidly in recent years [4,5]. China’s solar heating area exceeded 15 million m2 in 2022, and the solar collector area used for heating reached 3 million m2 [6].
Solar air collectors (SACs) are widely used in solar heating due to their unique advantages and broad applicability. SACs are particularly suitable for household applications [7], since their recirculating medium is air, which eliminates the need for freezing and leak prevention and makes them easy to maintain. The advantages of simple structure, strong durability, and low price further promote the popularization and application of SACs as household solar heating devices [8,9]. However, air as a recirculating medium leads to lower thermal efficiency of SACs, so the optimization of collector performance is one of the key research areas [10].
Enhancing heat transfer between the absorber and the recirculating medium serves as the primary means of optimizing collector performance [11,12]. Agrawal et al. [13] added discrete double-arc patterns to the absorber surface, and its convective heat transfer coefficient increased by 2.88 times compared to the smooth absorber. Shetty et al. [14] designed a permeable absorber with circular perforations, where the recirculating air flowing through the circular perforations disrupted the laminar boundary layer on the absorber surface, thereby enhancing the convective heat transfer from the absorber to the recirculating air. The performance of SACs can also be enhanced by increasing the area of heat transfer between the absorber and the recirculating air, such as by using multiple air channels and adding ribs to the absorber [15,16]. Tuncer et al. [17] compared the three-channel and four-channel SACs, and the four-channel SAC performed better with thermal efficiency reaching 80%. Chand et al. [18] installed louvered ribs at the bottom of the absorber, and its thermal efficiency was 106.7% higher than that of the SAC without ribs.
The novel geometry can effectively improve the collection performance of SACs. Jiang et al. [19] proposed a triangular solar air collector (TSAC) with a 60° transparent cover plate, which effectively improves the collector area and collector capacity of SACs. Khanlari et al. [20] proposed a single-pass solar air collector integrated with a PCM unit and porous fins, which extended the utilization time and improved the thermal efficiency to 38.66–41.73%. M.S. El-Said et al. [21] proposed a dual-channel SAC with reflective mirrors, and its thermal efficiency is improved by 19.33% over the traditional flat-plate solar air collectors (FSACs).
M.S. El-Said et al. [22] designed a tubular cyclonic SAC with a semi-cylindrical absorber, and its thermal efficiency can reach 76.8% by adding radial ribs. P. Shetty et al. [23] developed a cross-flow structure SAC with a porous circular absorber and examined how the aperture size affected its thermal performance, and its maximum thermal efficiency reached 75.6% with an aperture size of 8 mm. Kumar et al. [24] proposed a triangular SAC with a lateral flow of recirculating air, and the average thermal efficiency can be increased by 4.93% by installing V-shaped ribs at its bottom. The novel geometries of the above four SACs are shown in Figure 1.
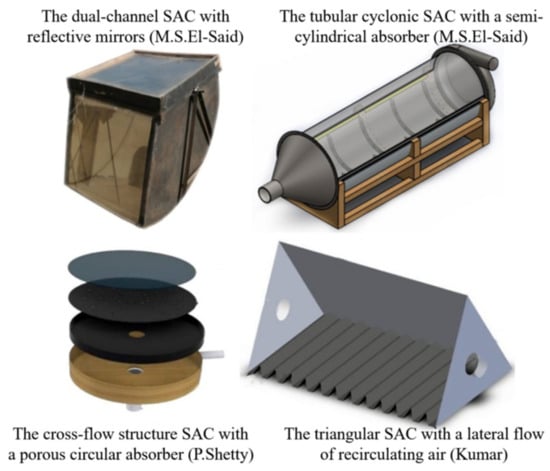
Figure 1.
The geometry of the novel SACs.
In addition, numerical calculation is a significant method for collector structure optimization and performance analysis [25]. Oliveira and Dutra [26] proposed a SWC with a V-corrugated absorber and applied a mathematical-graphical model to optimize the angle of the V-groove and effectively improve its heat collection. Maji et al. [27] established a CFD model of a U-shaped zigzag channel SWC and optimized its design variables using the gravitational search algorithm, and the maximum increase in the collector efficiency of the SWC after optimization was 41%. Prajapati et al. [28] applied Fluent to calculate the SAC performance of absorbers with ten different sizes of corrugations, and the optimal absorber corrugation size was determined by comprehensively considering the Nusselt number and thermo-hydraulic performance parameters of SACs. Li et al. [29] developed a mathematical model of a SAC considering the radiation heat transfer of absorbers and simulated the effects of different factors on its thermal performance.
In summary, current optimization methods mainly focus on optimizing individual components of SACs such as the absorber. However, the novel geometric SAC features a complex structure, necessitating a multivariate global optimization approach that simultaneously considers geometry and material selection. In this paper, a gradient optimization method is developed to optimize the structural parameters of SACs, integrating heat transfer and optical models. This method offers the advantages of a simple principle and wide applicability and is applied to the TSAC. With the maximum heat collection during the heating season as the objective function, the TSAC side materials and absorber angles are optimized, and the performance advantages and applicability of optimized TSAC in different zones are analyzed through a comparison with traditional FSAC.
2. Mathematical Model and Experimental Validation
2.1. Structure of TSAC
The proposed TSAC structure is shown in Figure 2. Solar radiation is absorbed by three folded permeable absorbers and transferred to the recirculating air through convective heat transfer. The indoor air is directly heated as recirculating air [19]. A fan is installed at the circulating air outlet to drive the airflow, ensuring forced convection. Setting the air outlet below the TSAC causes the air recirculation process to overcome the thermal pressure effect but allows for a uniform temperature distribution in the heated space and better thermal comfort. TSACs have a larger light-receiving and heat transfer area compared to traditional FSACs. For instance, a TSAC with a 2.4 m × 0.7 m transparent cover installed at a 60-degree inclination achieves a light-receiving area of 1.68 m2. In comparison, a FSAC of the same height, mounted flush against a wall, has only 1.45 m2, making the TSAC’s area 0.225 m2 larger. Moreover, the triangular structure has higher strength and durability.

Figure 2.
Structure and operation principle of TSAC.
2.2. Mathematical Model of TSAC
For the structural optimization and performance analysis of a TSAC, its mathematical model is established, and the following assumptions are made:
- (a)
- The solar rays are parallel, with refraction through the transparent cover ignored.
- (b)
- The TSAC components’ optical and thermal properties remain unchanged, and the change in density of the recirculating air is ignored.
- (c)
- The recirculating air flow velocity is uniformly distributed across the TSAC cross-section.
- (d)
- Heat loss through the insulation materials is ignored.
- (e)
- The rays escaping through the air inlet and outlet are ignored.
2.2.1. The Heat Transfer Model
Based on the above assumptions, the energy conservation equation of the TSAC is constructed. The TSAC consists of four components (transparent cover, absorber, back insulation, and two side materials), and the heat transfer relationships among these components, the recirculating air, and the external environment are illustrated in Figure 3. The temperature of the recirculating air progressively rises as it travels from the inlet to the outlet, so the TSAC is divided into control bodies along the height direction, and the internal heat conduction within the TSAC is also considered.
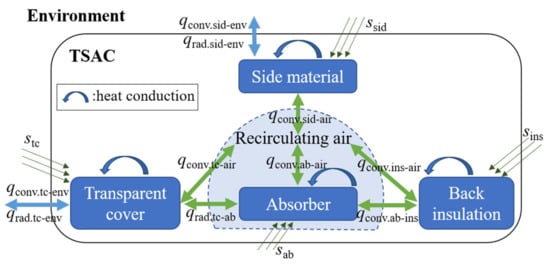
Figure 3.
Heat transfer relationships.
The energy conservation equation for transparent cover is as follows:
The energy conservation equation for the absorber is as follows:
The energy conservation equation for back insulation is as follows:
The energy conservation equation for two side materials, based on the installation location of the TSAC, either transparent cover or insulation can be selected. In the case of insulation, the heat transfer to the environment is ignored.
The energy conservation equation for recirculating air, neglecting the diffusion term in the flow direction, is as follows:
In Equations (1)–(5), is the quality (kg), is the specific heat capacitance (J/(kg·K)), is the temperature (°C), is the time (s), is the volume (m3), is the coefficient of heat conductivity (W/(m·K)), is the height (m), is the angle (°), is the absorbed solar radiation (W), is the convective heat transfer quantity (W), is the radiative heat transfer quantity (W), and is the flow velocity (m/s). The detailed subscripts can be found in the nomenclature.
The unsteady terms and diffusion terms in the model are discretized using the implicit format and central difference method, while the convective terms are solved using the first-order upwind scheme. The model solution is implemented in a Python 3.9.5 environment, and the detailed discretization process for each term can be found in Appendix A.
The convective heat transfer coefficients between each component of the TSAC, such as the transparent cover, and the recirculating air are calculated as follows [30]:
In Equation (6), is the convective heat transfer coefficient between the transparent cover and recirculating air (W/(m2·K)), is the Reynolds number of recirculating air, is the Prandtl number of recirculating air, and is the coefficient of heat conductivity of recirculating air (W/(m·K)).
Calculation of radiative heat transfer between the different components of the TSAC uses Kirchhoff’s radiation law, and radiant heat transfer with the external environment is treated as a two-surface closed system [19]. The coefficients of convective heat transfer from the transparent cover and side materials to the external environment are calculated as follows (e.g., for the transparent cover) [31]:
In Equation (7), is the convective heat transfer coefficient between the transparent cover and environment (W/(m2·K)).
The boundary conditions include the inlet temperature and flow rate of the recirculating air, environmental temperature, wind speed, and solar irradiance, determined by the operating conditions. It should be noted that the recirculating air inlet temperature is the temperature of the heated space. The initial temperature of the TSAC is assumed to be equal to the environmental temperature, and the initial conditions are specified as follows:
2.2.2. The Optical Model
Equations (1)–(5) define the heat transfer model of the TSAC, while the solar irradiation absorbed by each component is determined using the optical model (Equations (9)–(11)). The intersections of the reflected rays with the TSAC are calculated using Equations (9) and (10), and the solar radiation that each component of the TSAC receives is determined by tracking the rays and summing the energy absorbed by the corresponding planes. By coupling the heat transfer and optical models, the complete solution of the system is achieved.
The incident vector of the solar rays is determined by latitude, longitude, and time. Based on the starting point of the rays, the normal vector of the TSAC plane, and the corresponding vertices, the equations of the rays’ line segments and the rays’ intersection planes with the TSAC are created as follows:
In Equation (9), are the coordinates of the rays, are the coordinates of the starting point of the rays, are the coordinates of the solar incident rays, and is the intersecting plane with the smallest length of the rays’ line segment (m).
In Equation (10), is the normal vector of the TSAC plane.
Determine the positions where solar rays intersect the TSAC using the two equations provided above, and if the solar rays intersect with more than one plane of the TSAC, the intersecting plane with the smallest length of the rays’ line segment (l) is the actual intersecting plane. The ratio of the rays’ energy absorbed, transmitted, and reflected is calculated according to the optical properties of the intersecting planes, and the reflected ray vectors are calculated as follows:
In Equation (11), is the incident vector of the solar rays ( = (xsol, ysol, zsol)) and is the reflected ray vector.
2.3. Experimental Validation
The accuracy of the TSAC numerical heat transfer model determines the effectiveness of its structural optimization algorithm, so it is necessary to build an experimental platform for model validation. The experimental platform in Tianjin, China (38.98° N, 117.38° E) is shown in Figure 4. Both the TSAC with insulation on the sides and the TSAC with a single-layer transparent cover on the sides were tested during the heating season. The TSAC’s geometric and physical parameters are detailed in Table 1, and the angles of the three absorbers from bottom to top are initially set at 30°, 120°, and 52°. The recirculating air temperature rise and the collector power (Equation (12)) of the two TSACs were tested under different operating conditions, and each condition was tested continuously for one minute to take the average value as the test value. Measurement point placement and test instrumentation uncertainties are shown in the authors’ previous study [19].

Figure 4.
The experimental platform of the TSAC.

Table 1.
The TSAC’s geometric and physical parameters [19].
In Equation (12), is the collection power (W), is the mass flow velocity of recirculating air (kg/s), is the outlet circulating air temperature (°C), and is the inlet circulating air temperature (°C).
The comparison between the tested and predicted values for recirculating air collection power of the two TSACs is shown in Figure 5. As shown in Figure 5a, for the TSAC with insulation on the sides, the errors peak at 85.0 W for the collection power, and the average relative error of the collection power is 9.1%. As shown in Figure 5b, for the TSAC with single-layer transparent cover on the sides, the maximum and average relative errors of the collection power are 7.1% and 4.1%, respectively. The errors are primarily caused by the assumption of uniform air distribution across the cross-section, as the triangular structure significantly influences the airflow distribution within the TSAC. The complex flow patterns generated by the triangular geometry were not fully captured by this simplification. It is important to note that the allowable deviation from the average value for recirculating air mass flow rate measurement is 1.5%, and for temperature measurement, it is 0.5 °C. Across all tested operating conditions, the average relative error of the collection power remains within the range of its mean measurement uncertainty. This further confirms that, despite simplifications, the model remains accurate for its intended application, as demonstrated by the strong agreement between the tested and predicted values, validating the accuracy of the TSAC mathematical model.
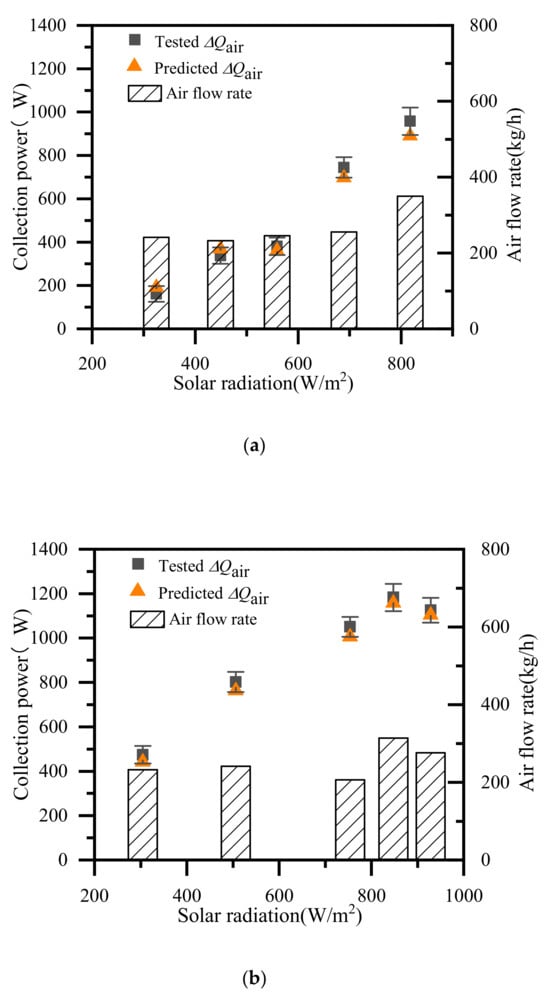
Figure 5.
The comparison between the tested and predicted values of the two TSACs. (a) The TSAC with insulation on the sides; (b) the TSAC with single-layer transparent cover on the sides.
3. TSAC Structure Optimization
The optimal side materials and absorber angles for a TSAC cannot be determined based on qualitative analysis. With the side material selection of single-layer transparent cover, double-layer transparent cover, or insulation, the received solar radiation decreases sequentially, but the heat preservation performance rises gradually. Additionally, the absorber is suitable for different angles at different solar altitude angles, and the absorber angles should be optimized within a reasonable range to ensure proper connection with both the top and bottom of the collector. Therefore, it is necessary to optimize the two above variables according to the actual operating conditions of the TSAC during the whole heating season.
The objective function, as shown in Equation (13), is to maximize the heat collection during the heating season. To achieve this, a parallel gradient ascent algorithm based on the mathematical modeling of a TSAC is developed for its structure optimization. Parallel computing divides the optimization algorithm into several independent subtasks and solves them simultaneously to increase the computational efficiency, which is exactly applicable to the simultaneous optimization computation of TSACs with different side materials. The gradient algorithm is a first-order optimization algorithm that can be used for optimization of multiple correlated variables and is suitable for optimizing the three absorber angles of the TSAC. The absorber angles are iteratively optimized as follows:
In Equation (13), is the side material, and is the heat collection (J).
In Equation (15), is the new iterated angle values (°), is the old iterated angle values (°), and is the gradient algorithm learning rate.
The structural optimization of the TSAC requires first determining its geometry, including the height, width, and inclination of the front transparent cover, which usually depends on the installation conditions. The above three parameters of the TSAC are set to 2.1 m, 0.7 m, and 60° (the same geometry as the experimental platform TSAC), but it should be noted that the structural optimization algorithm constructed in this study is applicable to TSACs with any geometry. The optimization flowchart is shown in Figure 6 and can be divided into five steps.
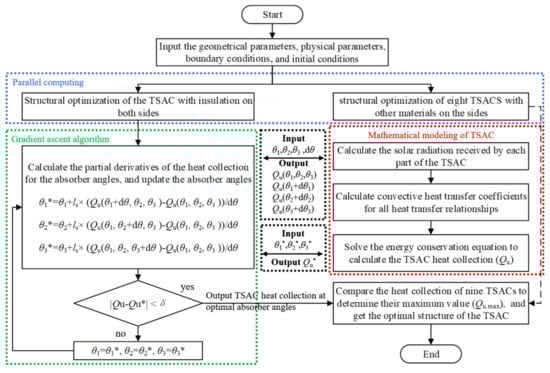
Figure 6.
The structural optimization process of a TSAC.
- i.
- Input the TSAC’s geometrical and physical parameters and input the boundary and initial conditions according to the operating conditions.
- ii.
- Parallel optimization of the absorber angles for TSACs with different side materials, and there are three options for single-sided materials, resulting in a total of nine TSACs.
- iii.
- Use the mathematical model of the TSAC to calculate the partial derivatives of the heat collection for each of the three absorber angles and update the absorber angles according to Equation (13).
- iv.
- Calculate the heat collection of the TSAC before and after the update of the absorber angles, and if the residual is greater than the threshold, the updated absorber angles are iterated as the original absorber angles until convergence.
- v.
- Compare the heat collection of the nine TSACs under the optimal absorber angles, select the TSAC with the largest heat collection, and output the required parameters.
4. Result and Discussion
4.1. Optimization Results
Based on the typical annual meteorological parameters in Tianjin, the structure of the experimental TSAC was optimized. The comparison of the TSAC structure before and after optimization is shown in Table 2. Unlike FSACs, where only the frontal transparent cover receives solar radiation, the TSAC also captures radiation through its side materials and back insulation, thus its thermal efficiency and optical efficiency are defined based on the total solar radiation received.
Table 2.
A comparison of the TSAC’s structure before and after optimization.
In Equation (16), is the thermal efficiency, is the area of the TSAC (m2), and is the solar irradiance of the TSAC (W/m2).
In Equation (17), is the optical efficiency, and is the absorbed solar radiation (W). The detailed subscripts can be found in the nomenclature.
The comparison of the TSAC’s thermal performance before and after optimization is shown in Figure 7. In December and January, the TSAC had lower heat collection and thermal efficiency due to the low environmental temperature and increased heat loss, but its optical efficiency was higher because the absorbers can capture more solar radiation at a low solar altitude angle. Before and after optimization, the TSAC’s heat collection increased by 324.7 MJ during the heating season, with a monthly average increase of 19.2%, and the thermal efficiency and optical efficiency increased by 13.4% and 13.9%, respectively. Furthermore, from November to March, the average efficiency improvement of heat collection was calculated as 15.4%,19.3%, 19.9%, 22.1%, and 19.4%, respectively, demonstrating a consistent improvement throughout the heating season. In addition, the pre-optimization TSAC can only operate for 957 h during the heating season, as the heat loss exceeds the heat gain during other periods, causing the collector being unable to function properly. In contrast, the optimized TSAC can better utilize solar radiation, allowing it to operate for 1063 h throughout the heating season, which is 106 h longer than before optimization.
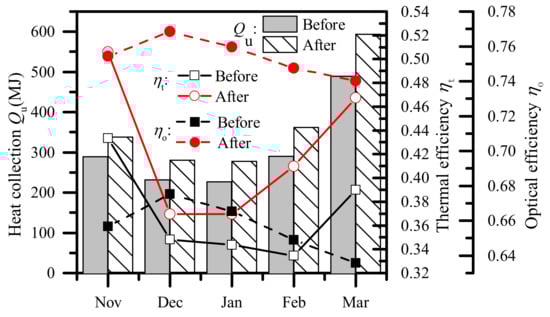
Figure 7.
Comparison of thermal performance before and after TSAC optimization.
4.2. Performance Comparison
A comparison is made between the traditional FSAC proposed by Zheng et al. [32] and the optimized TSAC’s thermal performance, and the materials used in both SACs are identical. SACs are usually installed against the wall so that no air ducts need to be connected to the room, and they can also improve the insulation performance of the envelope. Compared to the FSAC installed against the wall, the performance advantages of the TSAC with a larger collection area are obvious. Therefore, the TSAC is also contrasted with a FSAC set at the same inclination angle. The installation diagram of the three SACs is shown in Figure 8. For SACs, the key parameters influencing performance are environment temperature, solar radiation, and solar incidence angle. While analyzing the influence of a single parameter, the other parameters are kept at standard values (environment temperature: 0 °C; solar irradiance: 600 W/m2; solar incidence angle: 40°).
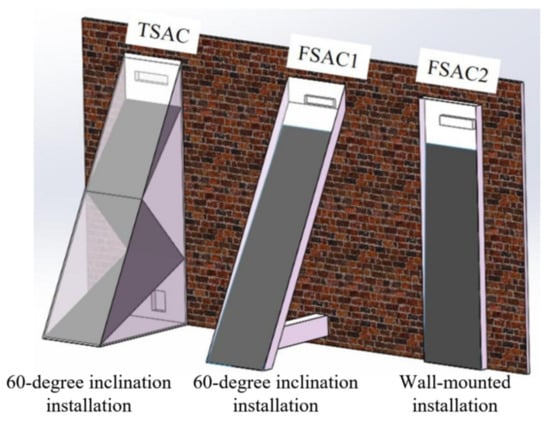
Figure 8.
The installation diagram of the three SACs.
Figure 9 shows the effect of the environment temperature. Under different environmental temperatures, the TSAC has a higher collection power than FSAC1, but its thermal efficiency is lower. The reason for the TSAC’s higher collection power is that it can receive solar radiation not only through the front transparent cover, like FSAC1, but also through the side transparent cover. The thermal efficiency of the TSAC is lower than that of FSAC1 for two reasons. First, compared with the front transparent cover, the low transmission and large solar incidence angle of the side double-layer transparent cover result in a lower utilization rate of solar radiation. Second, the average cross-sectional area of the recirculating air flow channel in the TSAC is larger, but its heat transfer efficiency between the recirculating air and the absorber is slightly lower than that of FSAC1. As the environment temperature rises, less heat is lost through the transparent covers of both SACs, resulting in a linear increase in thermal efficiency and collection power. The environment temperature has a higher impact on the TSAC since it has a larger transparent cover surface. As the environment temperature rises from −8 °C to 8 °C, the difference in collection power between the TSAC and the FSAC increases from 125.1 W to 199.8 W, while the difference in thermal efficiency decreases from 15.5% to 12.0%. This indicates that the TSAC performs more effectively compared to FSAC1 when the environment temperature is high.
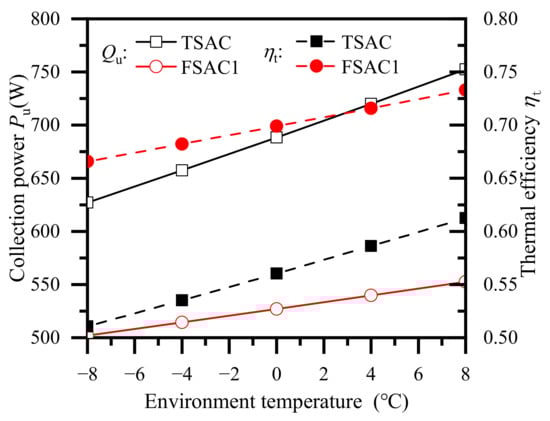
Figure 9.
The effect of environment temperature on the two SACs.
Figure 10 shows the effect of solar radiation. The collection power of both SACs increases linearly with solar radiation because the absorber captures more solar radiation, leading to higher absorber temperature and improved heat exchange with the recirculating air. The increase in thermal efficiency gradually slows down due to higher convective and radiative heat loss through the transparent cover to the environment. The TSAC has a larger transparent cover area and receives more solar radiation, thus collection power and thermal efficiency increase at a greater rate with increasing solar radiation. The collection power of the TSAC increases by 826.2 W when solar radiation rises from 385 W/m2 to 935 W/m2, while the collection power of FSAC1 only increases by 530.7 W. Therefore, TSAC is more advantageous for zones with abundant solar energy resources.

Figure 10.
The effect of solar radiation on the two SACs.
Figure 11 shows the effect of the solar incidence angle (incidence angle of the front transparent cover). As the solar incidence angle increases, the solar radiation passing through the front transparent cover into the collector decreases, leading to a reduction in the collection power of FSAC1. In contrast, the solar radiation entering through the transparent side covers of the TSAC increases, with the consequence that its collection power increases initially and then decreases. When the solar incidence angle is below 13°, the collection power of the TSAC is slightly less than that of FSAC1 due to its lower thermal efficiency; as the solar incidence angle exceeds 13°, the collection power of TSAC is greater. The TSAC collection power reaches a maximum of 688.3 W at a solar incidence angle of 35° and is on average 113 W greater than that of FSAC1 at different solar incidence angles.

Figure 11.
The effect of the solar incidence angle on the two SACs.
Under the typical annual meteorological parameters of Tianjin, the monthly heat collection of the three SACs during the heating season is compared, as shown in Figure 12. In December and January, the TSAC collects slightly more heat than FSAC1 due to the lower environment temperature and increased heat loss through the side transparent cover. During the heating season, the TSAC collects 1778.2 MJ of heat, which is 12.2% more than FSAC1 and 42.6% more than FSAC2.

Figure 12.
Comparison of monthly heat collection by three SACs.
4.3. Applicability Analysis
The above analysis shows that environmental factors significantly affect the thermal performance of the TSAC; therefore, its applicability in various zones needs to be analyzed. Eight zones of China were chosen, and these zones are located in various climate and solar resource zones, as shown in Figure 13 and Table 3.
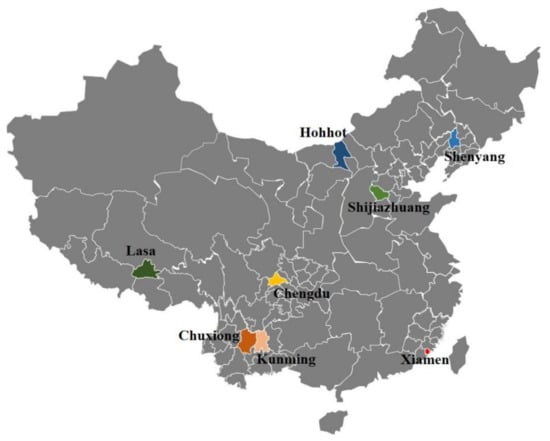
Figure 13.
Location of eight zones.
Table 3.
Basic information of eight zones.
The TSAC is optimized on the basis of the typical annual meteorological parameters of eight zones, and Figure 14 illustrates the heat collection and average thermal efficiency of the optimal TSAC compared to two FSACs. As shown in Figure 14, in all eight zones, the heat collection of TSAC is higher than both FSACs, with an average increase of about 18.2% compared to FSAC1. The changing trends of thermal efficiency for the three SACs in the eight zones are the same, with two FSACs having close thermal efficiency and are slightly greater than the TSAC. Lhasa has the best solar energy resources; thus, the three SACs have the highest heat collection with 3732.8 MJ, 3058.2 MJ, and 1976.1 MJ, respectively. The average environment temperature and solar radiation of Kunming and Chuxiong are higher, and the TSAC has a greater advantage, with a higher heat collection difference from FSAC1 of 844.7 MJ and 686.9 MJ, respectively. In Xiamen, despite moderate solar resources, the higher environmental temperature results in the highest thermal efficiency for all three solar air collectors. The TSAC collects 513.1 MJ and 891.2 MJ more heat than FSAC1 and FSAC2, respectively. In Shenyang, a cold region with generally limited solar energy resources, the heat collection difference between the TSAC and FSAC1 is at least 43.9 MJ, but compared to FSAC2, which is also installed against the wall, the TSAC collects 546.3 MJ more heat.
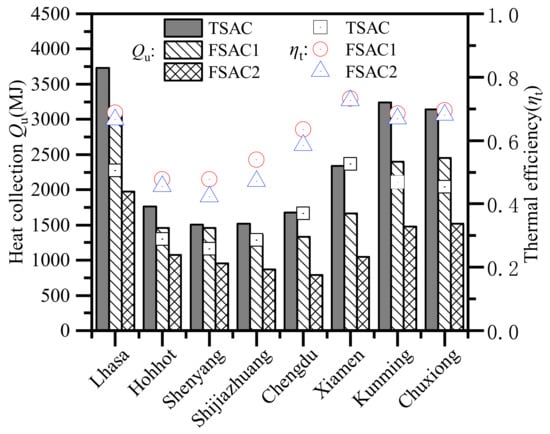
Figure 14.
Comparison of applicability in eight zones.
5. Conclusions
A gradient optimization method, based on heat transfer and optical models, is established for the structural optimization of SACs and applied to the TSAC, aiming to maximize the heat collection during the heating season. The effectiveness of the gradient optimization algorithm relies on an accurate numerical model, with the prediction error of the TSAC numerical model being less than 10%, demonstrating good accuracy. The parallel gradient ascent algorithm established in this paper efficiently optimizes the structure of TSACs, resulting in a 19.2% increase in heat collection, a 13.4% improvement in thermal efficiency, and an extension of 106 h in operating time after optimization.
Furthermore, the optimized TSAC is more significantly affected by environment temperature and solar radiation than the FSAC, enabling the TSAC to collect more heat under various operating conditions by capturing more solar radiation. When compared across eight different climatic and solar resource zones, the optimized TSAC has better heat collection performance than the FSAC, with a maximum difference of 28.7% and an average difference of 18.1%. The advantages of a TSAC are more pronounced in solar resource-rich zones and high ambient temperature zones.
To further improve the model’s robustness, future work will expand the analysis to include more climate zones and factors such as humidity and wind speed. Additionally, further validation and comparison with other optimization methods, such as metaheuristics, will be conducted. These efforts will help refine the optimization process and enhance the practical application of TSACs in various regions.
Author Contributions
Conceptualization, Y.W.; Methodology, Y.W.; Software, F.J. and W.F.; Validation, Y.J.; Formal analysis, Z.H.; Investigation, F.J.; Resources, S.W.; Data curation, W.F.; Writing—original draft, R.Z.; Writing—review & editing, Y.Z.; Supervision, S.W.; Project administration, J.P. All authors have read and agreed to the published version of the manuscript.
Funding
This work was supported by the Science and Technology Program of CSEI Youth Fund (Grant No. 2017youth13).
Data Availability Statement
The original contributions presented in this study are included in the article. Further inquiries can be directed to the corresponding author.
Conflicts of Interest
The authors declare no conflict of interest.
Nomenclature
| A | Area (m2) |
| cp | Specific heat capacitance (J/(kg·K)) |
| h | Height (m) |
| hconv | Convective heat transfer |
| coefficients (W/(m2·K)) | |
| I | Solar irradiance (W/m2) |
| ls | Gradient algorithm learning rate |
| M | Quality (kg) |
| m | Mass flow velocity (kg/s) |
| Pr | Prandtl number (-) |
| Pu | Collection power (W) |
| q | Energy (W) |
| Qu | Heat collection (J) |
| Re | Reynolds number (-) |
| s | Absorbed solar radiation (W) |
| T | Temperature (°C) |
| Tmin | Coldest month temperature (°C) |
| u | Flow velocity (m/s) |
| V | Volume (m3) |
| Subscripts | |
| ab | Absorber |
| air | Recirculating air |
| conv | Convection heat exchange |
| wind | Ambient wind |
| env | Environment |
| in | Inlet |
| ins | Insulation |
| out | Outlet |
| rad | Radiation |
| sid | Side |
| sol | Solar |
| tc | Transparent cover |
| year | Annual |
| Greek symbols | |
| α | Absorptivity (-) |
| ε | Emissivity (-) |
| ηo | Optical efficiency (%) |
| ηt | Thermal efficiency (%) |
| θ | Angle (°) |
| λ | Coefficient of heat conductivity (W/(m·K)) |
| τ | Time (s) |
| τtc | Transparent cover transmissivity (-) |
| Abbreviations | |
| FSAC | Flat-plate solar air collector |
| SAC | Solar air collectors |
| TSAC | Triangular solar air collector |
| SM | Side material |
Appendix A
The unsteady terms and diffusion terms in the model are discretized using the implicit format and central difference method, while the convective terms are solved using the first-order upwind scheme. For example, the discretization of the unsteady term, convective term, and diffusion term is carried out as follows:
The time derivative is discretized using the implicit format.
The convective flux is discretized using the first-order upwind scheme, with the control volume division direction opposite to the flow direction.
The diffusion term is discretized using the central difference method.
References
- Deng, M.; Ma, R.; Lu, F.; Nie, Y.; Li, P.; Ding, X.; Yuan, Y.; Shan, M.; Yang, X. Techno-economic performances of clean heating solutions to replace raw coal for heating in Northern rural China. Energy Build. 2021, 240, 110881. [Google Scholar] [CrossRef]
- National Energy Administration. Guidance on Energy Work in 2020. Available online: https://www.nea.gov.cn/ (accessed on 11 December 2022).
- Şafak, A.; İlhan, C.; Egemen, T.O. Designing of energy saving system with heat recovery and solar air collector. Sustain. Energy Technol. Assess. 2023, 57, 103167. [Google Scholar] [CrossRef]
- Xiangfei, K.; Lanlan, Z.; Han, L.; Yongzhen, W.; Man, F. Experimental thermal and electrical performance analysis of a concentrating photovoltaic/thermal system integrated with phase change material (PV/T-CPCM). Sol. Energy Mater. Sol. Cells 2022, 234, 111415. [Google Scholar] [CrossRef]
- Zhang, D.; Liu, C.; Zhang, J.; Jing, J.; An, Z.; Wang, L. Thermal economic analysis of a double-channel solar air collector coupled with draught fan: Based on energy grade. Renew. Energy 2021, 170, 936–947. [Google Scholar] [CrossRef]
- China Energy Conservation Association. China Solar Thermal Utilization Industry Operation Status Report. 2020. Available online: https://www.cecaweb.org.cn/ (accessed on 11 December 2022).
- Ji, Z.; Tingting, Z. Systematic review of solar air collector technologies: Performance evaluation, structure design and application analysis. Sustain. Energy Technol. Assess. 2022, 54, 102885. [Google Scholar] [CrossRef]
- Khimsuriya, Y.D.; Patel, D.; Said, Z.; Panchal, H.; Jaber, M.M.; Natrayan, L.; Patel, V.; El-Shafay, A. Artificially roughened solar air heating technology—A comprehensive review. Appl. Therm. Eng. 2022, 214, 118817. [Google Scholar] [CrossRef]
- Biplab, D.; Deb, M.J.; Sushant, N.; Mervyn, S.; Adrian, P. Experimental performance analysis of a novel sand coated and sand filled polycarbonate sheet based solar air collector. Renew. Energy 2021, 164, 990–1004. [Google Scholar] [CrossRef]
- Hu, J.; Guo, M.; Guo, J.; Zhang, G.; Zhang, Y. Numerical and experimental investigation of solar air collector with internal swirling flow. Renew. Energy 2020, 162, 2259–2271. [Google Scholar] [CrossRef]
- Singh, S.; Chaurasiya, S.K.; Negi, B.S.; Chander, S.; Nemś, M.; Negi, S. Utilizing circular jet impingement to enhance thermal performance of solar air heater. Renew. Energy 2020, 154, 1327–1345. [Google Scholar] [CrossRef]
- Ashutosh, S.; Anchal, A.; Tej, S.; Raj, K.; Ranchan, C. Experimental investigation and optimization of potential parameters of discrete V down baffled solar thermal collector using hybrid Taguchi-TOPSIS method. Appl. Therm. Eng. 2022, 209, 118250. [Google Scholar] [CrossRef]
- Agrawal, Y.; Bhagoria, J.L.; Pagey, V.S. Enhancement of thermal efficiency of solar air collector by using discrete double arc reverse shaped roughness on the absorber plate. Mater. Today Proc. 2021, 51, 1548–1553. [Google Scholar] [CrossRef]
- Shreyas, P.S.; NMadhwesh, N.; Karanth, K.V. Numerical analysis of a solar air heater with circular perforated absorber plate. Sol. Energy 2021, 215, 416–433. [Google Scholar] [CrossRef]
- Kareem, M.W.; Habib, K.; Amjad, A.P.; Irshad, K.; Afolabi, L.O.; Bidyut, B.S. Experimental study of multi-pass solar air thermal collector system assisted with sensible energy-storing matrix. Energy 2022, 245, 123153. [Google Scholar] [CrossRef]
- Handawy, M.K.M.; Driss, Z.; Khelifa, A.; Attia, M.E.; Abdelgaied, M.; Harby, K. Experimental investigation of enhanced thermal performance of solar air collectors through optimized selection of manufacturing materials: Energy, exergy, economic, and environmental analysis. Environ. Prog. Sustain. Energy 2024, 11, e14508. [Google Scholar] [CrossRef]
- Tuncer, A.D.; Sözen, A.; Khanlari, A.; Amini, A.; Şirin, C. Thermal performance analysis of a quadruple-pass solar air collector assisted pilot-scale greenhouse dryer. Sol. Energy 2020, 203, 304–316. [Google Scholar] [CrossRef]
- Subhash, C.; Prabha, C.; Harish, K.G. Thermal performance enhancement of solar air heater using louvered fins collector. Sol. Energy 2022, 239, 10–24. [Google Scholar] [CrossRef]
- Jiang, Y.; Zhang, H.; Wang, Y.; You, S.; Wu, Z.; Fan, M.; Wang, L.; Wei, S. A comparative study on the performance of a novel triangular solar air collector with tilted transparent cover plate. Sol. Energy 2021, 227, 224–235. [Google Scholar] [CrossRef]
- Khanlari, A.; Aytaç, I.; Tuncer, A.D.; Variyenli, H.B.; Sahin, H.N. Improving the performance of a PCM integrated solar air collector by adding porous fins over the bottom side of the absorber: A transient CFD study. J. Energy Storage 2024, 90, 111847. [Google Scholar] [CrossRef]
- Emad, M.S.E.-S.; Mohammed, A.G.; Ali, A.; Gamal, B.A. Performance enhancement of a double pass solar air heater by using curved reflector: Experimental investigation. Appl. Therm. Eng. 2022, 202, 117867. [Google Scholar]
- Emad, M.S.E.-S.; Al-Sood, M.M.A.; Elsharkawy, E.A.; Gamal, B.A. Tubular solar air heater using finned semi-cylindrical absorber plate with swirl flow: Experimental investigation. Sol. Energy 2022, 236, 879–897. [Google Scholar] [CrossRef]
- Shetty, S.P.; Paineni, A.; Kande, M.; Madhwesh, N.; Sharma, N.Y.; Karanth, K.V. Experimental investigations on a cross flow solar air heater having perforated circular absorber plate for thermal performance augmentation. Sol. Energy 2020, 197, 254–265. [Google Scholar] [CrossRef]
- Rahul, K.; Sujit, K.V. Performance estimation of Triangular Solar air heater roughened absorber surface: An experimental and simulation modeling. Sustain. Energy Technol. Assess. 2022, 52, 102208. [Google Scholar] [CrossRef]
- Saxena, A.; Agarwal, N.; Cuce, E. Thermal performance evaluation of a solar air heater integrated with helical tubes carrying phase change material. J. Energy Storage 2020, 30, 101406. [Google Scholar] [CrossRef]
- Manuel, O.; Carlos, C.D.J. The impact of the V-corrugation on the thermal efficiency of a solar collector. Sol. Energy 2023, 255, 460–473. [Google Scholar] [CrossRef]
- Ambarish, M.; Tuhin, D.; Gautam, C. Numerical investigation and optimisation of flat plate solar collectors using two swarm-based metaheuristic algorithms. Eng. Anal. Bound. Elem. 2023, 156, 78–89. [Google Scholar] [CrossRef]
- Shivam, P.; Namith, N.; Chandramohan, V.P. Numerical solution of solar air heater with triangular corrugations for indirect solar dryer: Influence of pitch and an optimized pitch of corrugation for enhanced performance. Sol. Energy 2022, 243, 1–12. [Google Scholar] [CrossRef]
- Li, S.; Lin, W.; Gong, X.; Sun, Y.; Ma, Z. Corrugated transpired solar collectors: Mathematical modeling, experimental investigation, and performance analysis. Sol. Energy 2023, 262, 111839. [Google Scholar] [CrossRef]
- Khademi, S.; Carriveau, R.; Ting, D.S.K. Evaluating the effect of runoff on an agricultural retention stormwater pond temperature using an experimentally validated TRNSYS model. Sustain. Water Resour. Manag 2025, 11, 14. [Google Scholar] [CrossRef]
- Watmuff, J.H.; Charters, W.W.S.; Proctor, D. Solar and Wind Induced External Coefficients—Solar Collectors. 1977, pp. 2–56. Available online: https://www.researchgate.net/publication/234355019_Solar_and_wind_induced_external_coefficients_-_Solar_collectors (accessed on 16 January 2025).
- Zheng, W.; Li, B.; Zhang, H.; You, S.; Li, Y.; Ye, T. Thermal characteristics of a glazed transpired solar collector with perforating corrugated plate in cold regions. Energy 2016, 109, 781–790. [Google Scholar] [CrossRef]
Disclaimer/Publisher’s Note: The statements, opinions and data contained in all publications are solely those of the individual author(s) and contributor(s) and not of MDPI and/or the editor(s). MDPI and/or the editor(s) disclaim responsibility for any injury to people or property resulting from any ideas, methods, instructions or products referred to in the content. |
© 2025 by the authors. Licensee MDPI, Basel, Switzerland. This article is an open access article distributed under the terms and conditions of the Creative Commons Attribution (CC BY) license (https://creativecommons.org/licenses/by/4.0/).