Article

The Impact of the Digital Economy on Sustainable Fisheries: Insights from Green Total Factor Productivity in China’s Coastal Regions

1
School of Economics and Management, Zhejiang Ocean University, Zhoushan 316022, China
2
Ocean College, Zhejiang University, Hangzhou 310058, China
*
Authors to whom correspondence should be addressed.
Sustainability 2025, 17(6), 2673; https://doi.org/10.3390/su17062673
Submission received: 28 January 2025 / Revised: 14 March 2025 / Accepted: 16 March 2025 / Published: 18 March 2025
(This article belongs to the Section Sustainable Oceans)

Abstract

:
The digital economy has emerged as a transformative force, creating new opportunities for sustainable development, especially within the marine fisheries sector. This study examines the impact of the digital economy on the green total factor productivity (GTFP) of fisheries in China’s coastal regions from 2011 to 2022. Using panel data from 11 coastal provinces, we employ the Slack-Based Measure (SBM) model and the Global Malmquist–Luenberger (GML) index to assess GTFP and analyze the effects of digital economic development. Our findings indicate the following: (1) the digital economy significantly enhances fishery GTFP, improving both resource efficiency and environmental sustainability; (2) the impact varies across regions, reflecting notable regional heterogeneity in digital infrastructure and adoption; and (3) a threshold effect exists, whereby the influence of the digital economy on GTFP varies depending on the level of digital economic development. This research underscores the dual role of digital technologies in boosting fisheries’ economic productivity while promoting greener, more sustainable practices. This study provides valuable insights for policymakers aiming to integrate digital transformation into the sustainable development of marine fisheries.

1. Introduction

China’s economy has transitioned from an era of rapid growth to one emphasizing high-quality development, a central strategy for achieving national modernization in the new era. High-quality development has become the primary objective for China’s future progress. Within this context, the marine economy serves as a vital engine of national economic advancement and a crucial area for economic reform and transformation. The report of the 20th National Congress of the Communist Party of China explicitly highlights the strategic importance of advancing the marine economy, safeguarding the marine ecological environment, and accelerating the establishment of a maritime power. As a nation endowed with a long coastline and abundant fishery resources, fisheries constitute a critical component of China’s national economy. However, the ongoing expansion of the aquatic product market has intensified the exploitation of fishery resources. This has led to overfishing and escalating environmental pollution, presenting severe challenges to the sustainability of fisheries [1,2]. The depletion of resources and ecological degradation not only undermine the efficiency of fishery production but also hinder the long-term, sustainable development of regional economies. To address these pressing issues, it is imperative to explore innovative models for sustainable fishery development and identify effective pathways to promote ecological balance and economic vitality in the fishery sector [3].
The transformation and upgrading of the fishing industry have become essential, with the digital economy emerging as a driving force for the sustainable development of the marine economy. As the digital economy becomes a new frontier in global competition, the rapid advancement of next-generation information technologies—such as the Internet of Things (IoT) and big data—has triggered a worldwide shift towards digitally-driven, sustainable industrial development [4]. The “14th Five-Year Plan for China’s Fisheries Development” specifically emphasizes the importance of enhancing fisheries’ production efficiency and sustainability through digital transformation, guiding the industry towards greener and more efficient practices. In line with the national goals of carbon peaking and carbon neutrality, the application of digital technologies to reduce carbon emissions and optimize carbon cycles during the green transformation of fisheries has become a focal point of policy attention. By leveraging IoT, big data, and artificial intelligence, the digital economy facilitates intelligent management throughout the entire fisheries process. This not only improves resource allocation efficiency but also mitigates environmental impacts, thereby enhancing the green total factor productivity (GTFP) of fisheries. In this study, exploring the impact of the digital economy on the GTFP of marine fisheries is of significant theoretical and practical value for promoting high-quality development and digital empowerment in the marine fisheries sector.
Marine fisheries’ GTFP refers to the comprehensive production efficiency achieved by marine fisheries, taking into account resource conservation and environmental protection [5]. Unlike traditional total factor productivity (TFP), GTFP not only focuses on the efficiency of inputs such as capital and labor but also incorporates environmental factors and undesirable outputs, such as pollution emissions. Marine fisheries are essential pillars of the global economy and food security, but resource depletion and environmental degradation have made their transformation and upgrading imperative. The enhancement of GTFP involves reducing resource waste and environmental pollution while maintaining or increasing output, which is crucial for the sustainable development of the fisheries sector. Regarding the conceptual definition of GTFP, Hailu et al. [6] integrated undesired outputs into the traditional TFP analysis framework, providing a more comprehensive perspective for productivity measurement. Previous research on GTFP has primarily focused on improvements in productivity measurement models and technological advancements. Tone [7] developed a non-radial Slack-Based Measure (SBM) model, which effectively addresses the issues of the radial DEA model. Oh, in [8], introduced the Global Malmquist–Luenberger (GML) index, which overcomes the limitations of the traditional Malmquist–Luenberger (ML) index, providing a novel method for measuring fisheries’ GTFP. Later, Pastor et al. [9] built on the SBM model to construct the SBM-GML index method. Based on the DEA model, Wang et al. [10] studied the technical efficiency and green production efficiency of China’s mariculture industry, finding that technological progress is the primary driver of GTFP improvement. Asche et al. [11] examined salmon farming in Norway and concluded that technological progress, rather than efficiency improvements, was the main contributor to TFP growth. Similarly, Vassdal et al. [12] used the Malmquist index to measure the TFP of Norway’s mariculture industry and found that TFP may stagnate or decline after technological maturity. Other scholars have increasingly focused on pathways to promote green development in marine fisheries through the digital economy, technological progress, and institutional innovation [13]. Qu et al. [14] applied the Malmquist index method to measure GTFP in coastal areas of China, revealing that improvements in GTFP promote the sustainable development of fisheries. The econometric model constructed by Wang et al. [15] indicated that the rationalization of the marine fisheries industry significantly improves TFP, particularly benefiting from “structural dividends” in the development of the secondary and tertiary fisheries sectors. In studies examining regional differences in fisheries productivity, Zheng et al. [16] utilized the DEA-Malmquist index to analyze changes in fisheries TFP across various coastal areas in China, finding that technical efficiency (TEC) and technological progress (TP) were the key drivers of TFP growth. Although significant progress has been made in model improvements and technological advancements, the existing research still falls short in fully considering undesired outputs, particularly environmental pollution and resource consumption in fisheries. Furthermore, model limitations and data constraints hinder the accuracy of measurement.
With the rapid development of the digital economy, its impact on marine fisheries has become an increasingly prominent area of study. A growing body of research has explored the role of the digital economy in marine fisheries from various perspectives, including industrial upgrading, production efficiency, and innovation capacity [17,18,19]. Firstly, in terms of promoting industrial upgrading in marine fisheries, Pace et al. [20] highlighted that the digital economy facilitates high-quality development in the marine sector, particularly through industrial advancement. Similarly, Yao et al. [21] found that while the rapid growth of the digital economy contributes to the improvement of the fishery economy’s quality, industrial structure upgrading plays a crucial mediating role. Natsir et al. [22] also emphasized that the digital economy accelerates the transformation and upgrading of the marine industry. Secondly, with respect to innovation and modernization in fisheries management, Benard et al. [23] argued that digital technologies enable the collection and analysis of large volumes of data, allowing fisheries managers to better mitigate production risks, improve product quality, and ultimately support sustainable development. Rowan [24] further demonstrated that digital transformation not only meets the growing needs of fisheries and aquaculture but also promotes the efficient allocation of digital resources through financial support and strategic planning.
Many studies have investigated the impact of the digital economy on marine fisheries and constructed evaluation indicator systems using both quantitative and qualitative methods [1]. They have employed various approaches; for instance, Wang et al. [2] constructed a theoretical model and framework for the integration of the digital economy and marine industry by using programmatic grounded theory coding, concluding that the digital economy provides strong momentum for marine industry development. Researchers like Fang et al. [3] adopted the entropy method and Gini coefficient to evaluate the sustainable development of the marine economy and the impact of digital technology in China’s coastal regions, revealing significant differences in digital economy development levels and green development across different regions. Teniwut [4] proposed a web-based intelligent decision support system for assessing and monitoring marine fisheries plans, leveraging digital technology to enhance decision-making efficiency and sustainable resource utilization by managers.
Despite the positive impact of the digital economy on marine fisheries development, Liu [5] noted regional imbalances in digital growth, with diminishing marginal effects in certain areas, leading to obvious variations in the effectiveness of digital technology applications. This imbalance not only affects the promotional role of the digital economy in fisheries but also exacerbates economic disparities between regions. Meanwhile, although Hailu and Oh [6,7] have incorporated undesired outputs (e.g., pollution and resource waste) into the measurement framework of GTFP, when specifically applied to marine fisheries, the limitations of the models and the lack of data remain difficult obstacles to overcome. Comprehensive consideration of undesirable outputs like pollutant emissions and resource waste in marine fisheries is constrained by current model design and data availability, underscoring the need for further improvement and optimization.
In summary, while previous research has extensively examined the green total factor productivity (GTFP) of marine fisheries and has begun to explore the impact of the digital economy on the economic development of marine fisheries, few studies have specifically addressed the influence of the digital economy on GTFP from the perspective of fisheries. These findings provide valuable context for this paper’s investigation into the high-quality development of the marine fisheries economy driven by the digital economy. This study, therefore, constructs a framework to measure the impact of the digital economy on the GTFP of marine fisheries, aiming to offer a new perspective on the relationship between the digital economy and the quality of marine fisheries development. Using provincial panel data from 2011 to 2022, along with tools such as the Slack-Based Measure (SBM) model, the Global Malmquist–Luenberger (GML) index, and the entropy method, this study calculates both the GTFP and the level of digital economy development across 11 coastal regions in China. Figure 1 provides the specific research framework of this study.
This study investigates how the digital economy affects GTFP in fisheries, with the goal of providing theoretical support for promoting the coordinated development of digitalization and green transformation in the fisheries sector and enhancing the GTFP of fisheries. This study makes several contributions: Firstly, it focuses on the GTFP of marine fisheries in China’s coastal provinces and cities, exploring how the digital economy improves the quality of the marine fisheries economy. By revealing the internal mechanisms through which the digital economy empowers the quality of fisheries development, this research enriches the existing literature on marine fisheries’ economics. Secondly, by constructing a panel threshold model, it examines the nonlinear characteristics of the digital economy’s impact on GTFP, providing deeper insight into the dynamic influence of digital transformation on fisheries development. Finally, this study explores the pathways through which the digital economy enhances fisheries’ GTFP from multiple perspectives, including industrial upgrading, improved resource allocation efficiency, and environmental pollution control. The analysis underscores the dual promotional effect of digital technologies on both the ecological and economic benefits of fisheries, thus expanding the theoretical understanding of the relationship between the digital economy and green productivity.

2. Theoretical Analysis and Research Hypothesis

In this section, based on theoretical foundations and the relevant literature, we analyzed the endogenous mechanisms through which the digital economy affects the green total factor productivity of fisheries. Subsequently, we propose the research hypotheses of this study.

2.1. The Impact of Digital Economy on Green Total Factor Productivity in Fisheries

The digital economy influences the GTFP of fisheries through multiple channels, including enhancing fishing efficiency, optimizing resource management, fostering technological innovation, and supporting sustainable development. From a production efficiency perspective, the digital economy significantly improves fishing operations, reduces resource waste, and optimizes fishing practices through technologies such as the Internet of Things (IoT), big data, and artificial intelligence. Using IoT sensors, fishermen can monitor real-time data on marine conditions and fish distribution, enabling precise fishing practices and preventing overfishing and resource depletion. This intelligent production model minimizes inefficient resource use typical in traditional fisheries, enhances resource efficiency, and thus raises GTFP [8,9]. In terms of resource management, the digital economy offers more precise tools for managing fisheries. Big data analytics allow fishermen to plan fishing activities based on historical data and current market demand, helping to avoid overfishing and protect marine ecosystems [13]. Additionally, blockchain technology allows for transparency in fishing, transportation, and sales, ensuring traceability of fishery products, enhancing market trust, and promoting healthy and sustainable fisheries development [10]. Regarding technological innovation, the digital economy introduces numerous new technologies to fisheries, driving industrial upgrades and technological advancement. Smart aquaculture technologies enable automated management of aquaculture processes, from water quality monitoring to feeding control, significantly improving production efficiency and reducing environmental pollution [11,12]. From the perspective of green and sustainable development, the digital economy not only boosts production efficiency but also plays a positive role in environmental protection and sustainability by promoting the modernization and intelligence of fisheries. Digital technology aids fishermen in optimizing fishing decisions, reducing damage to marine ecosystems, and minimizing the environmental impact of fishing activities [13]. In terms of market optimization, e-commerce platforms and digital logistics systems expedite the entry of fishery products into the market, minimizing resource waste during distribution. Additionally, digital platforms provide market insights that enable fishermen to align production with demand, avoiding overproduction and resource waste. This comprehensive impact mechanism—from production management to market optimization—provides robust support for the green transformation and high-quality development of fisheries. Based on the above analysis, this paper proposes a hypothesis.
H1. 
The digital economy positively promotes green total factor productivity in fisheries.

2.2. Regional Heterogeneity of the Digital Economy’s Impact on Green Total Factor Productivity in the Fisheries Industry

The levels of digital economy development vary significantly across regions, resulting in regional differences in its impact on GTFP in the fisheries industry. Firstly, disparities in economic development contribute to these regional variations. Developed regions generally have more advanced digital infrastructure and greater technological application capabilities, which enable the effective integration of digital technology into fisheries production, thereby significantly boosting TFP. In contrast, less developed regions often lack a solid foundation in the digital economy, with lower levels of technology adoption, resulting in a relatively weaker influence of the digital economy on improving fisheries production efficiency. Secondly, regional differences in the structure of the fisheries industry and resource endowments also play a role. Certain coastal provinces possess abundant marine fisheries resources, offering substantial potential for digital economy applications. In these areas, refined management and intelligent production can lead to significant improvements in resource utilization efficiency. Conversely, in regions with limited fishery resources, the impact of digital technology may be more restricted. Existing studies [14,15,16] have demonstrated that the impact of the digital economy on various industries differs significantly across regions. For instance, research on industries such as manufacturing and agriculture indicates that the driving effect of digital technology on productivity is more pronounced in highly digitized areas. Therefore, it can be inferred that the impact of the digital economy on GTFP in the fisheries industry also reflects significant regional heterogeneity due to differences in regional development levels. Based on the above analysis, Hypothesis 2 is proposed.
H2. 
The impact of the digital economy on green total factor productivity in the fisheries industry exhibits regional heterogeneity.

2.3. Threshold Effect of Digital Economy on Green Total Factor Productivity in Fisheries

The impact of the digital economy on GTFP in fisheries is influenced by the intensity of environmental regulation, potentially exhibiting a threshold effect. This suggests that the relationship between the digital economy and GTFP is nonlinear, varying with the level of environmental regulation. At moderate levels of environmental standards, digital technologies can effectively enhance resource utilization efficiency and environmental performance. However, as environmental standards become increasingly stringent, the marginal utility of the digital economy may decline due to rising compliance costs, which could hinder its productivity-boosting effects.
The digital economy’s influence often displays a diminishing marginal utility threshold effect, indicating that its impact on GTFP in fisheries weakens at successive stages of digitalization. In the early stages of digital economic development, despite a relatively weak technological foundation, the introduction of basic digitalization and initial technological applications significantly promotes production efficiency in fisheries. Yet, as digital infrastructure becomes more established and technological maturity advances, the marginal impact of digitalization begins to diminish, resulting in a gradual reduction in its productivity-enhancing effect. In fisheries, the initial applications of technologies like the IoT, cloud computing, and artificial intelligence significantly improve resource allocation efficiency. However, as investment in these technologies continues, their effects on enhancing green productivity gradually reach a saturation point. At this stage, productivity improvements are no longer driven solely by new technology inputs but increasingly rely on accumulated technological advancements and enhanced management efficiencies, where the diminishing marginal utility effect becomes more pronounced. Based on the above analysis, Hypothesis 2 is proposed.
H3. 
There is a threshold effect for the impact of the digital economy on green total factor productivity of the fisheries industry.

3. Research Design

Drawing on the previous literature and national regulations, we established an indicator system for measuring the digital economy and used the entropy method to objectively assess the development level of the digital economy. Based on data from China’s coastal provinces and cities from 2011 to 2022, we employed the non-radial SBM super-efficiency model and the Global Malmquist–Luenberger productivity index to measure the green total factor productivity of fisheries and analyzed its trends.

3.1. Model Specification

3.1.1. Construction of Benchmark Regression Model

To investigate the impact of the digital economy on the GTFP of the fisheries industry, the following benchmark model is first constructed:
GTFPit = α0 + α1DIG + α2Xit + μi + δt + εit
In the expression, GTFPit represents the green total factor productivity of fisheries in province i in year t, DIG means the level of digital economy development, Xit denotes a series of control variables, μi represents the fixed effect of province i that does not change with time, δt is the time fixed effect, and εit is the random disturbance term.

3.1.2. Panel Threshold Model

To verify the theoretical hypothesis proposed in the previous section, this paper follows Hansen’s method [17], using the level of environmental regulation (ENV) as a threshold variable to further explore the nonlinear impact of the digital economy on GTFP. The following panel threshold model is constructed, as seen in Equation (2).
GTFPit = α + β1DIGit × I(ENVitγ) + β2DIGit × I(ENVit > γ) + λXit + εit
where ENVit represents the threshold variable, indicating the level of environmental regulation in province i in year t; γ is the corresponding threshold value; I(.) is the indicator function; α is the intercept term; Xit represents the control variables; and εit is the random disturbance term.

3.2. Variable Selection and Description

3.2.1. Explained Variable—Green Total Factor Productivity

The SBM-GML model is able to consider both desired and non-desired outputs and has significant advantages in the study of GTFP, providing scientific and comprehensive results. This paper incorporates multiple inputs, desired outputs, and undesired outputs into the measurement framework simultaneously, utilizing the SBM-GML model to calculate the fisheries’ GTFP of 11 coastal regions in China from 2011 to 2022. Based on previous studies, this paper constructs a measurement index system for fisheries’ GTFP [18,19], establishing an index system from both input and output perspectives. Labor, capital, and land are selected as input factors, and output indicators are constructed from two perspectives: desired output and undesired output. The specific input–output index system is shown in Table 1.
The SBM model is expressed as Equation (3), where θ* represents the target efficiency value; m represents the number of inputs; q and h represent the number of desired and undesired outputs, respectively; λ is the weight vector; S, Sa, and Sg represent the slack variables for inputs, desired outputs, and undesired outputs, respectively; and X, Ya, and Yg denote the matrices for inputs, desired outputs, and undesired outputs, respectively. The GML index model is shown in Equation (4), where Dt(xt, yt, bt) and DG(xt, yt, bt) represent the contemporaneous and global directional distance functions [20,21], respectively, and bt represents the undesired output of the decision-making unit in period t.
θ * = m i n 1 1 m i = 1 m s i x i 0 1 + 1 q + h r = 1 q s r a y r 0 a + r = 1 h s r g y r 0 g S . T . x 0 = X λ + S y 0 a = Y a λ S a y 0 g = Y g λ + S g S 0 , S a 0 , S g 0 , λ 0
G M L t , t + 1 x t , y t , b t , x t + 1 , y t + 1 , b t + 1 = 1 + D G x t + 1 , y t + 1 , b t + 1 1 + D G x t , y t , b t = 1 + D t + 1 x t + 1 , y t + 1 , b t + 1 1 + D t x t , y t , b t × 1 + D G x t + 1 , y t + 1 , b t + 1 / 1 + D t + 1 x t + 1 , y t + 1 , b t + 1 ( 1 + D G x t , y t , b t / 1 + D t x t , y t , b t = E C t , t + 1 × T C t , t + 1

3.2.2. Explanatory Variables—Digital Economy

Based on previous studies and relevant national indicators, this research establishes a measurement index for the digital economy. Referring to the evaluation system of digital economy level constructed by Brandt et al. [22], a comprehensive evaluation system with 13 secondary indicators is developed across three dimensions: digital infrastructure, digital industry development, and digital innovation environment. Regarding digital infrastructure, six indicators are used to reflect the level of digital infrastructure construction in each administrative region: Internet broadband access volume, long-distance optical fiber length, number of network domain names, number of web pages, number of IPv4 addresses, Internet penetration rate, and mobile phone penetration rate. For digital industry development, express delivery volume, total postal business volume, and total telecommunications business volume are adopted to evaluate the development level of the digital industry. As for the digital innovation environment, the potential for digital innovation development is mainly reflected through the number of patent applications, R&D expenditure intensity, and the Peking University Digital Financial Inclusion Index of China. The “+” symbol in the “Attribute” column indicates that the secondary indicator contributes positively to the development level of the digital economy. Specifically, a higher value of the indicator corresponds to a greater positive impact on the development level of the digital economy. This paper utilizes the entropy value method to calculate the weights of the indicators, and based on the sample data and weights, a comprehensive score is calculated, and the final score is taken as the digital economy development index. The specific indicator system is shown in Table 2.
The entropy method is an objective weighting approach based on information entropy theory, which effectively avoids the bias associated with subjective weighting and is suitable for multi-indicator comprehensive evaluation.
The specific steps of the entropy method are as follows:
Data standardization: first, the original data are standardized to eliminate the influence of different units and scales. The standardization formula is as follows:
Z i j = X i j m i n X j m a x X j m i n X j
where X i j is the original value of the j-th indicator for the i-th sample, m i n X j and m a x X j are the minimum and maximum values of the j-th indicator, respectively, and Z i j is the standardized value.
Calculation of entropy value: the entropy value e j for each indicator is calculated using the following formula:
e j = 1 l n n i = 1 n p i j l n p i j
where p i j = Z i j Σ i = 1 n Z i j , and n is the number of samples.
Calculation of weights: the weight w j for each indicator is calculated based on the entropy value using the following formula:
w j = 1 e j i = 1 m 1 e j
where m is the number of indicators.
Calculation of comprehensive scores: the comprehensive score S i for each sample is calculated using the weights and standardized data:
S i = i = 1 m w j Z i j
where S i is the comprehensive score for the i-th sample.

3.2.3. Threshold Variable

Environmental regulation (ENV) is meant to constrain the production and consumption behaviors of enterprises and individuals, reduce the negative impact on the environment, and promote ecological protection and green economic development. There is a nonlinear relationship between environmental regulation of different intensities and GTFP. Using environmental regulation as a threshold variable can reveal this nonlinear pattern of change and help to deeply understand the impact of environmental regulation on the relationship between the digital economy and green development [23,24].

3.2.4. Control Variables

To address the endogeneity problem that may arise from omitted variables, this paper draws on existing research regarding the influencing factors of GTFP in fisheries [25,26], selects other factors that affect the resilience of fisheries development, and adds the following control variables to the econometric model: regional education level (EDU), measured by the average years of education in the selected regions; intensity of fishermen training (TRAIN), assessed by the ratio of trained fishermen to total practitioners; intensity of technology promotion (TEC), estimated by the ratio of aquaculture promotion funding to fishery output value; degree of marketization (MAR), calculated by the proportion of technology market turnover in regional GDP; and industrialization level (IND), estimated by the logarithm of the number of industrial enterprises above a certain size in each region. The variables “TRAIN” and “EDU” are complementary variables in our study, with the former focusing on the training intensity for fishermen and the latter reflecting the overall educational level in the region. All variable names and calculations are shown in Table 3.

3.3. Data Source and Descriptive Statistics

This article utilizes panel data from 11 coastal regions in China spanning from 2011 to 2022, as illustrated in Figure 2.
The data of GTFP in fisheries come from the “China Fishery Statistical Yearbook”, “China Ocean Economic Statistical Yearbook”, and relevant reference materials from the National Bureau of Statistics, China. The data of digital economy development level are sourced from the “China Statistical Yearbook”. The digital inclusive finance index in the “China Information Industry Yearbook” comes from the Digital Finance Research Center of Peking University, China. A small amount of missing data are filled using the linear interpolation method. The descriptive statistical results of each variable are shown in Table 4.

4. Results and Analysis

Benchmark regression and threshold regression analyses were conducted to examine the impact of the digital economy on the green total factor productivity of fisheries, exploring the extent of this influence.

4.1. Changes in Fishery GTFP and Digital Economy from 2012 to 2022

This study divides the coastal regions of China into three major marine economy circles: the Northern Marine Economy Circle, including Hebei, Tianjin, Liaoning, and Shandong; the Eastern Marine Economy Circle, including Shanghai, Jiangsu, and Zhejiang; and the Southern Marine Economy Circle, including Fujian, Guangxi, Guangdong, and Hainan. As shown in Figure 3, from 2012 to 2022, the national fisheries’ GTFP exhibited a general upward trend, increasing from 1 to 3.97—an almost fourfold rise. However, there were notable differences in growth rates among the three marine economy circles. The Eastern Marine Economy Circle maintained the highest GTFP levels throughout the period, with a rapid surge after 2016, significantly outpacing other regions by 2022. The Southern Marine Economy Circle demonstrated a similar growth curve, starting from a relatively high base and achieving a fast growth rate, eventually approaching the Eastern Circle. In contrast, the Northern Marine Economy Circle began with the lowest GTFP and experienced the slowest growth, resulting in an increasingly large gap compared to the Eastern and Southern Circles.
Figure 4 provides the kernel density distribution of fishery GTFP for 2012, 2017, and 2022. In 2012, the distribution of fishery GTFP across coastal regions was relatively concentrated, with overall productivity levels being lower. By 2017, the distribution had become more dispersed, suggesting some improvement in fishery GTFP. Several coastal regions exhibited higher productivity compared to 2012, reflecting increased differentiation. In 2022, the distribution had broadened even further. Overall, while there were improvements in fishery GTFP, the progress remained uneven, with certain areas still experiencing lower productivity levels, while others showed higher levels of growth.
Figure 5 shows that the spatial distribution of the GTFP of fisheries in coastal regions has changed significantly between 2012 and 2022. In 2012, the overall level of GTFP was low, with most coastal provinces in the range of 0.8 to 1.5, characterized by “low in the North and South and high in the East”. Relying on its strong economic foundation and technological strength, the eastern region has a slightly higher level at the beginning; the southern region also has certain advantages due to its rich natural resources; while the overall level of the northern region is on the low side, mostly concentrated around 1. In 2017, the overall level of the GTFP increased, and the gap between provinces narrowed, concentrating around 2, with an overall characteristic of high in the south and low in the north. In 2022, the overall level of the GTFP was significantly increased. The eastern region has experienced rapid growth, driven by the digital economy and supportive policies, with its GTFP level peaking among the three regions. The southern region closely follows, though there is internal imbalance, such as the fast growth rates of Guangdong and Hainan, while Guangxi lags behind slightly. The northern region, while showing some improvement, has a significantly slower growth rate compared to other regions due to issues related to resource endowment and industrial structure, and it remains the lowest-performing region in the country. The variations in the GTFP trend are mainly affected by the level of economic development, policy support, technical inputs, resource endowment, and market demand. The rapid growth of the eastern and southern regions has benefited from the promotion of digital fisheries, government policy support, and good natural conditions. In contrast, the lagging in the northern region reflects the delays in policy implementation, funding support, or technology promotion, constraints of natural conditions, and phased industrial restructuring.
During the study period, the development of China’s digital economy showed an upward trend, rising from 0.13 to 0.38 (see Figure 6), an increase of nearly three times, with average annual growth rates of more than 10%, a high rate of growth but a low overall level. Overall, the level of digital economy development in the Eastern Marine Economy Circle is generally ahead, followed by the south, and the level of digital economy development in the north is the lowest. This trend is mainly attributed to the strong economic foundation, powerful scientific and technological innovation capacity, strong policy support, and abundant human resources in the eastern coastal region. These factors are intertwined, and together they provide solid support and broad space for the vigorous development of the digital economy.
As shown in Figure 7, the kernel density of the digital economy as a whole shifts to the right, indicating a gradual increase in its level. The curve’s shape also shifts to the right, with a decrease in the peak value but an increase in width, signifying that the gap between the digital economies of different regions is gradually widening. In 2012, the distribution of the digital economy was more concentrated, reflecting the early stage of its development at that time. The differences in development levels were relatively small, with most of the coastal regions having a relatively similar level of digital economy. By 2017, the distribution of the digital economy had expanded towards both ends, suggesting that the trend towards differentiation was beginning to emerge. In 2022, the distribution became more dispersed, revealing clear disparities, particularly in the eastern region, where the level of digital economy development was relatively higher than in the northern and southern regions. This change highlights the unbalanced regional development of the digital economy, with substantial variations in the speed and depth of digital transformation across coastal regions.
Figure 8 illustrates the evolution of the digital economy across China’s coastal provinces from 2012 to 2022. The overall quality of the digital economy exhibits a spatial distribution pattern characterized by “low in the North and South, and high in the East.” In 2012, most provinces had an average digital economy index around 0.17, with only a few exceeding 0.25, reflecting the relatively low development of digital economic infrastructure at the time. By 2017, the digital economy had shown significant growth across most provinces, narrowing the regional disparities. The east and south regions had higher digital economy levels, while the north continued to lag behind. In 2022, the digital economy level showed considerable improvement across all regions, with an average of 0.48 in the east, 0.38 in the south, and 0.29 in the north. The gap between regions remained pronounced, with Guangdong emerging as the leader, boasting an average value above 0.59, while Hainan’s digital economy remained the lowest at 0.09. The Eastern Marine Economy Circle displayed a marked agglomeration effect, with frequent digital activities and a robust innovation atmosphere, while the north exhibited a noticeable digital divide. These disparities are mainly attributed to imbalances in regional economic development, infrastructure differences, and varying levels of policy support.

4.2. Baseline Regression Analysis

Regression analysis of the model was conducted using Stata 18.0. In selecting the econometric model, the F-test results reveal a p-value of 0.000, indicating significance at the 1% level, which confirms the validity of the F-test. Subsequently, the Hausman test was conducted, yielding a p-value of 0.000. As a result, the null hypothesis is rejected, and this study adopts the fixed-effects model for regression analysis. During the regression analysis, a stepwise regression approach was employed, while simultaneously investigating the impact of control factors on the coefficient changes of key explanatory variables. The specific results are presented in Table 5.
Model (1) to Model (7) in Table 5 present the baseline regression results of the impact of digital economy development on GTFP in the fisheries sector. Model (1) does not include any control variables, while Models (2) to (6) incorporate various control variables, respectively. Model (7) is a two-way fixed effects model. For all models, the coefficients for the digital economy are positive and significant in Models (1) to (6) (p < 0.001), indicating that the development of the digital economy significantly enhances marine fisheries’ GTFP. This may be attributed to the more efficient information exchange and resource allocation brought by the digital economy, which improves the efficiency and environmental sustainability of fisheries production. Thus, Hypothesis H1 is supported. However, in the two-way fixed effects model (Model (7)), the coefficient for DIG becomes negative and insignificant, suggesting that after controlling for time and individual fixed effects, the impact of the digital economy is weakened or controlled by other factors. Regional education level has a significant positive impact on fisheries’ GTFP in Models (2) to (6) (p < 0.05), meaning that higher education levels among fishermen lead to higher fisheries productivity, reflecting the importance of education in enhancing production efficiency. Training intensity gradually exhibits a positive impact in Models (4) to (7) and is significant in some models (p < 0.05). This suggests that skills training for fishermen contributes to improving fisheries’ GTFP, albeit with a relatively weak effect. Intensity of technology promotion is negative in Models (5) to (7) and mostly significant (p < 0.05). This possibly reflects that technology promotion in the short term can lead to increased costs of production adjustment or transformation, thereby temporarily reducing production efficiency. The results for the degree of marketization are inconsistent in Models (6) and (7). It has no significant impact in Model (6) but shows a significant negative effect in Model (7) (p < 0.001), implying that marketization may bring about increased competition or unequal resource allocation, thereby affecting productivity. The industrialization level is significantly positive in both Models (6) and (7) (p < 0.001), showing that an increase in the level of industrialization can promote the improvement of fisheries production efficiency, especially through the adoption of technology and efficiency enhancements during industrial upgrading. The R2 value gradually increases from 0.410 in Model (1) to 0.718 in Model (7), revealing that with the addition of control variables and the control of fixed effects, the explanatory power of the models gradually enhances. The F-values are high in all models, indicating the overall significance of the models. In summary, the digital economy, education, training, and the level of industrialization remarkedly contribute to the improvement of fisheries’ GTFP, while technology promotion and the degree of marketization may have negative impacts in the short term.

4.3. Analysis of Regional Heterogeneity

Due to the variations in the development levels of the digital economy and the models of marine economic development among coastal regions, the impact of the digital economy on the GTFP of the marine fisheries exhibits prominent regional heterogeneity. As mentioned in Section 4.1, three major marine economy circles, the Northern Marine Economy Circle, the Eastern Marine Economy Circle, and the Southern Marine Economy Circle, are used to analyze the influence of the digital economy on marine fisheries’ GTFP in different regions. The specific results are presented in Table 6. The digital economy in the Northern Circle has the most significant promoting effect on fisheries’ GTFP, suggesting that the region boasts relatively developed digital infrastructure and mature applications of digital technology, effectively enhancing fisheries’ productivity. Although the digital economy in the East Circle has a positive effect on GTFP, its impact is lower than those in the Northern Circle, implying that the development of the digital economy in this region is slightly less advanced. This may be because the modern marine system in this area is relatively complete, and the growth of its marine fisheries’ GTFP is less dependent on the spillover effects brought about by the development of the digital economy. In contrast, the impact of the digital economy in the Southern Circle is insignificant. This could be due to the region’s relatively weak economic foundation, a slower digitization process in fisheries compared to other areas, and a smaller sample size in this economic circle, which may limit its explanatory power.
Notably, there are significant differences among the three major marine economic circles regarding the influence of factors such as the digital economy, education level, and industrialization on fisheries’ GTFP. The Northern Circle excels in digital infrastructure and productivity enhancement, while the Southern Circle relies more on the driving force of industrialization. The East Circle falls between the two, exhibiting a synergistic effect between digitization and fisheries development that has not yet been fully realized. The results indicate that the digital economy has different promoting effects on marine fisheries’ GTFP across different regions, thus validating Hypothesis H2.

4.4. Robustness Tests

To test the reliability and consistency of the impact of the digital economy on the GTFP of marine fisheries, robustness tests were conducted on the regression results. Firstly, the core explanatory variable is replaced. This paper refers to the digital economy measurement indicators of Pan et al. [27] and uses the digital economy level measured by principal component analysis to replace the original core explanatory variable for regression testing. The regression results after replacing the core explanatory variable are shown in columns (1) and (2) of Table 7. The regression coefficient of the digital economy on marine economic GTFP remains significantly positive, indicating that the digital economy has a positive promoting effect on marine fisheries’ GTFP, which is consistent with the previous results.
Secondly, the core explanatory variable is lagged by one period. There may be a time lag in the impact of digital economy development on marine economic GTFP. Therefore, this paper lags the digital economy development level by one period to replace the core explanatory variable and conducts the regression again. The regression results are shown in Table 7. The lagged digital economy variable (L.DIG) in Models (3) and (4) still has a significant positive impact on GTFP, suggesting that the positive impact of the digital economy has certain continuity and stability. After lagging by one period, the promoting effect of the digital economy on GTFP remains significant, which enhances the robustness of the model results.

4.5. Analysis of Threshold Regression Results

The theoretical analysis presented earlier suggests that the impact of the digital economy on fisheries’ GTFP is not necessarily a straightforward linear relationship and may exhibit a threshold effect. Based on this, this paper follows the approach of Wang et al. [28,29] and conducts a threshold effect test with the level of environmental regulation as the threshold variable. This paper employs the Bootstrap sampling method with 300 iterations to estimate the threshold values and related statistics. The specific results are presented in Table 8 and Table 9.
As can be seen from Table 8, the triple threshold fails to pass the significance test, while the F-statistic of the single threshold is significant at the 5% level, and the F-statistic of the double threshold passes the significance test at the 5% level. The first threshold value is 10.04, and the second threshold value is 12.05. The existence of the threshold effect suggests that the impact of digital economy on GTFP in fisheries is not a linear relationship but is subject to different stages of digital economy development.
After passing the threshold existence test, the estimation results of the panel threshold model are presented in Table 9. It can be seen that when the level of environmental regulation is below the first threshold value of 10.04, the influence coefficient of the core explanatory variable DIG is 17.48. Therefore, it can be concluded that within the first threshold interval, the digital economy has a significant positive effect on promoting GTFP in fisheries. When environmental regulation levels fall between the first threshold (10.04) and the second threshold (12.05), the influence coefficient decreases to 8.636, yet it remains significant, indicating that the digital economy continues to positively impact GTFP. When the level of environmental regulation is above the second threshold value of 12.05, the influence coefficient of the core explanatory variable DIG is 4.731, which still indicates a significant positive promoting effect. The threshold effect suggests that as the level of environmental regulation increases, the influence coefficient of the core explanatory variable DIG on GTFP in fisheries gradually decreases. This means that when the digital economy develops to a certain extent, the effect of each additional digital investment on improving TFP will gradually decrease, causing a gradual decline in the influence coefficient. This is because, in a low-level digital economy environment, the introduction of digital technology rapidly improves the efficiency of information acquisition, production management, and resource allocation, leading to remarkable productivity growth. However, as the level of digitization increases, the spillover effects of technology gradually weaken, and marginal benefits begin to decline.
In the low-threshold stage, the introduction of the digital economy may bring profound benefits to the fisheries industry in less developed regions. However, as the digital economy develops to a higher level, the increased thresholds for technology acquisition and application may exacerbate the issue of uneven technology promotion, preventing some regions or industries from enjoying the latest technological benefits brought by the digital economy in a timely manner. The phenomenon of the gradually decreasing influence coefficient of the core explanatory variable DIG aligns with the law of diminishing marginal benefits. It also reflects that as the level of digital economy development increases, the complexity of technology integration, the intensification of regional imbalances, and the limitations of policy support may all affect the positive role of the digital economy in promoting green total factor productivity in the fisheries industry. This study confirms that there is a double threshold effect of the digital economy on GTFP in fisheries, validating hypothesis H3.

5. Conclusions

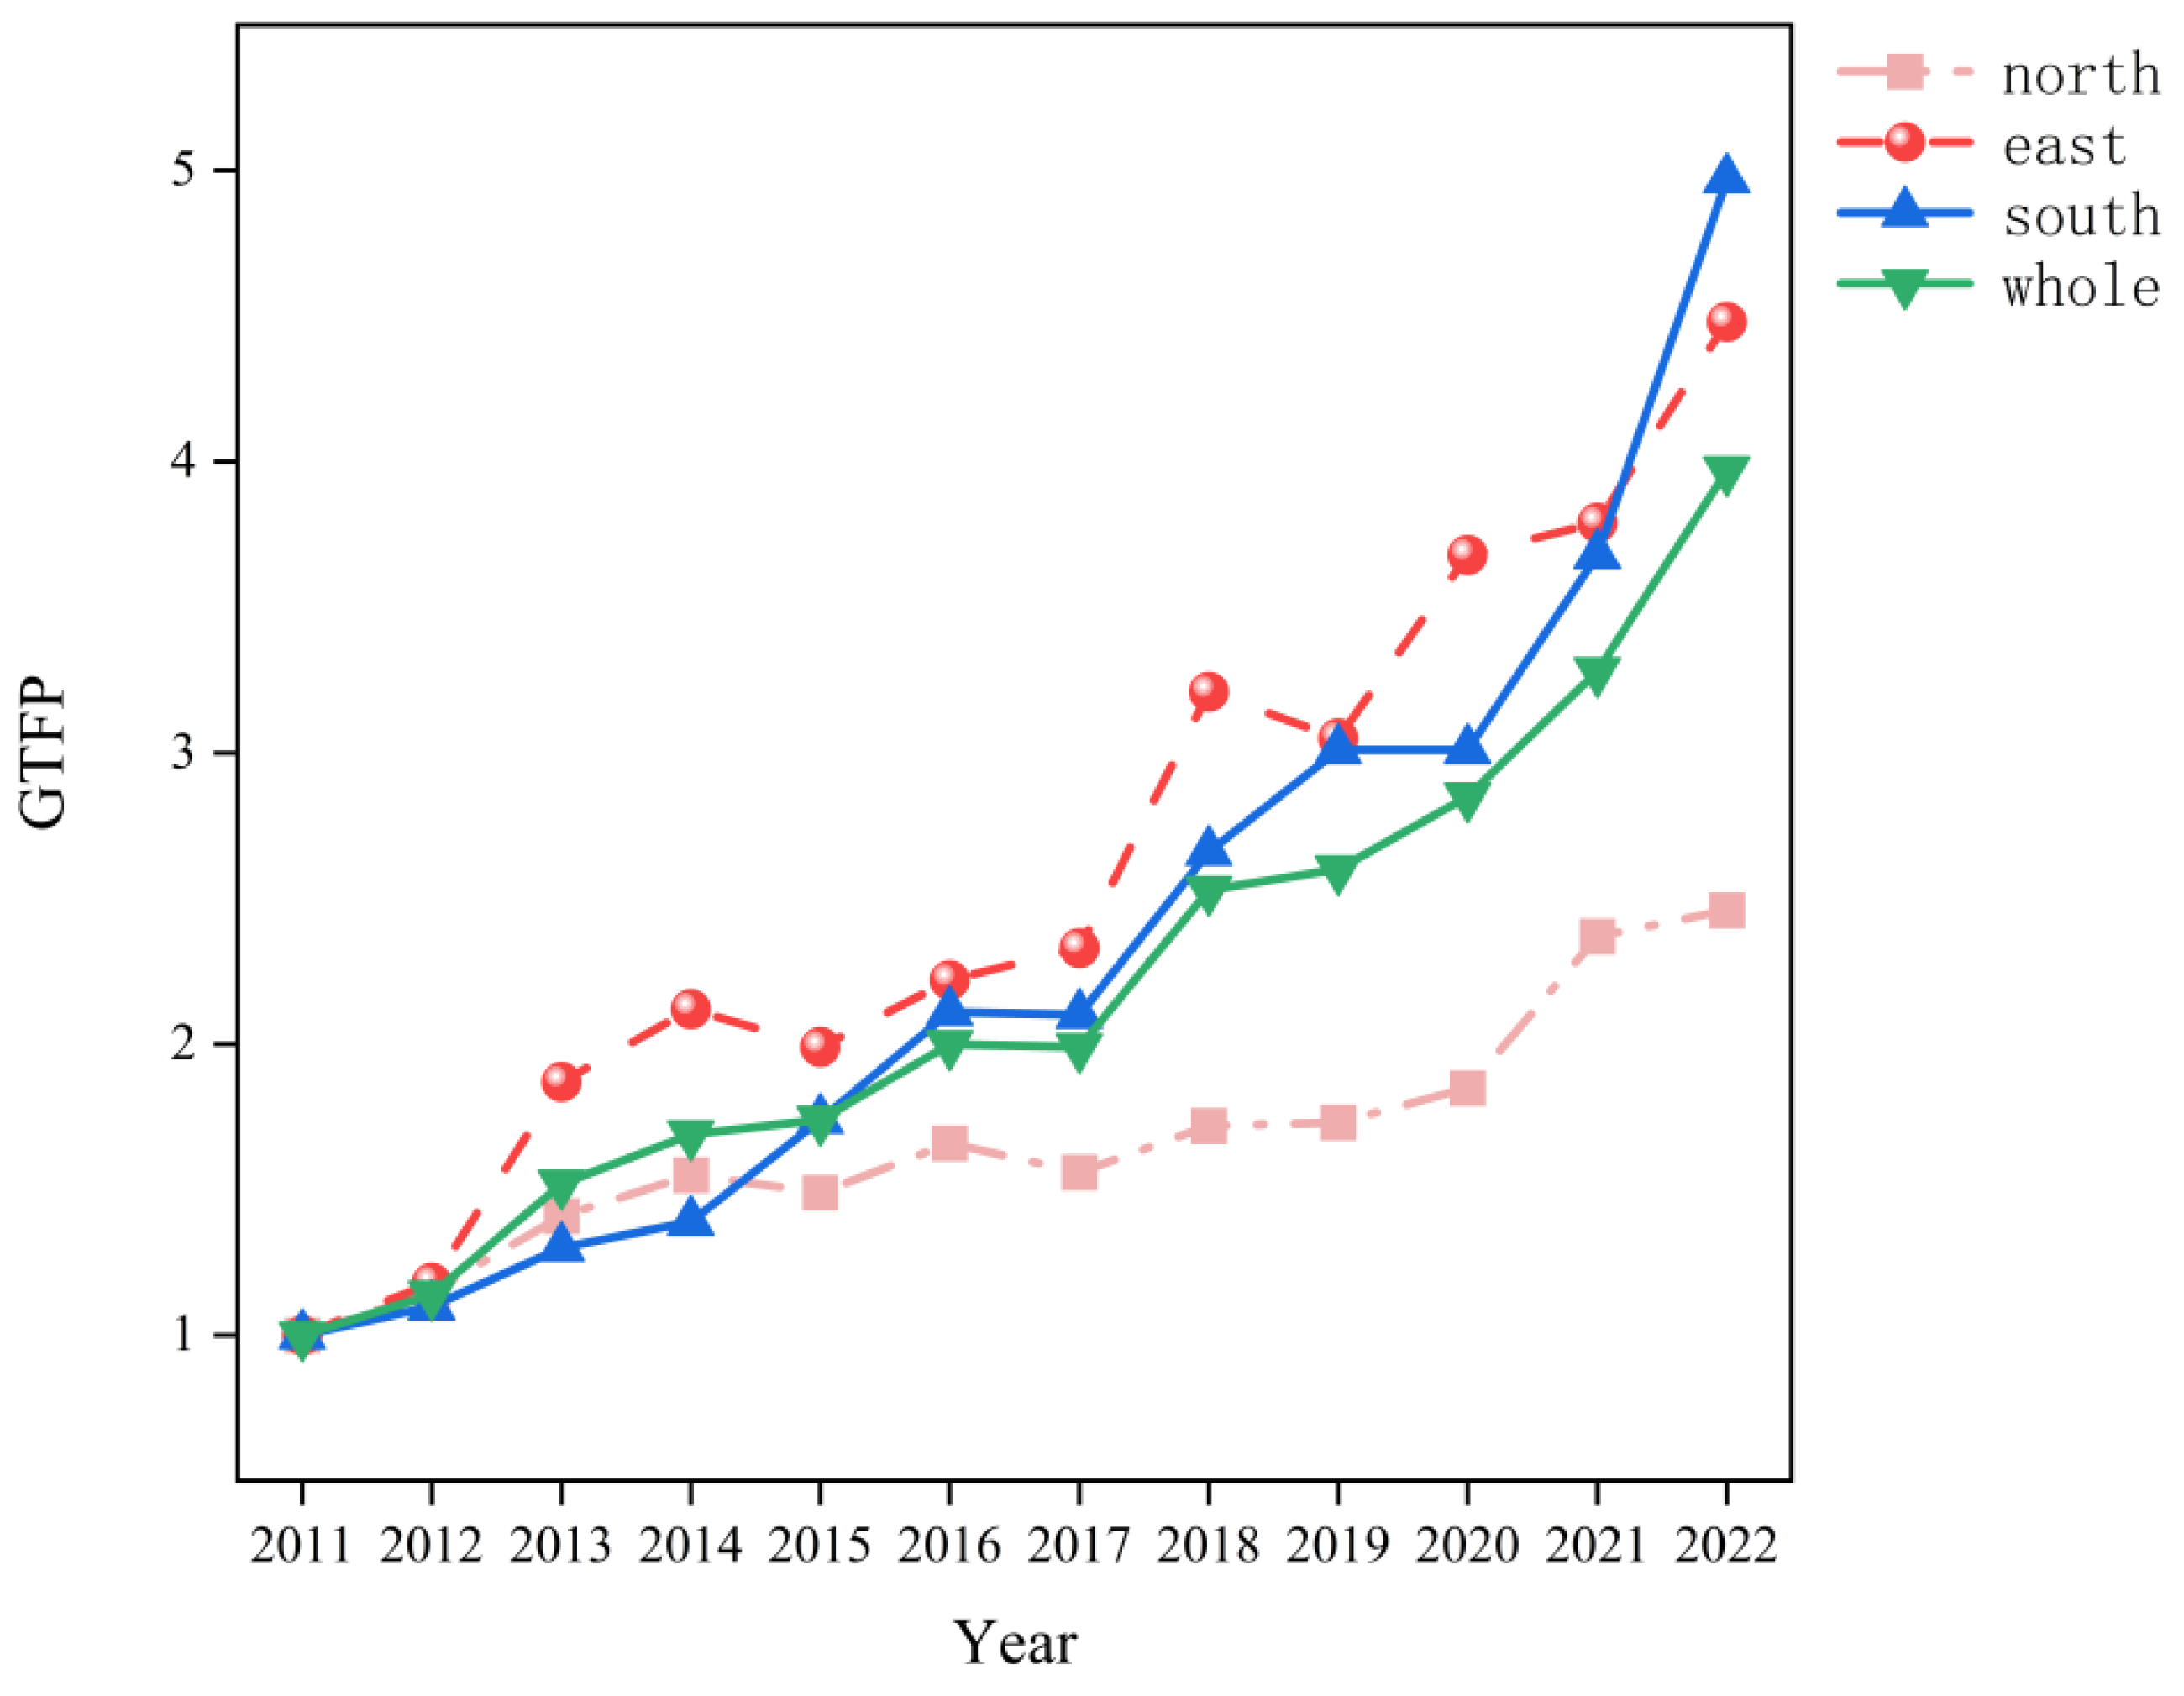
This paper conducts an empirical analysis using panel data from 11 coastal regions in China from 2011 to 2022 to explore the impact of the digital economy on the green total factor productivity (GTFP) of fisheries. The findings indicate that the rapid development of the digital economy has significantly boosted GTFP in this sector. It not only enhances production efficiency through improved resource allocation but also mitigates negative environmental impacts, thereby promoting sustainable development in fisheries. Specifically, hypothesis H1 is validated, demonstrating that the application of digital technologies plays a crucial role in enhancing both production efficiency and environmental friendliness in fisheries. Hypothesis H2 is also validated. This study finds that the eastern and southern coastal regions, with their higher levels of digital economic development, show more significant improvements in fisheries’ GTFP, while the northern regions lag behind. This provides a basis for formulating regionally differentiated policies. Additionally, hypothesis H3 is confirmed, indicating that the promoting effect of the digital economy varies significantly across different development levels, particularly in regions with stronger environmental regulations, where the positive effects of the digital economy are more pronounced.
This research contributes by providing a comprehensive examination of the digital economy’s influence on GTFP in marine fisheries, addressing a notable gap regarding the role of digital technologies in promoting sustainable fisheries. By integrating the digital economy with green fisheries production and sustainable development goals, this study offers valuable theoretical insights for policymakers, particularly in their efforts to support the high-quality development of marine economies while enhancing environmental protection. Future research could further explore the synergistic effects of the digital economy and other green technologies (such as artificial intelligence and blockchain) in fisheries, as well as the extended impact of the digital economy on the upstream and downstream segments of the fisheries industry chain. Moreover, conducting more detailed case studies tailored to the natural conditions, policy environments, and economic foundations of different regions will provide more actionable guidance for the regional application of the digital economy.

Author Contributions

Conceptualization, L.L. and S.J.; methodology, S.J. and Y.L.; software, L.L.; formal analysis, L.L.; data curation, L.L.; writing—original draft preparation, L.L.; writing—review and editing, S.J. and Y.L.; supervision, S.J. and Y.L.; project administration, S.J. and Y.L.; funding acquisition, S.J. All authors have read and agreed to the published version of the manuscript.

Funding

This research received no external funding, and the APC was funded by Zhejiang Ocean University.

Institutional Review Board Statement

Not applicable.

Informed Consent Statement

Not applicable.

Data Availability Statement

The data used in this study are derived from panel data collected from 11 coastal regions in China, covering the period from 2011 to 2022. The datasets utilized for the empirical analysis are available upon reasonable request from the corresponding author.

Conflicts of Interest

The authors declare no conflicts of interest.

References

  1. Mustapha, U.F.; Alhassan, A.; Jiang, D.; Li, G. Sustainable Aquaculture Development: A Review on the Roles of Cloud Computing, Internet of Things and Artificial Intelligence (CIA). Rev. Aquac. 2021, 13, 2076–2091. [Google Scholar] [CrossRef]
  2. Wang, J.; Lu, Y.; Li, Z. Research on the Integrated Development of China’s Marine Industry Empowered by the Digital Economy: Architecture Design and Implementation Pathways. Water 2024, 16, 2381. [Google Scholar] [CrossRef]
  3. Fang, X.; Zhang, Y.; Yang, J.; Zhan, G. An Evaluation of Marine Economy Sustainable Development and the Ramifications of Digital Technologies in China Coastal Regions. Econ. Anal. Policy 2024, 82, 554–570. [Google Scholar] [CrossRef]
  4. Teniwut, W.A.; Hasyim, C.L.; Pentury, F. Towards Smart Government for Sustainable Fisheries and Marine Development: An Intelligent Web-Based Support System Approach in Small Islands. Mar. Policy 2022, 143, 105158. [Google Scholar] [CrossRef]
  5. Liu, Y.; Jiang, Y.; Pei, Z.; Xia, N.; Wang, A. Evolution of the Coupling Coordination between the Marine Economy and Digital Economy. Sustainability 2023, 15, 5600. [Google Scholar] [CrossRef]
  6. Hailu, A.; Veeman, T.S. Non-parametric Productivity Analysis with Undesirable Outputs: An Application to the Canadian Pulp and Paper Industry. Am. J. Agric. Econ. 2001, 83, 605–616. [Google Scholar] [CrossRef]
  7. Oh, D. A Global Malmquist-Luenberger Productivity Index. J. Product. Anal. 2010, 34, 183–197. [Google Scholar] [CrossRef]
  8. Rowan, N.J. The Role of Digital Technologies in Supporting and Improving Fishery and Aquaculture across the Supply Chain–Quo Vadis? Aquac. Fish. 2023, 8, 365–374. [Google Scholar] [CrossRef]
  9. Zhang, H.; Gui, F. The Application and Research of New Digital Technology in Marine Aquaculture. J. Mar. Sci. Eng. 2023, 11, 401. [Google Scholar] [CrossRef]
  10. Liu, Y.; Xie, Y.; Zhong, K. Impact of Digital Economy on Urban Sustainable Development: Evidence from Chinese Cities. Sustain. Dev. 2023, 32, 307–324. [Google Scholar] [CrossRef]
  11. Jiang, Y.; Huang, L.; Liu, Y.; Wang, S. Impact of Digital Development and Technology Innovation on the Marine Fishery Economy Quality. Fishes 2024, 9, 266. [Google Scholar] [CrossRef]
  12. Lin, X.; Zheng, L.; Li, W. Measurement of the Contributions of Science and Technology to the Marine Fisheries Industry in the Coastal Regions of China. Mar. Policy 2019, 108, 103647. [Google Scholar] [CrossRef]
  13. Li, Y.; Ji, J. The Digitalization of Chinese Fisheries and Its Configuration Path to Empower Fishery Sustainable Development. J. Clean. Prod. 2024, 466, 142807. [Google Scholar] [CrossRef]
  14. Xu, W.; Zhu, X. Evaluation and Determinants of the Digital Inclusive Financial Support Efficiency for Marine Carbon Sink Fisheries: Evidence from China. Int. J. Environ. Res. Public Health 2022, 19, 13971. [Google Scholar] [CrossRef] [PubMed]
  15. Currah, A. Digital Effects in the Spatial Economy of Film: Towards a Research Agenda. Area 2003, 35, 64–73. [Google Scholar] [CrossRef]
  16. Ji, J.; Li, Y. Does Fishery Digitalization Matter in the Sustainable Development of Fisheries? Evidence from China. Sustain. Dev. 2024, 32, 7382–7396. [Google Scholar] [CrossRef]
  17. Hansen, B.E. Threshold Effects in Non-Dynamic Panels: Estimation, Testing, and Inference. J. Econ. 1999, 93, 345–368. [Google Scholar] [CrossRef]
  18. Hao, X.; Wang, X.; Wu, H.; Hao, Y. Path to Sustainable Development: Does Digital Economy Matter in Manufacturing Green Total Factor Productivity? Sustain. Dev. 2023, 31, 360–378. [Google Scholar] [CrossRef]
  19. Feng, C.; Huang, J.-B.; Wang, M. Analysis of Green Total-Factor Productivity in China’s Regional Metal Industry: A Meta-Frontier Approach. Resour. Policy 2018, 58, 219–229. [Google Scholar] [CrossRef]
  20. Jiang, H.; Jiang, P.; Wang, D.; Wu, J. Can Smart City Construction Facilitate Green Total Factor Productivity? A Quasi-Natural Experiment Based on China’s Pilot Smart City. Sustain. Cities Soc. 2021, 69, 102809. [Google Scholar] [CrossRef]
  21. Chung, Y.H.; Färe, R.; Grosskopf, S. Productivity and Undesirable Outputs: A Directional Distance Function Approach. J. Environ. Manag. 1997, 51, 229–240. [Google Scholar] [CrossRef]
  22. Brandt, L.; Thun, E. Going Mobile in China: Shifting Value Chains and Upgrading in the Mobile Telecom Sector. Int. J. Technol. Learn. Innov. Dev. 2011, 4, 148. [Google Scholar] [CrossRef]
  23. Boyd, G.A.; McClelland, J.D. The Impact of Environmental Constraints on Productivity Improvement in Integrated Paper Plants. J. Environ. Econ. Manag. 1999, 38, 121–142. [Google Scholar] [CrossRef]
  24. Becker, R.A. Local Environmental Regulation and Plant-Level Productivity. Ecol. Econ. 2011, 70, 2516–2522. [Google Scholar] [CrossRef]
  25. van der Marel, E. Trade in Services and TFP: The Role of Regulation. World Econ. 2012, 35, 1530–1558. [Google Scholar] [CrossRef]
  26. Usman, A.; Ozturk, I.; Ullah, S.; Hassan, A. Does ICT Have Symmetric or Asymmetric Effects on CO2 Emissions? Evidence from Selected Asian Economies. Technol. Soc. 2021, 67, 101692. [Google Scholar] [CrossRef]
  27. Pan, W.; Xie, T.; Wang, Z.; Ma, L. Digital Economy: An Innovation Driver for Total Factor Productivity. J. Bus. Res. 2022, 139, 303–311. [Google Scholar] [CrossRef]
  28. Wang, Q. Fixed-Effect Panel Threshold Model Using Stata. Stata J. Promot. Commun. Stat. Stata 2015, 15, 121–134. [Google Scholar] [CrossRef]
  29. Huang, J.; Cai, X.; Huang, S.; Tian, S.; Lei, H. Technological Factors and Total Factor Productivity in China: Evidence Based on a Panel Threshold Model. China Econ. Rev. 2019, 54, 271–285. [Google Scholar] [CrossRef]
Figure 1. Research framework.
Sustainability 17 02673 g001
Figure 2. The 11 coastal regions in China under study.
Sustainability 17 02673 g002
Figure 3. Trend of fishery GTFP in the three major marine economic circles (2011–2022).
Sustainability 17 02673 g003
Figure 4. Kernel density distribution of fishery GTFP in China.
Sustainability 17 02673 g004
Figure 5. Spatial differences in fisheries’ GTFP in China from 2012 to 2022. (a) 2012, (b) 2017, and (c) 2022.
Sustainability 17 02673 g005
Figure 6. Trend of China’s digital economy in the three major marine economic circles (2011–2022).
Sustainability 17 02673 g006
Figure 7. Kernel density distribution of digital economy development in China.
Sustainability 17 02673 g007
Figure 8. Spatial differences in digital economy in China from 2012 to 2022. (a) 2012, (b) 2017, and (c) 2022.
Sustainability 17 02673 g008
Table 1. Input and output variables for measuring the GML index.
Indicator TypeIndicator NameIndicator Description
Input indicatorsLabor inputProfessionals in marine fisheries (persons)
Capital inputTotal power of marine motorized fishing vessels (kilowatts)
Land inputSeawater aquaculture area (hectares)
Output indicatorsExpected outputTotal output value of marine fisheries (in RMB 10,000)
Undesired outputNitrogen and phosphorus emissions from marine fisheries (tons)
Carbon emissions from marine fisheries (tons)
Table 2. Measurement index system for digital economy development level.
First-Level IndicatorsWeights of Primary IndicatorsSecondary IndicatorsWeights of Secondary IndicatorsAttribute
Digital infrastructure0.555Internet broadband access ports (in hundreds of thousands)0.071 +
Length of long-distance optical fiber cable lines (in ten thousand kilometers)0.069 +
Number of domain names (in ten thousand)0.081 +
Number of web pages (in tens of millions)0.082 +
Number of IPv4 addresses (in millions)0.072 +
Internet penetration rate (%)0.094 +
Mobile phone penetration rate (units per 100 people)0.087 +
Development of digital industry0.241 Express delivery volume (in millions of items)0.099 +
Total postal business volume (in billions of yuan)0.081 +
Total telecommunications business volume (in tens of billions of yuan)0.062 +
Digital innovation environment0.204 Number of patent applications (in thousands)0.062 +
R&D expenditure (in billions of yuan)0.078 +
Digital inclusive finance index0.064 +
Table 3. Variable definition.
Variable NameVariable SymbolCalculation Method
regional education levelEDUAverage years of schooling in selected districts
intensity of fishermen trainingTRAINNumber of fishermen trained/total number of employees
intensity of technology promotionTECAquaculture Extension Funding/Fisheries Production Value Conducted
degree of marketizationMARTechnology market turnover/gross regional product
industrialization levelINDLn(number of industrial enterprises above designated size by region)
Table 4. Descriptive statistical results of each variable.
VariablesMeanStd. dev.Min.Max.
GTFP2.0991.3070.647.76
DIG0.2680.1650.030.85
EDU8.010.3757.119.47
TRAIN1.4253.9890.0125.29
TEC1.0452.2020.0111.5
MAR1.4981.7980.0210.12
IND9.4281.3515.8111.17
Table 5. Baseline regression results.
VariablesModel (1)Model (2)Model (3)Model (4)Model (5)Model (6)Model (7)
DIG6.969 ***6.037 ***6.039 ***6.228 ***6.321 ***4.802 ***−0.646
(9.137)(7.301)(7.274)(7.705)(6.788)(5.500)(−0.492)
EDU 0.788 **0.787 **1.218 ***1.225 ***1.127 ***0.453
(2.601)(2.587)(3.681)(3.667)(3.782)(1.477)
TRAIN 0.0050.081 **0.077 **0.072 **0.052 *
(0.207)(2.262)(1.983)(2.070)(1.672)
TEC −0.373 ***−0.362 **−0.274 **−0.222 *
(−2.886)(−2.578)(−2.173)(−1.940)
MAR −0.016−0.001−0.233 ***
(−0.205)(−0.021)(−3.028)
IND 2.077 ***2.042 ***
(5.581)(5.256)
_cons6.969 ***6.037 ***6.039 ***6.228 ***6.321 ***4.802 ***−0.646
(9.137)(7.301)(7.274)(7.705)(6.788)(5.500)(−0.492)
N132132132132132132132
R20.4100.4420.4420.4790.4790.5900.718
F-test27.629Prob > F (the p-value for an F-test)0.000
Note: The values in brackets are the standard error, and the following table is the same. ***, **, and * indicate p < 0.001, p < 0.01, and p < 0.05, respectively.
Table 6. Regression results for the three major marine economic circles.
VariablesNorthern CircleEastern CircleSouthern Circle
DIG5.833 ***3.189 ***1.858
(5.13)(2.16)(1.09)
EDU1.455 **0.2952.378 ***
(3.43)(0.69)(4.27)
TRAIN0.0660.0120.118
(0.37)(0.30)(0.32)
TEC−0.1730.0090.996
(−1.49)(0.06)(0.72)
MAR−0.018−0.131−0.196
(−0.34)(−0.89)(−0.89)
IND1.076 ***2.700 *5.396 ***
(4.00)(1.97)(5.61)
constant−21.403 ***−28.518 **−62.665 ***
(−4.43)(−2.20)(−7.69)
N484836
R20.6160.4790.863
Note: ***, **, and * indicate p < 0.001, p < 0.01, and p < 0.05, respectively.
Table 7. Results of robustness checks.
VariablesModel (1)Model (2)Model (3)Model (4)
DIG1.115 ***0.740 ***
−8.912(−5.692)
L.DIG 1.110 ***0.702 ***
(−8.749)(−5.114)
EDU 1.087 *** 0.987 ***
(−3.959) (−3.617)
TRAIN 0.075 ** 0.076 **
(−2.333) (−2.469)
TEC −0.205 * −0.214 *
(−1.749) (−1.802)
MAR −0.073 −0.078
(−1.128) (−1.206)
IND 2.011 *** 2.021 ***
(−5.859) (−5.773)
DIG −0.417 *** −0.398 ***
(−4.808) (−4.644)
constant2.099 ***−20.322 ***2.262 ***−19.698 ***
(−29.426)(−5.061)(−31.961)(−4.860)
N132132121121
R20.3980.6550.4130.665
F79.43130.8676.55129.172
Note: ***, **, and * indicate p < 0.001, p < 0.01, and p < 0.05, respectively.
Table 8. Threshold existence test.
Threshold VariableThreshold TypeThreshold Valuep ValueF ValueCritical Value
10%5%1%
Level of Environmental Regulation (ENV) Single threshold10.040.0126.0316.30917.85924.451
Double threshold12.050.01620.513.20315.68724.803
Triple threshold11.270.696.3617.82022.16935.603
Table 9. Estimation results of threshold regression.
Variable NameCoefficient
DIG × I (ENVit ≤ γ1)17.480 **
(3.42)
DIG × I (γ1 < ENVit < γ2)8.636 ***
(6.63)
DIG × I (ENVit ≥ γ2)4.731 ***
(6.28)
Control variablesYes
Constant−22.097 **
(−3.10)
N132
R20.7056
Note: ***, and ** indicate p < 0.001, and p < 0.01, respectively.
Disclaimer/Publisher’s Note: The statements, opinions and data contained in all publications are solely those of the individual author(s) and contributor(s) and not of MDPI and/or the editor(s). MDPI and/or the editor(s) disclaim responsibility for any injury to people or property resulting from any ideas, methods, instructions or products referred to in the content.

