Abstract
Understanding the spatial distribution patterns of soil organic carbon components in Ecological Vegetative Slopes (EVS) is crucial for optimizing restoration strategies, enhancing soil carbon sequestration capacity, and scientifically evaluating rehabilitation effectiveness. It is an important pathway for promoting sustainable development. This study investigated the effects of slope gradient, slope position, vegetation type, and cement content on the spatial distribution characteristics of soil total organic carbon (TOC) and its components (readily oxidizable organic carbon (ROC) and dissolved organic carbon (DOC)) through slope model experiments and laboratory analyses. The key findings revealed that (1) TOC, ROC, and DOC concentrations decreased with increasing slope gradient and upper slope positions, with steeper slopes amplifying positional effects and exhibiting surface-layer accumulation characteristics. (2) The highest TOC, ROC, and DOC content was achieved in the mixed planting slope with Bermudagrass and Magnolia under a substrate thickness of 3 cm and 3% cement content. Lastly, (3) soil pH increased with the slope gradient and upper positions, showing systematic variations across vegetation types and cement contents. Comparative analysis demonstrated that optimizing vegetation composition and cement dosage effectively enhanced SOC accumulation, while slope gradient and position dominated the spatial heterogeneity of carbon distribution. These results provide theoretical and practical guidance for the precision management of slope ecological restoration. These findings provide robust data support for the ecological sustainability of engineering slope restoration and the enhancement of soil carbon storage.
1. Introduction
In the field of ecological restoration and slope management, constructing EVS has become an important environmental protection measure [1,2,3]. This method not only effectively prevents soil erosion but also promotes the restoration of biodiversity and soil health by increasing soil organic carbon reserves [4,5,6,7]. However, while hydrological changes in current EVS research have received ample attention, studies on soil nutrients—central to ecosystem material cycling—have predominantly focused on natural slope soils. There remains a lack of in-depth exploration into the dynamics of organic carbon components in artificially restored slopes, particularly within specialized EVS systems. This study aims to address this knowledge gap [8,9,10].
TOC, ROC, DOC, and pH are key indicators of soil health and ecosystem function [11,12]. TOC is a primary source of biological activity in soil and a key nutrient, playing a crucial role in maintaining soil structure and enhancing soil moisture retention capacity [13,14]. ROC and DOC are two important components of TOC, reflecting the active portion of the soil carbon pool, and are significant for understanding the dynamic changes in soil carbon pools and the ecosystem’s response to environmental changes [15,16]. Soil pH value is another important factor as it affects the structure and diversity of soil microbial communities and is directly related to the mineralization and stability of organic carbon, thus influencing the forms and contents of TOC, ROC, and DOC [17,18,19]. However, existing studies on EVS systems have predominantly focused on the spatial variation characteristics of single physicochemical properties, particularly TOC as an isolated variable, while neglecting the composite distribution patterns of co-existing soil nutrients critical to soil fertility. This study systematically investigates the impacts of multiple influencing factors on the distribution characteristics of these key parameters, aiming to establish a theoretical foundation for enhancing soil carbon sequestration potential in EVS systems [6,20].
As the main natural topographic factors, slope gradient and slope position directly affect the flow and distribution of water and nutrients, thus affecting the accumulation and decomposition processes of soil organic carbon [20,21,22]. Studies have shown that an increase in slope gradient accelerates soil erosion and reduces the accumulation of organic matter, while different slope positions have varying effects on organic carbon accumulation [23,24,25,26]. Vegetation type has a profound impact on soil organic carbon content through biomass input and root–soil interaction [27]. Different vegetation types not only provide varying amounts and qualities of organic matter input but also alter soil physical properties through root exudates, affecting soil microbial activity and significantly enhancing soil erosion resistance, which benefits vegetation growth and soil organic carbon accumulation [6,28,29,30,31]. For example, research by Yuan et al. [32] found that introducing adaptable vegetation like Bermudagrass is crucial for the ecological restoration of slopes. Xiao et al. also pointed out that vegetation like Magnolia can improve soil organic carbon content and enhance water and nutrient retention on slopes [33,34]. In addition, the effect of cement content in soil ecological substrates on EVS has received increasing attention. As an artificial additive, cement affects the activity of soil microorganisms and the accumulation and stability of organic carbon by changing the structure and air permeability of the soil [35,36,37]. Current research lacks analyses on the effects of topographic factors (slope gradient and slope position), vegetation types, and cement content on soil nutrient indicators in ecological restoration. In response, this study conducts a multifaceted analysis of variations in soil organic carbon components and pH under multiple influencing factors, providing a theoretical foundation for optimizing slope ecological vegetation restoration engineering practices.
Therefore, based on large-scale slope model experiments, this study thoroughly investigates the effects of slope gradient, slope position, vegetation type, and substrate cement content on the content and spatial distribution characteristics of TOC, ROC, and DOC in the EVS. The findings provide a scientific basis for the design and management of ecological vegetation slopes, aiming to improve the soil quality of ecological slopes and enhance carbon sequestration capacity.
2. Materials and Methods
2.1. Overview of the Study Area
The slope model test site is located within the ecological restoration pilot base for fragile ecosystems at Hubei University of Technology. The site is expansive and situated in a subtropical monsoon humid region, characterized by abundant sunlight throughout the year. Rainfall is concentrated in the summer, with short-duration but intense storms; the maximum daily rainfall in the region can reach up to 248 mm, with an annual average precipitation ranging between 1150 mm and 1190 mm.
Representative slope gradients were selected from engineering slopes, including steep slopes, moderate slopes, and gentle slopes. Built as shown in (Figure 1a,b), the model slopes were constructed at gradients of 1:1.5, 1:1.75, and 1:2, including both vegetated slopes and bare soil slopes. The model dimensions were designed with a width of 1.5 m and a height of 2 m. Based on practical engineering requirements, the constraint conditions of rigid support structures such as retaining walls are replicated, the slope models were constructed using brick masonry, with the walls coated with fine sand mortar to create a smooth surface, thereby reducing interface friction effects. The soil samples were air-dried, crushed, and sieved before being used as fill material. The initial moisture content was set to the optimum moisture content, and the slope fill was divided into seven layers, with each layer being roughened to ensure tight inter-layer bonding. During the filling process, a small compactor was used to compact the soil along the direction parallel to the slope surface, and in situ sampling was conducted to test the compaction degree, ensuring the density and homogeneity of the filled soil.
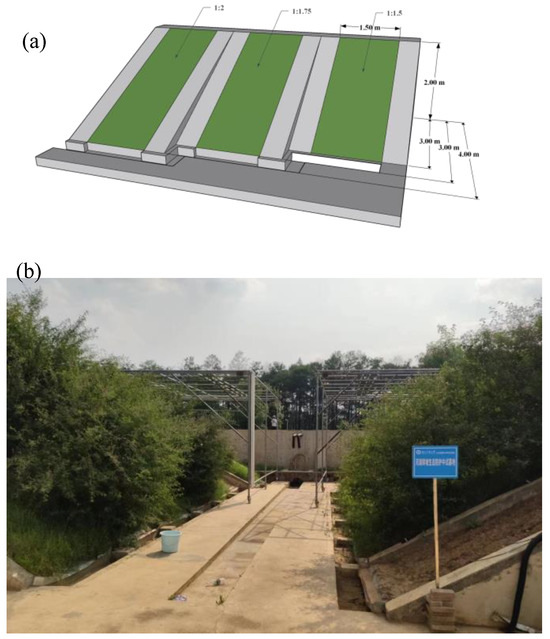
Figure 1.
Slope model diagram. (a) Slope model parameters. (b) Real map of slope.
To reduce human interference and achieve the desired experiment results, the test soil samples were collected from a construction site pit in the South Lake area of Wuhan. The samples were undisturbed and contained few impurities, with a plastic limit of 23.0%, a liquid limit of 41.0%, and a natural density of 1.50 g/cm3. The soil’s optimum moisture content was 20.0%, and the natural moisture content was approximately 15.3%. Particle size analysis was conducted using a laser particle size analyzer, and the particle size distribution curve of the soil sample is shown in (Figure 2), indicating good gradation.
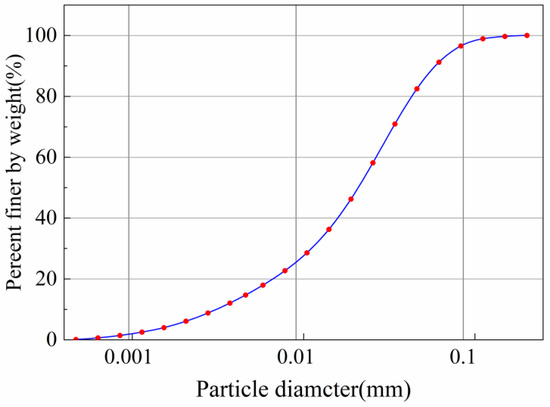
Figure 2.
Grading curve.
2.2. Vegetation Selection and Substrate Formulation
Due to their dual benefits in effective restoration and economic viability, Bermudagrass (grass), Magnolia (shrub), and their mixed planting (grass–shrub)—widely distributed in the Central China region—were selected as slope protection vegetation, with a seeding rate of 30 g/m2. Based on substrate formulation standards, slope characteristics, and prior hydrological studies from our research group, substrate designs were established with cement (P.O42.5 ordinary Portland cement) incorporation rates of 0%, 1%, and 3% (by soil mass) and substrate thicknesses of 1 cm, 3 cm, and 5 cm. After sowing, to maintain 70–80% field capacity while balancing water use efficiency, irrigation was scheduled twice daily (morning and evening) at 24 L per application to establish and maintain the turf. Ecological indicators, including the germination rate and plant height, were monitored during maintenance. Post-cultivation observations confirmed the achievement of targeted growth outcomes (Figure 3a–d).
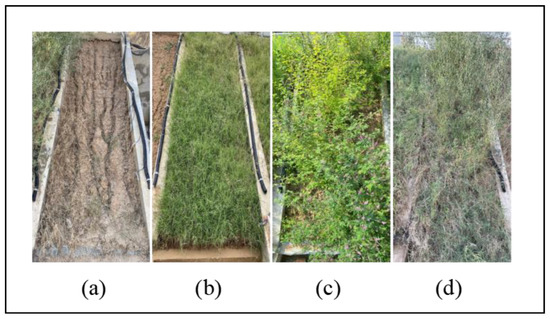
Figure 3.
Slopes of different plant species. (a) Bare slope; (b) Bermudagrass slope; (c) Magnolia slope; (d) grass–shrub slope.
2.3. Sample Collection
The slope of the model was divided into three zones: upper, middle, and lower slopes, based on the specific length of the slope, as shown in (Figure 3a). Five sampling points per position were randomly arranged in an S-shaped pattern to ensure spatial representativeness. At each point, soil samples were vertically collected from four depth intervals (0–5 cm, 5–10 cm, 10–15 cm, and 15–20 cm) using a 4-cm-diameter geological auger perpendicular to the slope surface, yielding a total of 540 samples collected (108 sampling points × 5 replicates). After sampling, the five soil samples from each layer were thoroughly mixed and placed in plastic-sealed bags, which were then labeled and taken back to the laboratory. The collected soil samples were free of dead branches, leaves, and stones, and were divided into two equal portions. One portion was air-dried in a well-ventilated, cool indoor area, while the other was stored in a sealed bag at 4 °C as fresh samples for subsequent biochemical analyses.
2.4. Physical and Chemical Analysis
Soil pH was measured using the water extraction potentiometric method (water–soil = 2.5:1) [38]. Soil organic carbon was determined using the potassium dichromate oxidation-spectrophotometric method [39]. Readily oxidizable organic carbon in soil was measured using a 333 mmol/L potassium permanganate solution oxidation method [40]. The dissolved organic carbon in the soil was determined using the K2SO4 extraction-spectrophotometric method [41].
2.5. Date Processing
Excel 2016 was used to statistically analyze the data for each indicator and SPSS 20 software was employed for statistical analysis. Correlation analysis was performed using Pearson’s method. The graphical representation of the data was completed using Origin 2018 software.
3. Results
3.1. Spatial Distribution Characteristics of Slope Soil pH Value
Figure 4 shows the spatial distribution of slope soil under different slope gradients, vegetation types, and cement contents. It can be observed that all slope soils exhibit weak alkalinity, with pH values ranging from 7.92 to 8.48.
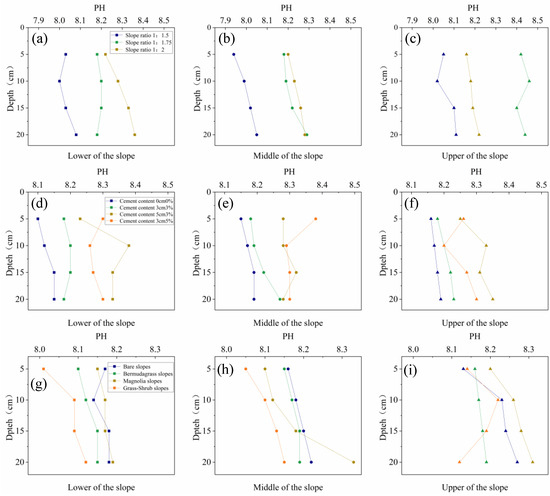
Figure 4.
Variation characteristics of soil pH on slopes with different gradients, vegetation types, and cement content base materials. (a) Soil pH at lower of the slope positions under different slope gradients; (b) soil pH at middle of the slope positions under different slope gradients; (c) soil pH at upper of the slope positions under different slope gradients; (d) soil pH at lower of the slope positions under different cement contents in base materials; (e) soil pH at middle of the slope positions under different cement contents in base materials; (f) soil pH at upper of the slope positions under different cement contents in base materials; (g) soil pH at lower of the slope positions under different vegetation types on slopes; (h) soil pH at middle of the slope positions under different vegetation types on slopes; (i) soil pH at upper of the slope positions under different vegetation types on slopes.
For the 1:1.5 slope ratio, the pH values of the three slope positions are significantly lower than those of the slopes with the other two ratios, and the pH increases gradually with soil depth. There is no significant difference in pH values between the upper, middle, and lower slope positions. For the 1:1.75 slope ratio, the middle and lower slope positions have pH values higher than those of the 1:1.5 slopes, but lower than those of the 1:2 slopes. However, the upper slope position exhibits a significantly higher pH value than the other two slope ratios. In the 1:2 slope ratio, the pH values of the middle and lower slope positions are higher than those of the other two slopes, while the upper slope position’s pH is higher than that of the 1:1.5 slopes but lower than the 1:2 slopes. Overall, in the footslope and midslope zones, the pH increases as the slope ratio decreases, with the pH in the upper slope position being significantly higher at a 1:1.75 slope ratio than at the 1:2 and 1:1.5 ratios. Additionally, in the footslope and midslope zones of all three slope ratios, the pH increases with increasing soil depth, showing a significant positive correlation, while no significant correlation is observed in the upper slope positions.
For slopes without cement addition (0 cm, 0% cement content), the pH values at all slope positions and soil depths are significantly lower than those of the other three slopes, and the pH increases with soil depth, with no significant correlation with slope position. For slopes with 3 cm 3% cement addition, the pH values at the middle and lower slope positions are significantly lower than those of the 5 cm 3% and 3 cm 5% cement slopes, with the pH increasing with slope position. In slopes with 0 cm 0% and 3 cm 3% cement addition, the pH decreases as the slope position increases, showing a positive correlation. In slopes with 5 cm 3% cement addition, the pH at the 0–5 cm depth is lower than that at the 3 cm 5% cement slope, and the pH value in the 0–5 cm soil layer is higher than that in the 5–10 cm and 10–15 cm soil layers. However, across three consecutive depth intervals (5–10 cm, 10–15 cm, and 15–20 cm), the pH of the 5 cm 3% cement slope is higher than that of the 3 cm 5% cement slope. There is no significant correlation between the pH and slope position in the 5 cm 3% and 3 cm 5% cement slopes.
Overall, the pH values of all slopes are mildly alkaline, and the pH values of the four slopes generally increase with soil depth increase. The overall pH values from low to high are in the following order: grass–shrub slope < Bermudagrass slope < Magnolia slope < bare slope. The pH values of the Bermudagrass slope increase with increases in the slope position, but the change is not significant, with the lower slope position exhibiting a significantly lower pH than the other three vegetation types, and the upper slope position’s average pH also being lower than the other three vegetation types. In the upper slope positions, Magnolia slopes exhibited significantly lower pH values at a 15–20 cm soil depth compared to other vegetation types. Within both upper and middle slope positions, however, the mixed vegetation demonstrated the highest pH levels across three shallow soil layers (0–5 cm, 5–10 cm, and 10–15 cm). No significant correlation is observed between the pH values and slope position for the four vegetation types.
3.2. Spatial Distribution Characteristics of Soil Organic Carbon Components on Slopes
3.2.1. Spatial Distribution Characteristics of Organic Carbon Components Under Different Slope Gradients and Position
Table 1 and Figure 5 show the variations in TOC, ROC, and DOC with soil depth and slope position on vegetated slopes with different gradients. The TOC content ranged from 3.07 to 7.54 g/kg, with an average of 5.0597 ± 0.4057 g/kg. The slope with a gradient of 1:2 exhibited the highest organic carbon content, significantly higher than the other two slope gradients, with increases of 16.34% and 24.51% compared to the 1:1.75 and 1:1.5 slopes, respectively. This suggests that the slope gradient significantly influences the organic carbon content in the substrate of vegetated slopes (p < 0.05). Across all soil layers, TOC content increased as the slope gradient decreased, particularly in the 0–5 cm soil depth of slope soils, where the impact of the slope gradient on TOC content was most significant (p < 0.05). Among the four soil depth intervals analyzed, with the exception of the 5–10 cm stratum, the TOC content of slopes with a gradient of 1:5 is significantly lower than that of slopes with a gradient of 1:2. However, no significant differences were observed in the 5–10 cm soil depth.

Table 1.
Basic situation of different slope plots.
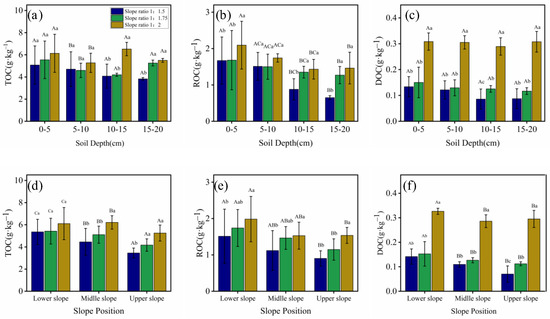
Figure 5.
The TOC, ROC, and DOC of Bermudagrass slope with different slopes and 3 cm 3% cement content changes with depth and slope position. Uppercase letters are assigned to denote statistically significant variations (p < 0.05) between soil layers or topographic positions. Lowercase letters distinguish significant differences (p < 0.05) across varying slope gradients. (a) Vertical distribution of TOC content of different slope gradients. (b) Vertical distribution of ROC content of different slope gradients. (c) Vertical distribution of DOC content of different slope gradients. (d) Spatial variation of TOC across slope positions under varying gradient conditions. (e) Spatial variation of ROC across slope positions under varying gradient conditions. (f) Spatial variation of DOC across slope positions under varying gradient conditions.
The range of ROC content variation is 0.60–2.81 g/kg, with an average of 1.4375 ± 0.1743 g/kg. The slope with a 1:2 gradient has the highest ROC content, being 13.77% and 30.00% higher than the slopes with 1:1.75 and 1:1.5 gradients, respectively. Unlike TOC, although ROC showed a trend of decreasing with increasing slope ratio, no statistically significant differences were detected (p > 0.05). In terms of depth, ROC content decreases as depth increases, following a similar pattern to TOC, but the slope gradient’s effect is most significant in the 15–20 cm depth of soil stratum, while the least significant impact is in the 5–10 cm depth of soil stratum. Overall, TOC content in the 1:2 gradient slope is significantly higher than in the 1:1.5 gradient slope.
The range of DOC content variation is 0.04–0.35 g/kg, with an average of 0.1801 ± 0.0319 g/kg. Similar to TOC and ROC, the DOC content of slopes with a slope gradient of 1:2 was highest, being 59.76% and 63.40% higher than the slopes with 1:1.75 and 1:1.5 gradients, respectively, showing a decrease in TOC content as the slope gradient increases. The difference in DOC content concerning slope gradient is highly significant (p < 0.01). Although the differences in DOC content across soil depths are not significant, they also tend to decrease with increasing depth. The relationship between DOC content and slope gradient is consistent across soil layers, with the highest content in the 1:2 gradient slope, followed by the 1:1.75 and 1:1.5 gradients.
The variation patterns of TOC, ROC, and DOC between different slope positions are consistent and significantly different, with all decreasing as the slope position rises. TOC is the most significantly affected by slope position (p < 0.01). The content of all three organic carbon components increases as the slope gradient decreases. There is no significant change in TOC content across different slope gradients at the lower slope position. The TOC content at the middle slope position of the 1:2 gradient slope is higher than that of the other two gradients, while the TOC content at the upper slope position is higher in the 1:2 and 1:1.75 gradient slopes than in the 1:1.5 gradient slope. The ROC patterns are consistent at the lower and middle slope positions, with significant differences in TOC content between the 1:2 and 1:1.5 gradient slopes. At the upper slope position, the TOC content in the 1:2 gradient slope is significantly higher than in the other two slopes. At the lower, middle, and upper slope positions, the DOC content in the 1:2 gradient slope is significantly higher than in the other two gradients.
3.2.2. Distribution Characteristics of Organic Carbon Components Under Different Vegetation Types
Table 2 and Figure 6 show the variations in TOC, ROC, and DOC with soil depth and slope position on slopes with different vegetation types. The TOC content in the substrate of vegetated slopes ranged from 1.05 to 6.27 g/kg, with an average of 2.3639 ± 0.3251 g/kg. The grass–shrub slope has the highest TOC content, significantly higher than the Bermudagrass slope, Magnolia slope, and bare slope by 22.89%, 26.75%, and 51.86%, respectively. The TOC content in the Bermudagrass slope is significantly higher than in the bare slope and slightly higher than in the Magnolia slope. Significant heterogeneity in Total Organic Carbon (TOC) levels is observed between distinct flora types (p < 0.05). Regarding depth, the TOC content in the 15–20 cm soil layer is most affected by vegetation type. Among the four soil layers with the exception of the 15–20 cm, the TOC content in the Bermudagrass slope is higher than in the Magnolia slope but lower than in the grass–shrub slope. The TOC content at the 0–5 cm depth is significantly higher than at other depths, decreasing with increasing depth, showing a surface accumulation phenomenon. Concerning slope position, the TOC content at the middle slope position is most affected by vegetation type (p < 0.05). The grass–shrub slope has the highest TOC content at the lower and middle slope positions, while the Bermudagrass slope has the highest TOC content at the upper slope position. For all vegetation types, TOC content is lowest at the upper slope position and slightly higher at the lower slope position than at the middle slope position, showing an increasing trend in TOC content from the upper to lower slope positions.
Table 2.
Basic situation of different plant types of sample plots.
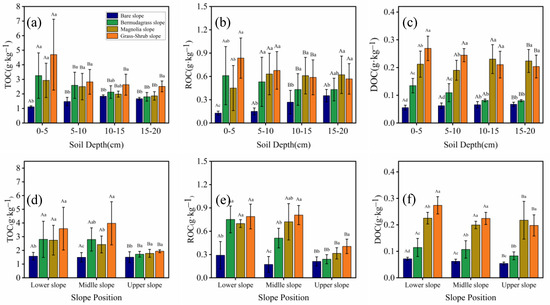
Figure 6.
Different vegetation types with 0 cm 0% cement content and a slope ratio of 1:1.75 for TOC, ROC, and DOC with depth and slope position changes. Uppercase letters denote significant variations (p < 0.05) between soil horizons or slope positions. Lowercase letters represent statistically distinct values (p < 0.05) across vegetation communities. (a) Vertical distribution of TOC content of different vegetation types. (b) Vertical distribution of ROC content of different vegetation types. (c) Vertical distribution of DOC content of different vegetation types. (d) Spatial variation of TOC along slope positions across vegetation types. (e) Spatial variation of ROC along slope positions across vegetation types. (f) Spatial variation of DOC along slope positions across vegetation types.
The range of ROC content variation is 0.10–0.99 g/kg, with an average of 0.4927 ± 0.0771 g/kg. The grass–shrub slope has the highest ROC content, significantly higher than the Magnolia slope, Bermudagrass slope, and bare slope by 13.38%, 24.96%, and 66.33%, respectively. Unlike TOC, the ROC content in the Bermudagrass slope is slightly lower than in the Magnolia slope. There are highly significant differences in ROC content among different vegetation types (p < 0.05). Regarding depth, ROC content in the 0–5 cm depth is most affected by vegetation type. Unlike TOC content, ROC content is highest in the Magnolia slope at the 10–15 cm and 15–20 cm depths, and ROC content does not show significant changes with depth. Concerning slope position, ROC content at the middle slope position is most affected by vegetation type (p < 0.01), with the grass–shrub slope having the highest ROC content at the upper, middle, and lower slope positions. For all vegetation types, ROC content is lowest at the upper slope position and slightly higher at the lower slope position than at the middle slope position, showing an increasing trend in ROC content from the upper to lower slope positions.
The range of DOC content variation is 0.05–0.32 g/kg, with an average of 0.1526 ± 0.0232 g/kg. The grass–shrub slope has the highest DOC content, higher than the Magnolia slope, Bermudagrass slope, and bare slope by 7.72%, 56.21%, and 72.93%, respectively. A significant increase in DOC levels was observed in Magnolia slopes when contrasted with bare and Bermudagrass slopes, and there are highly significant differences in DOC content among different vegetation types (p < 0.01). Regarding depth, DOC content at different depths is highly significantly correlated with vegetation type (p < 0.01). DOC content is most affected by vegetation type at the 5–10 cm depth. Unlike TOC content, DOC content is highest in the Magnolia slope at the 10–15 cm and 15–20 cm depths. Although DOC content does not show significant changes with depth, DOC content at the 15–20 cm depth is significantly higher than at the other three depths. Concerning slope position, DOC content at different slope positions is highly significantly correlated with vegetation type (p < 0.01). At the lower and middle slope positions, DOC content is most affected by vegetation type (p < 0.01). The grass–shrub slope has the highest DOC content at the lower and middle slope positions, while the Bermudagrass slope has the highest DOC content at the upper slope position. For all vegetation types, DOC content is highest at the lower slope position, followed by the middle and upper slope positions, showing a decreasing trend in DOC content from the lower to upper slope positions.
3.2.3. Distribution Characteristics of Organic Carbon Components Under Different Cement Content in the Substrate
Table 3 and Figure 7 show the variations in TOC, ROC, and DOC contents with soil depth and slope position under different cement dosages in the substrate. Among them, the TOC content in the vegetated slopes ranges from 1.46 to 7.85 g/kg, with an average value of 3.9443 ± 0.4667 g/kg. Among these, the slope with 3 cm 3% cement content has the highest TOC content, 13.27%, 14.62%, and 50.15% higher than the slopes with 3 cm 5%, 5 cm 3%, and 0 cm 0% cement, respectively, indicating a highly significant correlation between different substrate cement contents and TOC content (p < 0.01). Regarding depth, the TOC content at the 15–20 cm depth is most affected by cement content in the substrate. At 5–10 cm, 10–15 cm, and 15–20 cm depths, the TOC content in the slope with 3 cm 3% cement content is higher than in the other three cement content levels. This suggests that in the surface soil, the carbon sequestration capacity of 3 cm 3% cement content is superior to other cement content levels, while at the 0–5 cm depth, the slope with 5 cm 3% cement content has the highest TOC content. There is a significant correlation between depth and substrate TOC content (p < 0.05), with the TOC content at the 0–5 cm depth being significantly higher than at other depths, and it decreases with increasing depth, showing a surface accumulation phenomenon. Concerning slope position, TOC content at the upper slope position is most affected by substrate cement content (p < 0.05), followed by the lower and middle slope segments. At the lower and middle slope positions, the slope with 3 cm 3% cement content has the highest TOC content. Positioned at the upper of the slope, the slope with 3 cm 5% cement content has the highest TOC content. Among all slopes with different cement contents, the upper slope position has the lowest TOC content, with the middle slope position slightly higher than the lower slope position, showing an increasing trend in TOC content from the upper to lower slope positions.
Table 3.
Basic situation of sample plots with different cement contents.
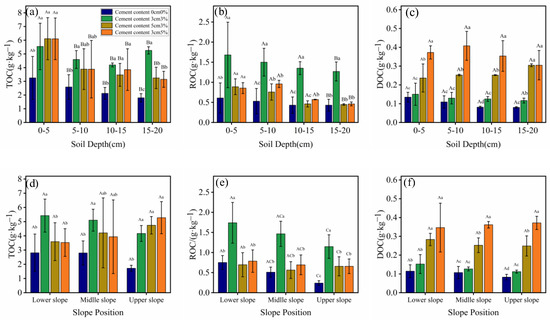
Figure 7.
Different cement content slope ratios of 1:1.75 Bermudagrass slope to TOC, ROC, and DOC with depth and slope position changes. Uppercase letters denote statistically distinct values (p < 0.05) between soil horizons or topographic positions. Lowercase letters signify significant variations (p < 0.05) in cement content levels. (a) Vertical distribution of TOC content of different cement contents. (b) Vertical distribution of ROC content of different cement contents. (c) Vertical distribution of DOC content of different cement contents. (d) Spatial variation of TOC across slope positions with varying cement content levels. (e) Spatial variation of ROC across slope positions with varying cement content levels. (f) Spatial variation of DOC across slope positions with varying cement content levels.
The range of ROC content variation is 0.20 to 2.45 g/kg, with an average of 0.8261 ± 0.1365 g/kg. The slope with 3 cm 3% cement content has the highest ROC content, 50.90%, 55.93%, and 65.50% higher than the slopes with 3 cm 5%, 5 cm 3%, and 0 cm 0% cement, respectively. There are highly significant differences in ROC content among different substrate cement contents (p < 0.01). Regarding depth, ROC content at the 10–15 cm depth is most affected by substrate cement content, followed by the 15–20 cm, 5–10 cm, and 0–5 cm depths. Across all depths, the slope with 3 cm 3% cement content has the highest ROC content. There is a highly significant correlation between soil ROC content and depth (p < 0.01), with ROC content decreasing gradually with increasing depth, and the TOC content at the 0–5 cm soil layer being significantly higher than other depths, showing a surface accumulation phenomenon. Concerning slope position, ROC content at the upper slope position is most affected by substrate cement content (p < 0.01), followed by the lower and middle slope segments. At the lower and middle slope positions, the slope with 3 cm 3% cement content has the highest ROC content, whereas at the upper slope segment, the slope with 3 cm 5% cement content has the highest ROC content. Slope position exhibits a strong statistical association with soil ROC levels (p < 0.01), with ROC content lowest at the upper slope position and slightly higher at the lower slope position than at the middle slope position, showing an increasing trend in ROC content from the upper to lower slope segment.
The range of ROC content variation is 0.07 to 1.10 g/kg, with an average of 0.2300 ± 0.0498 g/kg. The slope with 3 cm 5% cement content has the highest DOC content, 27.31%, 63.74%, and 71.77% higher than the slopes with 5 cm 3%, 3 cm 3%, and 0 cm 0% cement, respectively, showing a highly significant correlation between different substrate cement contents and soil DOC content (p < 0.01). Regarding depth, DOC content at different depths is highly significantly correlated with substrate cement content (p < 0.01). DOC content at the 0–5 cm depth is most affected by substrate cement content. Among all depths, the slope with 3 cm 5% cement content has the highest DOC content, followed by the slopes with 5 cm 3%, 3 cm 3%, and 0 cm 0% cement. Although DOC content does not show significant variation with depth, the DOC concentration peaks in the 5–10 cm stratum, exceeding those at 0–5 cm, 10–15 cm, and 15–20 cm. Concerning slope position, DOC content at different slope positions is highly significantly correlated with substrate cement content (p < 0.01), with DOC content at the middle and upper slope positions being most affected by substrate cement content (p < 0.01). Among all slope positions, the slope with 3 cm 5% cement content has higher DOC content than other cement content levels, followed by the slopes with 5 cm 3%, 3 cm 3%, and 0 cm 0% cement. Among all slopes with different cement contents, the lower slope position has the highest DOC content, followed by the middle and upper slope positions, showing a decreasing trend in DOC content from the lower to upper slope positions. There is a highly significant correlation between soil DOC content and slope position (p < 0.01).
4. Discussion
4.1. Influence of Slope Gradient, Slope Position, Vegetation Type, and Cement Dosage on the Spatial Distribution of Soil pH in Ecological Vegetative Slopes
The soils of all slopes generally exhibit weak alkalinity. This is primarily due to the increase in pH caused by alkaline substances released from the hydration of cement in the slope model blocks and substrates, which are carried into the slope soil by water. When investigating the effects of cement content and substrate thickness on pH, by comparing the pH values of slopes with 0 cm 0%, 3 cm 3%, 5 cm 3%, and 3 cm 5% cement content, it was found that as the cement content increased, the pH value also increased. This is mainly because cement releases alkaline substances during hydration, significantly raising the soil pH. From a soil depth perspective, the pH value increases with depth. This is primarily because a large amount of plant litter (dead branches and leaves) exists in the surface soil, and microorganisms decompose this organic matter aerobically or anaerobically, producing organic acids that lower the pH of the surface soil. Additionally, microbial activity decreases with soil depth, and these two factors together lead to a lower pH in the surface soil [42,43,44].
In terms of vegetation types, the pH values generally follow the order: grass–shrub slope < Bermudagrass slope < Magnolia slope < bare slope. This is likely because Bermudagrass, as a herbaceous plant, has a well-developed root system that can effectively protect the surface soil, enhance erosion resistance, reduce soil and water loss, and increase organic matter accumulation. The organic matter is further decomposed into organic acids, thereby lowering the pH. Magnolia, as a shrub, has abundant litter that provides organic matter, which decomposes into organic acids and reduces soil pH [45]. The grass–shrub slope combines the advantages of both Bermudagrass and Magnolia, with good erosion resistance and abundant organic matter input, which promotes organic matter accumulation and microbial activity, leading to a further reduction in soil pH [46].
Slope gradient significantly affects soil pH. As the slope gradient decreases, pH increases, which differs from Qi et al.’s study [47]. This phenomenon may occur because, under cement-amended conditions, steeper slopes induce greater soil runoff, thereby washing away more cement. The reduced cement content diminishes alkali production from its hydration reaction, ultimately leading to lower pH levels on steeper slopes. There is a trend of increasing pH values with higher slope positions, primarily observed in the lower and middle slope positions. This may be because, under the influence of gravity, nutrients and plant and animal residues are transported with water flow to lower slope areas, resulting in a relative reduction in acidic substances in the upper slope soil, thereby causing the pH to increase.
4.2. The Impact of Slope Gradient, Slope Position, Vegetation Type, and Cement Content on the Spatial Distribution of Soil Organic Carbon Components in Ecological Vegetative Slopes
The impact of slope gradient on soil nutrients is mainly realized indirectly by influencing water flow and infiltration, vegetation, and soil resistance to erosion. The results of this study indicate that as the slope gradient decreases, the contents of TOC, ROC, and DOC significantly increase, consistent with related research findings [25]. The observed phenomenon may be attributed to intensified soil nutrient loss under steeper slopes, driven by enhanced rainfall-induced surface runoff erosion and gravitational leaching [21,48]. Additionally, plants, as a crucial component of ecological restoration slopes, also influence soil resistance to erosion. When the slope gradient increases, vegetation cover decreases, resulting in more severe soil erosion and nutrient loss [49,50]. This study shows that the TOC content in slopes with a gradient ratio of 1:1.5 and 1:1.75 decreases with increasing depth, but in slopes with a gradient ratio of 1:2, the TOC content in the 10–15 cm soil layer is the highest. The variation in DOC in the 1:2 slopes also shows little change with depth, which is consistent with the patterns observed in hydrological studies [21]. On vegetated slopes, a smaller gradient promotes greater rainfall infiltration, less slope surface erosion, and reduced accumulated runoff. The increase in slope ratio led to disparities in organic carbon content between slope positions, indicating that steeper slopes resulted in greater variations in TOC, ROC, and DOC across different slope segments. This phenomenon might be attributed to the intensified rainfall-runoff erosion on slope soils caused by steeper gradients, which amplified the differences in organic carbon loss. This suggests that as the slope gradient increases, the differences in TOC, ROC, and DOC across slope positions become more significant, likely due to increased erosion of slope soil by rainfall runoff, which exacerbates the loss of organic carbon.
Slope position is a key factor influencing the distribution of soil organic carbon components, primarily due to the redistribution of erosion and deposition caused by slope rainfall [21,26]. The TOC, ROC, and DOC contents in bare, Bermudagrass, Magnolia, and Grass-Shrub slopes follow the pattern lower slope > middle slope > upper slope. This is because the upper slope position has less vegetation cover, shallower soil, higher sand content, and more severe soil erosion, leading to nutrient accumulation at the lower slope position due to rainfall runoff and the interception effect of plant branches and leaves. The good vegetation cover and mature soil development in the lower slope position result in higher soil organic carbon content [51,52]. The TOC, ROC, and DOC contents in bare slopes are lower than in vegetated slopes at all positions, indicating that vegetation better conserves soil nutrients and has better erosion resistance, mainly because plant stems, leaves, and litter can intercept part of the rainfall, reduce effective rainfall intensity, and decrease the impact of raindrops on the slope, inhibiting hydraulic erosion caused by runoff [53]. The TOC, ROC, and DOC contents in the grass–shrub slopes are higher than in the other three slopes at all positions, suggesting superior carbon sequestration performance. This may be because grass–shrub slopes combine the high coverage of Bermudagrass with the deep and broad root system of Magnolia, enhancing erosion resistance [34]. Bermudagrass’ high vegetation cover and dense stems and leaves result in more nutrient accumulation at the lower slope position, making the TOC content at the lower and middle of slope positions higher than in Magnolia. Studies have shown that lower slopes have a higher rainfall infiltration rate, which this study also confirms from the perspective of DOC, with Magnolia and grass–shrub slopes having significantly higher DOC content at the upper slope than Bermudagrass and bare slopes [54]. Due to Magnolia’s deeper root system, DOC content is also higher in the lower and middle slope positions than in Bermudagrass and bare slopes [34,55,56].
Bermudagrass and Magnolia are the most widely used herbaceous and shrub plants in central China, influencing organic carbon components in different soil depths primarily by reducing rain impact through stems and leaves and forming root–soil complexes that enhance soil erosion resistance [36,57,58]. The results show that TOC, ROC, and DOC contents in Bermudagrass, Magnolia, and grass–shrub follow the pattern 0–5 cm > 5–10 cm > 10–15 cm > 15–20 cm, closely related to the concentration of plant litter in the surface soil (0–5 cm). The favorable temperature and aeration conditions, along with higher organic matter decomposition and microbial activity, lead to higher TOC, ROC, and DOC contents in the 0–5 cm soil layer than in other layers [59,60,61]. In contrast, bare slopes exhibit the opposite pattern, as rain and runoff erosion on bare slopes lead to nutrient loss without organic carbon input from decomposing litter, resulting in a pattern opposite to that of vegetated slopes. The TOC and DOC contents in the 0–5 cm soil layer of Bermudagrass slopes are higher than in Magnolia but lower than in grass–shrub slopes, due to Bermudagrass’ higher vegetation cover and more developed root systems, providing better erosion resistance [62]. In all soil layers, the TOC content in the grass–shrub is significantly higher than in the other three slopes, indicating better carbon sequestration capability. The DOC content in Magnolia slopes is significantly higher than in Bermudagrass slopes at all depths and higher than in grass–shrub slopes at the 10–15 cm and 15–20 cm depths. This is mainly because Magnolia has longer and thicker roots, allowing water and DOC to penetrate deeper soil layers, resulting in higher DOC content [56].
The addition of cement as a binder in ecological substrates not only enhances slope stability but also integrates soil and vegetation, improving erosion resistance [35,63]. The TOC and ROC contents in slopes with 3 cm 3% cement content are higher than in the other three cement content levels at the 5–10 cm, 10–15 cm, and 15–20 cm depths, indicating that the 3 cm 3% cement content has a stronger ability to conserve soil nutrients. This may be because the addition of 3 cm 3% cement and certain greening additives promotes the growth of Bermudagrass, increasing vegetation cover, root length, and microbial activity, while also enhancing slope erosion resistance [64,65,66]. At the lower and middle slope positions, the organic carbon content is higher in slopes with 3 cm 3% cement content, possibly due to the lower pH at these positions, leading to higher vegetation cover. At the upper slope position, slopes with 3 cm 5% and 5 cm 3% cement content have higher organic carbon content, possibly because the higher cement content enhances erosion resistance at the upper slope position and, with lower pH, promotes vegetation cover [35]. The ROC content is higher in slopes with 3 cm 3% cement content. This study demonstrated that adding 3% cement significantly increased soil organic carbon content and its components in restored slopes, enhancing carbon sequestration capacity and creating the potential for carbon credit trading in ecological restoration projects. DOC content is higher in slopes with 5 cm 3% and 3 cm 5% cement content, consistent with pH patterns, indicating a positive correlation between DOC and pH. This may be because pH influences the content of DOC in soil solution through processes like adsorption, dissolution, and complexation [67].
5. Conclusions
Based on ecological vegetative slope model experiments, a comparative analysis was conducted on the spatial distribution patterns of soil pH, TOC, ROC, and DOC under different slope gradients, vegetation types, and substrate cement dosages. The following conclusions and insights were obtained:
- (1)
- The soil pH of all slopes is weakly alkaline and exhibits a significant correlation with the slope gradient; as the slope gradient decreases, the pH increases. Grass–shrub slopes, which combine the advantages of Magnolia and Bermudagrass, have the lowest pH, followed by Bermudagrass, Magnolia, and bare slopes. The amount of cement added to the soil substrate significantly affects the variation in soil pH on slopes—the higher the cement dosage, the higher the pH value. Additionally, pH increases with soil depth, with the surface soil having the lowest pH. Slope position has a minimal impact on soil pH, primarily in the following order: lower slope < middle slope < upper slope.
- (2)
- In this experiment, the TOC, ROC, and DOC contents of slope soils were at moderate to low levels, with their contents decreasing as soil depth and slope gradient increased. The TOC, ROC, and DOC contents on Bermudagrass slopes significantly increased as the slope gradient decreased. An increase in slope gradient exacerbates the variation in the contents of different organic carbon components across slope positions. These findings provide actionable guidelines for the design and management of eco-restored slopes.
- (3)
- The content of each organic carbon component follows the order of grass–shrub slope > Bermudagrass > Magnolia > bare slope. On vegetated slopes, the contents of TOC, ROC, and DOC decrease with increasing slope position and soil depth, showing a surface accumulation phenomenon. However, on bare slopes, the trend is the opposite, with organic carbon content increasing with depth. Planting Bermudagrass is suitable for the stabilization and protection of surface soil, while Magnolia is more suitable for the protection of deeper soil layers. Grass–shrub slopes, by effectively combining the advantages of Bermudagrass and Magnolia, promote the accumulation of organic carbon components in the soil. Mixed planting of Bermudagrass and Magnolia floribunda significantly promoted SOC accumulation in slope soils.
- (4)
- The addition of cement significantly increases soil pH. Slopes with a 3 cm 3% cement dosage have higher contents of organic carbon components than slopes with 0 cm 0%, 5 cm 3%, and 3 cm 5% cement dosages. However, in the 0–5 cm soil layer, slopes with a 3 cm 3% cement dosage have slightly lower organic carbon content than those with 5 cm 3% and 3 cm 5% cement dosages. DOC content decreases as cement dosage increases. The appropriate amount of cement dosage can increase organic carbon content on slopes, prevent soil erosion, positively influence vegetation growth on slopes, and ensure the long-term stability of the slope. Optimal cement incorporation not only improved slope stability but also elevated SOC content, strengthened carbon sequestration, mitigated soil erosion, and supported vegetation growth, ensuring long-term slope sustainability.
Author Contributions
Methodology, X.Z. (Xinlong Zhou).; investigation, L.Z.; data curation, X.Z. (Xuyuan Zhou). and L.Z.; writing—original draft, S.H.; funding acquisition, H.X. writing—review and editing Z.Z. and X.Z. (Xuyuan Zhou). All authors have read and agreed to the published version of the manuscript.
Funding
Financial support for this research came from the Joint Funds of the National Nature Science Foundation of China (U22A20232), the Youth Science and Technology Research program of Hubei Education Department (Q20231408), and the Open Project Funding of Key Laboratory of Intelligent Health Perception and Ecological Restoration of Rivers and Lakes, Ministry of Education, Hubei University of Technology (HGKFYB10).
Data Availability Statement
The data are available upon request from the corresponding author.
Conflicts of Interest
The authors declare no conflicts of interest.
References
- Shen, Y.; Li, Q.; Pei, X.; Wei, R.; Yang, B.; Lei, N.; Zhang, X.; Yin, D.; Wang, S.; Tao, Q. Ecological Restoration of Engineering Slopes in China—A Review. Sustainability 2023, 15, 5354. [Google Scholar] [CrossRef]
- Bai, J.; Wang, J.; Zhang, Y.; Ji, X.; Wen, N. Decision analysis of slope ecological restoration based on AHP. Sains Malays. 2017, 46, 2075–2081. [Google Scholar] [CrossRef]
- Xu, H.; Li, T.-B.; Chen, J.-N.; Liu, C.-N.; Zhou, X.-h.; Xia, L. Characteristics and applications of ecological soil substrate for rocky slope vegetation in cold and high-altitude areas. Sci. Total Environ. 2017, 609, 446–455. [Google Scholar] [CrossRef] [PubMed]
- Ai, X.; Yang, H.; Ai, S.; Sheng, M.; Tian, X.; Teng, J.; Wang, Y.; Ai, Y. Effects of different restoration methods on soil organic carbon and its fractions of cut slopes in mountainous areas of southwestern China. J. Soils Sediments 2024, 24, 1933–1943. [Google Scholar] [CrossRef]
- Luo, Y.; Xu, W.; Xu, Q.; Chen, B.; Shi, H.; Ye, J. Assessment of the carbon neutral capacity of ecological slopes: A case study of wet-spraying vegetation concrete ecological river revetment. J. Water Clim. Chang. 2024, 15, 2429–2445. [Google Scholar] [CrossRef]
- Wu, X.; Fu, D.; Duan, C.; Huang, G.; Shang, H. Distributions and influencing factors of soil organic carbon fractions under different vegetation restoration conditions in a subtropical mountainous area, SW China. Forests 2022, 13, 629. [Google Scholar] [CrossRef]
- Chang, Z.; Luo, J.; Tang, Q.; Zeng, L.; Zhang, H.; Li, Y.; Yang, G.; Zhang, L. Ecological protection technology of spraying vegetation concrete on carbonaceous rock slope experimental research and application. Adv. Civ. Eng. 2022, 2022, 2557131. [Google Scholar] [CrossRef]
- Hofbauer, M.; Kincl, D.; Vopravil, J.; Kabelka, D.; Vráblík, P. Preferential Erosion of Soil Organic Carbon and Fine-Grained Soil Particles—An Analysis of 82 Rainfall Simulations. Agronomy 2023, 13, 217. [Google Scholar] [CrossRef]
- Xiao, H.; Liu, Z.; Wan, J.; Chen, J.; Shi, Y. Experimental Study of the Soil Water Dissipation Law of Vegetated Slopes under Natural Evaporation Conditions. Appl. Sci. 2024, 14, 1105. [Google Scholar] [CrossRef]
- Sun, Y.; Gu, X.; Xu, X. Experimental study on hydraulic erosion characteristics of ecological slope of tailings reservoir under rainfall. KSCE J. Civ. Eng. 2021, 25, 2426–2436. [Google Scholar] [CrossRef]
- Haynes, R. Labile organic matter fractions as centralcomponents of the quality of agricultural soils: Anoverview. Adv. Agron. 2005, 5, 221–268. [Google Scholar]
- Sakin, E.; Yanardağ, H.İ.; Firat, Z.; Çelik, A.; Beyyavaş, V.; Suat, C. Some Indicators for the Assessment of Soil Health: A Mini Review. MAS J. Appl. Sci. 2024, 9, 297–310. [Google Scholar]
- Bauer, A.; Black, A. Quantification of the effect of soil organic matter content on soil productivity. Soil Sci. Soc. Am. J. 1994, 58, 185–193. [Google Scholar] [CrossRef]
- Lal, R. Soil degradation by erosion. Land Degrad. Dev. 2001, 12, 519–539. [Google Scholar] [CrossRef]
- Yu, P.; Liu, S.; Han, K.; Guan, S.; Zhou, D. Conversion of cropland to forage land and grassland increases soil labile carbon and enzyme activities in northeastern China. Agric. Ecosyst. Environ. 2017, 245, 83–91. [Google Scholar] [CrossRef]
- Li, C.-X.; Zhang, Y.; Qin, X.-J.; Jia, Q.; Zhou, S.; Li, T.; Liu, F. Characteristics of Soil Organic Carbon and Its Influencing Factors of Different Plant Communities in the Yellow River Delta. Huan Jing Ke Xue 2024, 45, 4177–4186. [Google Scholar]
- Kuśmierz, S.; Skowrońska, M.; Tkaczyk, P.; Lipiński, W.; Mielniczuk, J. Soil organic carbon and mineral nitrogen contents in soils as affected by their pH, texture and fertilization. Agronomy 2023, 13, 267. [Google Scholar] [CrossRef]
- Philippot, L.; Chenu, C.; Kappler, A.; Rillig, M.C.; Fierer, N. The interplay between microbial communities and soil properties. Nat. Rev. Microbiol. 2024, 22, 226–239. [Google Scholar] [CrossRef]
- Romanowicz, K.J.; Freedman, Z.B.; Upchurch, R.A.; Argiroff, W.A.; Zak, D.R. Active microorganisms in forest soils differ from the total community yet are shaped by the same environmental factors: The influence of pH and soil moisture. FEMS Microbiol. Ecol. 2016, 92, fiw149. [Google Scholar] [CrossRef]
- Sun, W.; Zhu, H.; Guo, S. Soil organic carbon as a function of land use and topography on the Loess Plateau of China. Ecol. Eng. 2015, 83, 249–257. [Google Scholar] [CrossRef]
- Huang, S.; Chen, J.; Xiao, H.; Tao, G. Test on rules of rainfall infiltration and runoff erosion on vegetated slopes with different gradients. Rock Soil Mech. 2023, 44, 3435–3447. [Google Scholar]
- Hu, W.; Shen, Q.; Zhai, X.; Du, S.; Zhang, X. Impact of environmental factors on the spatiotemporal variability of soil organic matter: A case study in a typical small Mollisol watershed of Northeast China. J. Soils Sediments 2021, 21, 736–747. [Google Scholar] [CrossRef]
- Jakšić, S.; Ninkov, J.; Milić, S.; Vasin, J.; Živanov, M.; Jakšić, D.; Komlen, V. Influence of slope gradient and aspect on soil organic carbon content in the region of Niš, Serbia. Sustainability 2021, 13, 8332. [Google Scholar] [CrossRef]
- Wu, L.; Peng, M.; Qiao, S.; Ma, X.-y. Effects of rainfall intensity and slope gradient on runoff and sediment yield characteristics of bare loess soil. Environ. Sci. Pollut. Res. 2018, 25, 3480–3487. [Google Scholar] [CrossRef]
- Zhou, T.; Lv, Y.; Xie, B.; Xu, L.; Zhou, Y.; Mei, T.; Li, Y.; Yuan, N.; Shi, Y. Topography and soil organic carbon in subtropical forests of China. Forests 2023, 14, 1023. [Google Scholar] [CrossRef]
- Khan, F.; Hayat, Z.; Ahmad, W.; Ramzan, M.; Shah, Z.; Sharif, M.; Mian, I.A.; Hanif, M. Effect of slope position on physico-chemical properties of eroded soil. Soil Environ. 2013, 32, 22–28. [Google Scholar]
- Vannoppen, W.; De Baets, S.; Keeble, J.; Dong, Y.; Poesen, J. How do root and soil characteristics affect the erosion-reducing potential of plant species? Ecol. Eng. 2017, 109, 186–195. [Google Scholar] [CrossRef]
- Zhou, J.; Fu, B.; Gao, G.; Lü, Y.; Liu, Y.; Lü, N.; Wang, S. Effects of precipitation and restoration vegetation on soil erosion in a semi-arid environment in the Loess Plateau, China. Catena 2016, 137, 1–11. [Google Scholar] [CrossRef]
- Yuan, Y.; Shi, X.; Zhao, Z. Land use types and geomorphic settings reflected in soil organic carbon distribution at the scale of watershed. Sustainability 2018, 10, 3490. [Google Scholar] [CrossRef]
- Löbmann, M.T.; Geitner, C.; Wellstein, C.; Zerbe, S. The influence of herbaceous vegetation on slope stability—A review. Earth-Sci. Rev. 2020, 209, 103328. [Google Scholar] [CrossRef]
- Li, Y.; Jiao, J.; Wang, Z.; Cao, B.; Wei, Y.; Hu, S. Effects of revegetation on soil organic carbon storage and erosion-induced carbon loss under extreme rainstorms in the hill and gully region of the Loess Plateau. Int. J. Environ. Res. Public Health 2016, 13, 456. [Google Scholar] [CrossRef] [PubMed]
- Wang, Y.; Gu, H.; Liu, S. Mixed Grass Species Enhances Root Production and Plant–Soil Reinforcement. Land Degrad. Dev. 2025, 36, 736–753. [Google Scholar] [CrossRef]
- Luo, X.; Zhou, X.; Xiao, H.; Ma, Q.; Yang, Y.; Hu, K. Experiment study on temporal stability of soil moisture content in ecological slopes under different vegetation covers. Environ. Res. Commun. 2024, 6, 095004. [Google Scholar] [CrossRef]
- Zhou, X.; Hu, K.; Xiao, H.; Yang, Y.; Chen, J.; Cheng, Y. Effects of vegetation on the spatiotemporal distribution of soil water content in re-vegetated slopes using temporal stability analysis. Catena 2024, 234, 107570. [Google Scholar] [CrossRef]
- Tao, G.; Cheng, Y.; Xiao, H.; Huang, S.; Zhou, X. Experimental Study on the Influence of Substrate Properties on Rainfall Infiltration and Runoff from Ecological Slopes. Appl. Sci. 2023, 13, 5557. [Google Scholar] [CrossRef]
- Wu, G.L.; Liu, Y.F.; Cui, Z.; Liu, Y.; Shi, Z.H.; Yin, R.; Kardol, P. Trade-off between vegetation type, soil erosion control and surface water in global semi-arid regions: A meta-analysis. J. Appl. Ecol. 2020, 57, 875–885. [Google Scholar] [CrossRef]
- Sun, R.; Wang, D.; Cao, H.; Wang, Y.; Lu, Z.; Xia, J. Ecological pervious concrete in revetment and restoration of coastal Wetlands: A review. Constr. Build. Mater. 2021, 303, 124590. [Google Scholar] [CrossRef]
- Gavlak, R.; Horneck, D.; Miller, R.O.; Kotuby-Amacher, J. Soil, Plant and Water Reference Methods for the Western Region; WCC-103 Publication: Fort Collins, CO, USA, 2003; pp. 1–207. [Google Scholar]
- Walinga, I.; Kithome, M.; Novozamsky, I.; Houba, V.; Van der Lee, J. Spectrophotometric determination of organic carbon in soil. Commun. Soil Sci. Plant Anal. 1992, 23, 1935–1944. [Google Scholar] [CrossRef]
- Chan, K.; Bowman, A.; Oates, A. Oxidizible organic carbon fractions and soil quality changes in an oxic paleustalf under different pasture leys. Soil Sci. 2001, 166, 61–67. [Google Scholar] [CrossRef]
- Jones, D.L.; Willett, V.B. Experimental evaluation of methods to quantify dissolved organic nitrogen (DON) and dissolved organic carbon (DOC) in soil. Soil Biol. Biochem. 2006, 38, 991–999. [Google Scholar] [CrossRef]
- Hao, Z.; Li, P.; Le, Q.; He, J.; Ma, J. Litter and Root Removal Modulates Soil Organic Carbon and Labile Carbon Dynamics in Larch Plantation Ecosystems. Forests 2024, 15, 1958. [Google Scholar] [CrossRef]
- Jozedaemi, E.; Golchin, A. Changes in aggregate-associated carbon and microbial respiration affected by aggregate size, soil depth, and altitude in a forest soil. Catena 2024, 234, 107567. [Google Scholar] [CrossRef]
- Ji, L.; Yang, Y.; Yang, L.; Zhang, D. Effect of land uses on soil microbial community structures among different soil depths in northeastern China. Eur. J. Soil Biol. 2020, 99, 103205. [Google Scholar] [CrossRef]
- Gan, T.; Qian, Q.; Liu, Z.; Xu, D. Simulation of Suitable Distribution Areas of Magnolia officinalis in China Based on the MaxEnt Model and Analysis of Key Environmental Variables. Agriculture 2024, 14, 2303. [Google Scholar] [CrossRef]
- Alexander, M. Effects of acidity on microorganisms and microbial processes in soil. In Effects of Acid Precipitation on Terrestrial Ecosystems; Springer: Boston, MA, USA, 1980; pp. 363–374. [Google Scholar]
- Zhang, Q.-P.; Wang, J.; Gu, H.-L.; Zhang, Z.-G.; Wang, Q. Effects of continuous slope gradient on the dominance characteristics of plant functional groups and plant diversity in alpine meadows. Sustainability 2018, 10, 4805. [Google Scholar] [CrossRef]
- Wang, S.; Wang, X.; Ouyang, Z. Effects of land use, climate, topography and soil properties on regional soil organic carbon and total nitrogen in the Upstream Watershed of Miyun Reservoir, North China. J. Environ. Sci. 2012, 24, 387–395. [Google Scholar] [CrossRef]
- Shi, P.; Li, P.; Li, Z.; Sun, J.; Wang, D.; Min, Z. Effects of grass vegetation coverage and position on runoff and sediment yields on the slope of Loess Plateau, China. Agric. Water Manag. 2022, 259, 107231. [Google Scholar] [CrossRef]
- Holland, P.; Steyn, D. Vegetational responses to latitudinal variations in slope angle and aspect. J. Biogeogr. 1975, 2, 179–183. [Google Scholar] [CrossRef]
- Schöning, I.; Totsche, K.U.; Kögel-Knabner, I. Small scale spatial variability of organic carbon stocks in litter and solum of a forested Luvisol. Geoderma 2006, 136, 631–642. [Google Scholar] [CrossRef]
- Cerdà, A. The influence of geomorphological position and vegetation cover on the erosional and hydrological processes on a Mediterranean hillslope. Hydrol. Process. 1998, 12, 661–671. [Google Scholar] [CrossRef]
- Yan, T.; Wang, Z.; Liao, C.; Xu, W.; Wan, L. Effects of the morphological characteristics of plants on rainfall interception and kinetic energy. J. Hydrol. 2021, 592, 125807. [Google Scholar] [CrossRef]
- Dunne, T.; Zhang, W.; Aubry, B.F. Effects of rainfall, vegetation, and microtopography on infiltration and runoff. Water Resour. Res. 1991, 27, 2271–2285. [Google Scholar] [CrossRef]
- Semenov, V.; Pautova, N.; Lebedeva, T.; Khromychkina, D.; Semenova, N.; Lopes de Gerenyu, V. Plant residues decomposition and formation of active organic matter in the soil of the incubation experiments. Eurasian Soil Sci. 2019, 52, 1183–1194. [Google Scholar] [CrossRef]
- Kaiser, K.; Kalbitz, K. Cycling downwards–dissolved organic matter in soils. Soil Biol. Biochem. 2012, 52, 29–32. [Google Scholar] [CrossRef]
- Wei, C.; Huang, K.; Zhang, N.; Qin, X.; Siddique, A. Discussion on ecological protection technology of high and steep slope of expressway. Proc. IOP Conf. Ser. Earth Environ. Sci. 2021, 632, 022022. [Google Scholar] [CrossRef]
- Sui, Z.; Yi, W.; Lu, Y.; Deng, L. Experimental and Numerical Simulation Study on the Shear Strength Characteristics of Magnolia multiflora Root-Soil Composites. Adv. Civ. Eng. 2021, 2021, 6642594. [Google Scholar] [CrossRef]
- Leirós, M.; Trasar-Cepeda, C.; Seoane, S.; Gil-Sotres, F. Dependence of mineralization of soil organic matter on temperature and moisture. Soil Biol. Biochem. 1999, 31, 327–335. [Google Scholar] [CrossRef]
- Crow, S.E.; Lajtha, K.; Filley, T.R.; Swanston, C.W.; Bowden, R.D.; Caldwell, B.A. Sources of plant-derived carbon and stability of organic matter in soil: Implications for global change. Glob. Chang. Biol. 2009, 15, 2003–2019. [Google Scholar] [CrossRef]
- Paul, E.A. The nature and dynamics of soil organic matter: Plant inputs, microbial transformations, and organic matter stabilization. Soil Biol. Biochem. 2016, 98, 109–126. [Google Scholar] [CrossRef]
- Poirier, V.; Roumet, C.; Munson, A.D. The root of the matter: Linking root traits and soil organic matter stabilization processes. Soil Biol. Biochem. 2018, 120, 246–259. [Google Scholar] [CrossRef]
- Faiz, H.; Ng, S.; Rahman, M. A state-of-the-art review on the advancement of sustainable vegetation concrete in slope stability. Constr. Build. Mater. 2022, 326, 126502. [Google Scholar] [CrossRef]
- Gao, G.-J.; Yuan, J.-G.; Han, R.-H.; Xin, G.-R.; Yang, Z.-Y. Characteristics of the optimum combination of synthetic soils by plant and soil properties used for rock slope restoration. Ecol. Eng. 2007, 30, 303–311. [Google Scholar] [CrossRef]
- Chen, F.; Xu, Y.; Wang, C.; Mao, J. Effects of concrete content on seed germination and seedling establishment in vegetation concrete matrix in slope restoration. Ecol. Eng. 2013, 58, 99–104. [Google Scholar] [CrossRef]
- Sullivan, T.S.; Barth, V.P.; Lewis, R.W. Soil Acidity Impacts Beneficial Soil Microorganisms; Washington State University Extension: Pullman, WA, USA, 2017. [Google Scholar]
- Grybos, M.; Davranche, M.; Gruau, G.; Petitjean, P.; Pédrot, M. Increasing pH drives organic matter solubilization from wetland soils under reducing conditions. Geoderma 2009, 154, 13–19. [Google Scholar] [CrossRef]
Disclaimer/Publisher’s Note: The statements, opinions and data contained in all publications are solely those of the individual author(s) and contributor(s) and not of MDPI and/or the editor(s). MDPI and/or the editor(s) disclaim responsibility for any injury to people or property resulting from any ideas, methods, instructions or products referred to in the content. |
© 2025 by the authors. Licensee MDPI, Basel, Switzerland. This article is an open access article distributed under the terms and conditions of the Creative Commons Attribution (CC BY) license (https://creativecommons.org/licenses/by/4.0/).