Article

Exploring the Quality of Commercial Relations Between Producers and Buyers in the Fruit and Vegetable Supply Chain

1
Department for Innovation in Biological, Agro-Food and Forest Systems, University of Tuscia, Via San Camillo de Lellis Snc, 01100 Viterbo, Italy
2
Department of Agriculture, Food and Environment, University of Pisa, Via del Borghetto 80, 56124 Pisa, Italy
3
Department of Economics, Engineering, Society and Business Organization, University of Tuscia, Via del Paradiso 47, 01100 Viterbo, Italy
4
Department of Economics and Law, University of Cassino and Lazio Meridionale, Via S. Angelo Loc. Folcara, 03043 Cassino, Italy
5
European University of Technology, European Union
*
Author to whom correspondence should be addressed.
Sustainability 2025, 17(6), 2641; https://doi.org/10.3390/su17062641
Submission received: 15 January 2025 / Revised: 20 February 2025 / Accepted: 9 March 2025 / Published: 17 March 2025

Abstract

:
The different bargaining power of actors is a long-standing problem in the fruit and vegetable supply chain, where buyers (e.g., retailers, industry, and wholesalers) have more power than agricultural producers and are, therefore, able to engage in commercial practices that may be perceived as unfavorable or even unfair by the weaker part. This study explores how producers perceive the quality of commercial relations. The methods include a focus group discussion with sales managers of producer organizations and a survey of agricultural producers in Italy. We measure their willingness to change buyer and their stated overall satisfaction with the commercial relation by analyzing ninety-eight commercial relations and five dimensions of quality in the relationship. We identify four clusters of relationships characterized by different quality levels. The satisfaction and willingness to change buyers significantly differ across the clusters; economically favorable commercial relations are associated with a low willingness to change buyers, even when the producer is not satisfied with the overall quality of the relationship. The highest levels of satisfaction and the lower willingness to change buyers are reached for commercial relations that are not only economically favorable but also include positive relational aspects such as trust and mutual commitment.

1. Introduction

In the fruit and vegetable supply chain, large buyers, intended as retailers, processing industries, and wholesale markets, have an increasing share of bargaining power [1,2], which might generate issues related to the governance and coordination of the chain [3]. In this context, establishing high-quality commercial relations becomes crucial for producers to counterbalance the growing power of buyers [4,5,6]. The quality of commercial relations between producers and buyers has been extensively analyzed from a theoretical perspective, but only a few empirical studies have explored how the involved parties perceive these relationships.
In this paper, we explore how fruit and vegetable producers perceive the commercial relations they have with buyers, considering their position as the “weaker party” in these transactions. The objective of this paper is (I) to understand the economic and relational factors shaping the commercial relation between producers and buyers in the Italian fruit and vegetable supply chain and (II) to examine how these factors are related to the quality of commercial relations, as perceived by agricultural producers.

2. Literature Background on Quality of Commercial Relations

The fruit and vegetable value chain is characterized by farmers selling fresh, perishable products to buyers who centralize demand, and it shows a crucial dependence on the distribution sector [7], which owns a superior position in negotiations, allowing for control of contractual terms and conditions, such as trading practices, standards and specifications of the product. To minimize economic costs and risks arising from commercial transactions, retailers often shift the related costs upstream in the supply chain actors, placing the burden on weaker players, such as individual farmers [8,9,10,11]. Large buyers exert significant pressure on suppliers through modifications and stricter requirements regarding quality and the underpricing of products because of their oligopolistic control [8,12], as product pricing is a key factor for retailers [13].
The different bargaining power of the actors might generate inefficiencies in the fruit and vegetable supply chain, such as inefficient allocation of economic risk and distortion of incentives [14,15]. In this context, unfair trading practices (UTPs) are experienced by a majority of producers (especially farmers) [16]. UTPs are usually described as practices that deviate from good commercial conduct, imposed by a trading partner over a weaker one, and that are in opposition to fair trade and trustworthiness [17]. UTPs include pressure tactics, where suppliers are forced to accept unfavorable terms of contract, unilateral changes by retailers and food processors, payment delays or price undercutting, as well as lack of information sharing and punitive commercial practices over suppliers that refuse to comply with unfair contract conditions [16]. In 2019, the European Union adopted a specific directive to limit UTPs, Directive (EU) 2019/633, which has also been implemented in Italy (D.L. 198/2021). Nevertheless, several UTPs still occur, and their impact is still unclear [18].
To counterbalance the growing power of buyers, farmers are forming collaborations [19], and the European legal framework [16,17,18,19] is supporting the creation of producer organizations (POs). POs enhance their position and bargaining power of farmers by concentrating the supply of agricultural commodities, negotiating contracts collectively, supporting farmers’ production, and reducing the number of brokers in the supply chain [14]. POs take care of negotiating prices and agreeing on contracts with retailers, quality and production standards, logistics, delivery schedules, payment terms, promotions, risk-sharing, and other details [17,20,21,22]. Joining POs seems to provide benefits to farmers in terms of achieving higher profitability and added value for their products [23] with respect to negotiating with buyers alone. Additionally, cooperation among farmers within POs strengthens horizontal integration to increase bargaining power [24]. Collective initiatives, such as POs, may offer perceived benefits in terms of price and quality setting, but there is no theoretical expectation that exerting countervailing power will necessarily reduce UTPs, as all contract terms are negotiated at once [18].
The quality of commercial relations is defined as the degree to which parties are engaged in active, long-term relations characterized by trust, social satisfaction, non-coercive power, and reputation [4,5,6]. There is evidence that the quality of a commercial relationship exerts an influence on the overall performance and sustainability of the supply chain [4,25,26]. However, the way this influence applies and its extent have seldom been investigated in the agri-food supply chain [6,27], where establishing close relations between producers and buyers is more complex [28].
In any interaction between actors in the supply chain, there is a diversity of situations ranging from a transaction-based to a relationship-based approach, corresponding to different levels of quality of the commercial relation [29]. The transactional approach is characterized by discrete, short-term exchanges, where the most important elements are availability, timeliness, and price. Here, neither minimal personal relations nor future interactions beyond the immediate transaction are expected, and there is no relation with the commodities offered. On the other hand, the key features of a relational approach are long-term relations built on trust, commitment, and mutual benefit; both parties cooperate, share information, and work together to reach common goals over time. The relational approach generates long-term value and competitive advantage [5,6,29], building satisfaction, trust, and commitment among the actors involved. The intention to cooperate—such as improved access to information and the ability to evaluate performance—positively influences satisfaction, continuity, and the capacity to adapt the relation to changing external circumstances [5,6,27]. Trust and commitment are highlighted as fundamental elements in successful business relations [28]. Trust refers to the belief in the integrity and reliability of the commercial partner, while commitment represents the desire to maintain this valued relationship [30,31]. These factors are critical for the quality of the relationship between suppliers and buyers [4,31,32,33]. For example, Gajdić et al., 2021 [6] found that trust has an impact on the overall performance of perception of quality of commercial relations, according to their duration. The quality of commercial relations may also be linked to the fairness of the practices existing between the parties, as low-quality commercial relations are more likely to result in the application of UTPs by the stronger actor of the supply chain over the weaker one [16] and, in turn, producers’ perception of unfair practices is likely to reduce their satisfaction for the commercial relation.

3. Materials and Methods

A mixed method is used here to investigate the factors influencing commercial relations in the Italian fruit and vegetable supply chain and their quality from the producer’s perspective:
  • A qualitative analysis using focus groups, which aims to identify the factors that shape the producer-buyer commercial relation from the point of view of the POs;
  • A quantitative analysis, where a survey is developed and administered to producers, with the aim to disclose the influence of these factors on the quality of the commercial relations they establish with buyers.

3.1. Focus Group

The first part of the methodology is included in a wider study on the analysis of UTP (Directive EU 2019/633) in the fruit and vegetables supply chain in Italy The general objective of the project PRIN AGREF (project code 2022FARZPJ, funded by the Italian Ministry of University and Research) is to investigate commercial practices perceived as unfair by suppliers in the fruit and vegetable supply chain in Italy and attempting an estimation of the impact of such practices on farmers and POs. A focus group is organized in February 2024, involving 24 representatives—in most cases, the sales managers—of Italian POs operating in the fruit and vegetable sector, divided into two parallel sessions: an online session in which 22 POs joined and an in-presence session, in which 2 POs joined. Such POs are located in different areas of Italy, and they are of different sizes in terms of turnover and number of employees, as described in Table 1.
The two focus groups are conducted following the same guidelines to contribute to the objectivity and trustworthiness of this study [34]. The structure of each focus group includes different topics of discussion, with a focus on negotiation, pricing, commercial practices perceived as unfair, and the overall quality of commercial relations that POs establish with buyers. The duration of the focus group discussion is approximately 120 min. The discussion is facilitated by a researcher who invites participants to use sticky notes to point out specific issues. Both focus group sessions are recorded and transcribed. We apply a structured content analysis for qualitative data following Kuckartz [35], using deductive and inductive coding in Excel. The deductive coding is performed by identifying four categories that represent the main issues in a commercial relationship, based on the theories and the literature: (i) Relation in the value chain, (ii) Contracts and negotiations, (iii) Flexibility and scheduling, and (iv) External factors. Then, during inductive coding, each sentence is allocated to one of the codes, considering the affinity of the sentence’s topic with the codes. Each sentence is allocated to only one code.
Among all the sentences transcribed from the focus group, this study limits the analysis to those referring to factors that affect the quality of the commercial relation from the perception of the POs.

3.2. Survey

As a second step of the methodology, a survey is administered to farmers and POs, aimed at assessing the perceived quality of the commercial relations they have with buyers and rating a set of factors that may influence such relations. The survey is constructed following the framework developed by Schulze [28], integrated with the results emerging from the focus groups.
The survey is structured in three parts: (I) an introduction section with general questions about the respondent; (II) a second section where respondents are asked to rate a set of factors related to commitment, price satisfaction, flexibility, trust, and cooperation; (III) a final section where respondents rate the overall satisfaction for the commercial relation.
Respondents are asked to rate all the items with reference to the commercial relation they have with the first and the second most important buyers; therefore, every response generates two sets of answers. Section II includes the 14 items (F1–F14) that belong to the following dimensions and are listed in Table 2 and Table 3:
-
D1 “Long-term commitment”, which refers to the willingness of actors to exert effort on behalf of the relations, where they perceive to benefit mutually [5,31,36], and includes F1, F2, F3;
-
D2 “Price satisfaction”, intended to assess the extent to which the economic outcome is important for the evaluation of the relations [28]; this dimension includes an evaluation of prices (in comparison with other buyers) [28] and margins, with F4 and F5;
-
D3 “Adaptation on quality standards”, which assesses the flexibility of buyers and suppliers to mutually adapt to each other’s needs and capabilities regarding quality standards [5,37], expressed by F6, F7, F8;
-
D4 “Relational quality and trust”, summarizing the degree of mutual trust, good personal relations, and transparency of communication between supplier and buyer [6], expressed by F10, F11, F12;
-
D5 “Cooperation in case of issues”, referring to situations where actors work conjointly to achieve mutual goals [5,38], including F13 and F14.
Section III includes two summary variables to measure the overall perceived quality of the commercial relations:
-
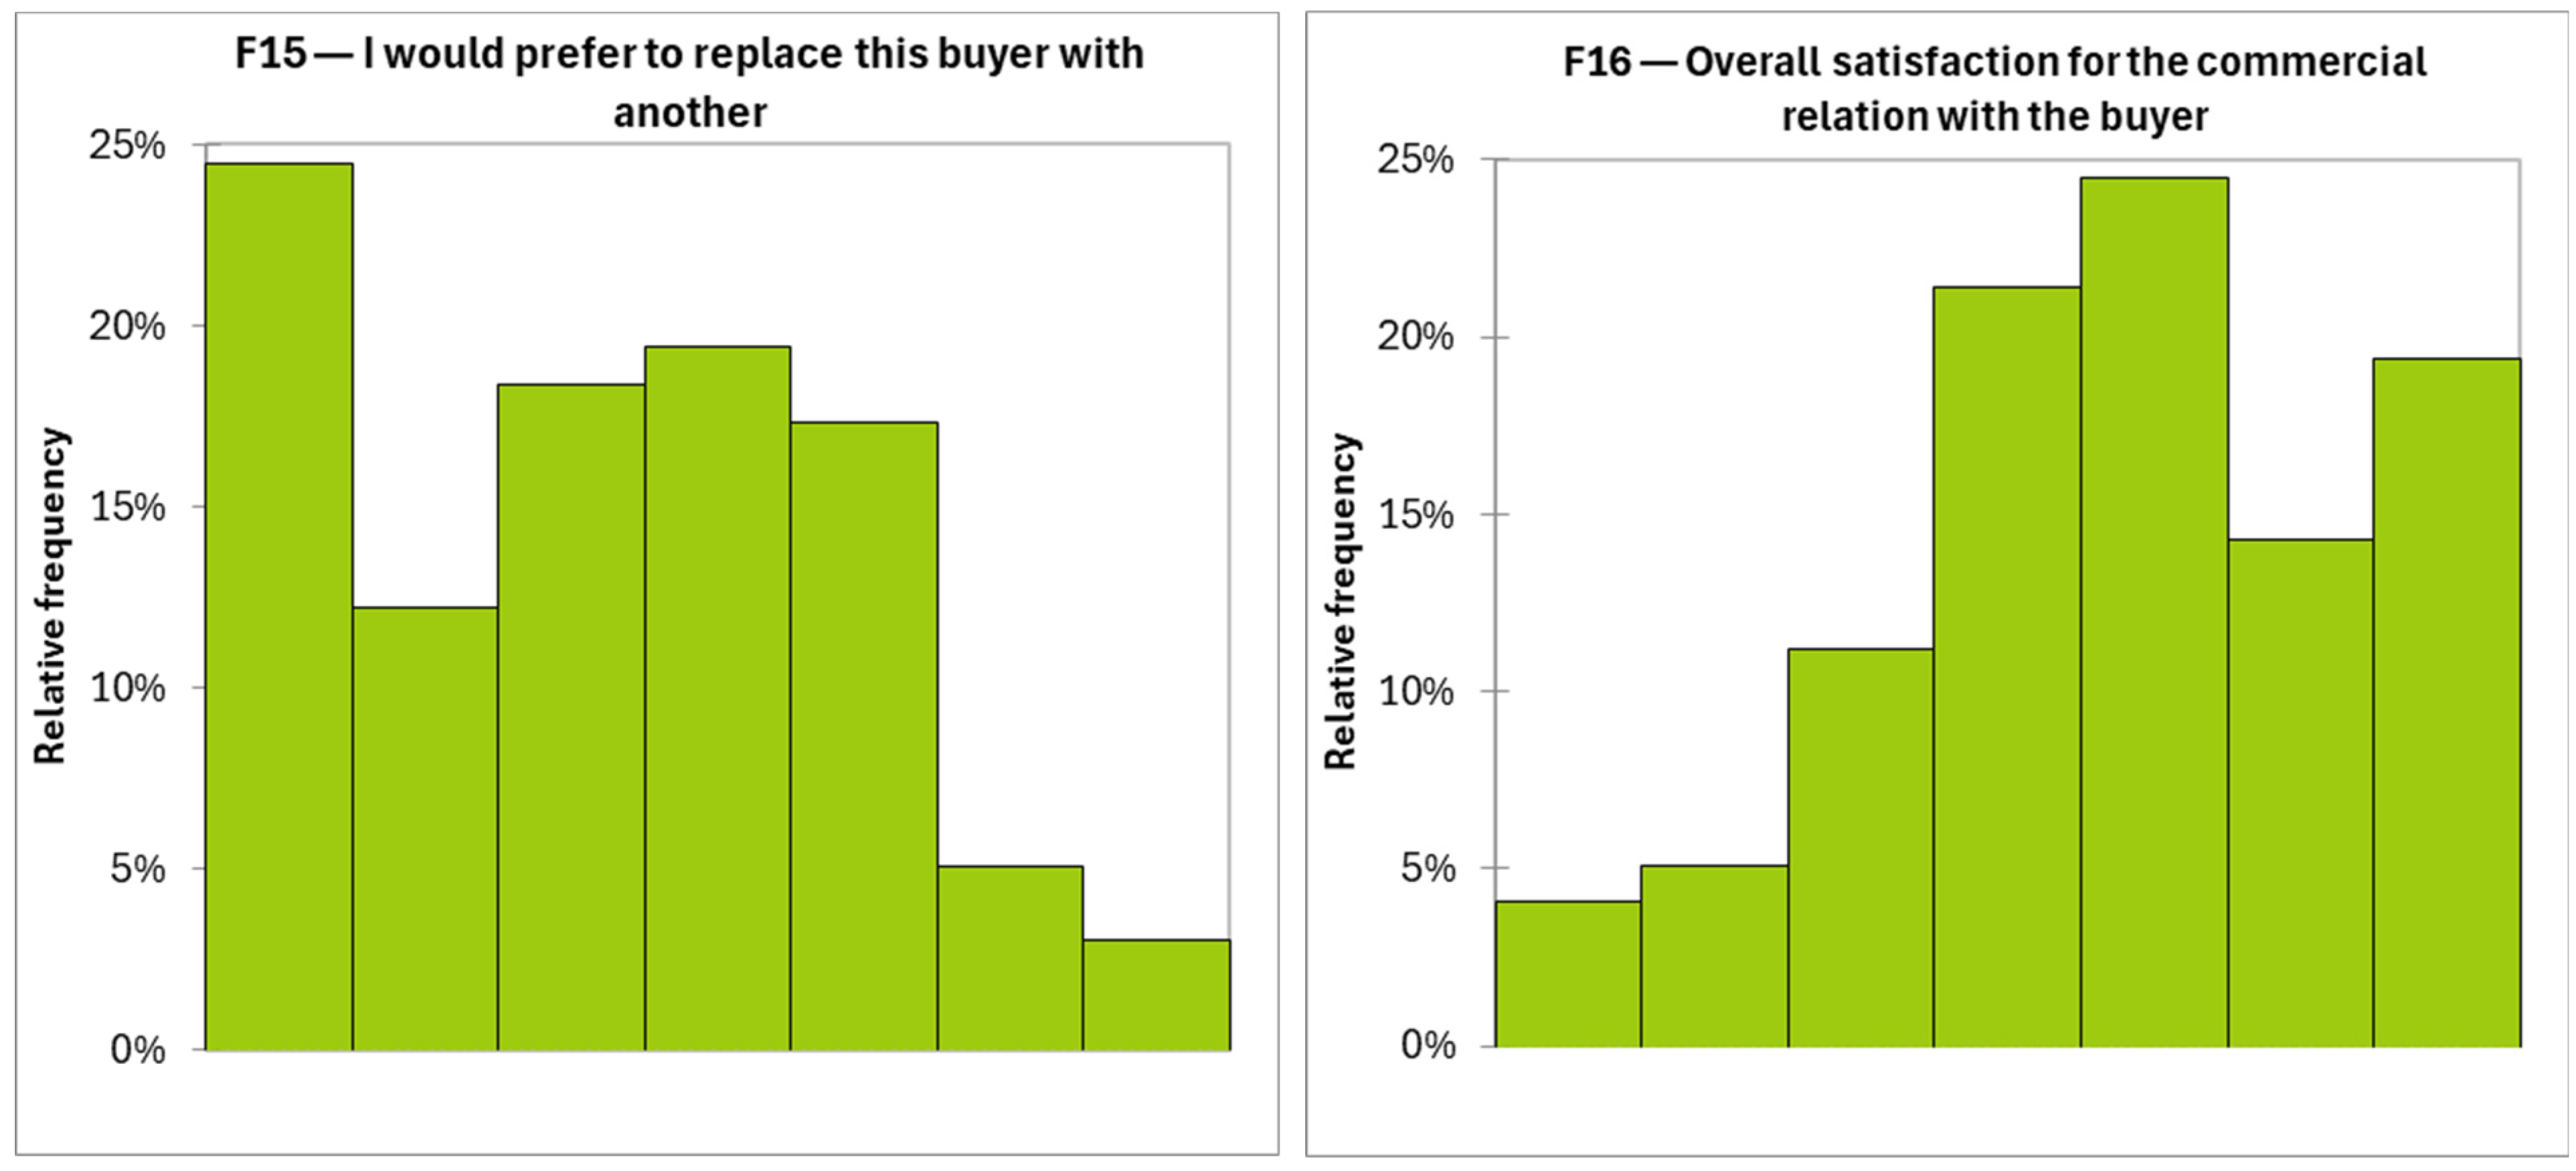
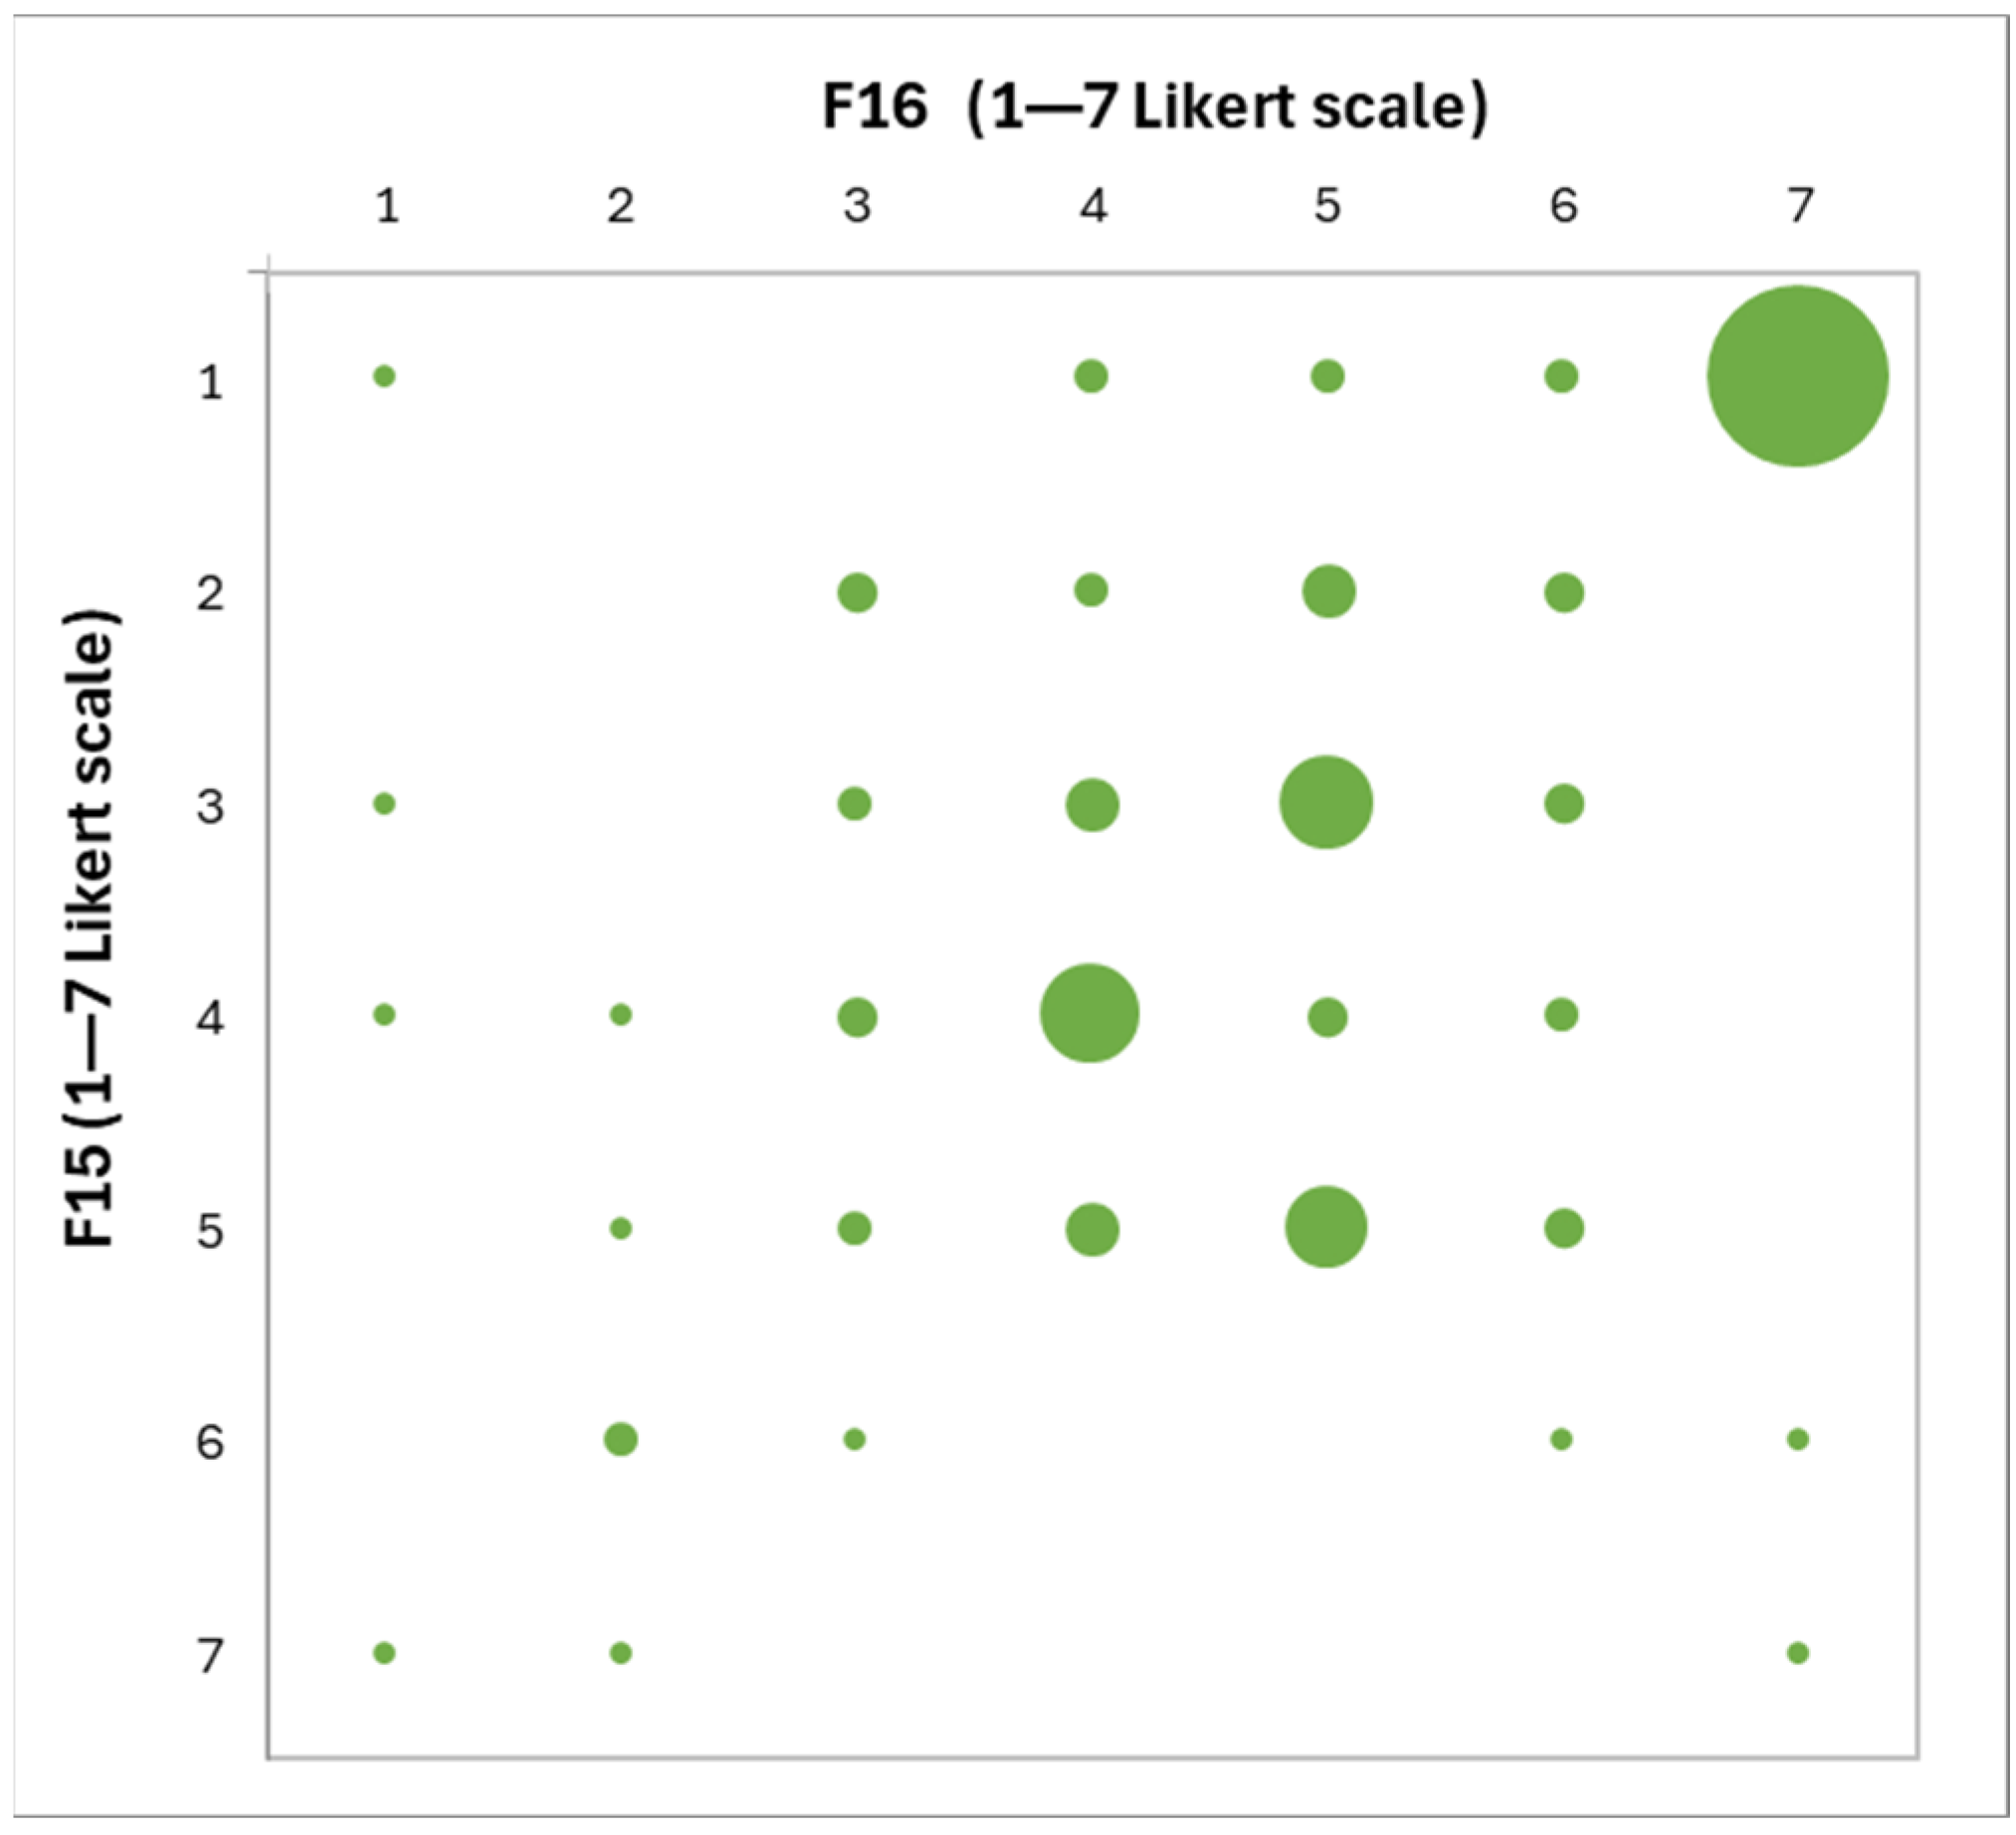
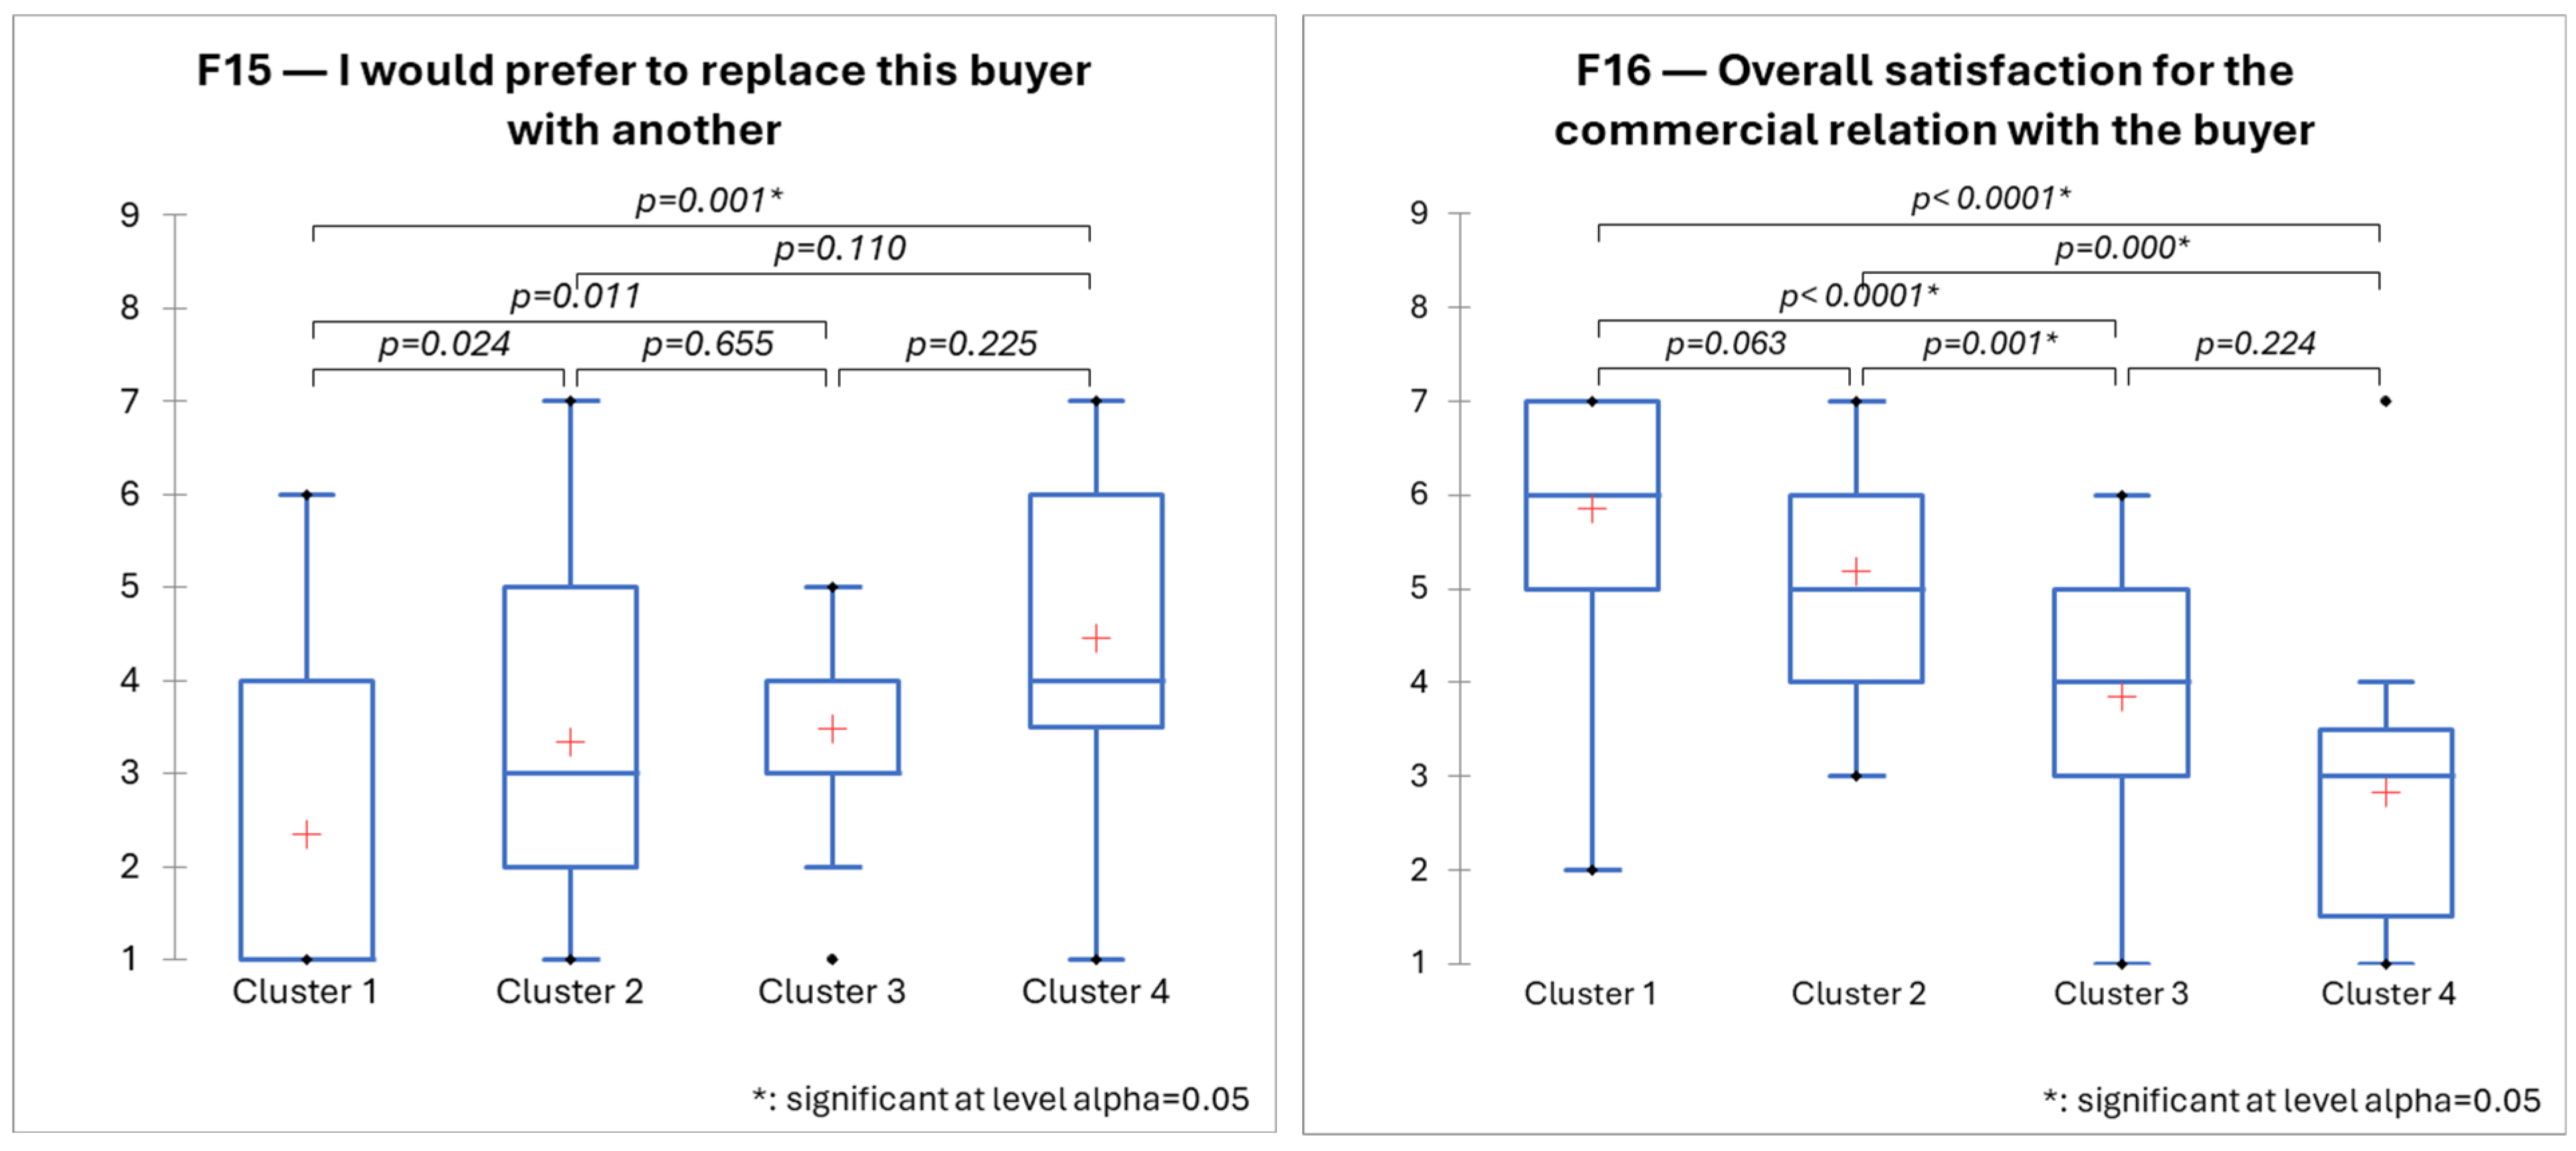
F15: “In the next 2–3 years, I would prefer to replace this buyer with another
-
F16: “Overall, I am satisfied with the commercial relations with this buyer
A 1–7 Likert scale is used for all items to rate respondents’ level of agreement with the statements (1—not at all; 7—at all).
The survey is developed in Qualtrics, and the time needed to complete it is approximately 10 min. All respondents are asked to approve an informed consent form before starting the survey; no personal data or data that could lead to identifying the farms and POs answering the survey is collected. Table 2 and Table 3 report the list of items and the related descriptive statistics.
The survey is administered between April and October 2024 to POs, individual farmers, and agricultural technicians contacted through agricultural networks, agricultural associations, extension services, and professionals operating in the fruit and vegetable sector. The total number of responses is 99. After data cleaning, 42 responses are considered invalid as the respondent did not complete the questionnaire for even one of the two buyers requested. A total of 57 responses are retained, among which 16 provided the assessment of only one buyer, and 41 referred to two different buyers. The database is, therefore, composed of 98 observations, each one referring to the assessment of one buyer by one respondent. These data are analyzed with the XLStat 2024.3 statistical software, which operates in a Microsoft Excel environment.
Descriptive statistics are performed for these variables to summarize the intention to change buyers and the level of satisfaction. Additionally, the correlation matrix is used to evaluate the quality of commercial relations between items F15 and F16 and the variables related to the type of buyer, % of turnover, and long-term relations (expressed in years).
The individual variables for which higher rates in the Likert scale correspond to a lower quality of the commercial relation have been rotated, and then a total rating is obtained for each dimension by summing up the ratings of the individual items. The resulting 5 variables (D1, D2, D3, D4, and D5) express the rating of each dimension; they are standardized and used to feed a k-means cluster analysis to classify different types of commercial relations. Four clusters are obtained.
A Kruskal–Wallis nonparametric test is used to examine whether the overall perceived quality of commercial relations differs across the clusters of commercial relations. The choice of this test is due to the non-normality of the dependent variables F15 and F16, tested with the Shapiro–Wilk test and resulting in α < 0.05. In the Kruskal–Wallis test, F15 and F16 are used as dependent variables, with the aim of analyzing any significant difference in the perceived quality of commercial relations among the clusters.
As a last step, multiple correspondence analysis is developed to detect correspondence between high-low levels of perceived quality of the commercial relation and belonging to a specific cluster, also considering the importance of commercial relations in terms of turnover.

4. Results

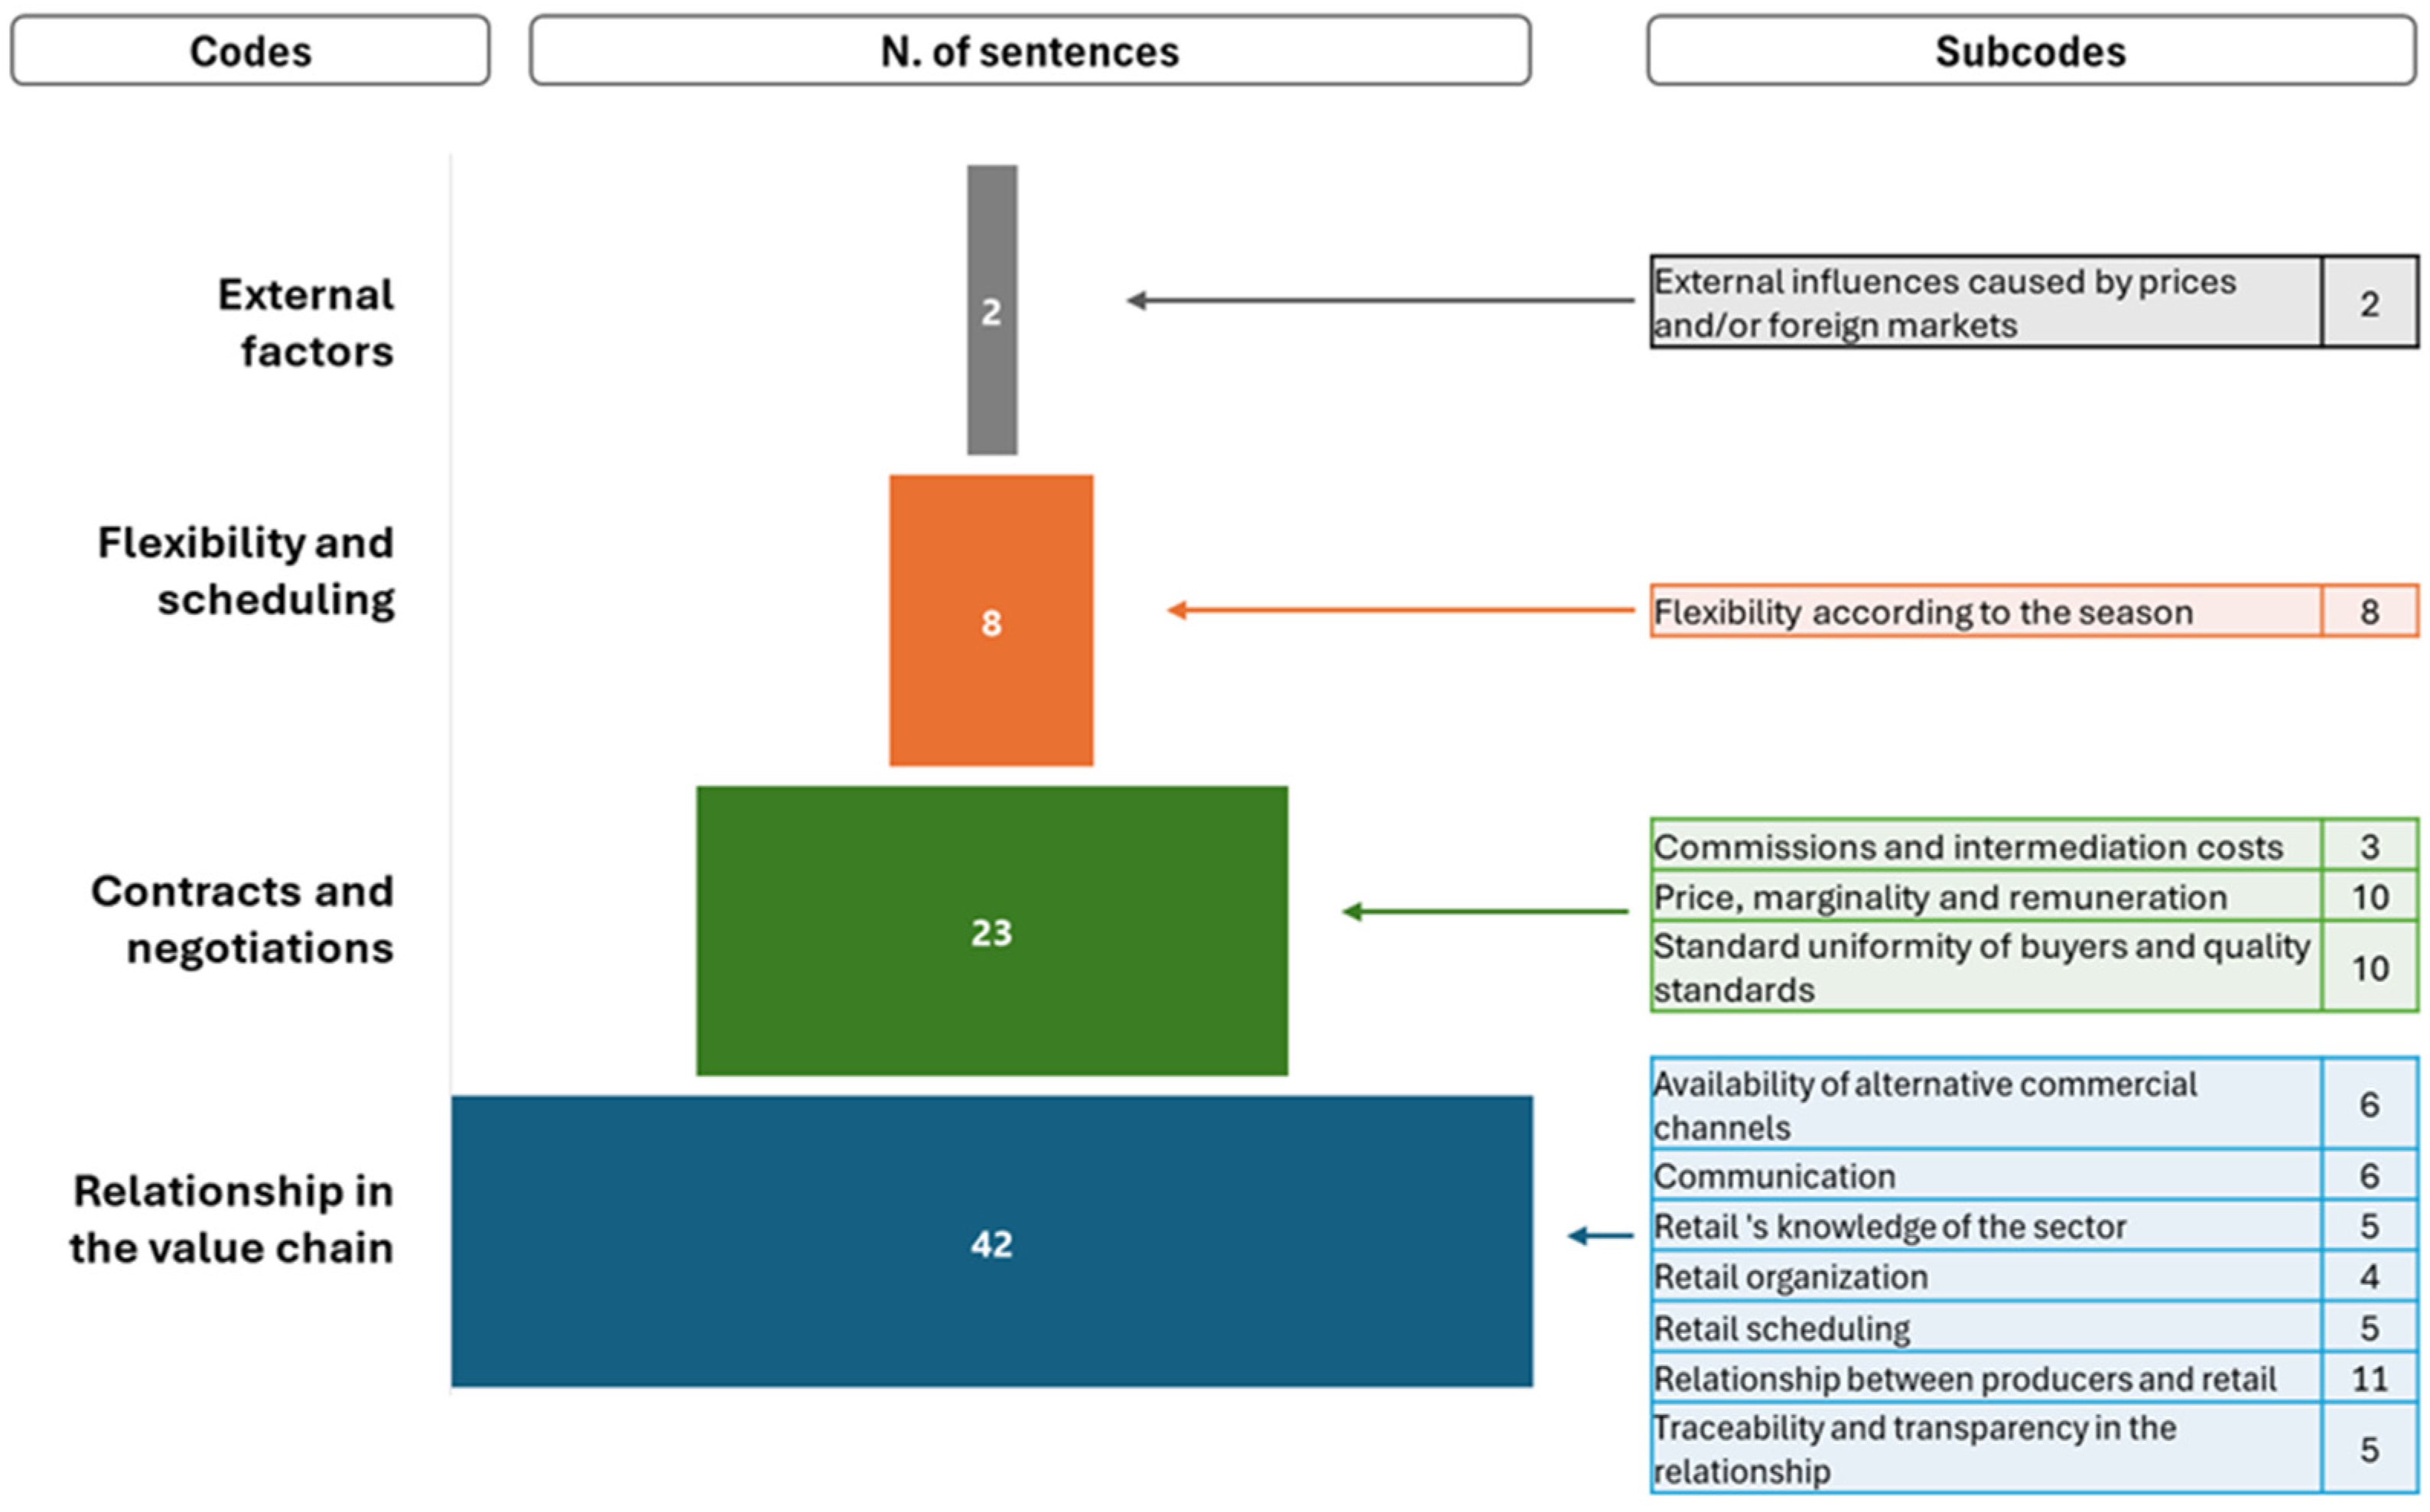
4.1. Results of the Focus Group

Figure 1 shows the factors that may influence the perceived quality of the commercial relations between producers and buyers as they emerged from the focus groups. We coded a total of 75 sentences, which are grouped into four categories: external factors, flexibility and scheduling, contracts and negotiations, and relations in the value chain.
A total of 70.67% of the sentences are related to retailers, 6.67% concern general marketing and food processors, and 5.33% relate to wholesalers, while 10.67% are not directly linked to any specific buyer.
From the focus group, it emerged that POs perceive the practices related to negotiations and bargaining power as factors that can negatively affect the quality of the commercial relations they have with buyers. One of the main features is that “retailers disconnect from the reality of production”, which means that they do not take into consideration the seasons and the fluctuations that are typical of agricultural production, and therefore, they do not demonstrate the necessary flexibility. Instead, they follow a plan of prices, promotions, and quantity of orders that sometimes do not fit with the seasonal trend of fruits and vegetables. In this sense, a sentence that is repeated many times is: “sometimes retailers do not give us [POs] the possibility to explain reasons…”. In addition, with reference to contracts and negotiations, we find that “retailers are more punctilious when the market goes down, they become overly attentive on quality standards…”; for example, at times of the season that is potentially positive for POs (in terms of availability of product, higher prices etc.), the retailers tend to react with tighter control of quality standards, promotions, prices and timing of the deliveries, thus increasing the frequency of rejection of products, controversies, with additional costs for producers.
Building on these results, we investigate the overall quality of the commercial relationship between producers and buyers and the factors that may exert an influence on it by analyzing the results of the survey.

4.2. Results of the Survey

The survey responses are mostly from individual farmers, accounting for 80.85%, while 9.57% come from POs. Among farmers, 57.45% are members of a PO or cooperative. These data are evenly distributed across different regions of Italy, with 26.60% of responses from the North, 41.49% from the Centre, and 31.91% from the South. The observations refer to various types of buyers, primarily retailers and wholesalers, which account for 24.47% and 27.66% of the responses, respectively. Most responses relate to long-term commercial relations, with 50% having been established for more than 10 years.
In terms of the quality of the overall commercial relation, the average satisfaction score is 4.76 on a 1–7 Likert scale, while the average willingness to replace the buyer with another channel is 3.19 (Table 2). Figure 2 and Figure 3 illustrate the distribution of responses for these two variables, which are both non-symmetric. While F15 shows that the frequencies of the answers are concentrated on the left side, F16 shows an opposite distribution, with answers showing a higher frequency of satisfaction in commercial relations.
The distributions of 14 items related to factors that may influence the perceived quality of the commercial relation (F1 to F14) are almost all unimodal and approximatively symmetric, with the central values of the scale having more observations. Median values are 4 or 5 (on a 1–7 Likert scale) for all items, except for F8 (rejection of products; median = 3) and F12 (concerning the perceived reliability of the supplier; median = 6).
Figure 4 shows the correlation matrix between the dimensions of quality of commercial relations, broken down by type of buyer. There is a recurrent correlation between D1—Long-term commitment and D2—Price satisfaction (top-left side of the matrixes) for all buyers except wholesale markets, suggesting that this channel may be activated on a short-term basis. Another common pattern (bottom-right side of the matrixes) is the correlation between D4—Relation quality and trust and D5—Cooperation in case of issues, which is observed for all buyers except retailers. We also observe that D3—Adaptation on quality standards is not correlated with other dimensions when the buyer is a food processor; this is probably linked to the fact that this channel typically accepts products that are rejected by other channels with stricter standards. In addition, for wholesale markets, a negative correlation (blue color) is observed between D3 and D1—Long-term commitment, showing that the shorter the timeframe of the commercial relation, the more flexible the standards for the products.

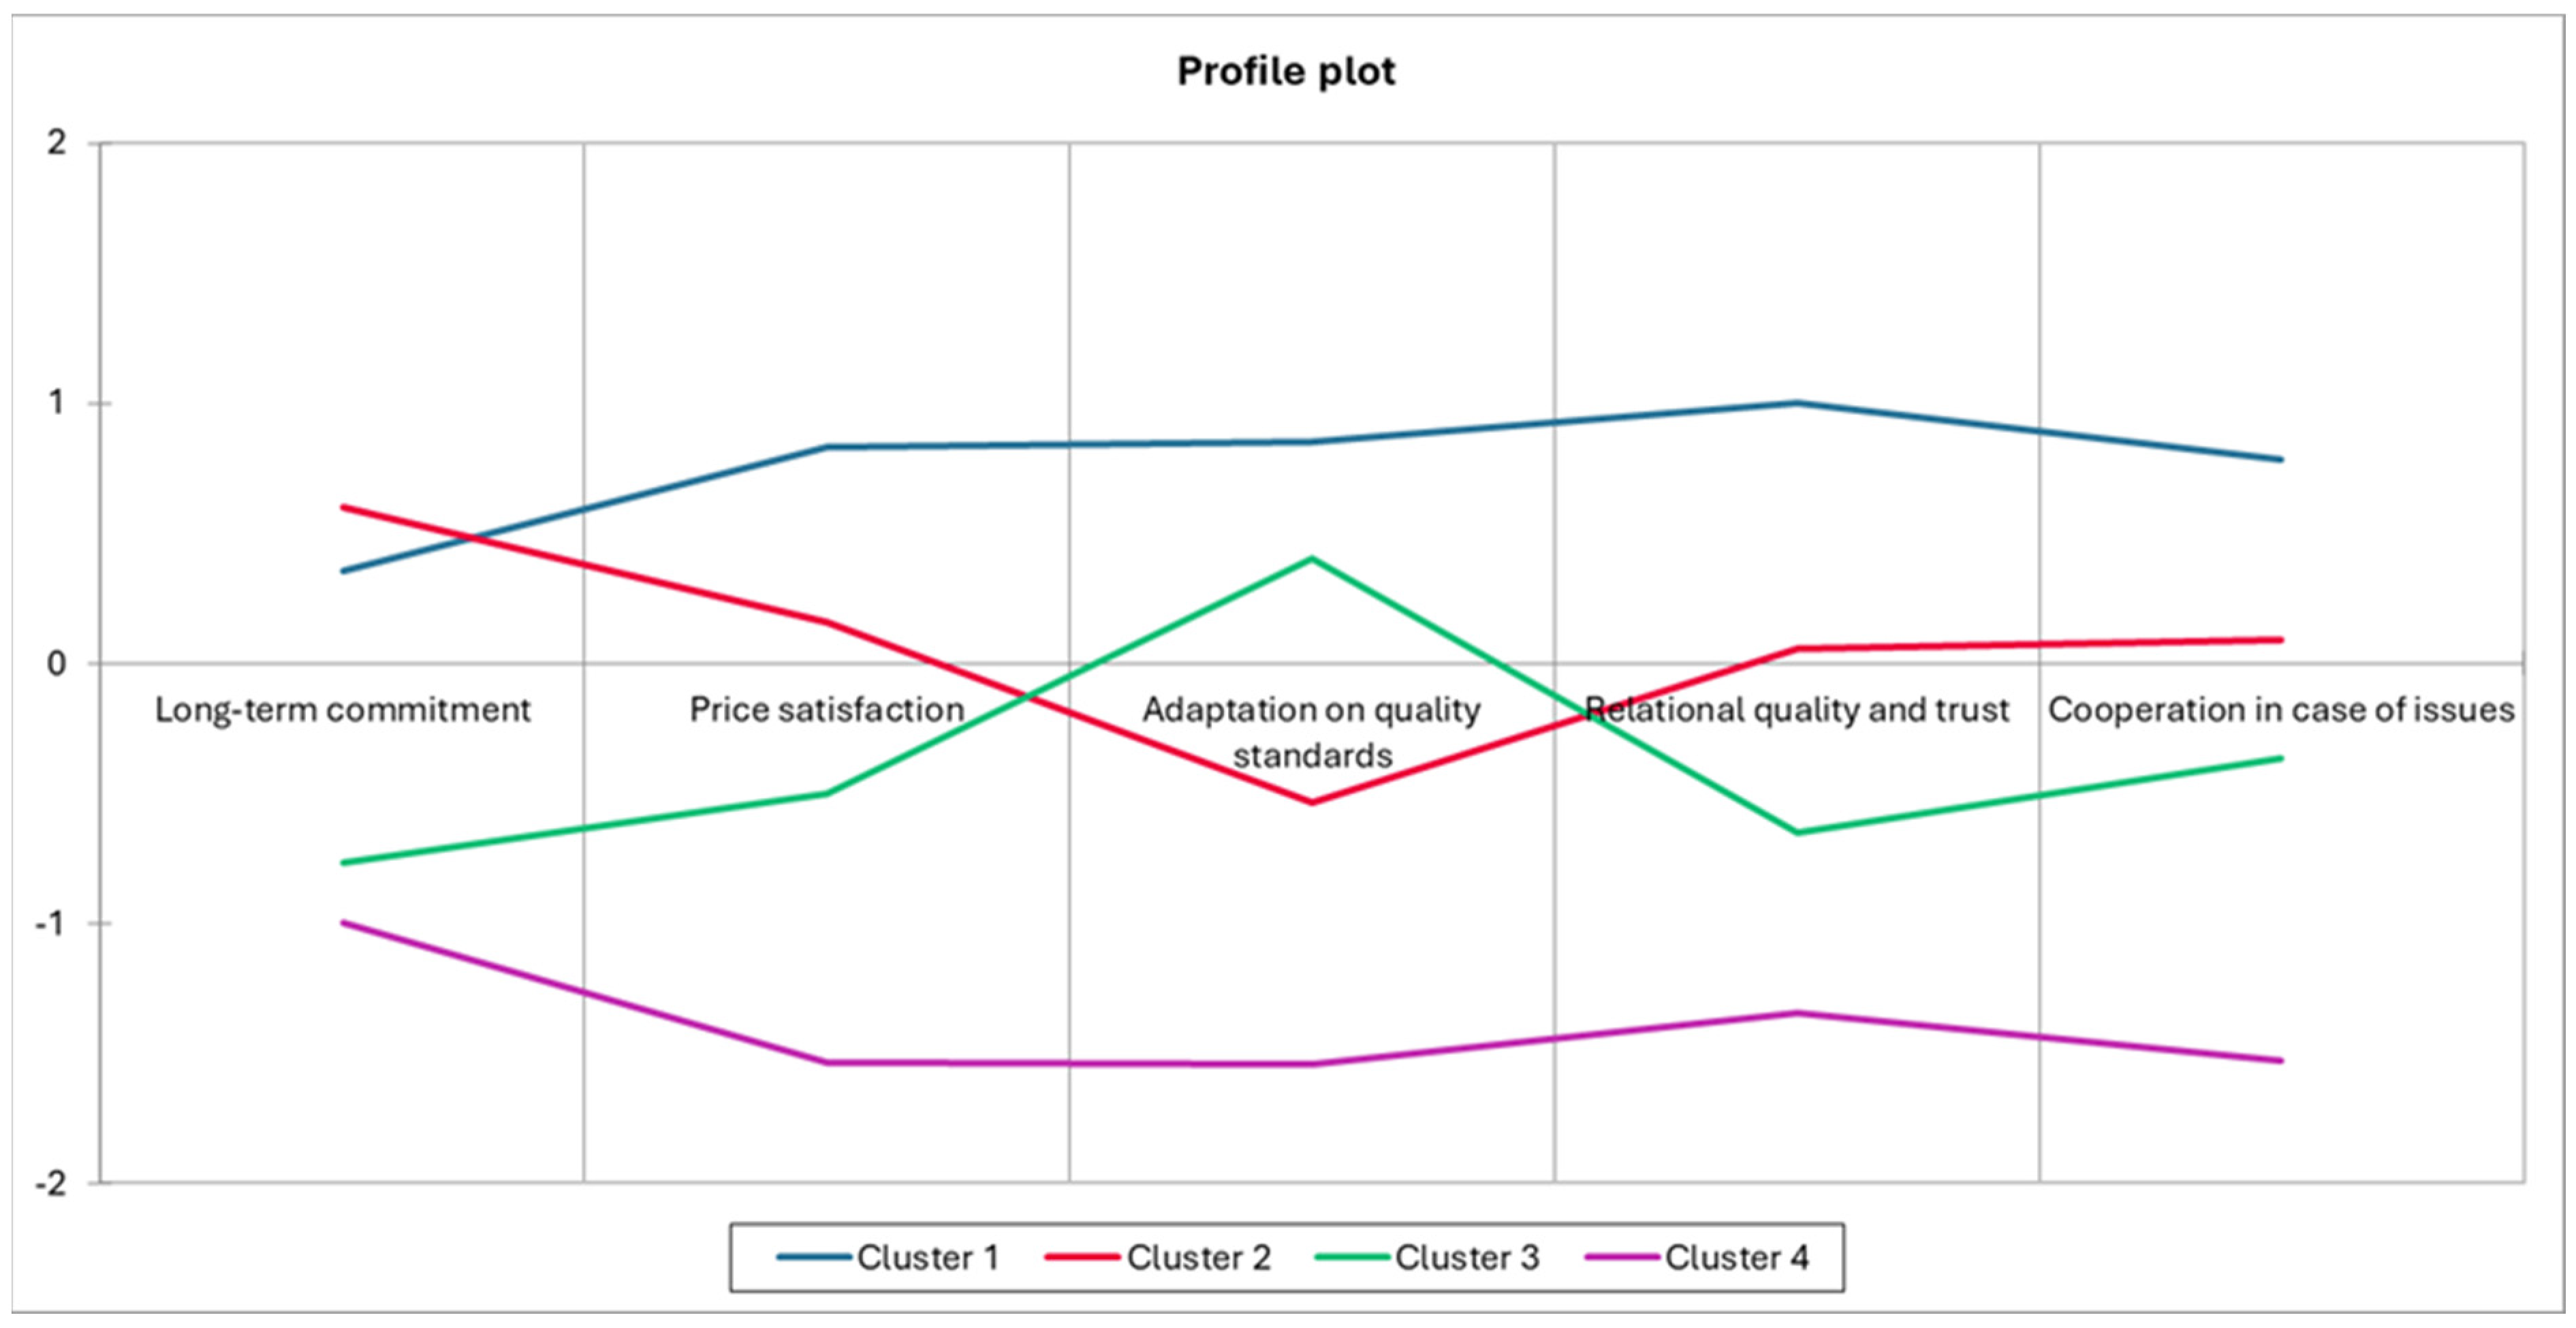
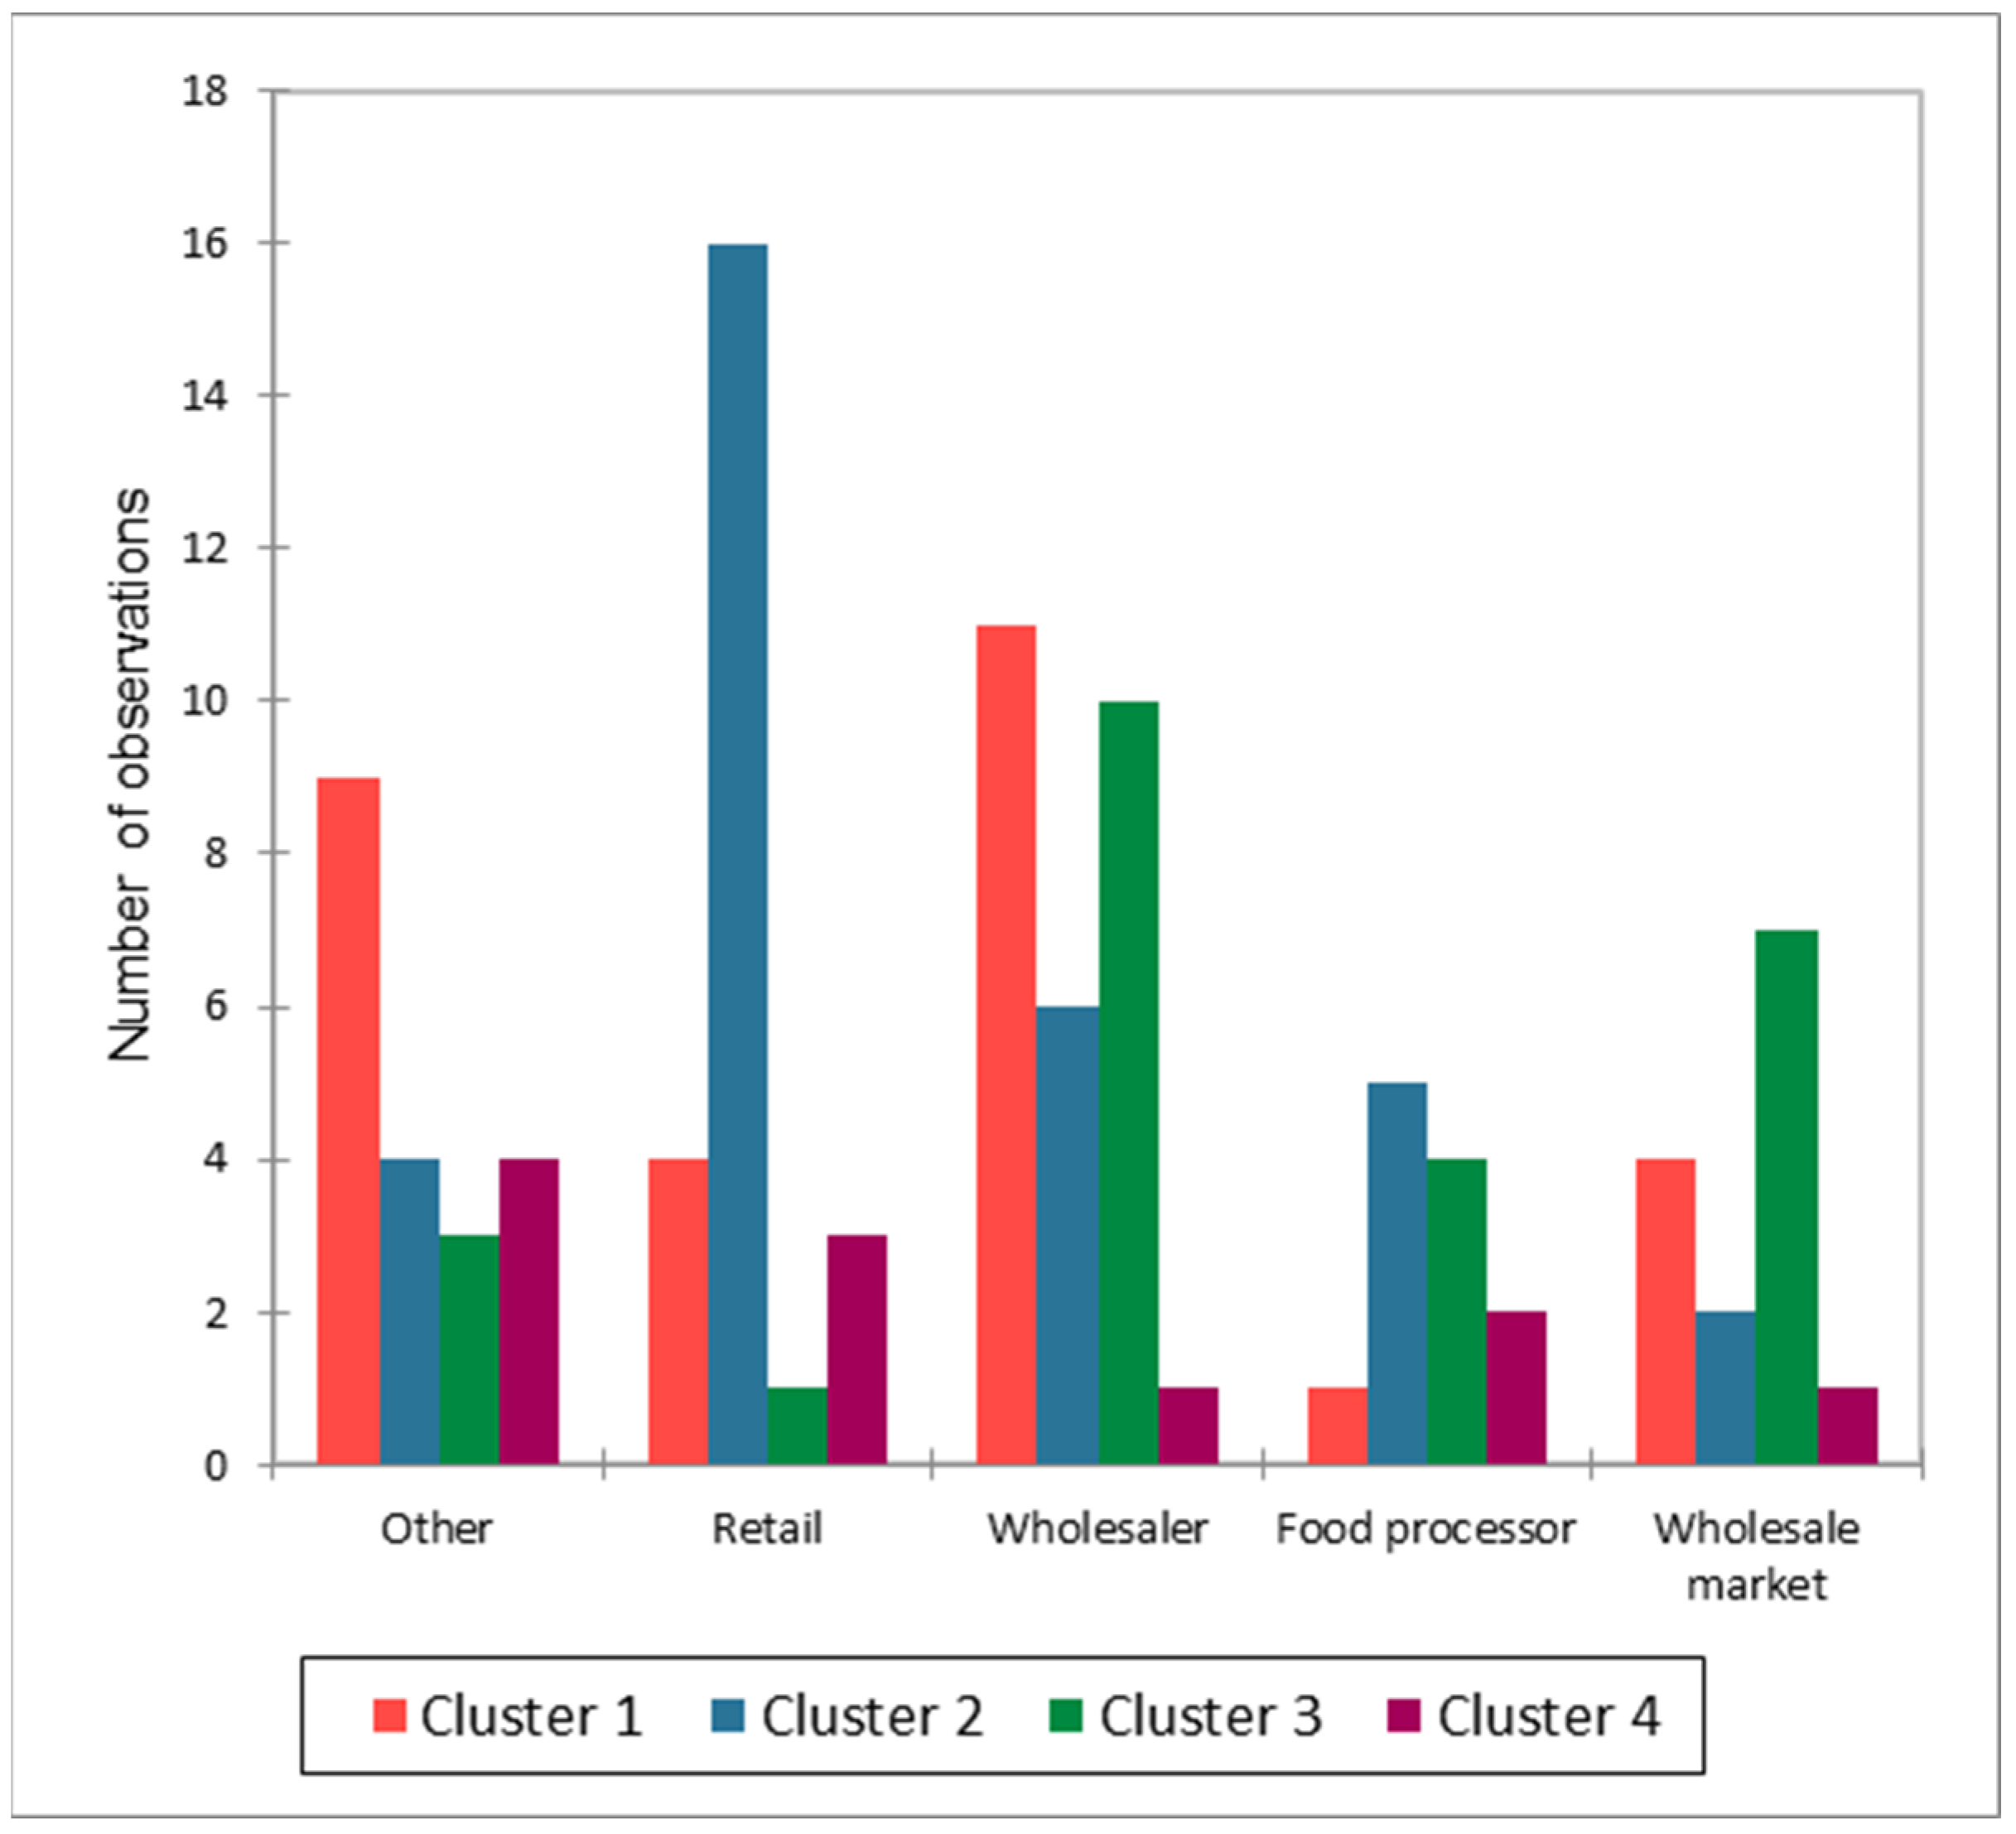
4.2.1. Cluster Analysis with Aggregate Variables

The aggregate variables summarizing the five dimensions of commercial relations are used to perform a cluster analysis. The Cronbach alpha of the five dimensions is as follows: D1 and D2 have α = 0.833; for D3 α = 0.525; for D4 α = 0.651; for D5 α = 0.805. The optimal number of clusters is identified through hierarchical clustering, suggesting an optimal partition of observations in four clusters. A K-means cluster analysis is then used to group the observations into the four clusters. The between-cluster variance is 53.90%, while the within-cluster variance is 46.10%.
The features of each cluster are analyzed by looking at the centroids (Figure 5).
Cluster 1 (29% of observations): buyers are stable and reliable; they do not have strict quality standards and are felt as quite detached from the agricultural sector; these relations are characterized by high satisfaction of producers for the price and margins and by a good atmosphere and cooperation between supplier and buyer.
Cluster 2 (33% of observations): buyers are stable and reliable, and the suppliers’ satisfaction with the economic aspects of the commercial relation is slightly above average, but they are very strict in the application of quality standards on products.
Cluster 3 (25% of observations): commercial relations belonging to this cluster are characterized by high flexibility in the application of quality standards, while the other aspects are rated lower than in other clusters.
Cluster 4 (11% of observations): this cluster groups commercial relations that are perceived as negative by the producers for all the aspects considered; long-term commitment, relational quality, trust, and cooperation are scored lower than the other clusters.
A Kruskal–Wallis test is performed to compare the average values of F15 and F16 across the clusters (Figure 6). As expected, satisfaction for the commercial relation (F16) is significantly higher in Cluster 1 and Cluster 2 with respect to Cluster 4. This is not reflected in the willingness to change buyer (F15), where a significant difference is only observed between Cluster 1 and Cluster 4, although a less significant difference can also be observed between Cluster 1 and Cluster 2 (with p-value 0.024) and Cluster 3 (p-value 0.011). It appears that when the relation is perceived as highly negative, there may be a driver for change: producers pursue an exit strategy after realizing that they have no voice to change things; otherwise, other factors tend to dominate the decision to remain in a commercial relation with the buyer.
Another interesting result concerns the frequency of observations related to each buyer across the clusters. Figure 7 shows that Cluster 3 is mainly composed of commercial relations with wholesalers and wholesale markets, while Cluster 1 is characterized by relations with wholesalers and other buyers (among which, the most frequently cited are short supply chains with products marketed directly to consumers, restaurants and delivery to cooperatives and POs). Cluster 2 mostly represents commercial relations between agricultural producers and retailers. Cluster 4 does not show a particular orientation towards a specific channel and seems to be spread across all of them.

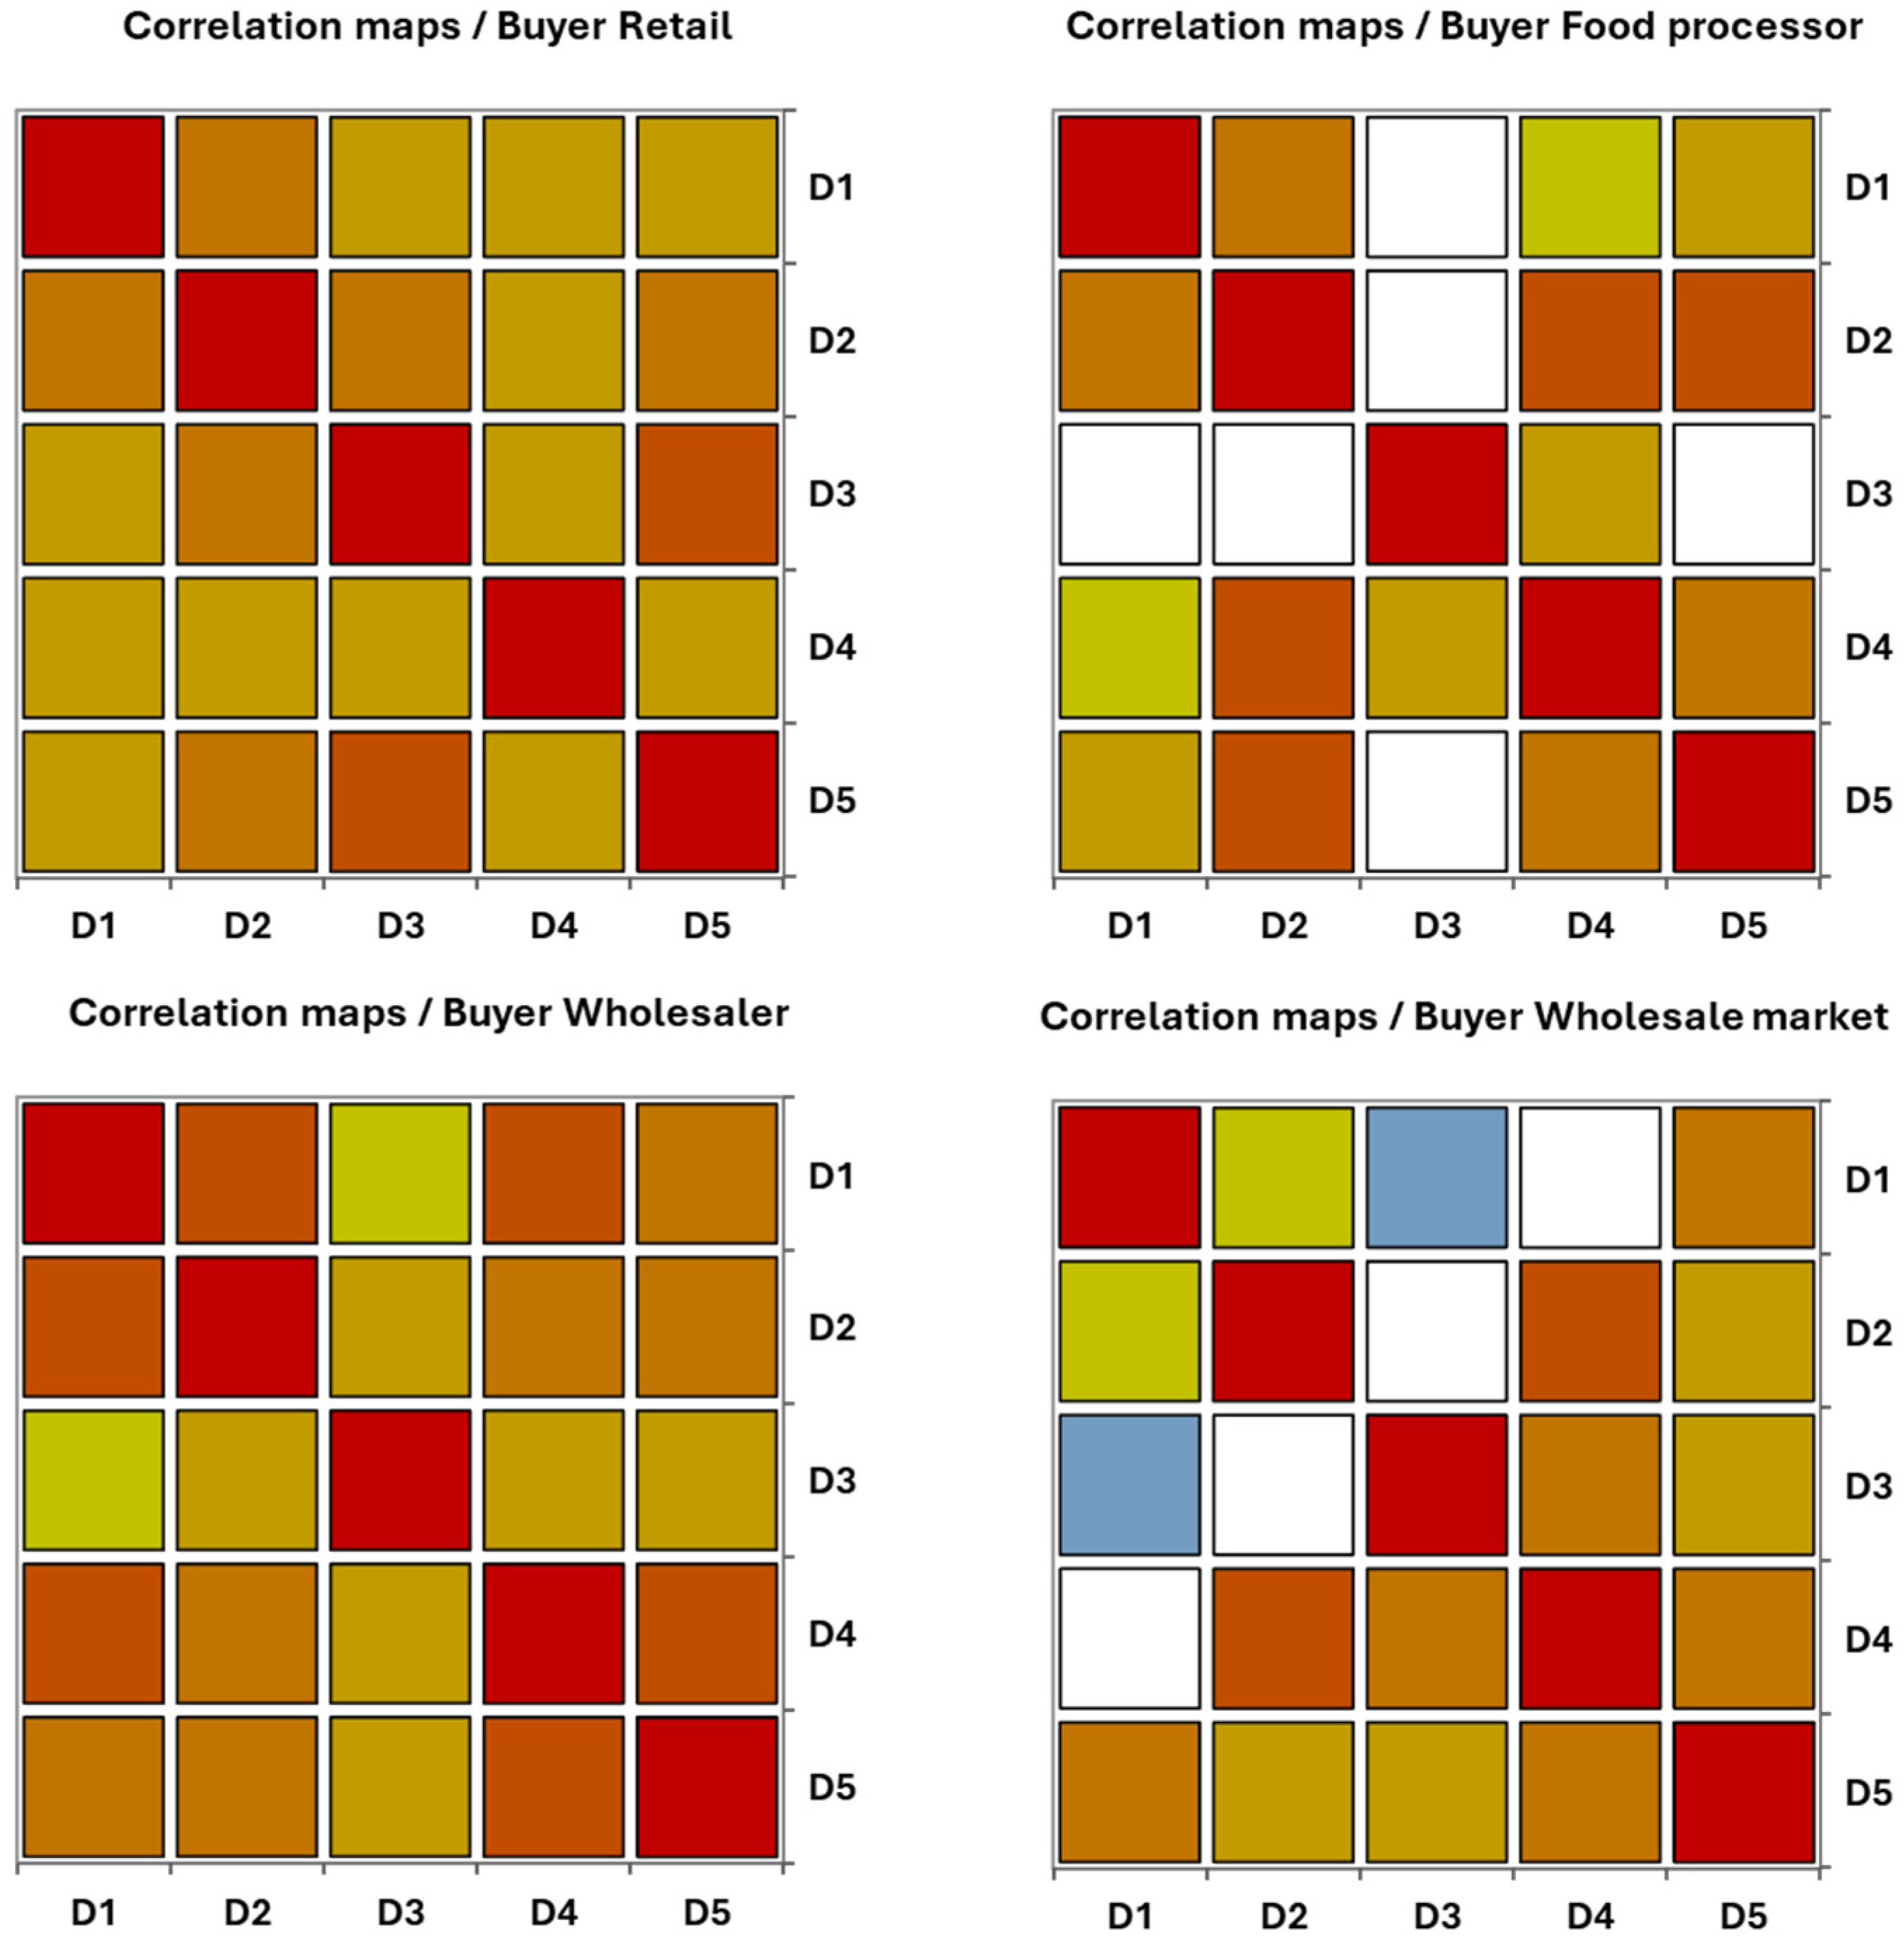
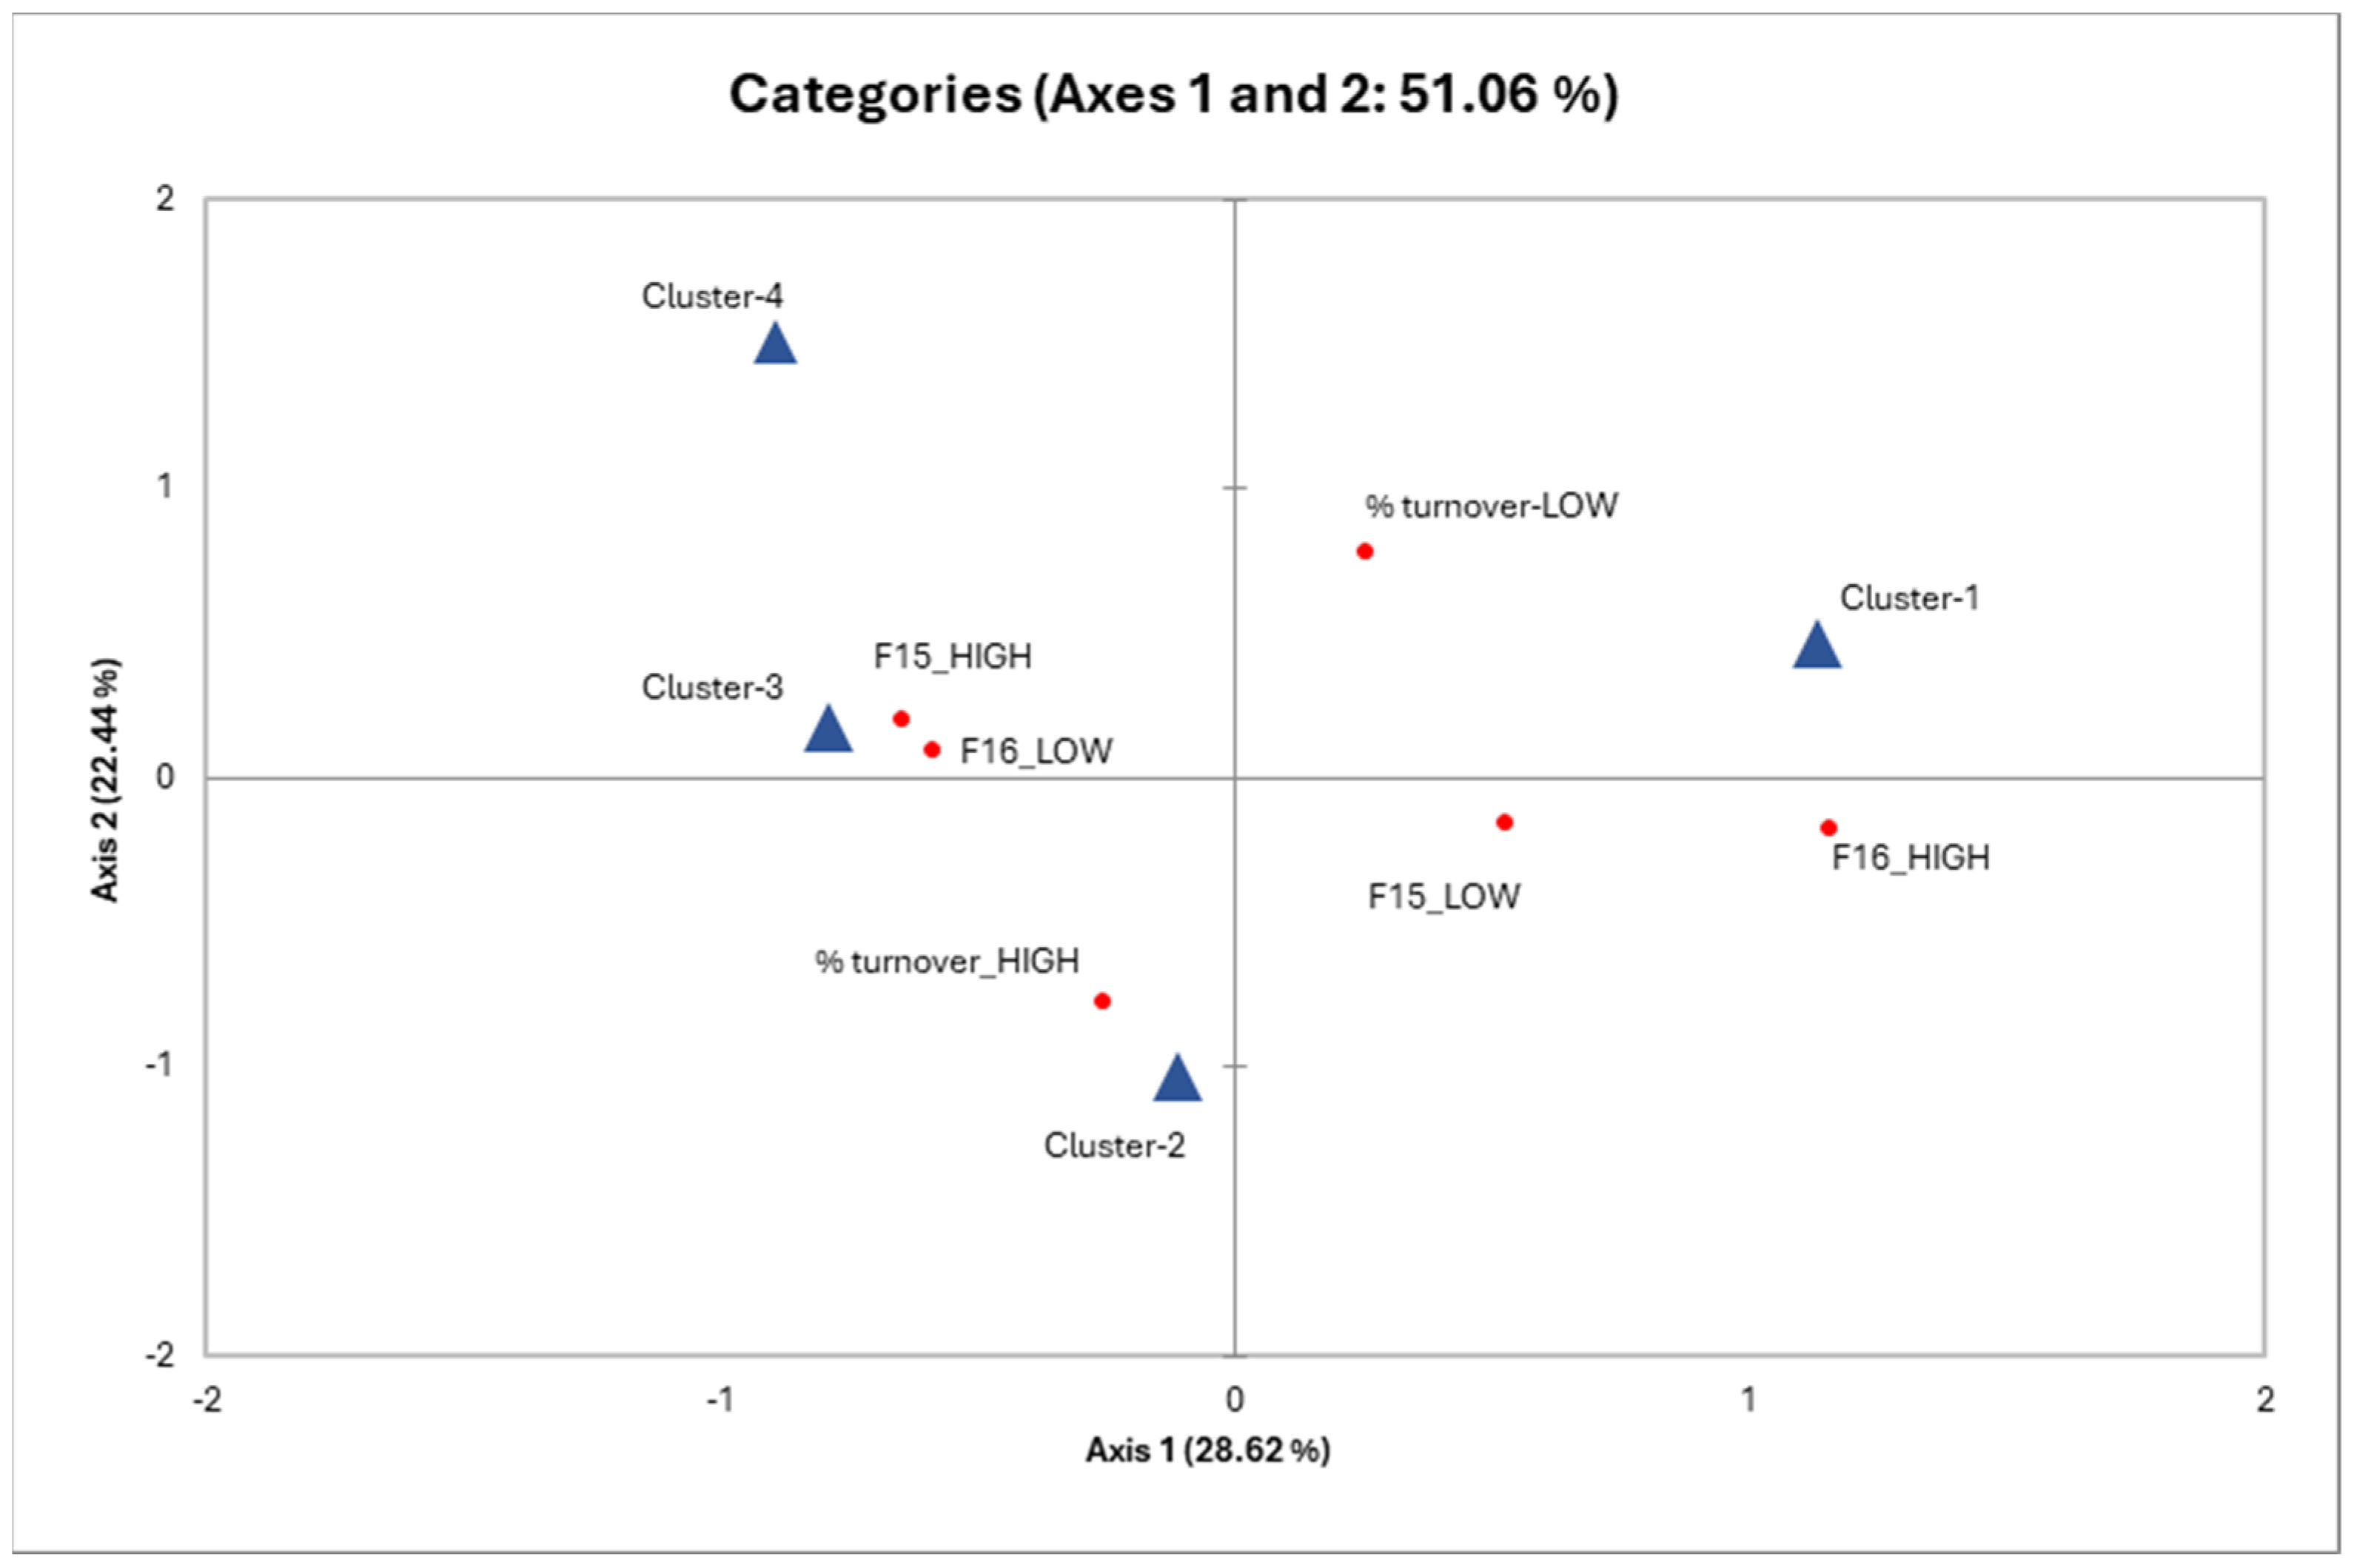
4.2.2. Multiple Correspondence Analysis

A multiple correspondence analysis is conducted to examine the relations between clusters of commercial relations, the percentage of turnover generated through those relations, and the values of F15 and F16, both above and below the median for each item. Figure 8 illustrates the correspondence between the categories of these variables, revealing that commercial relations with high satisfaction (F16_HIGH) and a low willingness to change buyers (F15_LOW) are associated with Cluster 1. This cluster is also closely linked to commercial relations characterized by a low turnover share. Cluster 2, representing commercial relations with retailers, is positioned near high turnover and low willingness to change buyers. Additionally, Cluster 3, which primarily represents commercial relations with wholesalers and wholesale markets, is characterized by low satisfaction and a high intention to change buyers. The same is valid, though to a lesser extent, for Cluster 4.

5. Discussion

This article examines the quality of commercial relations between producers and buyers within the Italian fruit and vegetable supply chain. The content analysis on the focus group transcripts discloses four main factors influencing the quality of commercial relations: external factors, flexibility and scheduling, contracts and negotiations, and relations in the value chain. The latter collects the highest number of sentences, which highlight the importance of long-term commitment, transparency of information, and trust to build a high-quality commercial relationship between agricultural producers and buyers [4,5,6]. Based on the perception of the POs that joined the focus groups, there are several commercial practices that affect the quality of the commercial relation, mainly related to negotiation and bargaining power. Buyers, and in particular retailers, follow a plan of prices, promotions, and quantity of orders, which do not always fit in the fruit and vegetable seasonal trend and agricultural production reality and, therefore, influence the actors of the supply chain [39]. This represents a burden in commercial relations that could be mitigated by a better ability of buyers to adapt to suppliers’ capabilities [5]. This lack of flexibility is also relevant with respect to the application of quality standards, promotions, pricing, and delivery schedules, possibly leading to high rates of product rejections, disputes, and, consequently, increased costs for producers for the management of rejected products [40]. The focus group participants also reported that some of these practices may even result in unfair practices, possibly categorized as UTPs by the current EU and national legislation.
These results are complemented by the evidence provided by the survey, which was used to analyze 98 commercial relations. To this respect, we investigated the perception of producers towards five dimensions of quality of commercial relations—D1 “Long-term commitment”, D2 “Price satisfaction”, D3 “Adaptation on quality standards”, D4 “Relational quality and trust”, and D5 “Cooperation in case of issues”—exploring their relations with the willingness to change buyer and the overall satisfaction for the commercial relation. The correlation matrix shows the link between the dimensions of quality of commercial relations broken down by type of buyer. We detect a correlation between D1 “Long term commitment” and D2 “Price satisfaction”, except for wholesale markets, which may indicate that this channel is mainly chosen on a short-term basis. In fact, producers and POs may choose this channel to reallocate products that are not accepted by other buyers, similar to what happens in the reallocation of suboptimal vegetables to the food industry [9]. Another element supporting this interpretation is the negative correlation observed between D1 “Long term commitment” and D3 “Adaptation on quality standards” for wholesale markets, indicating that standards are more flexible when the timeframe of the commercial relation is short. In this case, the commercial relation is likely to be more oriented towards a transactional approach, where the main driver is the economic outcome [29].
As expected, all buyers show a positive correlation between D4 “Relation quality and trust” and D5 “Cooperation in case of issues”. Interestingly, this correlation is weaker forcommercial relations between producers and retailers than for other buyers, confirming the results from the focus groups, where a lack of communication between producers and retailers is reported. Indeed, communication represents a key element in improving the quality of commercial relations [4], which may also be enhanced by the adoption of technological innovations that allow for improving the relationship between actors, as shown, also with reference to the fruit and vegetables supply chain [41,42,43].
Looking at D3 “Adaptation on quality standards” for commercial relations with processors, we observe that this dimension is not correlated with any other. This suggests that the quality standards required by food processors are not relevant to defining the overall quality of the commercial relation. This may be one of the reasons why producers often consider the food industry a reliable commercial channel despite the lower prices [7].
Looking at clusters of commercial relations, Cluster 2, which mainly includes commercial relations with retailers, shows high ratings for all dimensions except for D3, “Adaptation for quality standards”. In contrast, Cluster 3 demonstrates an opposite trend, with negative performance across all dimensions except for D3; this indicates a high level of adaptation to quality standards on the products; it is predominantly represented by wholesalers and wholesale markets, confirming the results of the correlation analysis presented above. Cluster 1 groups commercial relations that are rated high for all dimensions, and it includes different buyers, especially wholesalers, and buyers falling under the category “other”. “Other” buyers include restaurants and local-based supply chains, which seem to perform very well in terms of establishing relations of high quality. This may be because, in local chains, relational patterns are the most frequent ways of interaction between producers and buyers [44], therefore possibly increasing commitment and trust, which are fundamental to a high-quality commercial relationship [5,28,45].
The analysis of the survey results also discloses that the willingness to change buyers and the overall satisfaction for the commercial relation significantly differ across the clusters, but also that they show different patterns. Commercial relations between producers and buyers often unfold in contexts marked by unbalanced bargaining power distribution [1]. This means that producers might be willing to continue a commercial relationship with buyers because of economic necessity or the lack of alternatives, even if they are not satisfied with the conditions. The economic outcome of commercial relations established with retailers remains positive, even if they apply strict conditions and requirements [46]; retailers represent a large share of their total turnover, which may exceed in importance the perception of fairness or satisfaction. Therefore, it is difficult to identify a clear distinction between transactional or relational approach for these commercial relations, since economic and relational aspects are blended that tie up the parties and, at the same time, may not be satisfactory for both. This is particularly evident when relations are long-term and ensure high turnover over the years. Furthermore, this may suggest that the willingness to change buyers is not an indicator of the quality of commercial relations, as it encompasses the necessity of the supplier to adapt to market opportunities. This mechanism may also be interpreted considering the Hirschman paradigm [47], suggesting that in some cases, producers may be entrapped in commercial relations—especially with retailers—despite their dissatisfaction since they feel to have no voice to express [48]. The lack of alternative markets and the difficulty in diversifying sales channels clearly play a role in this situation.
The multiple correspondence analysis confirms that a crucial aspect influencing the willingness of producers to change buyers is the share of that commercial relation for their turnover. Commercial relations with retailers (Cluster 2) are not perceived as of higher quality than others, but they are still very important as they deliver a high share of the turnover to the producer. One particularly problematic aspect of these relations is the rigid application of quality standards, which sometimes may be used opportunistically. In such cases, a stricter approach may be applied, and products may be rejected more frequently when there is an abundance in the market, possibly resulting in unfair trading practices [18]. A strict application of quality standards may also deliver undesirable impacts, for example, in terms of food loss or economic loss [49,50,51], since there is evidence in the literature showing that UTPs represent a leading factor that generates food loss and waste across the supply chain [52,53]. It is also interesting to interpret the result of commercial relations belonging to Cluster 3, in which quality is perceived to be much worse than in other clusters (high intention to change buyers and low overall satisfaction). The rationale behind the continuation of these relations is probably related to the flexibility that these buyers show in the acceptance of products that do not comply with quality standards requested by retailers.

6. Conclusions, Limitations, and Recommendations for Future Research

By investigating producers’ perception of the quality of their commercial relations, this study suggests that the collaboration among different supply chain actors is a key factor in improving efficiency, quality management, and sustainability in fruit and vegetable supply chain operations. The results from the focus groups and a survey conducted with producers support the idea that trust and long-term cooperation between suppliers and buyers are key factors for a high-quality commercial relationship. Commercial relations that are unsatisfactory for producers persist because of a lack of better alternatives or an entrapment mechanism that keeps them tied to buyers that have a stronger position in the relation.
In interpreting the results of this study, its limitations should also be considered. First, this study focuses on the perspective of the producers and POs; it would be interesting to assess the perceived quality of commercial relations with agricultural producers from the perspective of buyers, especially retailers. Second, despite the efforts to spread the survey and the good number of answers, the number of observations collected does not support more in-depth statistical analyses, which might be used with larger sets of data to investigate the causal link between the quality of commercial relations and its underlying factors.
Future research could explore the link between the quality of commercial relations and the emergence of UTPs. At the same time, an analysis of the assessment of the impact of UTPs on producers could help in improving the sustainability and equity of the supply chain. Investigating these aspects could provide valuable insights to develop more equitable supply chain practices, as well as long-term and satisfactory commercial relations for producers.

Author Contributions

Conceptualization, C.C., C.R., F.G., R.P. and A.C.; methodology, C.C., C.R., A.C., F.G. and R.P.; formal analysis, R.P. and C.C.; writing—original draft preparation, R.P. and C.C.; writing—review and editing, C.R., A.C., L.C., A.S. and F.G.; supervision, A.S. All authors have read and agreed to the published version of the manuscript.

Funding

Finanziato dall’Unione europea- Next Generation EU, Missione 4 Componente 1, progetto PRIN AGREF 2022FARZPJ, CUP J53D23004510006, erogato dal Ministero dell’Università e della Ricerca.

Institutional Review Board Statement

Not applicable.

Informed Consent Statement

Informed consent was obtained from all subjects involved in this study, specifying that: (i) the survey tackled the analysis of quality of commercial relations, with a link to an explanatory text; (ii) no personal data were going to be collected; (iii) participation was voluntary, and participants could withdraw at any time; (iv) results were going to be aggregated and treated as a whole bulk of data, with no possibility to disclose the identity of the respondents or the company they belong to.

Data Availability Statement

Raw data supporting the conclusions of this article will be made available by the authors on request.

Acknowledgments

This work is part of the PRIN 2022 project AGREF—Agri-food value chains efficiency and fairness, funded by the Italian Ministry of Research under funding of the European Union, Next Generation EU, Mission 4, Component 1, CUP J53D23004510006. The views reflected in this article represent the professional views of the authors and do not necessarily reflect the views of the Italian Ministry of Research or other partners of the project.

Conflicts of Interest

The authors declare no conflicts of interest.

Abbreviations

The following abbreviations are used in this manuscript:
PO(s)Producer Organisation(s)
UTP(s)Unfair Trading Practice(s)

References

  1. Bonanno, A.; Russo, C.; Menapace, L. Market power and bargaining in agrifood markets: A review of emerging topics and tools. Agribusiness 2018, 34, 6–23. [Google Scholar] [CrossRef]
  2. Sexton, R.J.; Xia, T. Increasing concentration in the agricultural supply chain: Implications for market power and sector performance. Annu. Rev. Resour. Econ. 2018, 10, 229–251. [Google Scholar] [CrossRef]
  3. Carbone, A. Foods and places: Comparing different supply chains. Agriculture 2018, 8, 6. [Google Scholar] [CrossRef]
  4. Kühne, B.; Gellynck, X.; Weaver, R.D. The influence of relationship quality on the innovation capacity in traditional food chains. Supply Chain. Manag. Int. J. 2013, 18, 52–65. [Google Scholar] [CrossRef]
  5. Razavi, S.M.; Abdi, M.; Amirnequiee, S.; Ghasemi, R. The impact of supply chain relationship quality and cooperative strategy on strategic purchasing. J. Logist. Manag. 2016, 5, 6–15. [Google Scholar] [CrossRef]
  6. Gajdić, D.; Mesić, Ž.; Petljak, K. Preliminary research about producers’ perceptions of relationship quality with retailers in the supply chain of organic food products in Croatia. Sustainability 2021, 13, 13673. [Google Scholar] [CrossRef]
  7. Herzberg, R.; Schmidt, T.; Keck, M. Market power and food loss at the producer-retailer interface of fruit and vegetable supply chains in Germany. Sustain. Sci. 2022, 17, 2253–2267. [Google Scholar] [CrossRef]
  8. Mondliwa, P.; Roberts, S.; Ponte, S. Competition and power in global value chains. Compet. Change 2021, 25, 328–349. [Google Scholar] [CrossRef]
  9. Pietrangeli, R.; Herzberg, R.; Cicatiello, C.; Schneider, F. Quality Standards and Contractual Terms Affecting Food Losses: The Perspective of Producer Organisations in Germany and Italy. Foods 2023, 12, 1984. [Google Scholar] [CrossRef]
  10. Devin, B.; Richards, C. Food waste, power, and corporate social responsibility in the Australian food supply chain. J. Bus. Ethics 2018, 150, 199–210. [Google Scholar] [CrossRef]
  11. Skorbiansky, S.R.; Ellison, B. Contracting and quality standards in fresh produce markets and how they impact food loss. In The Economics of Food Loss in the Produce Industry; Routledge: London, UK, 2019; pp. 250–262. [Google Scholar]
  12. Corrado, A.; Caruso, F.S.; Lo Cascio, M.; Nori, M.; Palumbo, L.; Triandafyllidou, A. Is Italian Agriculture a ‘Pull Factor’for Irregular Migration—And, If So, Why? 2018. Available online: https://www.opensocietyfoundations.org/uploads/ba12312d-31f1-4e29-82bf-7d8c41df48ad/is-italian-agriculture-a-pull-factor-for-irregular-migration-20181205.pdf (accessed on 10 August 2024).
  13. Cacchiarelli, L.; Sorrentino, A. Market power in food supply chain: Evidence from Italian pasta chain. Br. Food J. 2018, 120, 2129–2141. [Google Scholar] [CrossRef]
  14. Sorrentino, A.; Russo, C.; Cacchiarelli, L. Market power and bargaining power in the EU food supply chain: The role of Producer Organizations. New Medit 2018, 17, 21–31. [Google Scholar] [CrossRef]
  15. Dallas, M.P.; Ponte, S.; Sturgeon, T.J. Power in global value chains. Rev. Int. Political Econ. 2019, 26, 666–694. [Google Scholar] [CrossRef]
  16. Falkowski, J.; Ménard, C.; Sexton, R.; Swinnen, J.; Vandevelde, S.; Di Marcantonio, F.; Ciaian, P. (Eds.) Unfair Trading Practices in the Food Supply Chain: A Literature Review on Methodologies, Impacts and Regulatory Aspects; EUR 28791 EN; JRC108394; Publications Office of the European Union: Luxembourg, 2017; ISBN 978-92-79-73831-9. [Google Scholar] [CrossRef]
  17. European Commission. European Commission. EU Regulation 2013/1308 and the Commission Delegated Regulation 2016/232; European Commission: Brussels, Belgium, 2016. [Google Scholar]
  18. Russo, C.; Di Marcantonio, F.; Cacchiarelli, L.; Menapace, L.; Sorrentino, A. Unfair trading practices and countervailing power. Food Policy 2023, 119, 102521. [Google Scholar] [CrossRef]
  19. Christy, R.D. The role of farmer cooperatives in a changing agricultural economy. J. Agric. Appl. Econ. 1987, 19, 21–28. [Google Scholar] [CrossRef]
  20. EU 2013 EU. Regulation (EU) No 1308/2013 of the European Parliament and of the Council of 17 December 2013 Establishing a Common Organisation of the Markets in Agricultural Products and Repealing Council Regulations (EEC) No 922/72, (EEC) No 234/79, (EC) No1037/2001 and (EC)No1234/2007. 2013. Available online: https://eur-lex.europa.eu/legal-content/en/TXT/?uri=CELEX:32013R1308 (accessed on 10 September 2024).
  21. European Commission: Directorate-General for Agriculture and Rural Development; Montanari, F.; Chlebicka, A.; Szabo, G.; Amat, L.; Traon, D.; Sorrentino, A.; Russo, C.; Ferreira, I. Study of the Best Ways for Producer Organisations to be Formed, Carry out Their Activities and Be Supported—Final Report; Publications Office of the European Union: Luxembourg, 2019; Available online: https://data.europa.eu/doi/10.2762/034412 (accessed on 6 April 2024).
  22. Van Herck, K. Assessing Efficiencies Generated by Agricultural Producer Organizations (No. 473441); KU Leuven, Faculty of Economics and Business (FEB), LICOS-Centre for Institutions and Economic Performance: Leuven, Belgium, 2014; Available online: http://bookshop.europa.eu/it/assessing-efficiencies-generated-by-agricultural-producer-organisations-pb-KD0214739/ (accessed on 20 April 2024).
  23. Nucera, M.; Ferrari, G.M.; Finizia, A.; Merciai, S.; Sorrentino, A. The role of Producer Organisations in the vegetable value chain: An application to the red chicory from Veneto. Ital. Rev. Agric. Econ. 2016, 71, 100–114. [Google Scholar] [CrossRef]
  24. Velázquez, B.; Buffaria, B.; European Commission. About farmers’ bargaining power within the new CAP. Agric. Food Econ. 2017, 5, 16. [Google Scholar] [CrossRef]
  25. Molnár, A.; Van Lembergen, K.; Tarantini, F.; Heene, A.; Gellynck, X. Price transparency as a prerequisite for fair competition: The case of the European food prices monitoring tool. In The Ethics and Economics of Agrifood Competition; Springer: Dordrecht, The Netherlands, 2013; pp. 243–261. [Google Scholar] [CrossRef]
  26. Cavicchioli, D. Detecting market power along food supply chains: Evidence and methodological insights from the fluid milk sector in Italy. Agriculture 2018, 8, 191. [Google Scholar] [CrossRef]
  27. Bandara, S.; Leckie, C.; Lobo, A.; Hewege, C. Power and relationship quality in supply chains: The case of the Australian organic fruit and vegetable industry. Asia Pac. J. Mark. Logist. 2017, 29, 501–518. [Google Scholar] [CrossRef]
  28. Schulze, B.; Wocken, C.; Spiller, A. Relationship quality in agri-food chains: Supplier management in the German pork and dairy sector. J. Chain. Netw. Sci. 2006, 6, 55–68. [Google Scholar] [CrossRef]
  29. Grant, D.B. The Transaction—Relationship Dichotomy in Logistics and Supply Chain Management. Supply Chain Forum Int. J. 2005, 6, 38–48. [Google Scholar] [CrossRef]
  30. Anderson, E.; Weitz, B. The use of pledges to build and sustain commitment in distribution channels. J. Mark. Res. 1992, 29, 18–34. [Google Scholar] [CrossRef]
  31. Morgan, R.M. The commitment-trust theory of relationship marketing. J. Mark. 1994, 58, 20–38. [Google Scholar] [CrossRef]
  32. Ganesan, S. Determinants of long-term orientation in buyer-seller relationships. J. Mark. 1994, 58, 1–19. [Google Scholar] [CrossRef]
  33. Geyskens, I.; Steenkamp, J.B.E. Economic and social satisfaction: Measurement and relevance to marketing channel relationships. J. Retail. 2000, 76, 11–32. [Google Scholar] [CrossRef]
  34. Kallio, H.; Pietilä, A.-M.; Johnson, M.; Kangasniemi, M. Systematic methodological review: Developing a framework for a qualitative semi-structured interview guide. J. Adv. Nurs. 2016, 72, 2954–2965. [Google Scholar] [CrossRef]
  35. Kuckartz, U. Qualitative content analysis: From Kracauer’s beginnings to today’s challenges. Forum Qual. Sozialforschung/Forum Qual. Soc. Res. 2019, 20, 20. [Google Scholar] [CrossRef]
  36. Gundlach, G.T.; Achrol, R.S.; Mentzer, J.T. The structure of commitment in exchange. J. Mark. 1995, 59, 78–92. [Google Scholar] [CrossRef]
  37. Håkansson, H.; IMP Project Group. International Marketing and Purchasing of Industrial Goods: An Interaction Approach; Wiley: Hoboken, NJ, USA, 1982. [Google Scholar]
  38. Anderson, J.C.; Narus, J.A. A model of distributor firm and manufacturer firm working partnerships. J. Mark. 1990, 54, 42–58. [Google Scholar] [CrossRef]
  39. Gu, J.; Shi, X.; Wang, J.; Xu, X. Examining the impact of market power discrepancy between supply chain partners on firm financial performance. Int. J. Prod. Econ. 2024, 268, 109100. [Google Scholar] [CrossRef]
  40. Eriksson, M.; Ghosh, R.; Mattsson, L.; Ismatov, A. Take-back agreements in the perspective of food waste generation at the supplier-retailer interface. Resour. Conserv. Recycl. 2017, 122, 83–93. [Google Scholar] [CrossRef]
  41. Nasso, M.; Blasi, E.; Pezzoli, F.; Cicatiello, C. Investigating Co-Innovation strategies to prevent food loss in the fruits and vegetables sector. J. Clean. Prod. 2024, 467, 142984. [Google Scholar] [CrossRef]
  42. Giua, C.; Materia, V.C.; Camanzi, L. Smart farming technologies adoption: Which factors play a role in the digital transition? Technol. Soc. 2022, 68, 101869. [Google Scholar] [CrossRef]
  43. Mozzato, D.; Gatto, P.; Defrancesco, E.; Bortolini, L.; Pirotti, F.; Pisani, E.; Sartori, L. The role of factors affecting the adoption of environmentally friendly farming practices: Can geographical context and time explain the differences emerging from literature? Sustainability 2018, 10, 3101. [Google Scholar] [CrossRef]
  44. Brunori, G.; Galli, F.; Barjolle, D.; Van Broekhuizen, R.; Colombo, L.; Giampietro, M.; Kirwan, J.; Lang, T.; Mathijs, E.; Maye, D.; et al. Are local food chains more sustainable than global food chains? Considerations for assessment. Sustainability 2016, 8, 449. [Google Scholar] [CrossRef]
  45. Assis, M.T.; Lucas, M.R.; Rainho, M.J.M. A meta-analysis on the trust in agrifood supply chains. Food Front. 2022, 3, 413–427. [Google Scholar] [CrossRef]
  46. Camanzi, L.; Malorgio, G.; Azcárate, T.G. The role of producer organizations in supply concentration and marketing: A comparison between European countries in the fruit and vegetable sector. J. Food Prod. Mark. 2011, 17, 327–354. [Google Scholar] [CrossRef]
  47. Hirschman, A.O. Exit, Voice, and Loyalty: Responses to Decline in Firms, Organizations, and States; Harvard University Press: Cambridge, MA, USA, 1970. [Google Scholar]
  48. Alpmann, J.; Bitsch, V. Exit, voice, and loyalty in the case of farmer associations: Decision-making of dairy farmers during the German milk conflict. Int. Food Agribus. Manag. Rev. 2015, 18, 61–84. [Google Scholar] [CrossRef]
  49. Herzberg, R.; Trebbin, A.; Schneider, F. Product specifications and business practices as food loss drivers—A case study of a retailer’s upstream fruit and vegetable supply chains. J. Clean. Prod. 2023, 417, 137940. [Google Scholar] [CrossRef]
  50. Pietrangeli, R.; Cicatiello, C. Lost vegetables, lost value: Assessment of carrot downgrading and losses at a large producer organisation. J. Clean. Prod. 2024, 478, 143873. [Google Scholar] [CrossRef]
  51. Fernandez-Zamudio, M.A.; Barco, H.; Schneider, F. Direct measurement of mass and economic harvest and post-harvest losses in Spanish persimmon primary production. Agriculture 2020, 10, 581. [Google Scholar] [CrossRef]
  52. Piras, S.; Herrero, L.G.; Burgos, S.; Colin, F.; Gheoldus, M.; Ledoux, C.; Parfitt, J. Unfair Trading Practice Regulation and Voluntary Agreements Targeting Food Waste. A Policy Assessment in Select EUMember States. REFRESH. 2018. Available online: https://eu-refresh.org/unfair-trading-practice-regulation-and-voluntary-agreements-targeting-food-waste.html (accessed on 18 October 2024).
  53. Sinclair Taylor, J.; Parfitt, J.; Jarosz, D. Regulating the Role of Unfair Trading Practices in Food Waste Generation. 2019. Available online: https://eu-refresh.org/sites/default/files/REFRESH%20Policy%20Brief%20on%20UTPs_2019_FINAL.pdf (accessed on 20 September 2024).
Figure 1. Factors related to the perception of the commercial relations emerging from the focus groups (N = 75).
Sustainability 17 02641 g001
Figure 2. Distribution of answers concerning the overall assessment of the commercial relations quality by respondents, in terms of willingness to replace buyer (F15) and overall satisfaction for the commercial relation (F16).
Sustainability 17 02641 g002
Figure 3. Bubble diagram of F15 and F16 showing the cross-distribution of answers; the size of the bubble is proportional to the number of observations.
Sustainability 17 02641 g003
Figure 4. Correlation matrix between the dimensions of quality of commercial relations, broken down by type of buyer; colors from red to white reflect a strong to weak positive correlation; color from blue to white reflects a strong to weak negative correlation. The dimensions are: D1 “Long-term commitment”, D2 “Price satisfaction”, D3 “Adaptation on quality standards”, D4 “Relational quality and trust”, and D5 “Cooperation in case of issues”.
Sustainability 17 02641 g004
Figure 5. Centroids of the four clusters in relation to the five variables considered (standardized value; 0 = average of the dimension, positive values = above average, negative values = below average).
Sustainability 17 02641 g005
Figure 6. Results of the Kruskal–Wallis test to compare the average values of F15 and F16 across the clusters.
Sustainability 17 02641 g006
Figure 7. Frequencies of different types of buyers across the clusters.
Sustainability 17 02641 g007
Figure 8. Correspondence between perceived quality of commercial relation, turnover, and clusters.
Sustainability 17 02641 g008
Table 1. Description of the POs involved in this study.
NumRegion (Noth, Centre, Sud)Range of Tunover (€ per Year)Last Available Data on Total Activity (€)Number of EmployeesPresence/Online
1North<10 mln €20237O
2Centre<10 mln €202215P
3South10–20 mln €202293O
4South<10 mln €202223O
5South<10 mln €2022106O
6South>20 mln €2022158O
7Centre10–20 mln €20222P
8South10–20 mln €2022154O
9South<10 mln €202157O
10Centre10–20 mln €2022212P
11Centre<10 mln €202311O
12South10–20 mln €202228O
13South10–20 mln €20214O
14South10–20 mln €202171O
15South<10 mln €20223O
16South10–20 mln €20228O
17Centre<10 mln €2022140O
18North<10 mln €20213O
19South>20 mln €202273O
20South>20 mln €202195O
21North>20 mln €2023101O
22South10–20 mln €202291O
23South<10 mln €20221O
24South10–20 mln €2022105O
Table 2. Descriptive statistics of numerical survey items (N = 98).
CodDim.VariableUnitsMeanSt. Dev.MinMax
F1D1This buyer gives me the certainty of being able to sell a large part of my productionLikert 1–74.481.8117
F2D1This buyer gives me the certainty of having a medium–long-term sales channelLikert 1–74.571.5317
F3D1With this buyer, the contractual conditions are clear from the beginning of the seasonLikert 1–74.11.8417
F4D2This buyer offers me good prices for my productsLikert 1–74.161.4517
F5D2This buyer gives me the possibility of making good margins on the productsLikert 1–74.11.5517
F6D3The quality standards (aesthetic aspects, size, shape, color, etc.) required by this buyer are strict (compared with others)Likert 1–74.811.6717
F7D3The control of quality standards upon delivery is rather flexibleLikert 1–73.861.6117
F8D3It often happens that the products we deliver to this buyer are rejectedLikert 1–73.481.6817
F9-The buyer does not appropriately consider the uncertainty of the weather and seasonal conditions of the last periodLikert 1–74.391.9117
F10D4There is no dialogue with this buyerLikert 1–73.681.8217
F11D4I have a good relationship with the person with whom I contract the sale of the productsLikert 1–74.721.6117
F12D4This buyer considers us to be reliableLikert 1–75.351.4317
F13D5If we make a mistake, this buyer is available to help us out.Likert 1–74.391.5517
F14D5If they (the buyer) make a mistake, they are willing to fix itLikert 1–74.281.6817
F15 I would prefer to replace this buyer with anotherLikert 1–73.191.6617
F16 Overall, I am satisfied with the commercial relations with this buyerLikert 1–74.761.6117
Table 3. Descriptive statistics of categorical survey items (N = 98).
VariableType of CategoriesCategoryDescriptionObservations %
Is the farmer joining a PO or a cooperativeDummy0No42.55
1Yes57.45
Localization in ItalyCategorical1North26.60
2Centre41.49
3South31.91
Which is the commercial channel?Categorical1Retailers24.47
2Wholesalers27.66
3Food processors12.77
4Wholesale markets14.89
5Other (specify20.21
% of turnover with the buyerDummy0<40% of the total turnover50.00
1>40% of the total turnover50.00
How many years have you been working with this buyer? 1Categorical1less than 2 years9.57
2Between 2 and 527.66
3Between Tra 5 and 1012.77
4More than 1050.00
F15—I would prefer to replace this buyer with anotherDummy0Lower than the median value55.10
1Higher than the median value44.89
F16—Overall, I am satisfied with the commercial relations with this buyerDummy0Lower than the median value66.33
1Higher than the median value33.67
1 The original formulation of this item is “Please indicate the % of your total turnover depending on this buyer” and the respondents had to choose between the following answers: <20%; 20–40%; 40–60%; 60–80% and >80%. These categories were then grouped during the elaborations, as indicated in Table 2.
Disclaimer/Publisher’s Note: The statements, opinions and data contained in all publications are solely those of the individual author(s) and contributor(s) and not of MDPI and/or the editor(s). MDPI and/or the editor(s) disclaim responsibility for any injury to people or property resulting from any ideas, methods, instructions or products referred to in the content.

