Abstract
Against the backdrop of accelerated global infrastructure development, one of the key objectives of sustainable development is to achieve a construction model that is safe, efficient, and environmentally low-impact. Therefore, the safety of tunnel construction and the health of workers have become central issues in sustainable development. The present study explores the relationship between the tunnel micro-environment and unsafe behavior of construction workers, with a focus on the mediating role of mental health. The study collected construction micro-environment data, basic information of construction workers, mental health status, and data on unsafe behavior from six tunnels as research samples. The tunnel micro-environment was primarily tested for noise and dust concentration. Noise data were obtained through on-site measurements, while dust concentrations were obtained from both field measurements and Fluent numerical simulations. The findings of the research indicate that noise and dust concentration in the tunnel micro-environment have a significant impact on the mental health and unsafe behavior of construction workers (p < 0.001). Based on structural equation modelling, we found that the stress, emotional regulation ability, and physical health statuses of tunnel construction workers had a significant impact on their mental health. Behaviors such as ignoring warning signs and working in high-risk areas had the most significant impact on unsafe behavior, with standardized path coefficients greater than 0.75. Concurrently, mental health status played a significant mediating role between the tunnel micro-environment and unsafe behavior. Finally, the study determined the environmental threshold values for noise and dust concentration at varying risk levels. This finding is of significant value in the reduction in occupational disease risks, the enhancement of the livability of work environments, and the provision of scientific evidence for the long-term sustainable development of infrastructure construction.
1. Introduction
Health, as a fundamental human right, has been widely recognized for its importance to individual quality of life and societal development. However, due to its inherent complexity and subtle nature, occupational health has become a challenging issue in global public health governance, particularly in the context of rapid industrialization and economic globalization [1,2]. Occupational health not only affects physical health but also involves mental health and behavioral safety, exerting a profound impact on labor productivity and social stability [3,4].
Within the global framework of occupational health governance, China faces unique and severe challenges. As the largest developing country in the world, China has rapidly risen to become the “world’s factory” since its reform and opening-up, leveraging its advantages in land and labor costs. Despite the substantial enhancement in living standards and life expectancy that has been brought about by rapid economic development, the process of industrialization has also introduced severe occupational health risks, particularly in high-pollution and high-risk industries. Among them, tunnel construction has become a focus of research and governance due to its extreme working environment.
The pollution level in tunnel construction environments is much higher than that in ordinary workplaces. The environmental pollution in tunnel construction spaces may exceed that in residential and activity spaces by dozens of times. It not only threatens the workers’ physical health, but also potentially has a profound impact on mental health and unsafe behavior due to long-term stress and environmental discomfort [5,6,7]. As shown in Figure 1, statistical data from 1993 to 2023 concerning tunnel construction safety incidents in China reveal that 28.6% of the accidents were caused by unsafe behaviors of personnel. These characteristics make tunnel construction workers a key group for occupational health research and intervention, requiring special attention.
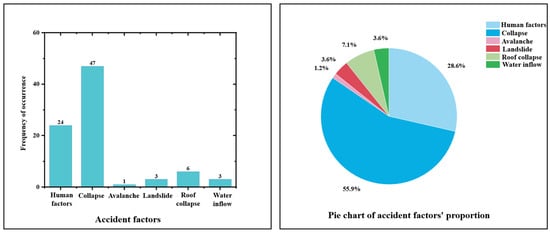
Figure 1.
Statistical chart and proportion chart of tunnel construction safety accident factors in China from 1993 to 2023.
The tunnel construction micro-environment is characterized by its enclosed nature, low ventilation, and high humidity. This environment has been found to result in a concentration of dust and noise pollution, which has been shown to exert a cumulative effect on the workers’ physical and mental health, as well as their behavioral patterns [8,9]. What is more complex is that these hazard factors interact both temporally and spatially, with the potential to affect workers’ comfort and behavioral safety through nonlinear mechanisms.
Currently, there is limited research examining the impact of influencing factors such as dust and noise in the tunnel construction micro-environment on workers’ safety behavior and the underlying mechanisms. It is evident that further research is required, particularly in developing countries, to ascertain how these factors can influence workers’ unsafe behavior through mental health as a mediating variable. Mental health status is not only an important dimension of occupational health, but also a key bridge linking micro-environment exposure to behavioral safety [10]. High dust and noise environments may induce psychological stress, anxiety, and distraction, leading to errors in behavioral judgment and loss of control over safe operations. A deeper understanding of this mechanism is of significant importance for improving operational safety [11,12].
In the context of accelerated global infrastructure development, sustainable development is defined by two key elements: environmental protection and the long-term stability of society and the economy. The safety of the working environment and the health and well-being of workers are considered fundamental components in achieving sustainable development. Tunnel construction is a high-risk and high-intensity work form. It exposes workers to an extreme micro-environment with high dust and noise levels for prolonged periods. This has the potential to pose harm to their physical health and may also have a profound impact on their psychological state and decision-making behaviors. If these risk factors are ignored for an extended period, the frequency of unsafe behaviors may increase, thereby raising the accident rate [13,14].
Therefore, it is imperative to conduct systematic research on the impact of the tunnel construction micro-environment on workers’ mental health and unsafe behaviors to enhance individual well-being and workplace safety while advancing the core goals of sustainable development. Consequently, there is an urgent need for systematic research on the effects of tunnel construction micro-environment exposure on workers’ mental health and unsafe behavior. In summary, this study constructs a structural equation model, starting with key construction micro-environment factors such as dust and noise, to analyze their combined effect mechanism on unsafe behavior, while considering the mediating effect of mental health. The study is a practical guide for environmental management in tunnel construction and provides a new theoretical basis for promoting green infrastructure and occupational safety enhancement in developing countries.
2. Correlation Analysis of the Tunnel Micro-Environment, Mental Health, and Unsafe Behavior
Based on a summary of the definitions and indicator systems for micro-environment in the existing literature, this paper defines the “tunnel micro-environment” as environmental factors that may affect the mental health and safety behavior of tunnel construction workers. Specifically, it includes dust, hazardous gases, temperature, humidity, noise, and light/visual environment [13,14,15]. The micro-environment of tunnel construction is complex, with significant differences in dust and noise exposure among workers in different workspaces and occupations [16]. It is important to note that construction noise and dust are considered the most prevalent and severe pollutants at construction sites [17,18]. Overall, in non-high geothermal and non-cold regions, the temperature and humidity variations within the same tunnel construction space are minimal [19]. Additionally, due to the stringent lighting standards that are in place at construction sites, instances of inadequate or excessive lighting in workspaces are uncommon. Consequently, this study focused on dust concentration and noise level as key research elements.
Human behavior is the result of the interaction between the micro-environment and the individual [20,21,22]. A plethora of extant studies have hitherto explored the impact of the micro-environment on unsafe behavior in a variety of fields. For instance, in the coal mining industry, structural equation modelling has revealed the significant influence of equipment and facilities, as well as the complex micro-environment, on employee unsafe behavior [23,24,25]. Similarly, in the construction industry, studies have shown that the condition of machinery and equipment, on-site noise, and the installation of warning signs are important environmental factors leading to workers’ unsafe behavior [26,27]. These findings provide a valuable reference point for understanding the characteristics of unsafe behavior in the tunnel construction environment. Based on the above analysis, the following hypothesis is proposed:
H1.
The tunnel micro-environment has a significant positive impact on the unsafe behavior of tunnel construction workers.
Mental health has been demonstrated to have a significant impact on an individual’s cognitive functions and behavioral performance, including thinking ability, memory, language expression, and event handling ability. It is a pivotal factor in determining work ability. According to the principles of mental health theory, there exists a complex interplay between an individual’s psychological state and the micro-environment in which they reside. Existing studies have shown that the workplace is the core space for adults to acquire life resources and social status, occupying a significant portion of an individual’s daily activities. Therefore, the quality of the workplace micro-environment is directly related to mental health levels [28,29,30,31,32].
Recent studies conducted by scholars have indicated that exposure to extremely harsh working environments, such as those with monotonous colors, insufficient lighting, damp and dark conditions, and adverse factors such as high noise, strong vibrations, high dust levels, and toxic gases can result in significant disruptions to individuals’ physiological functions and internal balance [33]. These disruptions have been found to potentially lead to weakened mental health and the onset of emotional disorders. According to environmental psychology theory, a micro-environment that is enclosed and lacks external interaction further exacerbate the risks to mental health. Tunnel workers are subjected to a prolonged period of employment in an enclosed, dark, and high-pressure working environment, which renders them susceptible to feelings of oppression [34,35]. This harsh environment not only weakens their trust in the surrounding environment but also amplifies the perception of safety threats, leading to negative emotions such as anxiety and tension. Based on the above analysis, the following hypothesis is proposed:
H2.
The tunnel micro-environment has a significant positive impact on the mental health of tunnel construction workers.
Survey data indicate that workers’ unsafe behavior is a direct cause of accidents. Research in the domain of mental health reveals a substantial correlation between mental health status and unsafe behavior, suggesting that a lower level of mental health is a deep underlying cause of unsafe behavior. A substantial corpus of research has confirmed that mental health exerts a significant influence on unsafe behavior in high-risk fields such as coal mining, oil, and construction. This influence manifests through various mechanisms.
In recent years, the research of several scholars has further revealed the mediating role of mental health between the work environment and behavior [36,37]. Under harsh working conditions, work resources significantly reduce burnout through the full mediating effect of mental health and fatigue. The chain mediation mechanism between mental health and fatigue deepens this association [38]. Furthermore, research has indicated that the underlying causes of unsafe behavior are multifaceted, involving a combination of factors at various levels [39]. These include the interplay of psychological and physiological factors within the individual, the organizational management and cultural environment, and the condition of the equipment itself. In the mining industry, scholars have determined that workers’ perceived behavioral control is influenced by both their own capabilities and objective conditions, including the physical work environment and environmental psychological stress. These studies indicate that the relationship between mental health and unsafe behavior is not only direct but may also exert an indirect effect through mechanisms such as environmental adaptation and physiological adjustment, as shown in Figure 2.
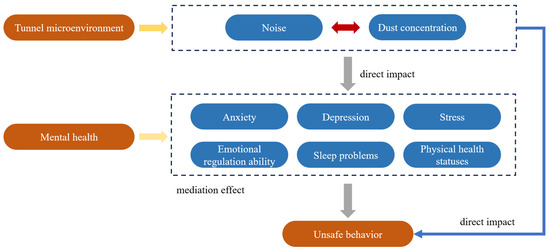
Figure 2.
Schematic diagram of the relationship model between the tunnel micro-environment, mental health, and unsafe behavior.
Many studies have looked at the direct effects of the environment on behavior and how environmental factors influence the physical and mental health of individuals. However, in the construction sector, research into the relationship between the tunnel micro-environment, mental health status, and unsafe behavior remains inadequate and requires further investigation. Especially in high-risk work environments, harsh working conditions combined with psychological tension and anxiety may exacerbate unsafe behavior [40,41,42,43]. Based on the above analysis, the following hypothesis is proposed:
H3.
Mental health plays a mediating role in the relationship between the tunnel micro-environment and unsafe behavior.
3. Research Material
3.1. Research Data
The present study is predicated on field research conducted from early 2023 to mid-2024, covering six highway tunnels (Groups 1 to 6) in four cities in China. The tunnels under scrutiny in this study were constructed using the mining method, and their geographical locations and construction characteristics are illustrated in Figure 3. The study area was selected to encompass tunnels in the southwestern mountainous regions of China, namely Yunnan, Guizhou, Sichuan, and Chongqing. These regions are considered to be representative of the complex mountain tunnels that are characteristic of China. The study area also takes into full consideration the geological and environmental characteristics of the different engineering contexts. The geology of the southwestern mountains is complex and unique, characterized by weak surrounding rocks, high ground stress, and strong unloading effects. In addition, factors such as steep terrain, inconvenient transportation, and variable climate further exacerbate the difficulty of construction organization and technical implementation. Southwestern mountain tunnels were chosen as the subject of the study not only because they are highly representative of geological and construction problems, but also because their construction risks are much higher than those in other regions, and they are “high-risk zones” where tunnel accidents occur frequently. This selection helps to reveal the interaction mechanism between construction risks, environmental impacts, and engineering design in complex mountainous geological conditions, and provides an important reference for optimizing tunnel construction techniques, reducing safety risks, and mitigating ecological impacts. To ensure the breadth and representativeness of the sample data, this study selects workers from different job types and shifts in proportion to the distribution of workers on each project to participate in the survey, covering the diversity of the construction workforce and increasing the universality of the data and applicability of the conclusions. Survey respondents are predominantly frontline workers. Frontline workers are exposed to harsh environments for longer periods of time than management and technical workers, which better reflects the impact of the tunnel micro-environment on unsafe behavior and mental health states. As some workers had limited understanding of the questions and were unable to answer all of them, part of the questionnaire was completed in the form of an interview. A total of 477 questionnaires were distributed to frontline workers and 438 valid questionnaires were collected.
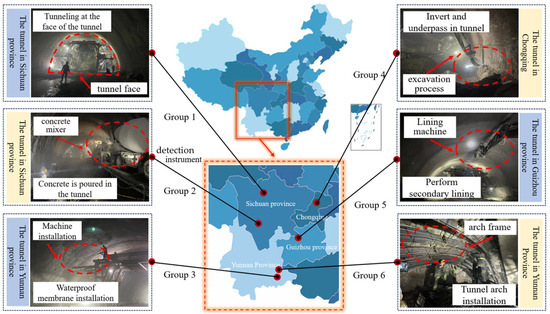
Figure 3.
Distribution of the locations of six under-construction tunnels and the survey illustration.
As shown in Figure 4, this study used data collected from questionnaires distributed to construction workers at the target tunnels. The questionnaire consists of three main sections: the basic demographic characteristics of tunnel construction workers, their mental health status, and their unsafe behavior status. Statistics on basic demographic characteristics include gender, age, marital status, years of work experience, educational level, etc. Additionally, the work characteristics of tunnel construction workers were surveyed, covering six items: daily working hours, monthly rest days, job type, work location, respiratory symptoms, and type of work process.
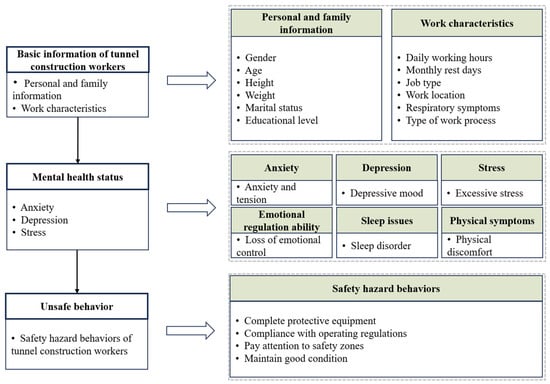
Figure 4.
Questionnaire structure design.
The second part focuses on the mental health status of tunnel construction workers. To accurately assess the psychological status of tunnel construction workers, this study used a questionnaire tool based on the DASS-21 scale. The DASS-21 scale has been validated many times and has shown high reliability and validity. It has been widely used in clinical and psychological research and has become a classic tool for assessing individual mental health [44,45,46,47,48]. We localized and revised the original questionnaire to ensure cultural adaptability and ease of understanding by refining the scale and combining it with expert opinion and the actual working environment and psychological characteristics of tunnel workers. Finally, three measurement dimensions and six measurement items covering mental states such as anxiety, depression, and stress were summarized to comprehensively capture the emotional fluctuations that respondents might experience under extreme working conditions. The six measurement items use a 5-point Likert scale, where the scores “Strongly agree, Agree, Neutral, Disagree, Strongly disagree” are assigned values of “10, 8, 6, 4, 2”, respectively [49]. The composite level of worker mental health was obtained by calculating the average score of the six questions, and the threshold distribution of mental health score is shown in Table 1.

Table 1.
Thresholds for mental health and unsafe behavior scores.
The final section aims to assess the unsafe behavior of construction workers and provide data to support tunnel safety research. The questionnaire design refers to Rafiq’s construction worker unsafe behavior questionnaire, which explores various factors influencing unsafe behaviors [50,51]. The questionnaire is rooted in behavioral safety theory and accident causation models. It comprises four questions designed to comprehensively assess typical unsafe behaviors in the workplace. These questions encompass the four dimensions of personal protection, operating norms, environmental interaction, and individual condition. The dimensions are both independent and complementary, and work together to build a comprehensive framework for investigating unsafe behavior. The four measurement items use a 5-point Likert scale, where the scores “Strongly agree, Agree, Neutral, Disagree, Strongly disagree” are assigned values of “10, 8, 6, 4, 2”, respectively. By calculating the average score of the four items, the worker’s unsafe behavior score is obtained. The thresholds for unsafe behavior scores are shown in Table 1.
3.2. Tunnel Construction Micro-Environment Data Collection
Field tests have indicated that key indicators of the tunnel micro-environment include noise and dust concentrations, which have a direct impact on the health and behavioral safety of construction personnel. This study precisely determines the noise and dust exposure of workers in different tasks under various environmental conditions by conducting detailed measurements of noise and dust data across different job types, construction stages, and work areas, and integrating the detailed information on job types, construction stages, and work locations provided in worker surveys.
During tunnel construction, high-intensity noise generated by equipment operation, blasting operations, and material handling has become an environmental risk that cannot be ignored. The measurement of noise levels was conducted through the implementation of on-site real-time monitoring, thereby ensuring the comprehensiveness and accuracy of the resulting data. The regularity of noise distribution was revealed through the conduction of detailed statistics and analysis of noise data from different types of work, construction stages, and work areas on-site.
In the work areas of tunnel construction personnel, noise levels were measured over one hour using the HIMA handheld industrial-grade noise tester AS844+ (see Figure 5). As demonstrated in Figure 5, the measured noise fluctuation during the shotcrete operation was significantly higher than that during other work stages. This phenomenon is closely related to the construction characteristics of shotcrete, particularly during high-pressure spraying, where the concrete violently collides and rubs against the tunnel lining surface, generating significant instantaneous noise peaks. The findings indicate that the noise data of the six tunnels in seven typical work areas and processes demonstrate analogous trends, thereby unveiling the shared characteristics of noise distribution under varying construction conditions. This further substantiates the substantial impact of the construction environment on noise levels, as illustrated in Figure 6. The figure indicates that the majority of the noise levels exceed 85 dB, particularly in the context of tunnel face drilling and other high-noise operations. The noise peak is observed to occur during the tunnel face drilling phase, with Group 5 demonstrating the highest noise level, exceeding 120 dB. During this phase, noise levels are known to increase significantly, a phenomenon that may be attributed to the use of heavy machinery or the intricate nature of the construction environment. With the exception of the waterproof membrane installation and mucking, the noise levels of the other processes are generally high, with almost all exceeding 85 dB.
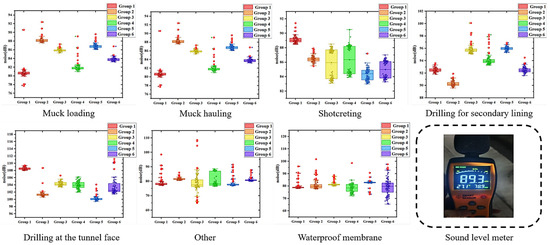
Figure 5.
Summary of one-hour noise test results inside the tunnel.
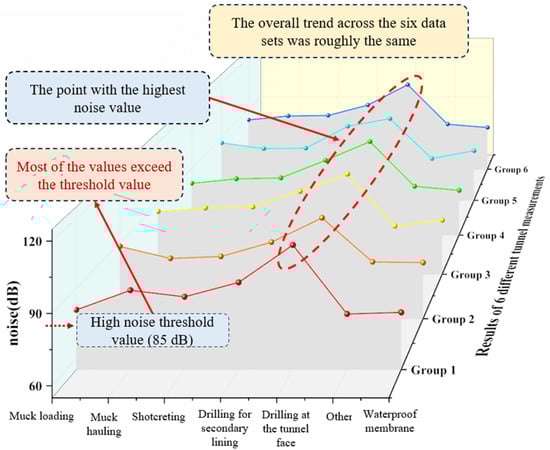
Figure 6.
Noise distribution situation.
In the experiments conducted across all groups (Group 1 to Group 6), while certain discrepancies in the specific noise values were observed, the noise distribution trends in the majority of processes demonstrated a high degree of consistency, exhibiting comparable fluctuation patterns as the processes progressed. This phenomenon indicates that, despite the variation in noise levels among the experimental groups, the process itself exerts a predominant influence on the fluctuation pattern of noise generation. During the execution of each process, the noise fluctuations exhibit regular variations associated with the operational steps. However, external factors such as the type of machinery used, the performance condition of the equipment, the progress of construction, and the on-site working environment may also lead to differences in noise discrepancies. For instance, certain groups may have used high-performance or low-noise equipment, while others may have encountered elevated noise levels due to equipment degradation or substandard maintenance practices. Additionally, the construction progress in different groups may impact the accumulation and distribution of noise, with faster construction progress potentially leading to higher dynamic pressure, thereby causing more significant noise fluctuations. Therefore, in addition to the inherent characteristics of the processes themselves, variables such as equipment configuration and construction progress also have a significant impact on the differences in noise levels. Through the categorized analysis of noise intensity across different work areas and job types, the distribution patterns of noise peaks at each construction stage were further clarified. The face of the tunnel, transportation passages, and areas with concentrated machinery show higher noise levels with greater fluctuations, whereas the noise in management and auxiliary work areas is relatively lower.
Dust concentration monitoring is chiefly reliant upon on-site measured data in conjunction with numerical simulation techniques for the purpose of modelling dust distribution, thus facilitating a more accurate evaluation of dust diffusion within the tunnel. The necessity of dust concentration simulation arises from two factors. Firstly, there are limitations to on-site measured data. Secondly, dust diffusion characteristics are complex. When combined with numerical simulation technology, this approach has the capacity to not only supplement the spatial and temporal blind spots of real measurements, but also to explore the intrinsic mechanism of dust diffusion in depth.
The present study observed the dust mass concentration under various working conditions in the tunnel through on-site testing. The definition of dust mass concentration is the mass of suspended dust per unit volume of air. The CCZ-1000 direct-reading dust concentration meter (The equipment is manufactured by Shunxin Instrument, with its production location in Changshu, China) was used in this investigation, encompassing three primary working conditions during tunnel construction: drilling, mucking, and shotcreting. The selection of test points was based on the varying stages of tunnel construction and spatial layout. Specifically, commencing from the tunnel face, measurement points were established along the tunnel cross-sectional central axis at intervals of 10 to 60 m, encompassing five key locations: the tunnel face, the air outlet, the secondary lining, the tunnel midpoint, and the tunnel entrance. The measurement points were arranged along the central axis of the tunnel cross-section and positioned at a height of 1.3 m above the roadbed. This ensured the representativeness and comparability of the data.
In order to verify the reliability and accuracy of the field test results, numerical simulations of dust concentration from the tunnel face to the portal area were conducted. These simulations were based on actual construction conditions, taking into account the spatial layout of the tunnel, airflow distribution, and dust source characteristics under different working conditions. A three-dimensional numerical model was developed using UG 12.0 software, incorporating key parameters such as tunnel cross-sectional diameter, total length, and ventilation duct distribution. Tetrahedral meshing was applied in Workbench, with refined meshing in critical areas such as ventilation duct outlets to enhance simulation accuracy. Following the importation of the model into the Fluent environment, the Realizable turbulence model was used to solve the continuous-phase airflow field. Subsequently, the Discrete Phase Model (DPM) was activated in order to simulate the motion trajectories and concentration distribution of dust particles in the airflow.
The study utilizes a comparative analysis of field measurements and numerical simulations to elucidate the variation patterns of dust concentration in the tunnel. The analysis demonstrates significant consistency in the variation patterns of dust concentration under different operating conditions. This finding indicates that, irrespective of the working conditions, the fluctuation trends and distribution patterns of dust concentration exhibit similar patterns. However, it is important to note that, despite the consistency in the variation patterns of dust concentration under different operating conditions, the differences between the actual measurement results and the simulation predictions may stem from variations in dust control measures and dust control facilities. Different construction groups may have used different types of dust control equipment or systems, resulting in varying dust concentration control effectiveness under the same operating conditions. For example, some areas may be equipped with efficient local dust control devices or automated spraying systems, which can effectively reduce dust concentration, while other areas may rely on traditional manual cleaning or inefficient dust control measures. These differences can lead to significant variations in dust concentration. Furthermore, the configuration and functionality of the ventilation system are pivotal in determining the distribution of dust concentration. Adequate ventilation conditions facilitate expeditious dust dissipation, while inadequate ventilation may result in dust accumulation within the tunnel.
As demonstrated in Figure 7, the dust concentration levels during the spraying operation are typically low with minimal variability. Conversely, during mucking, the dust concentration levels are moderate with considerable fluctuations. This suggests that the method of operation and distance are significant factors in determining dust concentration. A further notable observation is that during drilling, dust concentration levels are significantly higher, exhibiting clear fluctuations with distance. This finding indicates that dust emission during the drilling process is substantial. The longitudinal cross-section diagram of the tunnel under the drilling condition shows the distribution of dust mass concentration. The research results show that the dust mass concentration in the tunnel decreases as it extends outward from the face, but in certain areas, the dust concentration exhibits a local pattern of increasing followed by a decrease. This trend is observed within the range from the tunnel face to the secondary lining area, which belongs to the vortex zone. In the region extending from the secondary lining area to the tunnel entrance, the airflow within the tunnel enters the recirculation zone, where the wind speed gradually stabilizes. As the distance increases, the overall wind speed exhibits a decreasing trend. The dilution and dispersion of dust in this area occurs progressively.
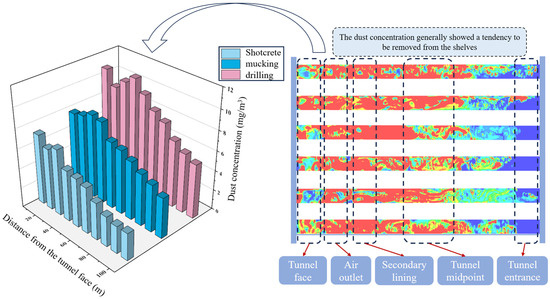
Figure 7.
Dust mass concentration distribution in the longitudinal cross-section of the tunnel under drilling conditions.
This study uses the same numerical simulation method to create a unified model for the same tunnel under different working conditions. Observations indicate that the dust concentration distribution in other working conditions (such as mucking and shotcreting) is generally consistent with that in the drilling condition. In order to streamline the expression, the dust concentration distribution diagrams for each working condition is not shown separately in this paper. The simulation results demonstrate that the spatial distribution of dust concentration is predominantly influenced by the airflow structure, wind speed variations, and construction activities within the tunnel, under different working conditions. Despite the variability in the degree of airflow disturbance across various construction stages, the dust concentration distribution characteristics remain consistent under all working conditions. This consistency can be attributed to the analogous driving mechanisms of airflow and dust dynamics.
3.3. Survey Implementation and Descriptive Statistics
A total of 477 questionnaires were distributed across six representative tunnels under construction. In order to ensure the scientific validity and reliability of the data, strict data cleaning and quality control measures were implemented. Initially, questionnaires with a high number of missing values or anomalies in responses were excluded. Case anomalies were then detected and eliminated using SPSS 27.0 software to ensure the highest possible accuracy of the data. Following the cleansing of the data, 438 questionnaires were found to be valid, with an effective response rate of 91.8%. The geographical distribution of the survey participants and the diversity of the construction environments further enhance the broad applicability of the study.
To examine the impact of tunnel construction micro-environment levels on workers’ unsafe behaviors, the study incorporates individual attribute variables into the control analysis with a view to reducing potential confounding factors. The individual attribute data are derived from the questionnaire survey, covering demographic variables such as gender, age, and years of work experience (see Table 2). The statistical results show that the sample distribution aligns with the characteristics of construction industry workers, with variables such as gender, education level, and age presenting a reasonable and representative distribution. In terms of gender distribution, the tunnel construction industry is predominantly male, with males accounting for 95.2% and females making up only 4.8%. In terms of marital status, 70.8% of the individuals are married, while 29.2% are unmarried. With regard to age distribution, the workforce involved in tunnel construction is primarily composed of individuals between the ages of 25 and 45, constituting 52.7% of the total, followed by those between 46 and 55, who account for 32%. With regard to educational attainment, it is evident that a significant proportion of construction workers (56.6%) have attained a level of education that is equivalent to junior high school or below. This finding suggests that the overall educational attainment of workers in this industry is comparatively low. In terms of working hours, 43.2% of the workers work 8 to 12 h per day, while 7.7% work more than 12 h. Workers have limited rest time, with 70.3% taking one to three days off per month. In the procedure type statistics, blasting and drilling in tunnel excavation account for 33.7% of the total workforce, the largest proportion, followed by secondary lining, arch crown, and steel frame/rebar mesh binding. These procedures are all carried out in relatively harsh working environments. In the workplace statistics, the largest number of workers are found at the tunnel face and the secondary lining area, accounting for 47.7% and 31.0%, respectively. This indicates that most tunnel workers work deep within the tunnel. With regard to health status, 10.7% of construction workers report suffering from respiratory diseases, while 89.3% do not have such conditions. Furthermore, the report indicates that 31.1% of the workers exhibit medium-risk mental health issues, while 51.8% manifest high-risk mental health issues, signifying a substantial psychological burden on tunnel construction workers. Finally, with regard to unsafe behavior, 45.9% of the workers exhibited medium-risk unsafe behaviors, while 66.7% engaged in high-risk unsafe behaviors, indicating a high frequency of unsafe behaviors among tunnel construction workers. During the course of the investigation, no instances of very high-risk mental health conditions or unsafe behaviors were observed. During the survey, no instances of extremely high-risk mental health states or unsafe behaviors were observed. This phenomenon can be attributed to the fact that when workers experience extreme mental health issues or exhibit significant unsafe behaviors, they typically become unable to continue performing normal work.
Table 2.
Descriptive statistical analysis of the study sample.
4. Data Analysis and Results
4.1. Questionnaire Reliability and Validity Testing
The present study is predicated on self-reported data from participants, a factor which may engender a risk of common method bias. In order to reduce bias, anonymity and confidentiality were emphasized during the questionnaire administration. Participants were informed that the data would only be used for scientific research, thereby minimizing interference such as the social desirability effect. Furthermore, the Harman single-factor test was conducted, and the results indicated no significant common method bias, thereby ensuring data reliability and internal validity.
Confirmatory factor analysis was conducted for mental health status and unsafe behaviors, as demonstrated in Table 3. The CR value was used as a metric to evaluate the reliability of the questionnaire, with a CR value greater than 0.600 deemed acceptable. The reliability of the questionnaire in Table 3 meets the required standards. The AVE values for all variables exceed 0.360, which is within the acceptable range, thereby indicating that the questionnaire possesses adequate convergent validity. With regard to the discriminant validity of the questionnaire, it is generally accepted that the square root of the AVE for each factor on the diagonal should exceed the correlation coefficients in its respective row and column. The data indicate that the discriminant validity of the questionnaire is good.
Table 3.
The results of reliability, convergent validity, and discriminant validity analysis.
A correlation analysis was conducted on the three latent variables using SPSS 27.0 software. The results of this analysis are shown in Table 4. As demonstrated in Table 4, a substantial correlation exists between the tunnel micro-environment, mental health status, and unsafe behaviors. In particular, a significant positive correlation was identified between the tunnel micro-environment and mental health status (correlation coefficient r = 0.362, significance probability value p < 0.01); between unsafe behaviors and mental health status (correlation coefficient r = 0.810, significance probability value p < 0.01); and between the tunnel micro-environment and unsafe behaviors (r = 0.302, p < 0.01). The correlation test results align with the preset outcomes in terms of direction.
Table 4.
Latent variable correlation analysis.
4.2. The Mediating Role of Mental Health Status
4.2.1. The Pathway of Impact of Unsafe Behavior
The present study employs the AMOS 23.0 software to construct a Structural Equation Model (SEM) and conducts a fit analysis of the predefined theoretical model. Structural equation modeling (SEM) is a collection of statistical techniques that allow a set of relationships between one or more independent variables (IVs), either continuous or discrete, and one or more dependent variables (DVs), either continuous or discrete, to be examined [52]. The specific results are shown in Table 5. As demonstrated in Table 5, the model demonstrates a satisfactory fit, with all fit indices meeting or exceeding the recommended threshold values.
Table 5.
The results of model fit indices.
The results of the structural equation model are demonstrated in Figure 8. In Figure 8, T1 and T2 represent the observed variables of the tunnel micro-environment (noise and dust concentration); M1 to M6 represent the observed variables of mental health status (anxiety, depression, stress, emotional regulation ability, sleep problems, physical condition). U1 to U4 represent the observed variables of unsafe behavior (completion of protective equipment, compliance with safety regulations, observation of safety areas, maintenance of good condition); e1 to e12 represent the residuals of each observed variable; e13 and e14 represent the measurement biases of mental health status and unsafe behavior, respectively.
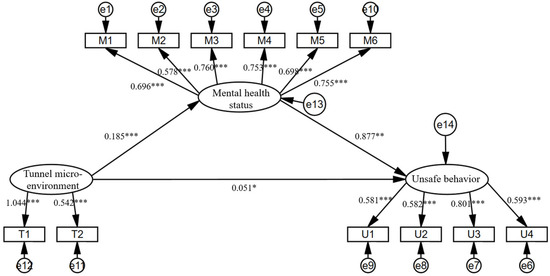
Figure 8.
Structural equation model of the relationship between the tunnel micro-environment, mental health status, and unsafe behaviors. Note: *** p < 0.001, ** p < 0.01, * p < 0.05. Similar notation applies below.
As shown in Figure 8, anxiety, depression, stress, emotional regulation ability, sleep condition, and physical condition have a significant positive impact on the mental health status of tunnel construction workers. Specifically, as illustrated in Figure 6, the standardized path coefficients of these factors are 0.696, 0.578, 0.760, 0.753, 0.698, and 0.755, respectively, and all are significant at the 1% level. This indicates that the less anxiety, depression, and stress, the stronger the emotional regulation ability, the better the sleep condition and physical health status, the better the mental health status of tunnel construction workers. As shown in Table 6, in particular, stress (0.760 ***), emotional regulation ability (0.753 ***), and physical health status (0.755 ***) have a significant impact on mental health, indicating that these factors play a crucial role in improving the mental health of tunnel construction workers. With regard to the issue of unsafe behavior, the extent to which protective equipment is worn, adherence to operational procedures, attention to safety zones, and maintenance of good physical and mental health have all been found to be significantly positively related to unsafe behavior among tunnel construction workers. As shown in Table 6, specifically, as illustrated in Figure 6, the standardized path coefficients are 0.581, 0.582, 0.801, and 0.593, all of which are significant at the 1% level. This finding suggests that the more complete the protective equipment worn by tunnel construction workers, the higher the frequency of adherence to operational procedures, the more frequent the behaviors of entering safety zones, and the better the physical and mental health, the lower the incidence of unsafe behaviors. Among these factors, the behavior of entering safety zones has the most significant impact on unsafe behaviors, with a standardized path coefficient of 0.801. This further indicates that the level of attention construction workers give to safety zones is significantly positively correlated with the reduction in unsafe behaviors. Furthermore, the tunnel micro-environment exerts a substantial positive influence on unsafe behaviors (γ = 0.051, p = 0.039). Additionally, mental health status demonstrates a significant positive impact along the pathway between the tunnel micro-environment and unsafe behaviors (γ1 = 0.185, γ2 = 0.87, P1 = 0.002, P2 < 0.001). This finding indicates that mental health status plays a significant moderating role in the process by which the tunnel micro-environment affects unsafe behaviors, thereby validating both hypotheses H1 and H2. The tunnel micro-environment has a significant impact on the unsafe behavior of tunnel construction workers. The tunnel micro-environment has a significant impact on the mental health of tunnel construction workers.
Table 6.
The standardized path coefficients and significance levels of mental health status and unsafe behavior factors.
In summary, mental health status plays a crucial role in the mechanism between the tunnel micro-environment and unsafe behaviors. Particularly, when there is no timely intervention in mental health status, it may significantly influence the behavior decisions of tunnel workers, thereby increasing the probability of unsafe behaviors. By creating a positive mental health atmosphere and implementing corresponding interventions, not only can unsafe behaviors be effectively reduced, but it can also alleviate the work stress of tunnel workers, further improving operational safety.
The theoretical hypothesis model was subjected to empirical scrutiny via the Bootstrap method. In the model verification process, 5000 resamples were computed, and a 95% confidence interval was established. The outcomes of this investigation demonstrated that the confidence intervals for all estimated parameters did not include zero, and the estimates were significant, indicating the robustness and reliability of the mediating effect. As demonstrated in Table 7, the unstandardized mediating effect estimate of mental health status in the path from the tunnel micro-environment to unsafe behavior is 0.162, with a confidence interval of [0.041, 0.305]. The correlation test was found to be significant, thereby clearly indicating that mental health status plays a significant mediating role in this particular path.
Table 7.
Mediating effect analysis of mental health status.
4.2.2. Analysis of the Influence Relationship Between Mental Health, Tunnel Micro-Environment, and Unsafe Behavior
In order to more accurately explore the underlying mechanism of the influence of the tunnel micro-environment on unsafe behavior with mental health status as a mediator, this section uses Model 4 of the Process program in SPSS to test the mediation effect, and applies the Bootstrap method proposed by Hayes to validate the mediating role of mental health status between the tunnel micro-environment and unsafe behavior, thereby supplementing the mediation effect verification from AMOS. This analytical method effectively examines the causal relationships between variables and provides more precise statistical evidence for understanding their interactions.
As demonstrated in Figure 9, the path coefficient of mental health status between the tunnel micro-environment and unsafe behavior indicates that the tunnel micro-environment exerts a significant impact on unsafe behavior through mental health status. Specifically, the results in Table 8 demonstrate that the tunnel micro-environment exerts a direct effect on unsafe behavior, as well as an indirect effect through mental health status. The presence of this mediating effect is further supported by the fact that none of the upper or lower bounds of the 95% confidence intervals validated by the Bootstrap method contain zero.
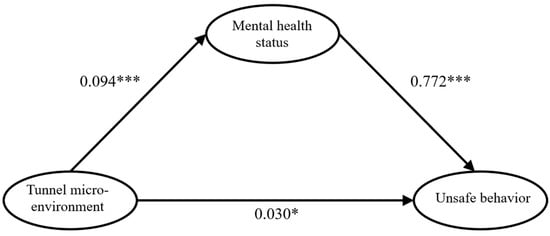
Figure 9.
Path coefficient diagram of the tunnel micro-environment, mental health status, and unsafe behaviors. Note: *** p < 0.001, * p < 0.05. Similar notation applies below.
Table 8.
Decomposition of total effects, direct effects, and mediating effects.
With regard to the distribution of effect size, the direct effect is 0.030, accounting for 29.13% of the total effect, while the mediating effect is 0.073, accounting for 70.87% of the total effect. This finding suggests that mental health status may act as a significant mediating factor between the tunnel micro-environment and unsafe behavior. The proportion of the indirect effect is significantly higher than the direct effect, highlighting the critical bridging role of mental health status in this process.
Based on the results of the structural equation model and correlation analysis, this study provides strong empirical support for Hypothesis H3, confirming the indirect impact of the tunnel micro-environment on unsafe behaviors through mental health status. The analysis results indicate that mental health plays a significant mediating role in this causal pathway, thereby revealing the underlying mechanism through which the tunnel micro-environment affects unsafe behaviors. Further testing of the mediating effect confirmed the importance of mental health status as a key mediating variable and provided empirical evidence for understanding the potential impact path of the tunnel micro-environment on workers’ behaviors.
4.3. Determination of Micro-Environment Parameter Thresholds
4.3.1. Relationship Between Micro-Environment Parameters, Mental Health, and Unsafe Behavior
A linear function is used to fit the relationship between noise, dust concentration parameters, mental health, and unsafe behavior. The fitting equations are shown in Equations (1)–(4).
In Equations (1)–(4), SM represents the average mental health score at different noise and dust concentration levels; SU represents the average unsafe behavior score at different noise and dust concentration levels; NVH is the noise level in dB; DC is the dust concentration in mg/m3.
Figure 10 illustrates the relationship between noise parameters and the mental health as well as unsafe behaviors of tunnel construction workers. The present study used statistical analysis to systematically analyze the impact of noise on workers’ mental health and unsafe behaviors. The analysis was conducted on data from seven different locations across six tunnels. Specifically, noise level is used as the independent variable (x-axis), while the average mental health scores and unsafe behavior scores of individuals at the same noise level are used as the dependent variables (y-axis). Following the integration of the dataset, a total of 42 data points were compiled, encompassing the mental health and unsafe behavior of tunnel construction workers under varying noise exposure conditions.
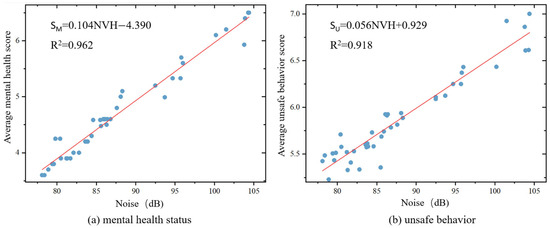
Figure 10.
The relationship between noise parameters and the mental health and unsafe behaviors of tunnel construction workers. Note: R2 represents the coefficient of determination. The closer its value is to 1, the better the data fit. Similar notation applies below.
Figure 11 illustrates the relationship between dust concentration and the mental health as well as unsafe behaviors of tunnel construction workers. The present study used statistical analysis to systematically analyze the impact of dust concentration on workers’ mental health and unsafe behaviors. The analysis was conducted on data from ten different locations across six tunnels. Specifically, the dust concentration is used as the independent variable (x-axis), while the average mental health scores and unsafe behavior scores of individuals at the same dust concentration level are used as the dependent variables (y-axis). Following the integration of the dataset, a total of 60 data points were compiled, encompassing the mental health and unsafe behavior of tunnel construction workers under varying dust concentration conditions.
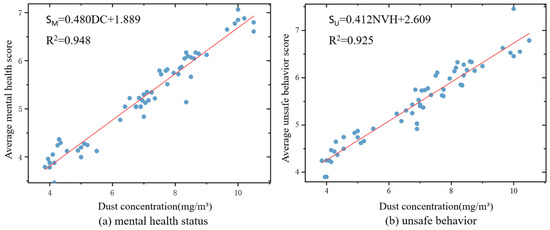
Figure 11.
The relationship between dust concentration parameters and the mental health and unsafe behavior of tunnel construction workers.
At the same levels of noise and dust concentration, individual workers may demonstrate substantial variations in mental health scores and unsafe behavior scores, resulting in considerable data dispersion. This dispersion complicates the intuitive presentation of the regular relationships between noise and dust concentration levels and mental health and unsafe behavior, thereby increasing the complexity of data interpretation. Therefore, to more clearly reveal the overall impact trend of noise on mental health status and unsafe behavior, the average score is used as the dependent variable. Extracting data characteristics at the group level helps reduce the interference of individual differences in the analysis results, enhancing the stability and interpretability of the findings.
As shown in Figure 10a, the average mental health score of tunnel construction workers exhibits a linear relationship with the noise parameters. Different construction groups may have used different equipment configurations and construction progress variables, leading to variations in noise levels under the same working conditions, resulting in differing noise levels. For every 1 dB increase in tunnel construction noise, the average mental health score of tunnel construction workers increases by 0.104. As shown in Figure 10b, the average unsafe behavior score of tunnel construction workers is linearly related to the noise parameter. When the tunnel construction noise increases by 1 decibel, the average unsafe behavior score of tunnel construction workers increases by 0.056. As shown in Figure 11a, the average mental health score of tunnel construction workers exhibits a linear relationship with the dust concentration parameter. Different construction groups may have used different types of dust control equipment or systems, leading to variations in dust concentration control effectiveness under the same working conditions, which is also a reason for the differing dust concentrations. When the dust concentration in tunnel construction increases by 1 mg/m3, the average mental health score of tunnel construction workers increases by 0.240. As shown in Figure 11b, the average unsafe behavior score of tunnel construction workers is linearly related to the dust concentration parameter. When the dust concentration in tunnel construction increases by 1 mg/m3, the average unsafe behavior score of tunnel construction workers increases by 0.206.
4.3.2. Tunnel Micro-Environment Classification Based on the Mathematical Programming Method
The present study employs workers’ mental health scores and unsafe behavior scores as decision variables, with noise and dust concentration parameters designated as objective functions. The classification of mental health and unsafe behavior scores, along with their parameter ranges, is based on the grading standards provided in Table 2. First, based on the interaction between the mental health and unsafe behavior scores of tunnel workers and the noise and dust concentration, the classification levels of each variable at different thresholds and their corresponding parameter ranges were determined. According to the findings of the previous section, there is a close continuous relationship between the minimum value of each level of mental health and unsafe behavior scores and the maximum value of the previous level. Therefore, this study determines the range of parameters for each level by solving for the maximum value of each level and combining it with the maximum value of the previous level. In conclusion, the objective function for obtaining the optimal results under each noise and dust concentration parameter threshold in this study is .
The mathematical programming method dictates that the objective function and constraints must be calculated in order to determine the threshold values of noise and dust concentration parameters. These parameters are classified according to the following risk thresholds: no risk, low risk, medium risk, high risk, and very high risk for mental health and unsafe behavior scores. The mathematical programming equations required for this calculation can be found in Table 9. The ranges of noise and dust concentration parameters under five levels of no risk, low risk, medium risk, high risk, and very high risk were solved as shown in Table 10.
Table 9.
Objective functions and constraints for noise and dust concentration parameters.
Table 10.
Classification of noise and dust concentration environmental thresholds.
The determination of these parameter ranges is based on the quantitative analysis of mental health status and unsafe behavior performance at different risk levels. Through the linear functions constructed in Equations (1)–(4), we are able to precisely quantify the relationship between environmental factors and mental health as well as behavioral risk levels, thus providing a scientific basis for risk management and intervention measures. This threshold delineation not only reflects the direct impact of environmental factors, but also takes into account the interaction between mental health and unsafe behaviors, thereby providing a more refined and precise reference standard for environmental monitoring and safety prevention and control on construction sites.
It is acknowledged that the tunnel construction environment is unique, and as such, the standards proposed in this study deviate to a certain extent from the existing classification standards for construction noise and dust concentration in China. According to the “Highway Tunnel Construction Technical Specifications” and the “Green Construction Implementation and Evaluation Standards for Construction Projects”, the noise limit for an 8 h work period is 85 decibels, which falls under the medium-risk level in Table 9; the dust concentration limit is 8 mg/m3, classified as a high-risk zone. The national standard should be at the medium-risk level or lower. Among them, the noise limit meets the requirements, but the dust concentration remains in the high-risk category. In comparison with the standard proposed in this study, the national standards are comparatively lenient. The risk classification system proposed in this study is more stringent and further refines the risk levels. This adjustment is based on an in-depth analysis and field survey of the tunnel construction environment. The results indicate that in tunnel construction, the dust concentration level should be monitored at all times, and the dust concentration should be controlled within the safe threshold through optimizing ventilation, arranging construction progress reasonably, and physically reducing dust.
5. Conclusions
This study systematically evaluates the impact of the tunnel micro-environment on the unsafe behaviors of construction workers, with a particular focus on their behavioral performance under high physiological load and psychological stress. The study elucidates the manner in which internal micro-environmental factors present within tunnels (such as noise and dust concentration) exert influence upon the mental health of workers and the adoption of unsafe behaviors, via a multitude of pathways. This study comprehensively explores the complex relationship between the tunnel micro-environment, mental health status, and unsafe behavior through correlation analysis and mediation effect testing.
The main findings include the following:
The present study demonstrates a significant positive correlation between adverse micro-environmental conditions and the mental health status of construction workers (p < 0.01). The direct effect of micro-environmental factors on unsafe behaviors was found to be significant, especially in high noise and dust concentration environments, where workers’ unsafe behaviors increased significantly (p < 0.01). In addition, mental health status plays a partial mediating role between the tunnel micro-environment and unsafe behavior, indicating that the micro-environment not only directly affects unsafe behavior but also exacerbates mental health issues, further amplifying behavioral risks.
This study further determined the environmental threshold divisions for noise and dust concentration at different risk levels. These environmental parameter thresholds have a significant predictive effect on mental health status and unsafe behavior at different risk levels. The environmental thresholds for noise and dust concentration under no risk, low risk, moderate risk, high risk, and very high risk states are listed.
In conclusion, the research findings provide important theoretical basis and practical guidance for improving tunnel construction environments, optimizing workers’ mental health interventions, and enhancing construction safety. However, the study also has some limitations. Firstly, the survey period was relatively brief, and the sample size was limited, which may have resulted in the research findings not fully reflecting dynamic changes across different construction stages or in complex tunnel environments. It is particularly pertinent to note that under protracted construction conditions, the impact of environmental variables on the mental health and behavior of construction workers may manifest itself in a delayed manner. In addition, the limited personal background, geographic sample range, and the selection of tunnel construction micro-environment variables may affect the generalizability of the research findings. It is recommended that subsequent studies extend the temporal and geographical extent of data collection, incorporating a more diverse array of construction contexts to enhance the representativeness and applicability of the research.
Author Contributions
H.S.: conceptualization, investigation, data curation, writing, funding acquisition. S.Z.: review, validation, writing. Y.J.: investigation, validation. X.N.: investigation, supervision. M.K.: literature review, investigation. Z.L.: data curation. All authors have read and agreed to the published version of the manuscript.
Funding
This work was supported by the Natural Science Basic Research Program of Shaanxi Province, China: Study on the Impact of Micro-environment in Large-Section Tunnel Drilling and Blasting Construction on Workers’ Physical and Mental Health and Behavior (grant number 2024JC-YBQN-0519).
Institutional Review Board Statement
The studies were approved by the Institutional Review Board of the College of Urban and Environmental Sciences, Northwest University (NWU208032200012 2023-05-07).
Informed Consent Statement
Informed consent was obtained from all subjects involved in the study. All participants in the study provided their informed consent.
Data Availability Statement
If requested, the corresponding author can make the data presented in this study available.
Acknowledgments
We would like to appreciate all valuable and helpful comments from editor and reviewers.
Conflicts of Interest
The authors have no conflicts of interest to declare.
References
- Peckham, T.K.; Baker, M.G.; Camp, J.E.; Kaufman, J.D.; Seixas, N.S. Creating a future for occupational health. Ann. Work Expo. Health 2017, 61, 3–15. [Google Scholar] [CrossRef] [PubMed]
- Harrison, J.; Dawson, L. Occupational health: Meeting the challenges of the next 20 years. Saf. Health Work 2016, 7, 143–149. [Google Scholar] [CrossRef] [PubMed]
- Sinclair, R.R.; Allen, T.; Barber, L.; Bergman, M.; Britt, T.; Butler, A.; Ford, M.; Hammer, L.; Kath, L.; Probst, T.; et al. Occupational health science in the time of COVID-19: Now more than ever. Occup. Health Sci. 2020, 4, 1–22. [Google Scholar] [CrossRef] [PubMed]
- Montano, D.; Reeske, A.; Franke, F.; Hüffmeier, J. Leadership, followers’ mental health and job performance in organizations: A comprehensive meta-analysis from an occupational health perspective. J. Organ. Behav. 2017, 38, 327–350. [Google Scholar] [CrossRef]
- Giorgi, G.; Lecca, L.I.; Alessio, F.; Finstad, G.L.; Bondanini, G.; Lulli, L.G.; Arcangeli, G.; Mucci, N. COVID-19-related mental health effects in the workplace: A narrative review. Int. J. Environ. Res. Public Health 2020, 17, 7857. [Google Scholar] [CrossRef]
- Liu, Q.; Nie, W.; Hua, Y.; Peng, H.; Liu, C.; Wei, C. Research on tunnel ventilation systems: Dust diffusion and pollution behaviour by air curtains based on CFD technology and field measurement. Build. Environ. 2019, 147, 444–460. [Google Scholar] [CrossRef]
- Liu, C.; Nie, W.; Bao, Q.; Liu, Q.; Wei, C.; Hua, Y. The effects of the pressure outlet’s position on the diffusion and pollution of dust in tunnel using a shield tunneling machine. Energy Build. 2018, 176, 232–245. [Google Scholar] [CrossRef]
- Zou, C.; Wang, Y.; Wang, P.; Guo, J. Measurement of ground and nearby building vibration and noise induced by trains in a metro depot. Sci. Total Environ. 2015, 536, 761–773. [Google Scholar] [CrossRef]
- Lee, S.C.; Kim, J.H.; Hong, J.Y. Characterizing perceived aspects of adverse impact of noise on construction managers on construction sites. Build. Environ. 2019, 152, 17–27. [Google Scholar] [CrossRef]
- Khosravi, Y.; Asilian-Mahabadi, H.; Hajizadeh, E.; Hassanzadeh-Rangi, N.; Bastani, H.; Behzadan, A.H. Factors influencing unsafe behaviors and accidents on construction sites: A review. Int. J. Occup. Saf. Ergon. 2014, 20, 111–125. [Google Scholar] [CrossRef]
- Entwistle, J.A.; Hursthouse, A.S.; Marinho Reis, P.A.; Stewart, A.G. Metalliferous mine dust: Human health impacts and the potential determinants of disease in mining communities. Curr. Pollut. Rep. 2019, 5, 67–83. [Google Scholar] [CrossRef]
- Themann, C.L.; Masterson, E.A. Occupational noise exposure: A review of its effects, epidemiology, and impact with recommendations for reducing its burden. J. Acoust. Soc. Am. 2019, 146, 3879–3905. [Google Scholar] [CrossRef] [PubMed]
- Zhang, L.; Zhou, S.; Guan, M.; Chen, F. Nonlinear effects of bus micro-environments on passengers’ comfort. Prog. Geogr. 2021, 40, 967–979. (In Chinese) [Google Scholar] [CrossRef]
- You, B.; Liu, J.; Shi, S.; Liu, H.; Lu, Y.; Zhang, M. Experimental study on influence of harsh environment of deep well on safety human factor indexes. China Saf. Sci. J. 2020, 30, 52–61. [Google Scholar]
- Qiu, L.; Qi, Y.; Gao, T. Review on Effects of Natural Environment on the Well-being of Urban Residents via Visual-Audio-Olfactory Perception Interaction Experience. Chin. Landsc. Archit. 2023, 39, 29–35. [Google Scholar]
- Chen, X.; Guo, C.; Song, J.; Wang, X.; Cheng, J. Occupational health risk assessment based on actual dust exposure in a tunnel construction adopting roadheader in Chongqing, China. Build. Environ. 2019, 165, 106415. [Google Scholar] [CrossRef]
- Hong, J.; Choi, J.; Lee, J.; Cho, S.; Hong, T.; Han, S.; Park, H.; Lee, D.E. Virtual reality-based analysis of the effect of construction noise exposure on masonry work productivity. Autom. Constr. 2023, 150, 104844. [Google Scholar] [CrossRef]
- Shi, H.; Sun, H.; Jiang, Y.; Zhang, S.; Zhang, X.; Nie, X. Ecological Characteristics and Occupational Health Effects of Deep Mines in China: A Review. Pol. J. Environ. Stud. 2024, 33, 2515–2525. [Google Scholar] [CrossRef]
- Dai, L.; Jia, C.; Shi, C.; Lei, M.; Zheng, Y. Classification of High Geothermal Temperature Tunnel Humidity and Heat Environment Based on Physiologic Parameters of Workers. Tunn. Constr. 2024, 44, 1251–1261. [Google Scholar]
- Stanaway, J.D.; Afshin, A.; Gakidou, E.; Lim, S.S.; Abate, D.; Abate, K.H.; Bleyer, A. Global, regional, and national comparative risk assessment of 84 behavioural, environmental and occupational, and metabolic risks or clusters of risks for 195 countries and territories, 1990–2017: A systematic analysis for the Global Burden of Disease Study 2017. Lancet 2018, 392, 1923–1994. [Google Scholar] [CrossRef]
- Wong, B.B.M.; Candolin, U. Behavioral responses to changing environments. Behav. Ecol. 2015, 26, 665–673. [Google Scholar] [CrossRef]
- Ferreira, L. Problemas de Dinâmica de Grupo. 1970. Available online: https://www.jstor.org/stable/27666139 (accessed on 20 November 2024).
- Zhu, Y.; Heng, L.; He, G.; Gao, L. Analysis on Action Effect of the Influencing Factors of Unsafe Behavior of Coal Mine Employees. Min. Saf. Amp; Environ. Prot. 2019, 46, 104–108. (In Chinese) [Google Scholar]
- Tong, R.; Yang, Y.; Ma, X.; Zhang, Y.; Li, S.; Yang, H. Risk assessment of Miners’ unsafe behaviors: A case study of gas explosion accidents in coal mine, china. Int. J. Environ. Res. Public Health 2019, 16, 1765. [Google Scholar] [CrossRef] [PubMed]
- Dodoo, J.E.; Al-Samarraie, H. Factors leading to unsafe behavior in the twenty first century workplace: A review. Manag. Rev. Q. 2019, 69, 391–414. [Google Scholar] [CrossRef]
- Man, S.S.; Chan, A.H.S.; Alabdulkarim, S.; Zhang, T. The effect of personal and organizational factors on the risk-taking behavior of Hong Kong construction workers. Saf. Sci. 2021, 136, 105155. [Google Scholar] [CrossRef]
- Li, Q.; Zhang, D.; Zhang, J. Study on the influence of individual characteristics and environment on unsafe behavior of construction workers. Proj. Manag. Technol. 2023, 21, 147–154. (In Chinese) [Google Scholar]
- Ye, G.; Yang, L.; Wang, Y.; Wei, Y.; Fu, Y. Review on the influence paths of unsafe behavior of construction workers. J. Chongqing Univ. 2020, 43, 111–120. [Google Scholar]
- Gifford, R. Environmental psychology matters. Annu. Rev. Psychol. 2014, 65, 541–579. [Google Scholar] [CrossRef]
- Deckers, L. Motivation: Biological, psychological, and environmental. Routledge 2018. [CrossRef]
- Ye, Y.; Zang, Z. Impact of underground environmental factors on spot personnel behavior. Nonferrous Met. 2001, 53, 6–9. (In Chinese) [Google Scholar]
- Jiang, B. Urban Natural Landscape and Citizens’ Mental Health: Key Issues. Landsc. Archit. 2020, 27, 17–23. [Google Scholar]
- Bazrafshan, M.; Spielhofer, R.; Hayek, U.W.; Kienast, F.; Grêt-Regamey, A. Greater place attachment to urban parks enhances relaxation: Examining affective and cognitive responses of locals and bi-cultural migrants to virtual park visits. Landsc. Urban Plan. 2023, 232, 104650. [Google Scholar] [CrossRef]
- Zhu, J.; Wang, X.; Yang, L.; Qin, Z.; Geng, J.; Zhang, X. Research on the construction of a comprehensive evaluation model of psychological factors in coal mine workers’ safety: Investigation and analysis of 1,500 miners in east China. Front. Public Health 2022, 10, 849733. [Google Scholar] [CrossRef] [PubMed]
- Bi, Z.; Zu, H. Risky psychology and influencing factors of coalmine workers. Miner. Eng. Res. 2009, 24, 74–78. (In Chinese) [Google Scholar]
- Liu, L.; Wen, F.; Xu, X.; Wang, L. Effective resources for improving mental health among Chinese underground coal miners: Perceived organizational support and psychological capital. J. Occup. Health 2015, 57, 58–68. [Google Scholar] [CrossRef]
- Zhou, M.; Li, W.; Mei, X. The relationship between coal miners’ job resources and job burnout:the mediating effects of psychological capital and fatigue. China Coal 2018, 44, 23–27. [Google Scholar]
- Li, Y.; Zhao, Z.; Tian, S.; Yu, J. Review of research on unsafe behavior of miners. J. Saf. Sci. Technol. 2016, 12, 47–54. [Google Scholar] [CrossRef]
- Zhang, J.; Wu, Y.; Guo, J.; Ju, C.; Hao, Y. Influence mechanism of the coal mine environment on the miners’ individual behaviors. J. Saf. Environ. 2021, 21, 649–655. [Google Scholar]
- Lee, J.K.; Jang, J.; Chang, S.I.; Lee, S.I. Annoyance modeling using personal and situational variables for construction site noise in urban areas. Appl. Acoust. 2021, 182, 108256. [Google Scholar] [CrossRef]
- Lee, S.C.; Hong, J.Y.; Jeon, J.Y. Effects of acoustic characteristics of combined construction noise on annoyance. Build. Environ. 2015, 92, 657–667. [Google Scholar] [CrossRef]
- Liu, Y.; Xia, B.; Cui, C.; Skitmore, M. Community response to construction noise in three central cities of Zhejiang province, China. Environ. Pollut. 2017, 230, 1009–1017. [Google Scholar] [CrossRef] [PubMed]
- Celik, S. The effects of climate change on human behaviors. In Environment, Climate, Plant and Vegetation Growth; Springer: Berlin/Heidelberg, Germany, 2020; pp. 577–589. [Google Scholar] [CrossRef]
- Henry, J.D.; Crawford, J.R. The short-form version of the Depression Anxiety Stress Scales (DASS-21): Construct validity and normative data in a large non-clinical sample. Br. J. Clin. Psychol. 2005, 44, 227–239. [Google Scholar] [CrossRef] [PubMed]
- Vignola, R.C.B.; Tucci, A.M. Adaptation and validation of the depression, anxiety and stress scale (DASS) to Brazilian Portuguese. J. Affect. Disord. 2014, 155, 104–109. [Google Scholar] [CrossRef] [PubMed]
- Hao, F.; Tan, W.; Jiang, L.I.; Zhang, L.; Zhao, X.; Zou, Y.; Hu, Y.; Luo, X.; Jiang, X.; McIntyre, R.; et al. Do psychiatric patients experience more psychiatric symptoms during COVID-19 pandemic and lockdown? A case-control study with service and research implications for immunopsychiatry. Brain Behav. Immun. 2020, 87, 100–106. [Google Scholar] [CrossRef]
- Wang, K.; Shi, H.S.; Geng, F.L.; Zou, L.Q.; Tan, S.P.; Wang, Y.; David, L.N.; David, H.K.S.; Chan, R.C. Cross-cultural validation of the depression anxiety stress scalecale0-1China. Psychol. Assess. 2016, 28, e88. [Google Scholar] [CrossRef]
- Oei, T.P.; Sawang, S.; Goh, Y.W.; Mukhtar, F. Using the depression anxiety stress scale 21 (DASS-21) across cultures. Int. J. Psychol. 2013, 48, 1018–1029. [Google Scholar] [CrossRef]
- Joshi, A.; Kale, S.; Chandel, S.; Pal, D.K. Likert scale: Explored and explained. Br. J. Appl. Sci. Technol. 2015, 7, 396–403. [Google Scholar] [CrossRef]
- Choudhry, R.M.; Dongping, F. Why operatives engage in unsafe work behavior: Investigating factors on construction sites. Saf. Sci. 2008, 46, 566–584. [Google Scholar] [CrossRef]
- Asilian-Mahabadi, H.; Khosravi, Y.; Hassanzadeh-Rangi, N.; Hajizadeh, E.; Behzadan, A.H. Factors affecting unsafe behavior in construction projects: Development and validation of a new questionnaire. Int. J. Occup. Saf. Ergon. 2020, 26, 219–226. [Google Scholar] [CrossRef]
- Ullman, J.B.; Bentler, P.M. Structural equation modeling. In Handbook of Psychology, 2nd ed.; John Wiley & Sons: Hoboken, NJ, USA, 2012. [Google Scholar]
Disclaimer/Publisher’s Note: The statements, opinions and data contained in all publications are solely those of the individual author(s) and contributor(s) and not of MDPI and/or the editor(s). MDPI and/or the editor(s) disclaim responsibility for any injury to people or property resulting from any ideas, methods, instructions or products referred to in the content. |
© 2025 by the authors. Licensee MDPI, Basel, Switzerland. This article is an open access article distributed under the terms and conditions of the Creative Commons Attribution (CC BY) license (https://creativecommons.org/licenses/by/4.0/).