Article

Can Food Waste Policies Promote Sustainability?: Relationships of Food Date Label Policies with Food Waste and Safety Outcomes

1
The MITRE Corporation, 7515 Colshire Drive, McLean, VA 22102, USA
2
Food Law and Policy Clinic, The Harvard Law School, 1585 Massachusetts Avenue, Cambridge, MA 02138, USA
*
Author to whom correspondence should be addressed.
Sustainability 2025, 17(6), 2630; https://doi.org/10.3390/su17062630
Submission received: 6 November 2024 / Revised: 9 January 2025 / Accepted: 10 January 2025 / Published: 17 March 2025

Abstract

:
Food waste is a major contributor to climate change and a barrier to environmental sustainability. As such, reducing food waste is estimated to be one of the most promising strategies to reverse global warming. One way to address food waste is to implement effective policies, which requires an understanding of the impact of current policies on food waste and other relevant outcomes. The current study examined the impact of United States (U.S.) states’ date label policies on food waste and foodborne illness. We found that states with more date label restrictions had greater waste, but this effect was not significant. In addition, date label restrictions and foodborne illness were not related. This shows that current date label policies do not help to reduce food waste or improve public health. In other words, current U.S. state food waste policies do not promote sustainability. We discuss the implications for date label policy content and offer future research directions.

1. Introduction

On 26 August 2024, The United Nations and the World Meteorological Organization issued an SOS to the world regarding a worsening sea level rise due to the warming Earth and melting ice sheets and glaciers. (See, for example: https://www.reuters.com/business/environment/un-chief-issues-sos-pacific-islands-worst-hit-by-warming-ocean-2024-08-26/; accessed on 23 December 2024). As with the rising sea levels, the heatwaves, wildfires, droughts, and floods that appear in the headlines every day are mostly due to climate change. One of the major causes of climate change is food waste, contributing up to 10% of all greenhouse gas emissions; 14% of all water use; 18% of all cropland use; and 24% of all landfill content [1,2,3,4,5,6,7]. Indeed, reducing food waste is considered one of the top three strategies to reverse climate change [8]. If 50% of food waste is reduced by 2050, 26.2 gigatons of carbon dioxide emissions would be avoided. This is in large part because of the methane emissions caused by food waste in landfills; recent data from the United States (U.S.) Environmental Protection Agency (EPA) found that 58% of landfill methane emissions in the U.S. are caused by food waste [9]. Accordingly, many countries have pledged to halve per capita food waste at the retail and consumer levels (in addition to reducing food losses in production) by 2030, acknowledging food waste as a major barrier to the sustainability of the planet [10].
In the U.S., where approximately 35% of edible food is wasted [11], a commonly discussed barrier to preventing retail and consumer food waste is date label policies that guide food manufacturers on the content of labels appearing on food packaging [12,13,14]. This is especially important, as nearly half of U.S. food waste is estimated to occur at the household level (ReFED/2023 Data; published in November 2024; https://refed.org/food-waste/the-problem?gad_source=1&gclid=Cj0KCQiAvbm7BhC5ARIsAFjwNHug6AjwoxvmyQ5gWf1R-oS3OXsdtr-hclMng59StA6w3YBK6bus1b0aAqa6EALw_wcB; accessed on 27 December 2024). Due to a lack of clear and consistent policies nationally, there is much variation in the content of date labels appearing on food packaging (see Figure 1 as an example). As a result, there is much confusion about what date labels convey [12,13,15,16,17,18,19,20,21,22]. This confusion is unfortunate because, based on a recent nationally representative survey [23], more than half of U.S. households are influenced by date labels when they are deciding to purchase food items, and about one third of households discard food that has passed its date label. Although most date labels are associated with the peak quality, rather than the safety, of the food (e.g., “Best if used by”, [24]), the confusion around the meaning of date labels can lead consumers to discard safe, wholesome, and edible food they mistakenly think is no longer good to consume [18,20,21,25,26,27]. In addition, policies that restrict the sale or donation of food past its label date may cause otherwise safe and edible food to be wasted.
Our paper presents an empirical test of these claims by examining the relationships between U.S. states’ food date label policies and food waste and safety outcomes. A better understanding of the impact of date label policies on waste and safety outcomes can potentially influence policymaking and education efforts to prevent food waste.

1.1. The Need for a Focus on State Date Label Policies

One-third of U.S. consumers incorrectly believe that date labels are federally regulated [13]. In reality, the federal government does not exercise its broad authority to regulate labeling on food products in any significant or consistent manner [12,13,16]. Congress has delegated general authority to regulate food labels to the U.S. Food and Drug Administration (FDA) and the U.S. Department of Agriculture (USDA), but it has not explicitly mandated that any agency regulate date labeling on foods [12]. The FDA and the USDA have created few rules related to date labeling [14]. For food products under their purview (the FDA regulates all foods offered for sale except meat, poultry, certain processed egg products, and catfish), the FDA leaves date labeling to the discretion of manufacturers [12], only requiring the wording “Use by” on infant formula as an indicator that it will retain its nutrient content until that date (21 C.F.R. § 107.20(c)) and recommending the wording “Best if used by” as an indicator of quality [28].
The USDA similarly does not require date labels on products it regulates (e.g., meat and poultry) but does have technical guidance addressing how dates should be displayed if they are employed voluntarily or according to state law. The regulations state that if a producer chooses to place a date on the package, the date must be preceded with ““packing” date, “sell by” date, or “use before” date, with or without a further qualifying phrase, e.g., “For Maximum Freshness” or “For Best Quality”.” (9 C.F.R. § 317.8 (b)(32)). More recently, the USDA issued industry guidance suggesting that manufacturers use the term “Best if used by” if the label is meant to indicate quality. The term is recommended but not required, such that industry can choose whether to use the standard label or not [16]. In fact, in more than half of the states, the USDA standard “Best if used by” language is not allowed due to state law [16].
In the absence of overarching federal food date label regulation—and, as evidenced above, in direct contradiction with federal recommendations—most states maintain state-level requirements for date labels [13,16]. These state laws generally address three main topics: (1) whether date labels are required and, if so, on what foods, (2) whether the sale and/or donation of food are restricted past the date on the food label, and (3) what terminology and appearance date labels should have [16]. Some states have no date label regulations, giving manufacturers and retailers free reign over date labeling, aside from the few federal requirements noted above [12] (the states that had not enacted date label policies as of our study were Idaho, Missouri, Nebraska, New York, South Dakota, and Utah). Even in states that require date labels on food, there are no clear standards as to what labels should be used for safety versus quality (with the exception of California, detailed in the subsequent section).
This landscape of federal and state policies surrounding date labels is extremely confusing for individual consumers and manufacturers as it fails to provide sufficient and clear guidance for when food is and is not good or safe to consume. This regulatory patchwork is a likely contributor to food waste, and, in the next section, we discuss specific relationships that should be evaluated.

1.2. The Impact of State Date Label Policies on Food Waste and Safety Outcomes

It has been purported that the aforementioned patchwork of regulations regarding food date labels creates confusion amongst consumers, manufacturers, and even health officials, and, in turn, contributes to food waste [12,29]. Although there is prior work demonstrating the confusion around meanings of date labels and reported food discards (e.g., [17]), there is little empirical evidence examining how date label policies impact consumer choices surrounding purchasing and discarding food products [12]. One notable exception is a recent study reporting that New York City’s elimination of a 9-day sell-by restriction for pasteurized milk products in 2010 reduced food waste by more than 10% [30].
Therefore, in the present study, we drew from research on consumer perceptions of date labels to build our hypotheses about the relationships between date label policies and outcomes. Our rationale is that the impacts of date labels occur mostly at the household and consumer level, and most food loss and waste in the developed world results from household consumption habits [15,31,32,33,34,35,36,37,38,39].

1.2.1. Date Label Policies and Food Waste

As noted earlier, the U.S. federal government has not yet enacted a standard food date label policy pertaining to the quality or safety of food at a given date. Consequently, many states have their own date label policies with a variety of allowable phrases (e.g., Figure 1) and for a variety of food types. As consumers see a variety of dates on their products, they are not able to distinguish between those dates that relate to safety and those that are merely indicators of freshness, thus throwing away food that is still good to eat. For example, Aitken et al. [23] found that about one third of U.S. households often or always throw away food that has passed its date label, and households who often or always throw away food that has passed its date label waste over twice as much food per week (8.9 cups) as those who never or rarely throw away past-date food (4 cups). Accordingly, we hypothesize that states with more date label requirements or more restrictions in donations and/or sale of past date foods have more food waste. We should note that states that do not require food date labels do not prohibit them either. Thus, manufacturers are free to utilize their own voluntary date labeling system in those states. This is a confounding factor such that requiring or not requiring date labels may not have a measurable impact on food waste as manufacturers choose to add date labels no matter the state policy. Despite this confounding factor, we take a conservative approach and hypothesize a priori that state date label requirements would be positively associated with waste outcomes.
When food date labels are utilized, whether required by the state or used voluntarily by a manufacturer, confusion could be mitigated with standardized terminology. Specifically, in an ideal world, all foods would have just one of two standard phrases: one default label that indicates food quality and one label that indicates food safety. For example, recent national proposed legislation suggests “Best if used by” as an indicator of quality and “Use by” as an indicator of safety (https://pingree.house.gov/news/documentsingle.aspx?DocumentID=3912; accessed on 20 January 2025). In 2024, California passed the first law in the U.S. that, starting in July 2026, the state will require two different standard date labels on foods to indicate those labeled for quality (“BEST if used by” or “BEST if used or frozen by”) versus those that increase in risk past the date (“USE by” or “USE or freeze by”) (https://leginfo.legislature.ca.gov/faces/billNavClient.xhtml?bill_id=202320240AB660; accessed on 24 December 2024). As another example, the global model language presented by the Food and Agriculture Organization of the United Nations in Codex Alimentarius International Food Standards [40] suggests “Best before date” or “Best quality before date” as an indicator of quality and “Use-by date” or “Expiration date” for safety—suggesting the dual-date labeling method is considered effective no matter geography or climatic conditions. Such standardized date label terminology would reduce the likelihood that safe and wholesome food is wasted.
In the absence of standardized terminology, we focus on whether states require specified terminology—that is, whether the state date label statutes specify which date label terms are allowed. Currently, some states have no specified terminology requirements (e.g., Florida policy for milk and milk products), some states specify one or two allowable phrases (e.g., Colorado policy for eggs requiring “packed by” and “sell by” dates), and others allow many date label phrase options (e.g., Alabama meat policy as illustrated in Figure 1). Due to the variability in guidance provided by state policies, we examine the relationship between the presence of specified terminology requirements and food waste in an exploratory manner.

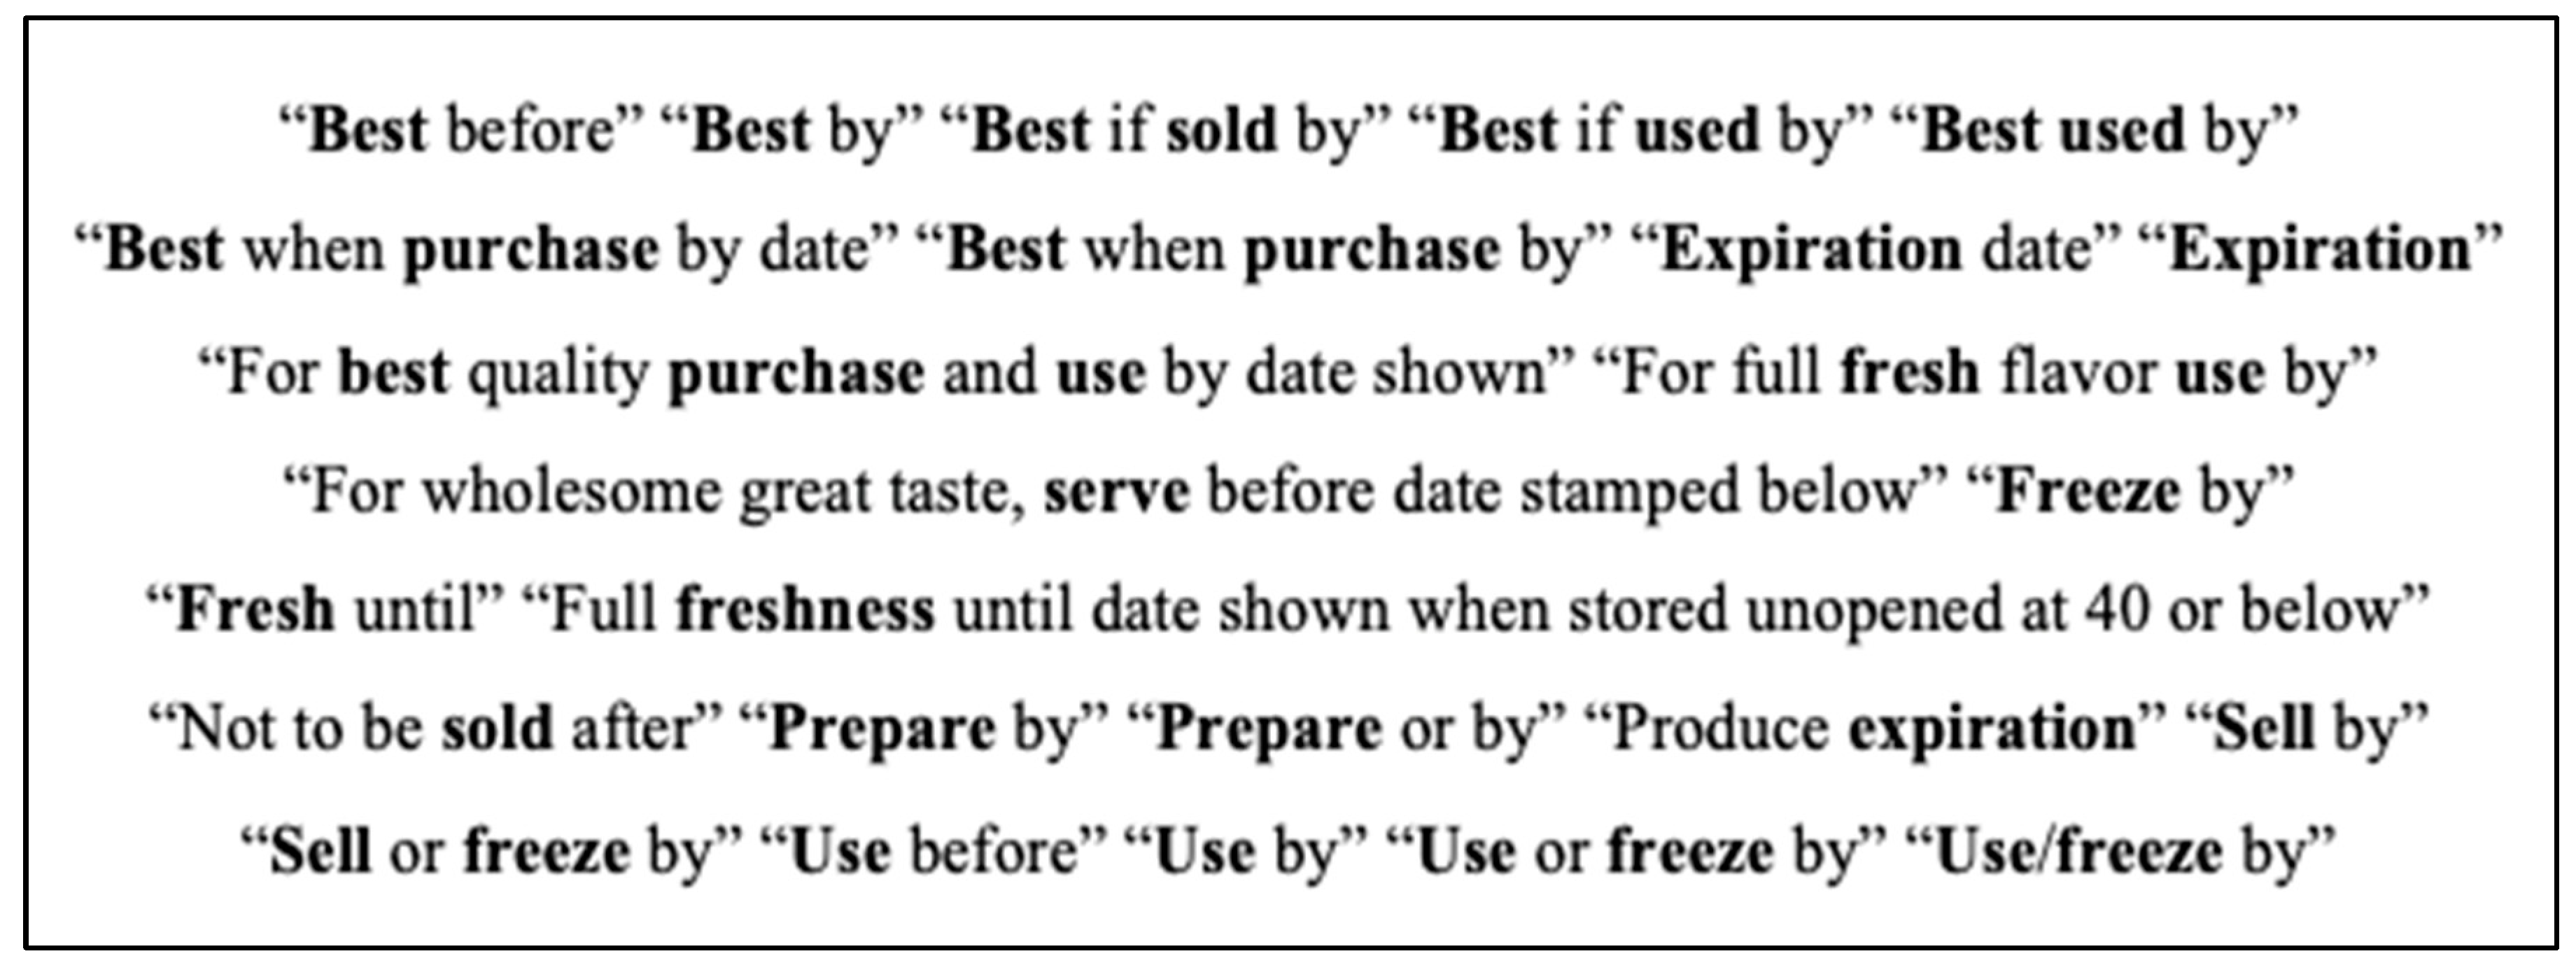
1.2.2. Date Label Policies and Food Safety

As discussed in the previous sections, although most food date labels are intended to indicate food freshness and quality, many consumers mistakenly believe they are indicators of safety [12,17]. The USDA (2019) indicates that “even if the date expires during home storage, a product should be safe, wholesome, and of good quality if handled properly and kept at 40 °F or below”. The FDA’s Center for Food Safety and Applied Nutrition has noted that most foods, when kept in optimal storage conditions, are safe to eat and of acceptable quality for periods of time past the label date [41]. In fact, the FDA chooses not to regulate date labels partly on the grounds that date labels are not safety-related [12,16]. Food safety experts agree that absent time and temperature abuse (i.e., when food is allowed to remain too long at temperatures favorable to the growth of foodborne microorganisms) many food products will be safe past their date labels; however, there are exceptions for certain classes of “ready-to-eat” perishable foods and foods to be consumed by certain susceptible populations [12]. Eating food past the date on labels is generally not linked with foodborne illness risks [42]. Accordingly, we hypothesize that states with fewer date label requirements or restrictions in donation and/or sale of past date foods do not have higher levels of foodborne illness.
In addition to our hypotheses and exploratory research question on the impact of date label policies, we examine in an exploratory manner whether state characteristic variables (e.g., median income) account for the variance in the outcomes, and whether date label policies predict the outcomes after accounting for the state characteristic variables. Section 2.2 State Characteristics Data explains how we identified these potential covariates.

2. Methods

2.1. Date Label Policy Data

For the predictor (i.e., date label policy) data, three coauthors, who are food law policy experts, obtained the policy snapshots (i.e., legal provisions from all 50 states and the District of Columbia, referred to as “states”) for the years 2012 and 2018. The three coauthors then conducted a content analysis of the relevant provisions to assign quantifiable values to four date label policy variables, which represented the main topics addressed by state food label policies, for each state and each of 11 food types (e.g., eggs, dairy, shellfish). Specifically, the state date label provisions were coded as four variables to indicate, for each food type, whether state regulations had been enacted for each of the following: (1) requirement of a date label, (2) after label date sale restrictions, (3) after label date donation restrictions, and (4) specified terminology requirement (although a fifth variable was coded to indicate whether state date label policies required date labels to distinguish between safety and quality of food, we did not include this variable in analyses because at that time, there were no states with such a requirement). The rest of the paper refers to these variables as (1) Label, (2) Sale, (3) Donation, and (4) Terminology, respectively.
To quantify these variables, we computed the total number of distinct food types subject to a restriction within each state and each year (2012 and 2018). Appendix A provides the values of the quantified date label policy variables for all states. Appendix B presents frequency counts for our primary independent variables of interest (i.e., the 2012 and 2018 food date label policy variables). In view of this skewed data pattern that can be seen in Appendix A and Appendix B, and to simplify the interpretation of our substantive results, we converted each of the quantitative date label policy variables into a binary predictor variable, which we used to examine our hypotheses and research question, to indicate whether the states enacted date label policies for a low versus high number of food types (we also conducted analyses using the continuous versions of the policy variables, and the substantive results were consistent with the ones we report here). In Appendix C, columns 3–5 summarize the category frequencies for our binary policy variables omitting the Donation variable, which showed minimal variation (i.e., 48 states imposed no restrictions) and therefore was excluded from further analyses. As Appendix C shows, dichotomization eliminates the sparsely populated, heavily skewed, and generally “ragged” tails that are characteristic of the raw food type count distributions presented in Appendix B. In addition to making for a generally more dense and compact set of distributions, this approach reduces the potential for a few outlying states with unusually large numbers of food type-specific policies to exert excessive leverage on our comparisons.

2.2. Food Waste and Foodborne Illness Data

For state food waste, we used MITRE-Gallup 2023 state food waste data [23] (we accessed the state food waste data in December, 2023 via this link: https://sites.mitre.org/household-food-waste/study/ (see data download section at bottom of 2023 Baseline Study page)). The MITRE-Gallup survey collected self-reported food waste amounts from a nationally representative sample of 9259 U.S. households for a single week. The survey defined household food waste as any food disposed of at home via the trash bin, drain, garbage disposal, compost, or animal feed. Households received an announcement one week prior to the survey, which asked them to monitor their food discards during the upcoming week. Households provided estimates of the volume of food they wasted in a one-week time period in units of cups and tablespoons across eight food categories: fruits, vegetables, protein, dairy, grains, mixed dishes, oils/fats/sugars, and scraps. The MITRE-Gallup study produced food waste estimates both including and excluding inedible food scraps (e.g., bones, eggshells, and pits). The present study used estimates excluding inedible food scraps. The MITRE-Gallup survey used multilevel regression models with poststratification to generate state-level estimates of food waste in the United States. A daily diary study found that the MITRE-Gallup survey estimates correlated reliably with objective, kitchen-scale-based measurement (r = 0.41 to 0.70, n = 257), demonstrating convergent validity evidence for the survey measure [43].
We obtained foodborne illness data for 2013–2018 from the Centers for Disease Control and Prevention (CDC) National Outbreak Recording System (NORS) Public Data Tool [44]. (Although NORS provides foodborne illness data for 2019 and 2020, we did not include the data for these two years because of a time lag in data collection reported by CDC (2022). We accessed the NORS data on May 2022 via this link: https://wwwn.cdc.gov/norsdashboard/). The raw data included the number of illnesses associated with each foodborne outbreak nested within month, year, and state. For example, in Alabama in 2013, there was one outbreak each in January, July, and September. For analyses, we first computed a foodborne illness variable, which was the total number of illnesses associated with all outbreaks within each state and each year. Next, we computed a per capita foodborne illness variable by dividing the number of outbreak-associated foodborne illnesses in a state by the state’s population. Appendix D presents descriptive statistics for states’ household food waste amounts (in cups) and number of foodborne illnesses.

3. Analytic Approach

To examine the relationships between date label policies and outcomes, we focused on measures of effect size and “practical significance” (e.g., Cohen’s d, correlation magnitude), as opposed to p-values or other indicators of “statistical significance”. This was for two reasons. First, our analyses are intended to make inferences about a complete population (all 50 states in the U.S.), and it was unclear that inferential hypothesis testing methods are strictly applicable to such cases (see, e.g., [45]). Second, even if we were to treat our data set as a “sample” of some hypothetical general data-generating process that could have produced different state governments, our statistical power is practically constrained by the sample size, N = 50 states. Thus, there were both conceptual and pragmatic considerations that augur for an emphasis on effect size.
To test the hypotheses and address the research question pertaining to food waste, we used the 2018 policy snapshots to calculate the effect of each (binary) policy variable on food waste. To test the hypotheses pertaining to foodborne illness, we used the 2012 policy snapshots (due to the time lag in NORS data, as explained in the 2.3 Food Waste and Foodborne Illness Data section) to calculate the effect of each policy variable on each subsequent year’s foodborne illness frequency 2013 through 2018. We quantified the policy effects on food waste and foodborne illness using Cohen’s d, which characterized in standard deviation units the difference in the means of outcome variables between states that were in the high versus low categories of a given date label policy.
In addition to examining the relationships between our (binary) food waste policy variables and food waste, we explored the impact of statistical control variables measured at the same years as the policy snapshots (i.e., 2012 and 2018). In line with prior work that examined predictors of food waste in cities and states (e.g., [46,47]), we obtained state characteristics data on a set of variables (see Appendix E for the variables and the sources from which we obtained the data) (the descriptive statistics of the state characteristic variables and their correlations with the outcome variables are available upon request from the corresponding author). For examining our hypotheses and research question, we searched for those covariates that had medium effects (i.e., correlations of 0.30 to 0.50; [48]) or large effects (i.e., correlations of 0.50 or greater; [48]) on the focal outcomes across years. Specifically, for analyses involving food waste, we retained percent poverty, household size, and level of education (high school or above). We conducted a series of semi-partial correlations, where we looked at each policy variable’s relationship to food waste after controlling for a variable (for the same year as the policy year, 2018), repeating the process for each combination of a policy and state characteristic variable. These semi-partial correlations resulted in the same substantive conclusions as those reported in the subsequent section and are available upon request from the authors.
For analyses involving foodborne illness, we did not include state characteristics as covariates because none of the variables considered had a medium or large correlation with this outcome.

4. Results

4.1. Relationships Between Date Label Policies and Food Waste

Table 1 presents the Cohen’s d values along with the mean and standard deviation of food waste in high and low categories of each date label policy variable. In the table, a positive Cohen’s d value indicates higher average levels of food waste among states that fall in the “high” category of the respective policy (i.e., meeting or exceeding the policy variable threshold that is indicated in the table note) as compared to states that fall in the “low” category (i.e., not meeting the threshold).
Note. N = 50 States. Label = Date label requirement, Sale = Sale restrictions past label date, Terminology = Specified terminology requirement, M = Mean of food waste in the respective policy level, SD = Standard deviation of food waste in the respective policy level. High (vs. low) category included the states with 2 or more food types for the Date variable and states with 1 or more food types for the Sale and Terminology variables. Food waste is expressed in cups.
As Table 1 shows, states with more date label requirements and more past-date sales restrictions, and more food types with specified date label terminology all tend to display higher levels of waste. Following Cohen’s [48] interpretive conventions, the typical date label and specified terminology effects were not practically significant (Cohen’s d smaller than 0.20) and the typical sales restriction effect was small (Cohen’s d of 0.20 to 0.50).

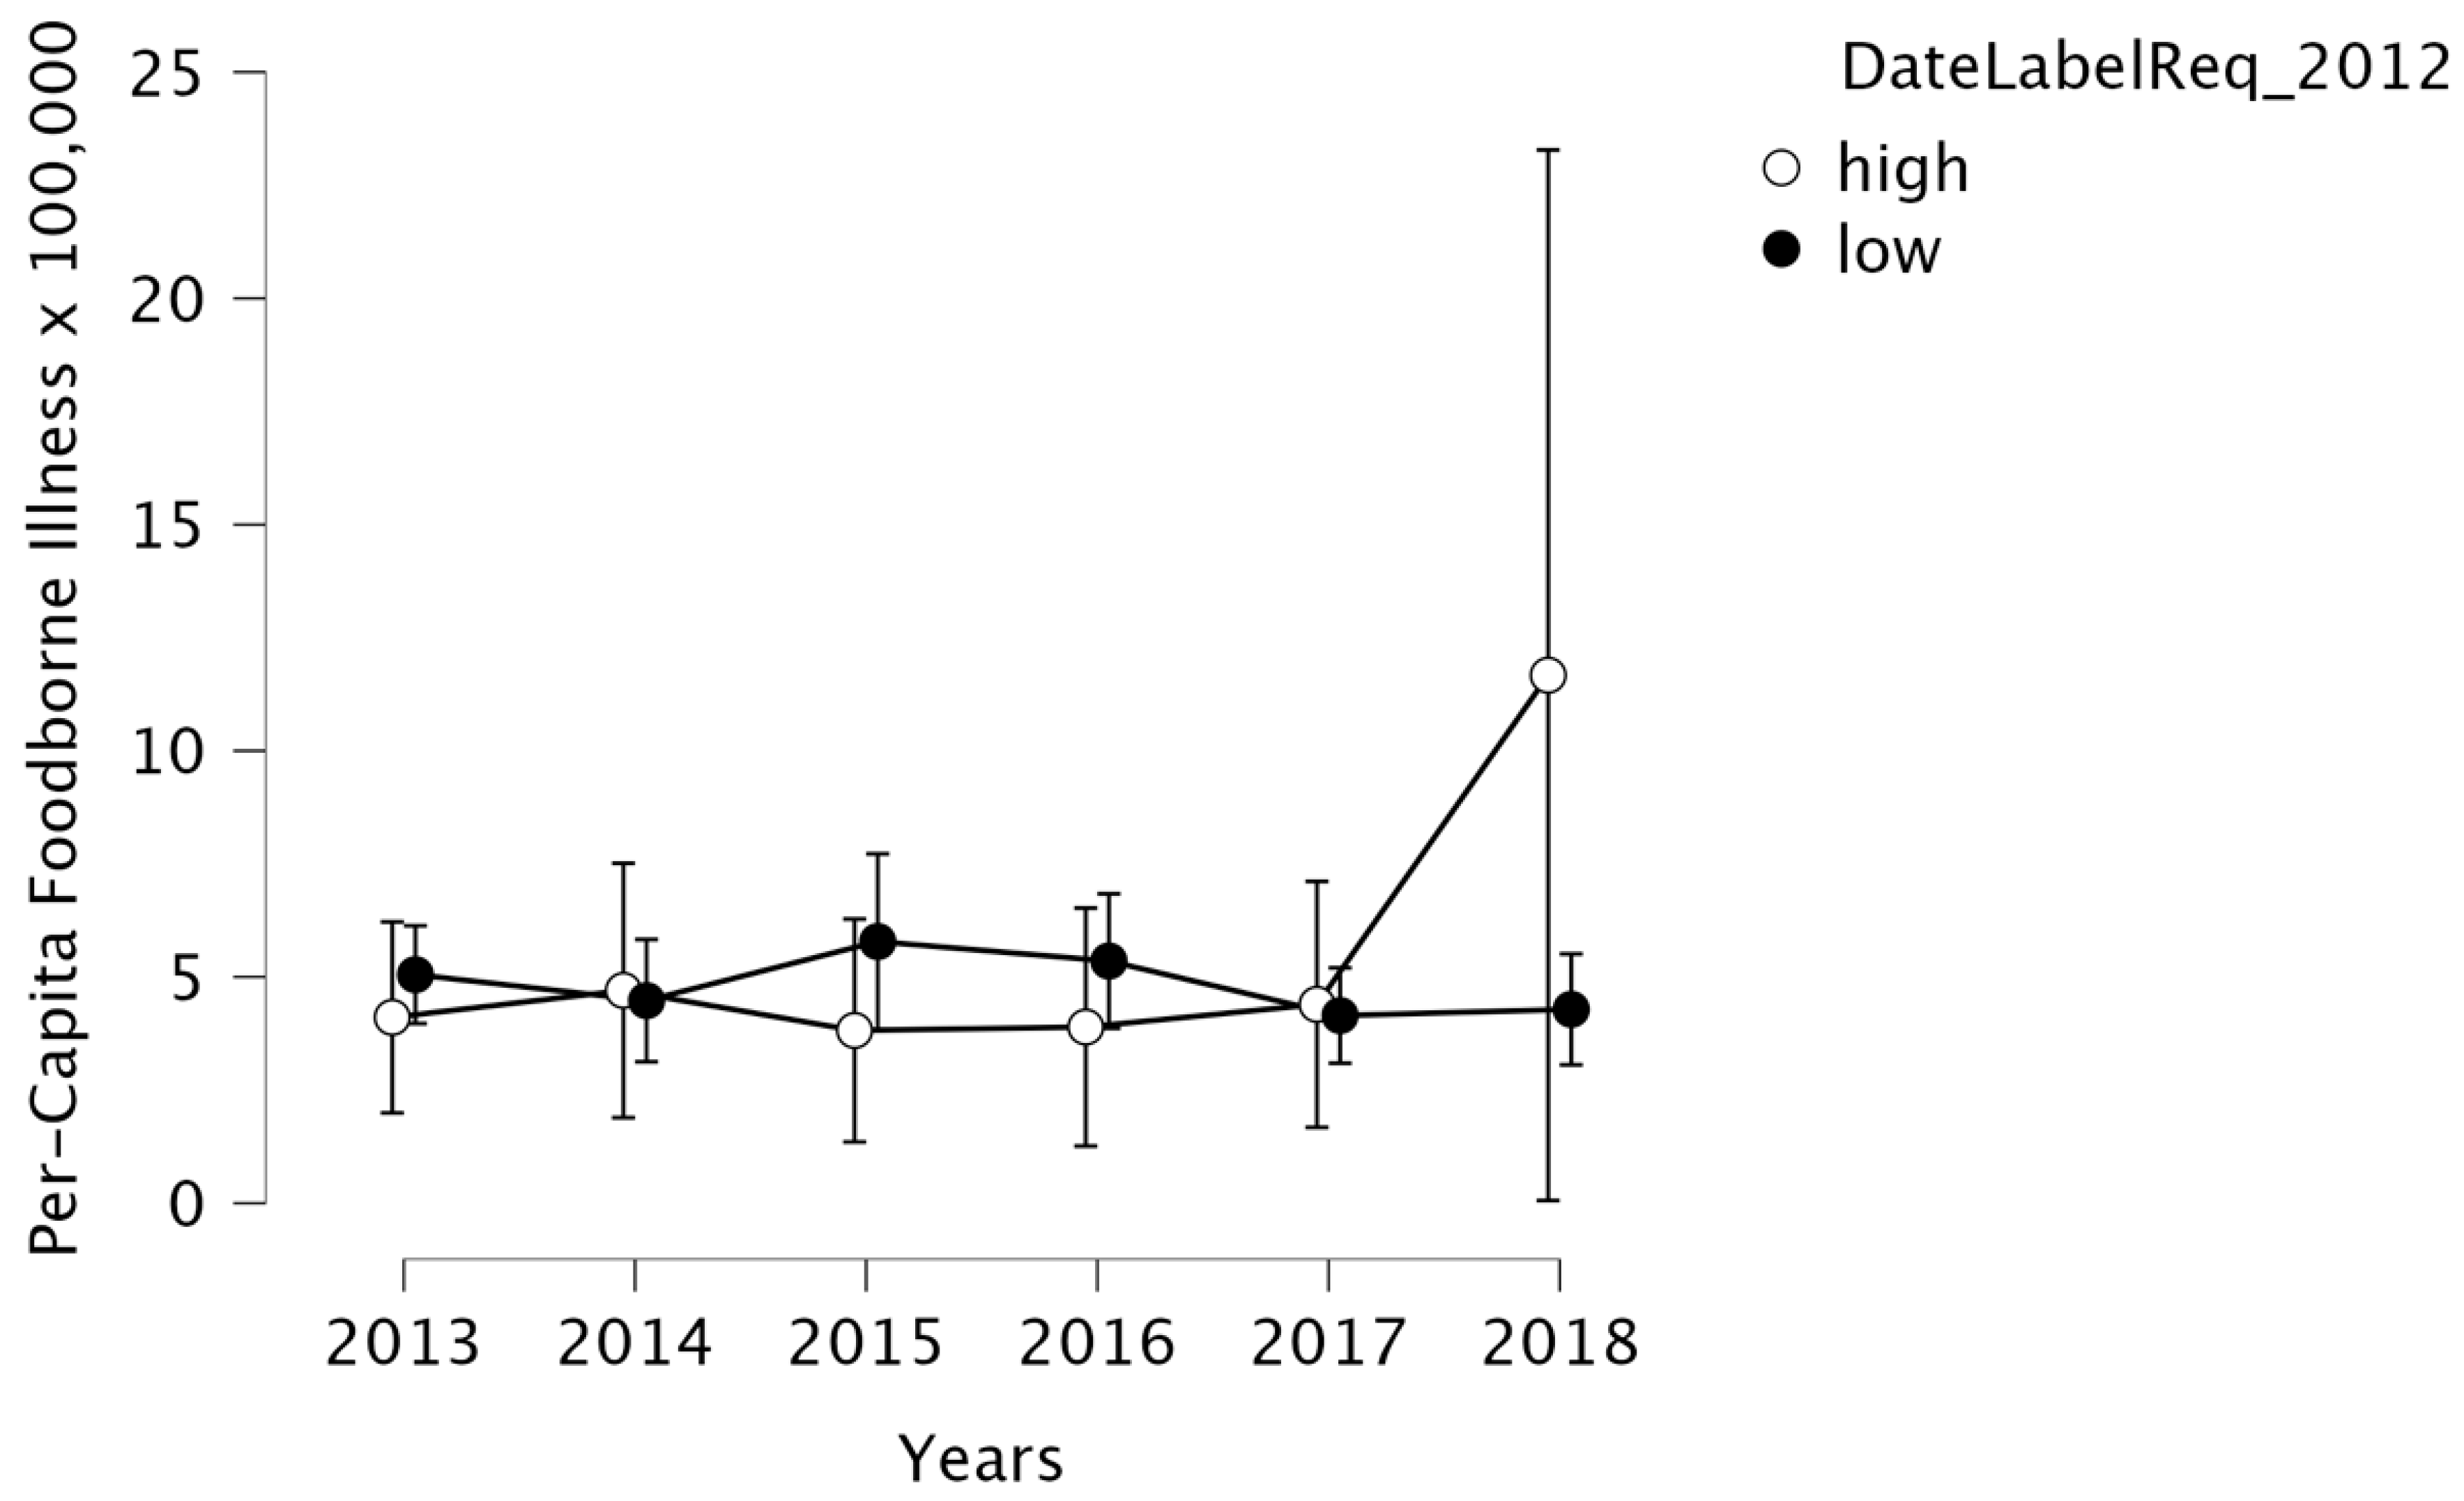
4.2. Relationships Between Date Label Policies and Foodborne Illness

Table 2 presents the Cohen’s d values along with the mean and standard deviation of foodborne illnesses in high and low categories of each date label policy variable in each year from 2013–2018. As a reminder, we did not include the foodborne illness data for 2019 and 2020 in our analyses because CDC reported a lag in NORS data collection. For ease of interpretation, we report the mean and standard deviation of the number of foodborne illnesses per capita multiplied by 100,000, rather than the per capita version that we used for Cohen’s d tests. In the table, a positive Cohen’s d value means that a more restrictive policy (or more specified food label phrases) was associated with higher rates of per-capita foodborne illness, while a negative Cohen’s d value means that the more restrictive policy (or less standardized food labels) was associated with lower rates of illness.
Note. N = 50 States. Label = Date label requirement, Sale = Sale restrictions past label date, Terminology = Specified terminology requirement, MSW = Municipal solid waste, M = Mean, SD = Standard deviation. High (vs. low) category included the states with 2 or more food types for the Date Label Requirement variable and states with 1 or more food types for the Sale Restriction After Date and Standardized Terminology Requirement variables. Primary Cohen’s d cell entries are standard Cohen’s d values, while parenthetical values are outlier-resistant (i.e., robust) Cohen’s d values. Both were calculated using the “psych” R package.
As Table 2 shows, these policy effects were mixed. Prior to 2017, having food date label requirements for more food types usually was associated with lower foodborne illness rates (small-to-medium effects), though this pattern reversed in 2018, at which point having date label requirements for more food types was associated with higher rates of foodborne illness (a medium-to-strong effect). Results for after date sales restrictions also were somewhat mixed, though there was a more consistent pattern in later years (2016–2018), during which time states with more restrictions consistently had higher rates of foodborne illness (a small effect). Finally, having specified terminology requirements for more food types was consistently associated with higher levels of foodborne illness rates, though this relationship is weak (not practically significant) in later years.
Given these mixed results for foodborne illness outcomes, it may be useful to consider not only relative but also absolute impact on these outcomes. Figure 2 depicts differences in state mean foodborne illnesses across high and low categories of the Date variable over time. To give a sense of scale here, consider the largest gap between the two categories: states with more date label requirements in 2012 had a 2018 per-capita mean foodborne illness rate of 0.00012 (12 cases per 100,000 people), while the rate in states with fewer date label requirements was 0.00004 (4 in 100,000). This difference certainly is practically significant in relative terms, whether expressed in Cohen’s d units or as a 200% decrease in the case rate (i.e., going from 12 to 4 cases per 100,000). At the same time, this corresponds to a small absolute decrease of 8 illness cases per 100,000.
Overall, these results suggest that variability in the food date label policies was not substantially related to foodborne illness rates, supporting our prediction.

5. Discussion

Our study examined whether U.S. states’ current date label policies are related to food waste and safety outcomes, thereby demonstrating whether date label policies have the potential to promote sustainable environments. We found that states with more date label requirements, more after-date sales restrictions, and more specified date label terminology requirements tended to display slightly higher levels of household food waste. These effects were small for after-date sale restrictions and not practically significant for terminology requirements and date label requirements. Findings did not change after controlling for potentially confounding state characteristics (i.e., percent poverty, household size, and level of education), suggesting that food date label policies do not have an appreciable effect on food waste levels.
In line with our hypothesis, we found that reduced date label and past-date sales restrictions were not consistently associated with increased levels of foodborne illness. Thus, our results do not support the notion that food date label policies are a major lever in mitigating foodborne illness.
Overall, these findings indicate that current food date label policies do not have an appreciable impact on food waste and sustainability, though restrictions on sale past the date label do have a more noticeable impact compared to the other policy elements. However, since current date label policies are not related to food safety, policy change for even marginal food waste reduction may be warranted. This is especially true given the high percentage of food waste that occurs at the household level, and the corresponding impacts on landfill methane emissions and climate change [9].

5.1. Date Label Recommendations and Future Research Directions

Our findings, showing only a small association between date label policies and food waste, are likely influenced by the fact that as of the time of data collection, no state had a “strong” date label policy; this changed with enactment of AB 660 in California, which will take effect in 2026. States that require date labels generally do not specify label language or if they do, they do not delineate between dates that are meant to indicate safety versus quality. And as noted, some states restrict sale or donation past date. At best, states simply remain silent as to date labels; however, this allows manufacturers to make their own decisions about when to use labels and what terms to use. Consumers in states with or without date label laws are experiencing the same confusing range of date labels (see Section 1. Introduction for a discussion and Figure 1 as an example). There are no positive state laws currently enforced that might help consumers to reduce food waste and thus increase the difference in food waste outcomes between states.
Numerous public and private entities—including the USDA, the Food Industry Association (formerly the Food Marketing Institute), the Consumer Brand Association (formerly the Grocery Manufacturers Association), and members of Congress—have argued that date label confusion would be significantly reduced if regulations limited the allowable range to only two standardized date labels: one for quality and another for safety [49]. Moreover, industry has taken actions to standardize the date labels even without regulation (https://www.foodsafetynews.com/2024/03/its-time-to-finally-clear-up-food-date-label-confusion-for-consumers/#google_vignette, https://www.fmi.org/industry-topics/labeling/product-code-dating; accessed on 6 November 2024). Further, such standard date labeling was proposed in federal legislation re-introduced in 2021, which would standardize to a dual labeling system at a national level ([50]; see also Codex Alimentarius International Food Standards, [40]).
Date label policy change to reduce consumer confusion and food waste can be taken at either federal or state level. In December 2024, a federal Request for Information was jointly published by the USDA and FDA that asks for data regarding the impacts of date labels on consumers and comments on potential federal regulation of date labeling, indicating the feasibility of future federal action in this area (https://www.federalregister.gov/documents/2024/12/04/2024-27810/food-date-labeling (accessed on 27 December 2024). As to state action, California’s recent law standardizing date labels provides a blueprint that other states can follow. Importantly, overly restrictive policies could inadvertently increase food waste due to consumer confusion and misinterpretation, or inability to sell or donate food past its label date. Policy-makers must consider these trade-offs to optimize outcomes of food date label policies.
Beyond this, there are numerous miscellaneous practice improvements that can be readily implemented. These include (1) discontinuing the use of quality-based dates on nonperishable shelf stable products [12]; (2) making sell-by dates invisible to the consumer [12,18,20,21,22]; (3) employing more transparent and consistent methods for selecting dates, through a set of best practices for manufacturers and retailers [12]; (4) exploring methods such as visual cues to help consumers interpret date labels (e.g., [51]); and (5) specifying the longest possible shelf life (for example, extend the best before or use by date where possible, lengthen “once opened, use within x days” guidance, where possible) [18,20]. Immediate action in this area is warranted given the global need to mitigate climate change and global commitment to halve food waste.
While these practice improvements help reduce food waste, foodborne illness could be mitigated by relevant educational campaigns and increased health care access that would increase consumers’ awareness of foodborne illnesses and prevent the spread of outbreaks. Examining such factors was out of the scope of this paper. However, future research could examine the date label policy—foodborne illness relationship after controlling for factors that can mitigate foodborne illness.
Finally, there is a continued need to develop, evaluate, and scale resources for educating consumers about the meaning of food date labels [18,20,52]. As discussed herein, we argue that fewer, simpler, more consistent, and more actionable labels placed directly on products are a kind of educational intervention unto themselves, as they help consumers to build the memory of meanings of labels on any given product. As with other forms of education or public health outreach, there is also much value in high-salience, multi-modal advertising and awareness campaigns that deliver public service messages via channels such as billboards, web ads, quick informational videos, social media, television advertisement, and in-store posters and displays (see United Kingdom’s “Look, Smell, Taste, Don’t Waste” campaign as an example: https://toogoodtogo.co.uk/en-gb/campaign/commitment; accessed on 6 November 2024). Such mechanisms could help to better educate consumers about the meaning of date labels or especially if they are changed to align with standard labels in the future. This is a high-stakes, high-value mode of engagement that is worthy of careful planning and study, leveraging the scale and resources of industry groups (e.g., test marking of approaches before scaling them). In encouraging news, in September 2024 the U.S. EPA recently announced a notice of funding opportunity to support the delivery of national consumer wasted food reduction campaign (https://www.epa.gov/newsreleases/biden-harris-administration-announces-117-million-grants-available-advance-recycling; accessed on 6 November 2024). The national campaign could not only leverage the information obtained via the USDA and FDA Request for Information (discussed earlier in this section) but also help educate consumers on standard date labels that can result from new policies developed via the Request for Information effort.

5.2. Limitations

As with any research, the current paper has some limitations. First, the analyses are likely underpowered due to the sample size (N = 50), which might have resulted in smaller and non-significant effects. Therefore, tests of hypotheses should be interpreted cautiously. In addition, the state food waste values were obtained via small area estimation techniques explained in Section 2.2. Future studies could utilize stratified sampling to obtain a more direct measure of state food waste levels, not only at the household level but also in other areas of the food chain (e.g., retail, food service). Also, the current study utilized policy snapshots from 2018 to examine the food waste outcome and from 2012 and 2018 to examine the food safety outcome. The time gap (i.e., years) between the predictor (i.e., policy) variables and outcome (e.g., food waste and safety) variables support interpretations pertaining to causality. However, the existing research has not established how long it takes to observe the impact of food waste policies. Therefore, future research should replicate our analyses utilizing different policy–outcome time gaps and explore whether the effect sizes change.
Future research could also examine various positive state date label policies. For example, testing the impacts of a policy that standardizes date labels to one safety-based and one quality-based label could help, as we were not able to test this given enacted state laws at the time of our study. Future studies could also analyze (1) the extent to which people notice a label (or the absence of a label); (2) whether and which people actively seek out labels; (3) how people interpret the absence of a label (what do they assume this means?); and (4) how any of this relates to actual behavior. The answers to these questions can then inform a uniform, consumer-facing dating system that employs simple, clear, and consistent wording and optimizes for which products should or should not bear a label.
In addition, while we emphasize that food waste is one of the top causes of climate change [1,2,3,4,5,6,7,8], examining the specific impact of food date label policies on climate change indicators was out of the scope of our paper. Future research could build on our work to examine the relationships between date label and other food waste policies and climate change indicators. We regard these as sound and actionable recommendations for the present, though additional research may lead to further improvements by exploring the need for quality-based dates (and the impact of omitting them on some foods), as well as matters of optimal wording.

5.3. Beyond Food Date Labels, Food Waste, and Food Safety

The challenge of food waste is certainly one of the pressing issues influencing climate change. The current study focused on food waste and safety as an outcome of food date label policies, which are conceptualized as food waste prevention policies (see, e.g., ReFED U.S. Food Waste Policy Finder; https://policyfinder.refed.org (accessed on 6 November 2024)). Future research could expand the outcome space by examining whether date label policies—particularly past-date donation bans—influence food insecurity, thereby demonstrating the impact of food waste policies on social and economic sustainability. Future research could also expand the policy space by examining the impact of other food waste policies on relevant outcomes (e.g., [53]). For example, food recycling (i.e., animal feed and organic waste bans) policies could impact food waste and other environmental indicators. Overall, a focus on the impacts of different food waste policies on food waste, food safety, food insecurity, and other relevant outcomes is worthy of both current action and ongoing analysis to understand the mechanisms underlying social, economic, and environmental sustainability. Findings from such studies could inform pathways for achieving broader goals such as the global Sustainable Development Goal Target 12.3, which aims to halve per capita food waste by 2030 [10].

6. Conclusions

This study conceptualizes date label policies as a factor impacting environmental sustainability, with potential implications for social and economic sustainability. Our findings underscore the need for standardized, clear date labeling policies to mitigate food waste without compromising food safety. Promoting sustainable environments and, more specifically, achieving the global Sustainable Development Goal 12.3 by halving global food waste by 2030, requires harmonized efforts at all levels of governance to standardize date labeling and reduce confusion.

Author Contributions

Conceptualization, B.A., E.M.B.L., R.P., J.S.B., L.L. and A.S.; Methodology, B.A., G.M., J.A.A., L.L. and A.S.; Formal analysis, B.A., G.M., J.A.A., R.H. and A.S.; Investigation, B.A., E.M.B.L. and A.S.; Resources, L.L.; Data curation, B.A., G.M., J.A.A., E.M.B.L., R.P., J.S.B. and A.S.; Writing—original draft, B.A., R.H., J.P. and A.S.; Writing—review & editing, G.M., J.A.A., R.H., E.M.B.L., R.P., J.S.B., L.L. and A.S.; Visualization, G.M.; Supervision, B.A., E.M.B.L., L.L. and A.S.; Project administration, B.A. and A.S.; Funding acquisition, L.L. All authors have read and agreed to the published version of the manuscript.

Funding

This research was funded by The MITRE Corporation Independent Research and Development Program.

Data Availability Statement

The policy data presented in this study will be publicly available via Appendix A of the paper, when the paper is published. The household food waste data is publicly available via MITRE Household Food Waste 2023 Baseline Study website https://sites.mitre.org/household-food-waste/study/ (accessed on 6 November 2024).

Acknowledgments

The authors thank Charles A. Worrell, Karl Branting, Denali Rao, Rex Bone, and Nicholas Leets for their constructive feedback on earlier drafts of the paper. We also thank Becca Scribner for her assistance in obtaining date label policy provisions.

Conflicts of Interest

Authors Balca Alaybek, Grace Mika, John A. Aitken, Rob Hartman, Julia Painter, Laura Leets and Amber Sprenger were employed by The MITRE Corporation. The remaining authors were affiliated with the Harvard Law School. The authors declare that this study received funding from The MITRE Corporation’s Independent Research and Development (IR&D) Program. The authors declare that the research was conducted in the absence of any commercial or financial relationships that could be construed as a potential conflict of interest, as MITRE is a not-for-profit working in the public interest, and its IR&D program neither fits under the commercial umbrella nor has any conflicts of interest in the study’s results.

Appendix A

Number of Food Types for which a Date Label Policy Has Been Enacted in Each State
2012 Date Label Policy Variable Values2018 Date Label Policy Variable Values
StateLabelSaleDonationTerminologyLabelSaleDonationTerminology
Alabama04040404
Alaska10001000
Arizona10001000
Arkansas10001000
California20002000
Colorado11011101
Connecticut10011001
Delaware00001000
Florida22002200
Georgia55015500
Hawaii11001100
Idaho00000000
Illinois01000100
Indiana20012001
Iowa10001000
Kansas10011001
Kentucky21012101
Louisiana10001000
Maine00001001
Maryland11111111
Massachusetts00001100
Michigan22013302
Minnesota30003000
Mississippi10011001
Missouri00000000
Montana11101110
Nebraska00000000
Nevada00003200
New Hampshire22011101
New Jersey21012101
New Mexico11001100
New York00000000
North Carolina10001000
North Dakota10001000
Ohio20002000
Oklahoma20012001
Oregon11001100
Pennsylvania21012101
Rhode Island21012101
South Carolina20012001
South Dakota00000000
Tennessee00002100
Texas10011001
Utah00000000
Vermont21002100
Virginia21002100
Washington11001100
West Virginia10001000
Wisconsin00002100
Wyoming10001000
Note. Label = Date label requirement, Sale = Sale restrictions past label date, Donation = Donation restrictions past label date, Terminology = Specified terminology requirement.

Appendix B

Frequency Counts of Date Label Policy Variables in 2012 and 2018 Policy Snapshots
Policy Snapshot YearCount of Food Types with the Enacted PolicyDate Label Policies
LabelSaleDonationTerminology
2012014314833
12014216
214300
31000
40101
51100
201808274833
12418215
214201
33100
40101
51100
Note. Label = Date label requirement, Sale = Sale restrictions past label date, Donation = Donation restrictions past label date, Terminology = Specified terminology requirement. The numbers in column 2 show the values of the quantitative date label policy variables. The numbers in columns 3–6 are counts of states that had the respective values of each date label policy variable. States that do not impose date label requirement on any food types may impose sale/donation restrictions and/or require specified terminology for those manufacturers that choose to use date labels.

Appendix C

Category Frequencies of Binary Date Label Policy Variables in 2012 and 2018 Policy Snapshots
Policy Snapshot
Year
Label Category (Numeric Value)Date Label Policies
LabelSaleTerminology
2012Low (0)343133
High (1)161917
2018Low (0)322733
High (1)182317
Note. Label = Date label requirement, Sale = Sale restrictions past label date, Terminology = Specified terminology requirement. High (vs. low) category included the states with 2 or more food types for the Date variable and states with 1 or more food types for the Sale and Terminology variables. Cells in columns 3–5 show the number of states in each category of the respective binary date label policy variable.

Appendix D

Sources of State Characteristics Data
VariableData Source
Population Census Historical Population
Household SizeAmerican Community Survey
Median IncomeAmerican Community Survey
Mean IncomeAmerican Community Survey
Percent PovertyCensus Historical Poverty Rates
Welfare SpendingAnnual Survey of State Government Finances
Percent SNAPAmerican Community Survey
Percent FarmlandUSDA National Agricultural Statistics Service Farms and Land
Percent Urban PopulationUrban Area Delineation Program
Percent Urban Land AreaUrban Area Delineation Program
Grocery Stores SizeCounty Business Patterns
EducationAmerican Community Survey
PartisanshipNational Conference of State Legislatures
Note. SNAP = Number of households participating in Supplemental Nutrition Assistance Program. Number of Grocery Stores variable included grocery stores with more than 50, 100, 250, or 500 employees.

Appendix E

Descriptive Statistics for the Outcome Variables
State Food Waste per Household
YearMeanSDMinMax
20237.620.806.1410.21
State Foodborne Illness
YearMeanSDMinMax
2013251.57229.9731133
2014260.19262.9461180
2015280.69284.3031483
2016268.65251.03101009
2017272.96327.3461537
2018314.00334.4171176
N = 50 states. SD = Standard deviation; Min = Minimum; Max = Maximum. Food waste is expressed in cups per households. Although we used per capita values of foodborne illness, the table presents the statistics based on raw values for ease of interpretation.

References

  1. Beretta, C.; Stoessel, F.; Baier, U.; Hellweg, S. Quantifying food losses and the potential for reduction in Switzerland. Waste Manag. 2013, 33, 764–773. [Google Scholar] [CrossRef]
  2. Food and Agriculture Organization of the United Nations. Food Wastage Footprint and Climate Change; Food and Agriculture Organization of the United Nations: Rome, Italy, 2013; Available online: https://www.fao.org/3/bb144e/bb144e.pdf (accessed on 6 November 2024).
  3. Garrone, P.; Melacini, M.; Perego, A. Opening the black box of food waste reduction. Food Policy 2014, 46, 129–139. [Google Scholar] [CrossRef]
  4. Lundqvist, J.; de Fraiture, C.; Molden, D. Saving Water: From Field to Fork—Curbing Loss and Wastage in the Food Chain; SIWI Policy Brief; 2008. Available online: https://siwi.org/wp-content/uploads/2015/09/PB_From_Filed_to_fork_2008.pdf (accessed on 6 November 2024).
  5. Quested, T.; Ingle, R.; Parry, A. Household Food and Drink Waste in the United Kingdom 2012; Final Report; WRAP: Banbury, UK, 2013; Available online: https://wrap.org.uk/sites/default/files/2020-12/Household-Food-and-Drink-Waste-in-the-United-Kingdom-2012.pdf (accessed on 6 November 2024).
  6. Venkat, K. The climate change and economic impacts of food waste in the United States. Int. J. Food Syst. Dyn. 2011, 2, 431–446. [Google Scholar]
  7. Ventour, L. The Food We Waste; WRAP: Banbury, UK, 2008. [Google Scholar]
  8. Hawken, P. Drawdown: The Most Comprehensive Plan Ever Proposed to Reverse Global Warming; Penguin Books: New York, NY, USA, 2017. [Google Scholar]
  9. Krause, M.; Kenny, S.; Stephenson, J.; Singleton, A. Quantifying Methane Emissions from Landfilled Food Waste. U.S. Environmental Protection Agency Office of Research and Development. 2023. Available online: https://www.epa.gov/system/files/documents/2023-10/food-waste-landfill-methane10-8-23-final_508-compliant.pdf (accessed on 27 December 2024).
  10. United Nations. Sustainable Development Goals. 2017. Available online: https://www.un.org/sustainabledevelopment/sustainable-development-goals/ (accessed on 6 November 2024).
  11. U.S. Environmental Protection Agency. From Farm to Kitchen: The Environmental Impacts of U.S. Food Waste. 2021. Available online: https://www.epa.gov/system/files/documents/2021-11/from-farm-to-kitchen-the-environmental-impacts-of-u.s.-food-waste_508-tagged.pdf (accessed on 6 November 2024).
  12. Broad Leib, E.; Gunders, D.; Ferro, J.; Nielsen, A.; Nosek, G.; Qu, J. The Dating Game: How Confusing Food Date Labels Lead to Food Waste in America. Natural Resources Defense Council Report; 2013. Available online: https://www.nrdc.org/sites/default/files/dating-game-report.pdf (accessed on 6 November 2024).
  13. Broad Leib, E.; Rice, C.; Neff, R.; Spiker, M.; Schklair, A.; Greenberg, S. Consumer Perceptions of Date Labels: National Survey; Harvard Law School Food Law and Policy Clinic, National Consumers League, Johns Hopkins Center for a Livable Future: Boston, MA, USA, 2016; Available online: https://chlpi.org/wp-content/uploads/2013/12/Consumer-Perceptions-on-Date-Labels_May-2016.pdf (accessed on 6 November 2024).
  14. Evans, A.I.; Nagele, R.M. A lot to digest: Advancing food waste policy in the United States. Nat. Resour. J. 2018, 177, 177–214. Available online: https://www.jstor.org/stable/26394778 (accessed on 6 November 2024). [CrossRef]
  15. Beckmann, J.S.; Broad, M.; Leib, E.; Shapiro, M.; Gimre, K.; Plenkenpol, R. Promoting Food Donation: Date Labeling Law and Policy. November 2021. Available online: https://www.foodbanking.org/wp-content/uploads/2021/11/atlas-date-labeling-issue-brief.pdf (accessed on 6 November 2024).
  16. Broad Leib, E.; Pollans, M.J. The new food safety. Calif. Law Rev. 2019, 107, 1173–1248. [Google Scholar] [CrossRef]
  17. Neff, R.A.; Spiker, M.; Rice, C.; Schklair, A.; Greenberg, S.; Leib, E.B. Misunderstood food date labels and reported food discards: A survey of US consumer attitudes and behaviors. Waste Manag. 2019, 86, 123–132. [Google Scholar] [CrossRef] [PubMed]
  18. Newsome, R.; Balestrini, C.G.; Baum, M.D.; Corby, J.; Fisher, W.; Goodburn, K.; Labuza, T.P.; Prince, G.; Thesmar, H.S.; Yiannas, F. Applications and perceptions of date labeling of food. Compr. Rev. Food Sci. Food Saf. 2014, 13, 745–769. [Google Scholar] [CrossRef] [PubMed]
  19. Principato, L.; Mattia, G.; Leo, A.D.; Pratesi, C.A. The household wasteful behaviour framework: A systematic review of consumer food waste. Ind. Mark. Manag. 2021, 93, 641–649. [Google Scholar] [CrossRef]
  20. Schanes, K.; Dobernig, K.; Gozet, B. Food waste matters—A systematic review of household food waste practices and their policy implications. J. Clean. Prod. 2018, 182, 978–991. [Google Scholar] [CrossRef]
  21. WRAP. Consumer Insight: Date Labels and Storage Guidance; WRAP, 2011. Available online: https://www.wrap.ngo/sites/default/files/2020-12/Consumer-insight-date-labels-and-storage-guidance.pdf (accessed on 5 November 2024).
  22. WRAP. Helping Consumers Reduce Food Waste—A Retail Survey; WRAP, 2012. Available online: https://www.wrap.ngo/sites/default/files/2020-12/Helping-consumers-reduce-food%20waste-A-2011-retail-survey.pdf (accessed on 5 November 2024).
  23. Aitken, J.; Alaybek, B.; Hartman, H.; Leets, L.; Mika, G.; Rao, D.; Sprenger, A.; Viani, D.; Archer, K.; Davoodi, T.; et al. The State of Food Waste in America 2023 Report. 2023. Available online: https://sites.mitre.org/household-food-waste/ (accessed on 5 November 2024).
  24. Davenport, M.L.; Qi, D.; Roe, B.E. Food-related routines, product characteristics, and household food waste in the United States: A refrigerator-based pilot study. Resour. Conserv. Recycl. 2019, 150, 104440–104456. [Google Scholar] [CrossRef]
  25. Qi, D.; Roe, B.E. Household food waste: Multivariate regression and principal components analyses of awareness and attitudes among U.S. consumers. PLoS ONE 2016, 11, e0159259. [Google Scholar] [CrossRef]
  26. Rahelu, K. Date labelling on food. Nutr. Bull. 2009, 34, 388–390. [Google Scholar] [CrossRef]
  27. Visschers, V.H.; Wickli, N.; Siegrist, M. Sorting out food waste behaviour: A survey on the motivators and barriers of self-reported amounts of food waste in households. J. Environ. Psychol. 2016, 45, 66–78. [Google Scholar] [CrossRef]
  28. Yiannas, F. Deputy Commissioner Frank Yiannas Letter to Food Industry; U.S. Food and Drug Administration, USA, 2019. Available online: https://www.fda.gov/media/125114/download (accessed on 6 November 2024).
  29. Povich, E.S. Food Waste Is a Major Problem. Confusing Date Labels Are Making It Worse. Stateline Article. 28 March 2019. Available online: https://www.pewtrusts.org/en/research-and-analysis/blogs/stateline/2019/03/28/food-waste-is-a-major-problem-confusing-date-labels-are-making-it-worse (accessed on 6 November 2024).
  30. Yu, Y.; Jaenicke, E.C. The effect of sell-by dates on purchase volume and food waste. Food Policy 2021, 98, 101879. [Google Scholar] [CrossRef]
  31. Buzby, J.C.; Farah-Wells, H.; Hyman, J. The estimated amount, value, and calories of postharvest food losses at the retail and consumer levels in the United States. USDA-ERS Econ. Inf. Bull. 2014, 121, 1–30. [Google Scholar] [CrossRef]
  32. Gustavsson, J.; Cederberg, C.; Sonesson, U.; van Otterdijk, R.; Meybeck, A. Global Food Losses and Food Waste. Presented at the Interpack, 2011, Düsseldorf, Germany, 12–18 May 2011. Available online: https://www.fao.org/3/i2697e/i2697e.pdf (accessed on 6 November 2024).
  33. Jorissne, J.; Preifer, C.; Brautigam, K.R. Food waste generation at household level: Results of a survey among employees of two European research centers in Italy and Germany. Sustainability 2015, 7, 2695–2715. [Google Scholar] [CrossRef]
  34. Lipinski, B.; Hanson, C.; Waite, R.; Searchinger, T.; Lomax, J. Reducing Food Loss and Waste; World Resources Institute Working Paper; 2013. Available online: https://files.wri.org/d8/s3fs-public/reducing_food_loss_and_waste.pdf (accessed on 6 November 2024).
  35. Monier, V.; Mudgal, S.; Escalon, V.; O’Connor, C.; Gibon, T.; Andderson, G.; Morton, G. Final Report—Prepatory Study on Food Waste Across EU 27; European Commission: Paris, Italy, 2010. [Google Scholar]
  36. Parfitt, J.; Barthel, M.; Macnaughton, S. Food waste within supply chains: Quantification and potential for change to 2050. Philos. Trans. R. Soc. B Biol. Sci. 2010, 1554, 3065–3081. [Google Scholar] [CrossRef] [PubMed]
  37. Parry, A.; Bleazard, P.; Okawa, K. OECD Food, Agriculture and Fisheries Papers, No. 76; OECD Publishing: Paris, Italy, 2015. [Google Scholar] [CrossRef]
  38. Rutten, M.M.; Nowicki, P.L.; Bogaardt, M.J.; Aramyan, L.H. Reducing Food Waste by Households and in Retail in the EU: A Prioritization Using Economic, Land Use, and Food Security Impacts; LEI Wageningen UR: The Hague, The Netherlands, 2013; Available online: https://edepot.wur.nl/290135 (accessed on 5 November 2024).
  39. Stenmarck, A.; Jensen, C.; Quested, T.; Moates, G. Estimates of European Food Waste Levels; European Commission (FP7), Coordination and Support Action: Stockholm, Sweden, 2016. [Google Scholar]
  40. Food and Agriculture Organization of the United Nations. General Standard for the Labelling of Prepackaged Foods; Food and Agriculture Organization of the United Nations: Rome, Italy, 2018; Available online: https://www.fao.org/fao-who-codexalimentarius/sh-proxy/en/?lnk=1&url=https%253A%252F%252Fworkspace.fao.org%252Fsites%252Fcodex%252FStandards%252FCXS%2B1-1985%252FCXS_001e.pdf (accessed on 6 November 2024).
  41. Brandt, M.B.; Spease, C.J.; June, G.; Brown, A.M. Prevalence of food safety, quality, and other consumer statements on labels of processed, packaged foods. Food Prot. Trends 2014, 23, 870–871. [Google Scholar]
  42. Montagne, R.; Greene, D. Don’t Fear That Expired Food; National Public Radio: 26 December 2012. Available online: https://www.npr.org/sections/thesalt/2012/12/26/167819082/dont-fear-that-expired-food (accessed on 6 November 2024).
  43. Aitken, J.; Sprenger, A.; Alaybek, B.; Mika, G.; Hartman, H.; Leets, L.; Maese, E.; Davoodi, T. Surveys and Diaries and Scales, Oh My! A Critical Analysis of Household Food Waste Measurement. Sustainability 2024, 16, 968. [Google Scholar] [CrossRef]
  44. Centers for Disease Control and Prevention. National Outbreak Reporting System (NORS) . Available online: https://wwwn.cdc.gov/norsdashboard/ (accessed on 4 February 2022).
  45. Simonton, D.K. Significant samples: The psychological study of eminent individuals. Psychol. Methods 1999, 4, 425–451. [Google Scholar] [CrossRef]
  46. Kilic, G. State-level food waste policies in the U.S.: A predictive modeling. In Proceedings of the 2021 Agricultural & Applied Economics Association Annual Meeting, Austin, TX, USA, 1–3 August 2021. [Google Scholar]
  47. Hoover, D. Estimating Quantities and Types of Food Waste at the City Level. Natural Resources Defense Council Report. 2017. Available online: https://www.nrdc.org/sites/default/files/food-waste-city-level-report.pdf (accessed on 6 November 2024).
  48. Cohen, J. Statistical Power Analysis for the Behavioral Sciences, 2nd ed.; Erlbaum: Hillsdale, NJ, USA, 1988. [Google Scholar]
  49. Wilson, N.L.; Miao, R.; Weis, C.S. When in doubt, throw it out! The complicated decision to consume (or waste) food by date labels. Choices 2019, 34, 1–7. [Google Scholar]
  50. U.S. Congress. Food Date Labeling Act of 2021. 2021. Available online: https://www.congress.gov/bill/117th-congress/senate-bill/3324/text?q=%7B%22search%22%3A%5B%22food%22%2C%22food%22%5D%7D&r=9&s=2 (accessed on 6 November 2024).
  51. Wallnoefer, L.M.; Meixner, O.; Riefler, P. Look-smell-taste labels on food date marking: Assessing their effectiveness for reducing food waste at a consumer level as part of the European Green Deal. Food Qual. Prefer. 2024, 120, 105253. [Google Scholar] [CrossRef]
  52. National Academies of Sciences, Engineering, and Medicine. A National Strategy to Reduce Food Waste at the Consumer Level; The National Academies Press: Washington, DC, USA, 2020. [Google Scholar] [CrossRef]
  53. Aitken, J.A.; Alaybek, B.; Hartman, R.; Mika, G.; Broad Leib, E.M.; Plekenpol, R.; Branting, K.; Rao, D.; Leets, L.; Sprenger, A. Initial assessment of the efficacy of food recovery policies in US States for increasing food donations and reducing waste. Waste Manag. 2024, 176, 149–158. [Google Scholar] [CrossRef] [PubMed]
Figure 1. Allowable phrases in Alabama date label policy for meat. Note. In addition to these phrases, Alabama date label policy for meat includes the option to indicate a date without words.
Sustainability 17 02630 g001
Figure 2. Differences in foodborne illness rates of states with high versus low date label policy requirement over time. Note. DateLabelReq_2012 = The binary Label variable based on the 2012 policy snapshot. The “high” (vs. “low”) category includes those states that impose date label requirements for 2 or more food types.
Sustainability 17 02630 g002
Table 1. Effects of date label policy variables on food waste.
LabelSale Terminology
HighLowCohen’s dHighLowCohen’s dHighLowCohen’s d
MSDMSDMSDMSDMSDMSD
7.710.537.570.920.17 7.760.727.51.860.31 7.730.797.570.810.20
Note. N = 50 States. Label = Date label requirement, Sale = Sale restrictions past label date, Terminology = Specified terminology requirement, M = Mean of food waste in the respective policy level, SD = Standard deviation of food waste in the respective policy level. High (vs. low) category included the states with 2 or more food types for the Date variable and states with 1 or more food types for the Sale and Terminology variables. Food waste is expressed in cups.
Table 2. Effects of 2012 date label policy variables on foodborne illness, 2013 to 2018.
Foodborne Illness YearLabel Sale Terminology
HighLowCohen’s d HighLowCohen’s d HighLowCohen’s d
MSDMSDSt. (Robust)MSDMSDSt. (Robust)MSDMSDSt. (Robust)
20134.112.765.054.06−0.26 (−0.13)4.833.024.704.100.03 (0.18)3.953.075.163.96−0.33 (−0.27)
20144.704.094.483.870.06 (0.03)4.232.534.754.57−0.13 (0.13)4.223.104.724.29−0.13 (0.04)
20153.822.555.785.90−0.39 (−0.26)4.131.955.786.29−0.33 (−0.05)3.762.905.875.87−0.42 (−0.33)
20163.892.625.354.35−0.38 (−0.43)5.685.164.402.900.34 (0.31)4.362.665.164.44−0.21 (−0.02)
20174.393.604.153.790.07 (0.13)4.713.993.933.540.21 (0.24)3.863.394.413.88−0.15 (−0.09)
201811.6723.734.293.410.56 (0.29)9.6721.764.794.550.36 (0.18)5.706.057.1416.60−0.10 (0.04)
Note. N = 50 States. Label = Date label requirement, Sale = Sale restrictions past label date, Terminology = Specified terminology requirement, MSW = Municipal solid waste, M = Mean, SD = Standard deviation. High (vs. low) category included the states with 2 or more food types for the Date Label Requirement variable and states with 1 or more food types for the Sale Restriction After Date and Standardized Terminology Requirement variables. Primary Cohen’s d cell entries are standard Cohen’s d values, while parenthetical values are outlier-resistant (i.e., robust) Cohen’s d values. Both were calculated using the “psych” R package.
Disclaimer/Publisher’s Note: The statements, opinions and data contained in all publications are solely those of the individual author(s) and contributor(s) and not of MDPI and/or the editor(s). MDPI and/or the editor(s) disclaim responsibility for any injury to people or property resulting from any ideas, methods, instructions or products referred to in the content.

