

Sustainable Development Through Dynamic Emergency Evacuation Signage: A BIM- and VR-Based Analysis of Passenger Behavior


Abstract
1. Introduction
2. Methods
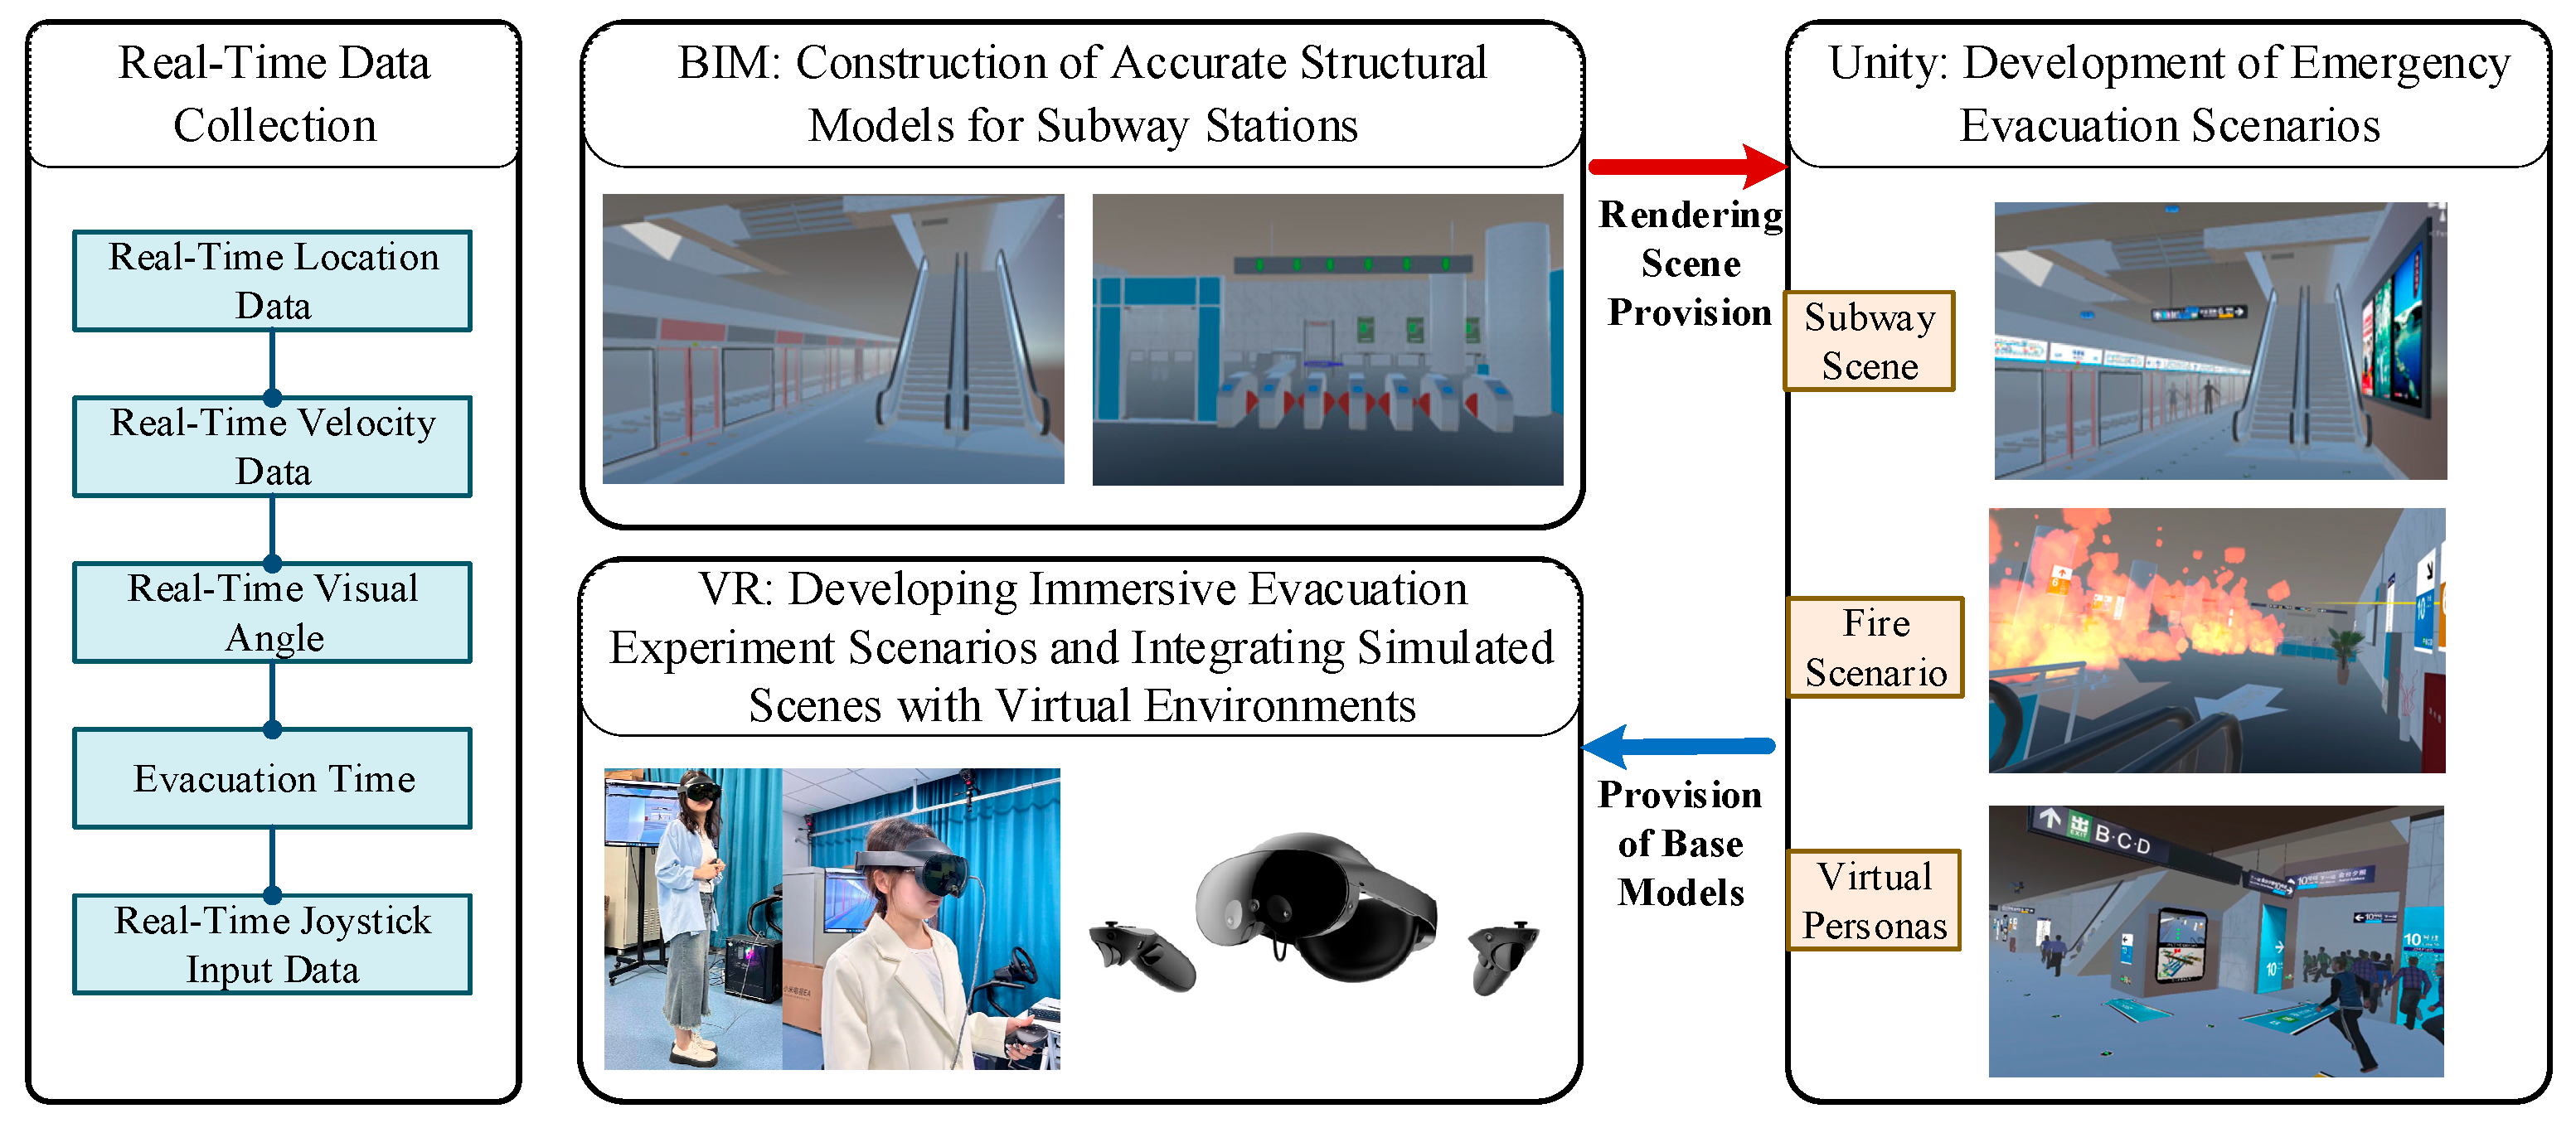
2.1. Experimental Platform
2.2. Scenario Design
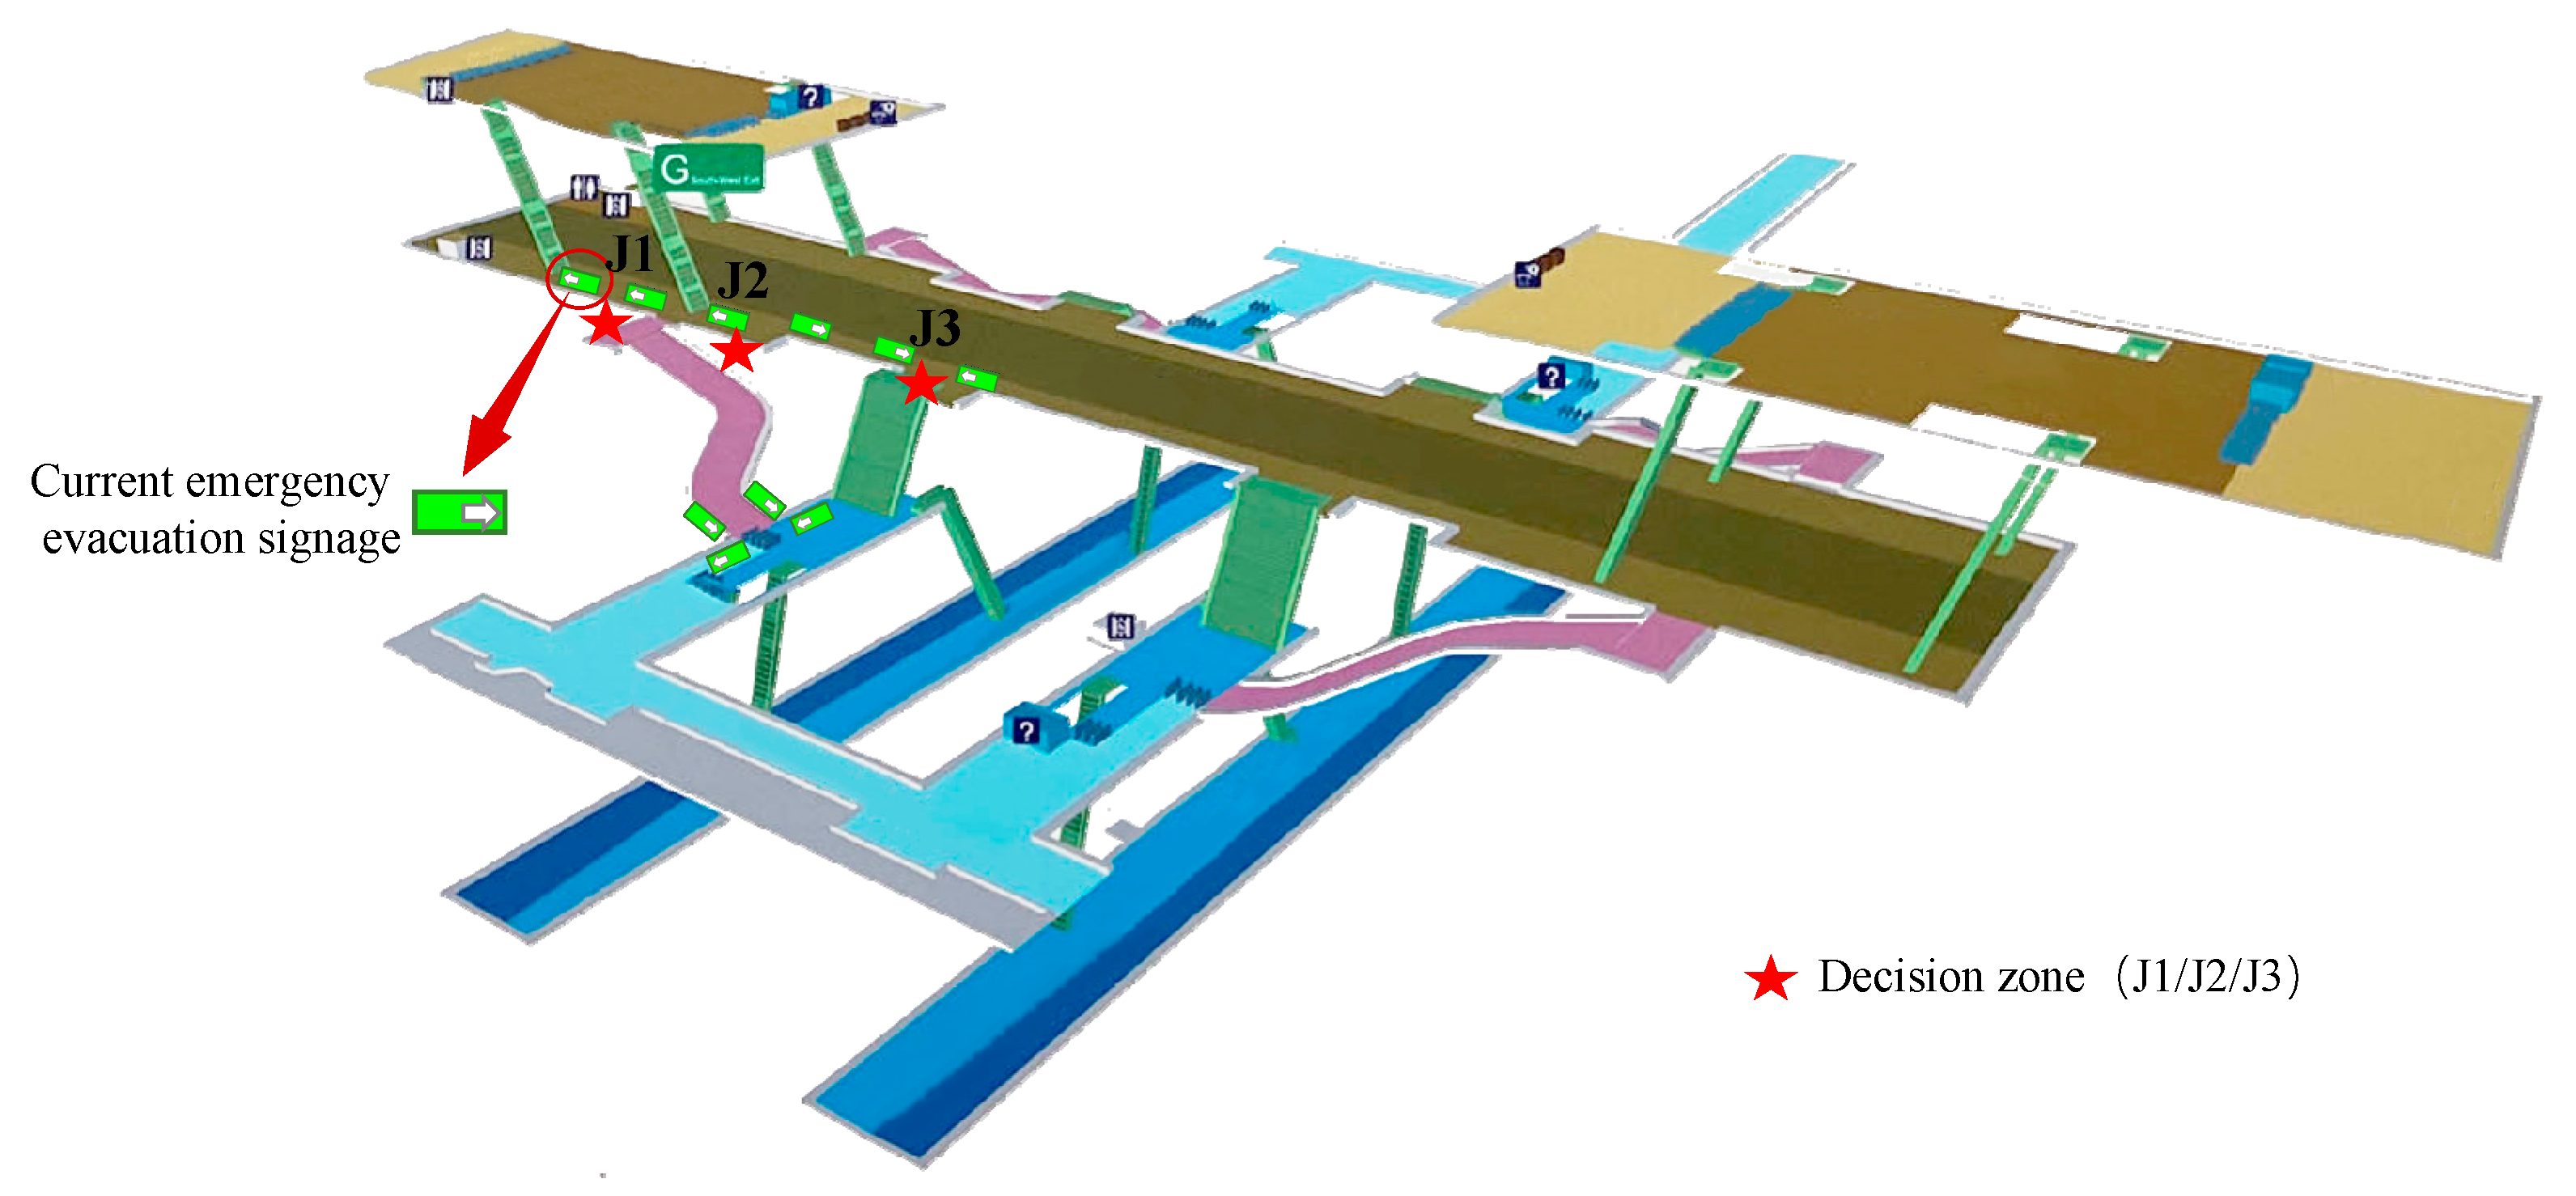
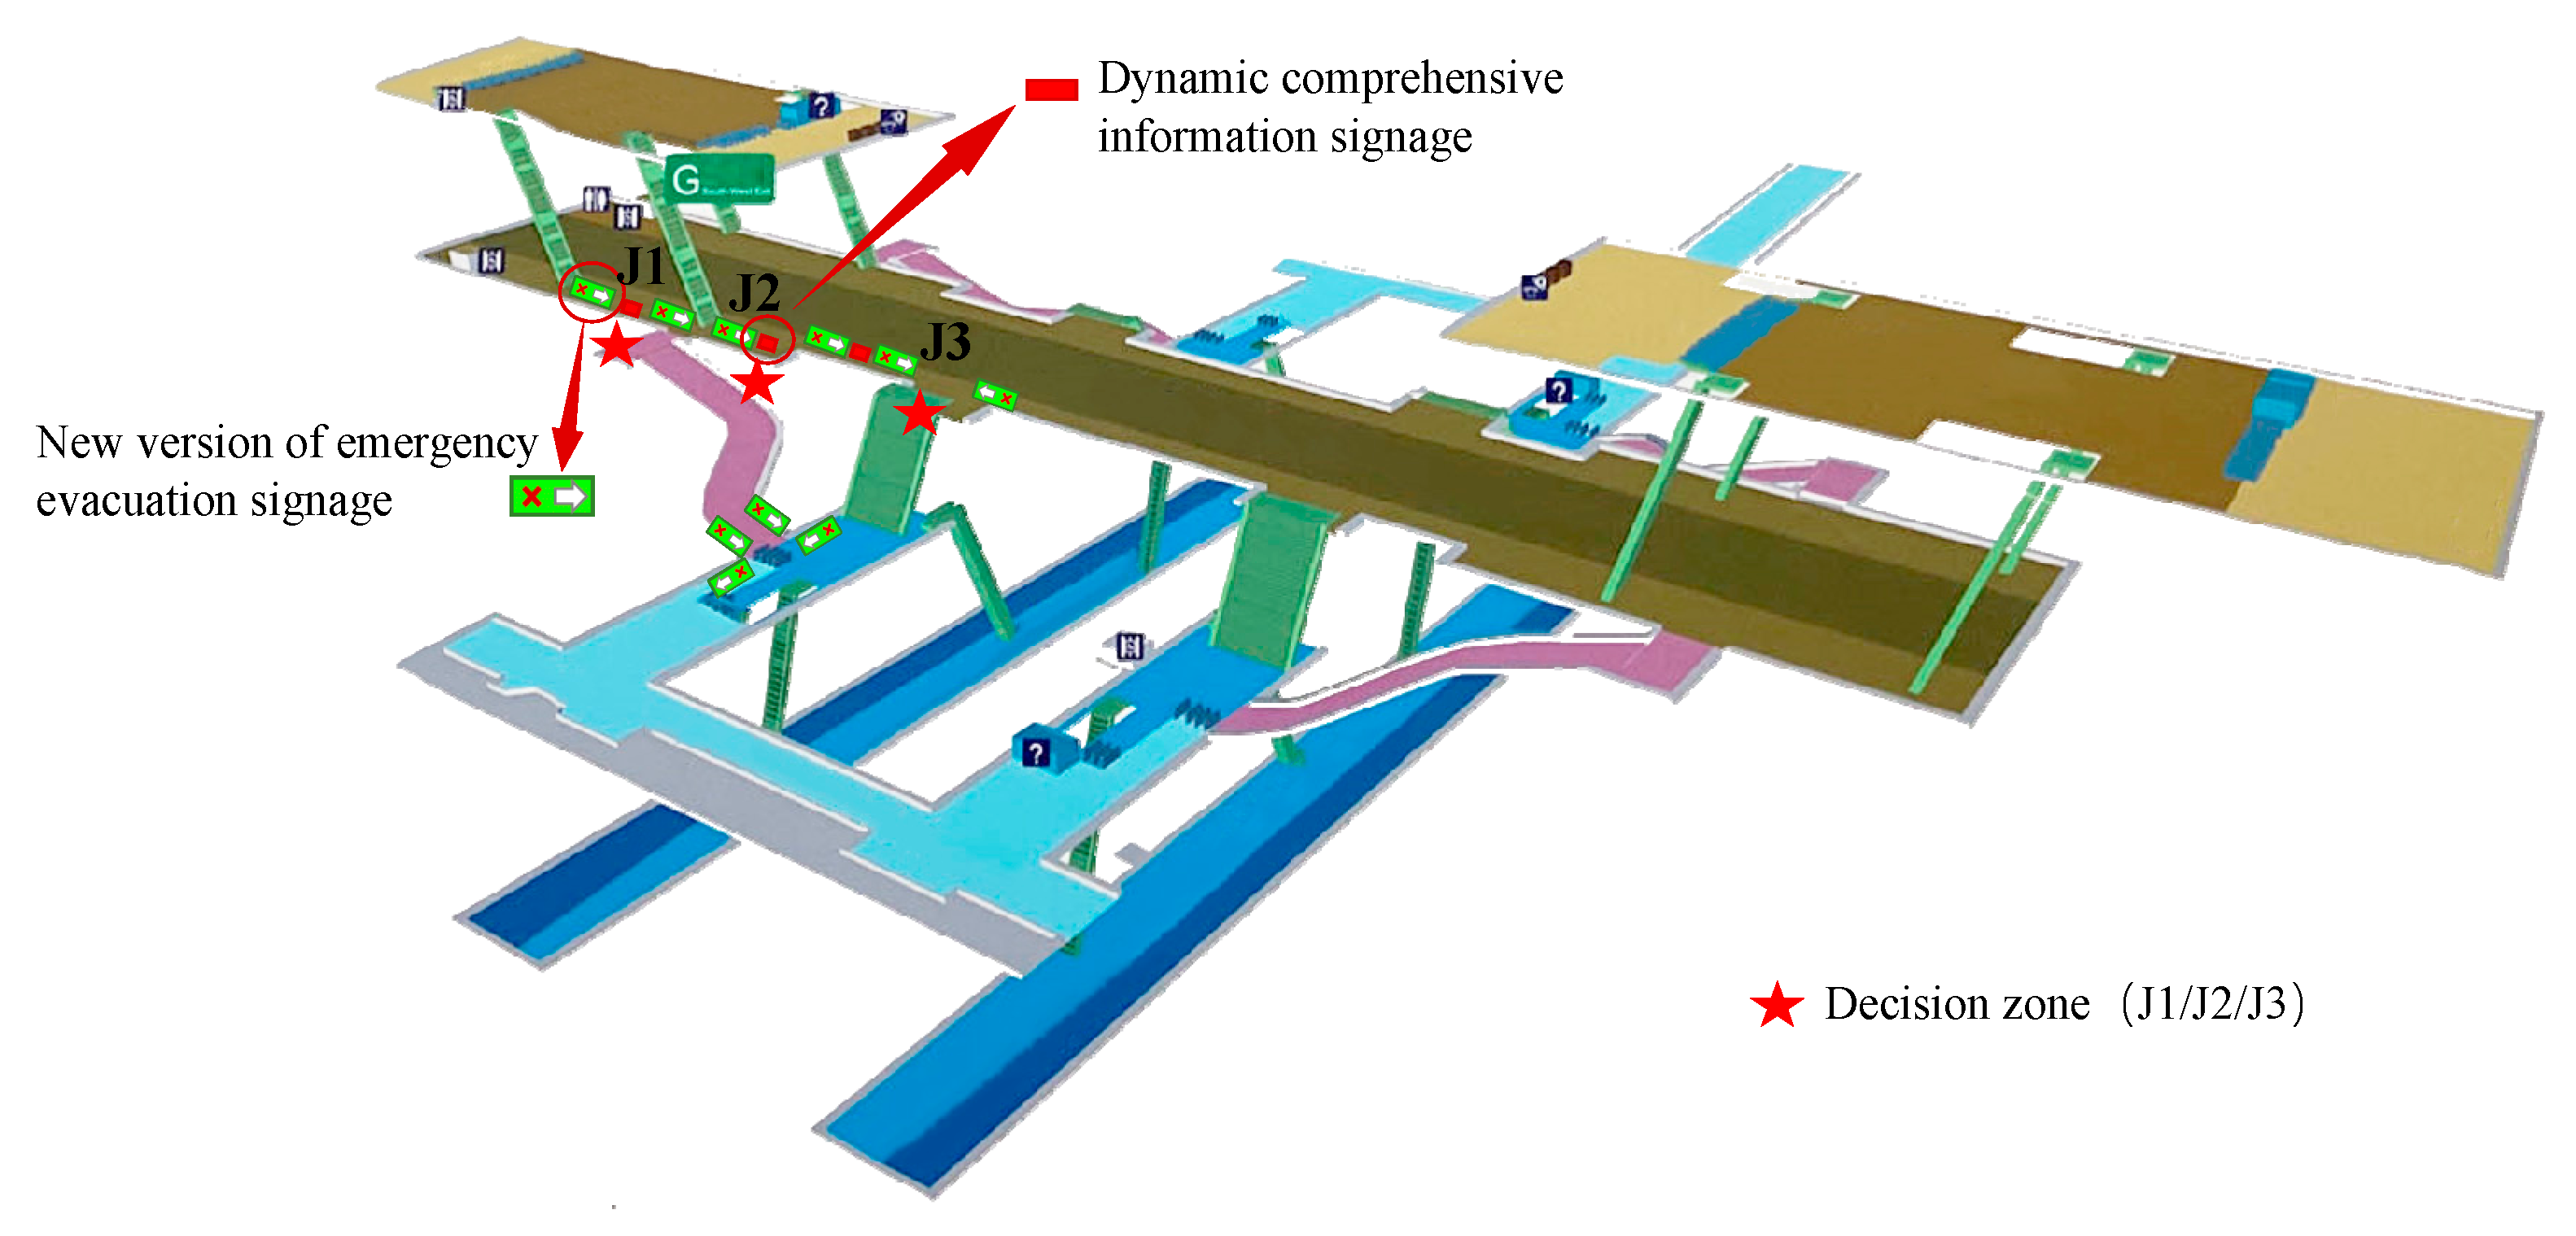
2.2.1. Design of the Emergency Evacuation Signage System
2.2.2. Crowd Flow State Design
2.2.3. Route Design
2.3. Participants
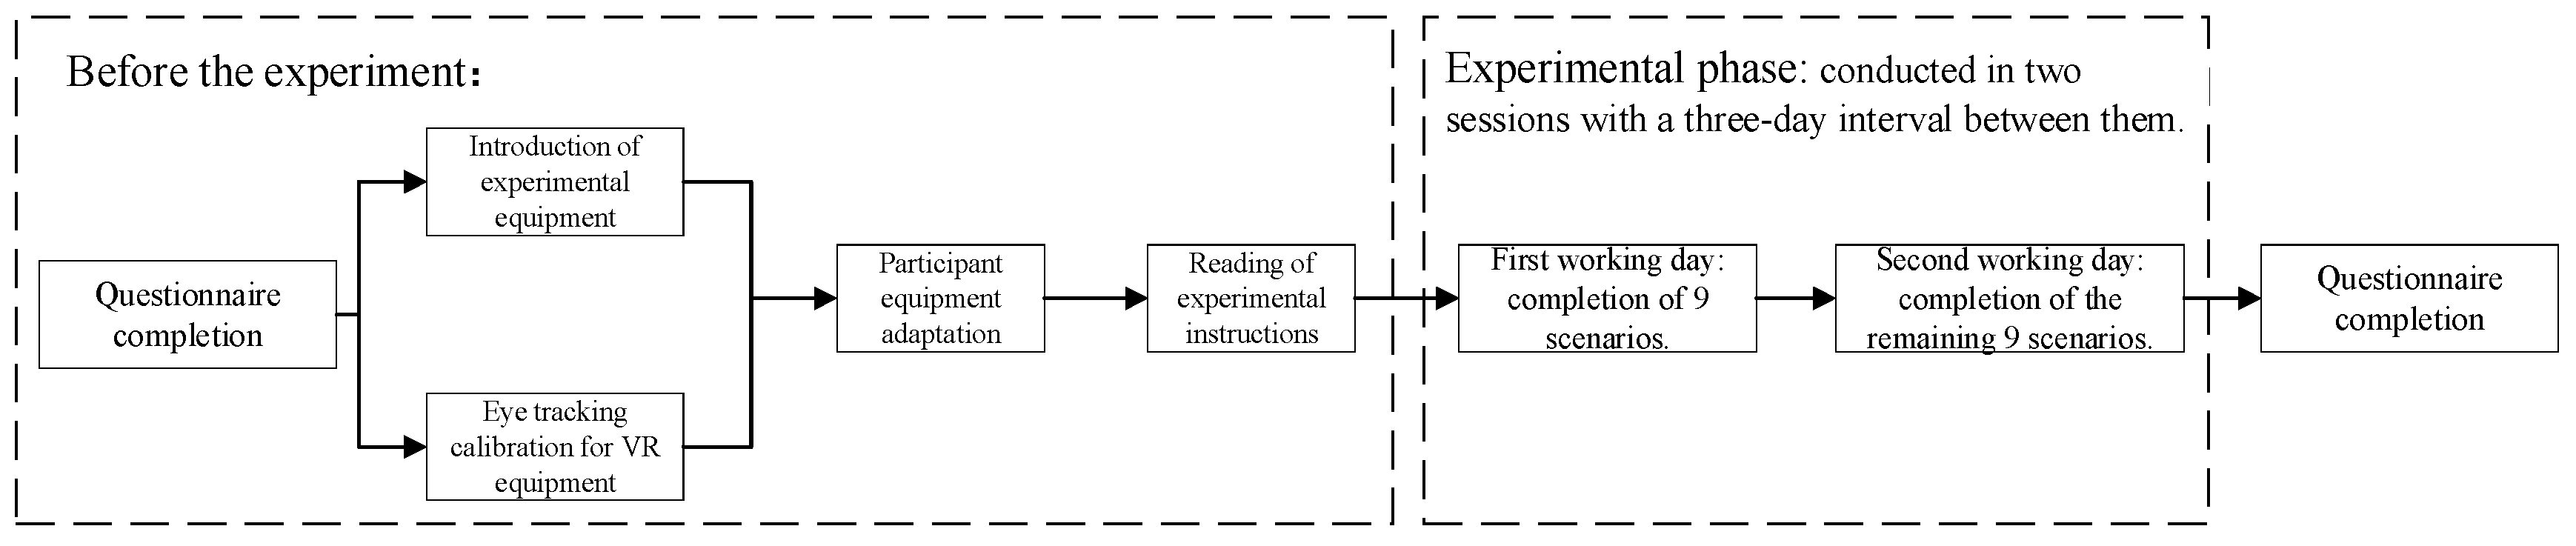
2.4. Experimental Procedure
2.5. Data Processing
2.6. Index Extraction
2.6.1. Evacuation Efficiency
2.6.2. Wayfinding Process
2.7. Data Analysis Methods
3. Results and Discussion
3.1. Descriptive Statistics
3.2. Results of the Generalized Estimation Equation
3.2.1. Model Effect Analysis
3.2.2. Parameter Estimation Analysis
4. Conclusions
Author Contributions
Funding
Institutional Review Board Statement
Informed Consent Statement
Data Availability Statement
Conflicts of Interest
References
- Liu, W.; Wu, X.; Zhang, L.; Wang, Y. Probabilistic analysis of tunneling-induced building safety assessment using a hybrid FE-copula model. Struct. Infrastruct. Eng. 2018, 14, 1065–1081. [Google Scholar] [CrossRef]
- Zhou, Y.; Cheng, X.; Zhu, L.; Qin, T.; Dong, W.; Liu, J. How does gender affect indoor wayfinding under time pressure? Cartogr. Geogr. Inf. Sci. 2020, 47, 367–380. [Google Scholar] [CrossRef]
- Giachetti, B.; Couton, D.; Plourde, F. Smoke spreading analysis from an experimental subway scale model. Fire Saf. J. 2016, 86, 75–82. [Google Scholar] [CrossRef]
- Giannopoulos, I.; Kiefer, P.; Raubal, M.; Richter, K.F.; Thrash, T. Wayfinding decision situations: A conceptual model and evaluation. In Geographic Information Science, Proceedings of the 8th International Conference, GIScience 2014; Vienna, Austria, 24–26 September 2014, Springer International Publishing: Berlin/Heidelberg, Germany, 2014; pp. 221–234. [Google Scholar]
- Jeon, G.Y.; Na, W.J.; Hong, W.H.; Lee, J.K. Influence of design and installation of emergency exit signs on evacuation speed. J. Asian Archit. Build. Eng. 2019, 18, 104–111. [Google Scholar] [CrossRef]
- Ding, N. The effectiveness of evacuation signs in buildings based on eye tracking experiment. Nat. Hazards 2020, 103, 1201–1218. [Google Scholar] [CrossRef]
- Nilsson, D.; Frantzich, H.; Saunders, W. Coloured flashing lights to mark emergency exits-experiences from evacuation experiments. Fire Saf. Sci. 2005, 8, 569–579. [Google Scholar] [CrossRef]
- Kubota, J.; Sano, T.; Ronchi, E. Assessing the compliance with the direction indicated by emergency evacuation signage. Saf. Sci. 2021, 138, 105210. [Google Scholar] [CrossRef]
- Olander, J.; Ronchi, E.; Lovreglio, R.; Nilsson, D. Dissuasive exit signage for building fire evacuation. Appl. Ergon. 2017, 59, 84–93. [Google Scholar] [CrossRef]
- Galea, E.R.; Xie, H.; Cooney, D.; Filippidis, L. Active dynamic signage system: A full-scale evacuation trial. In Proceedings of the 6th International Symposium 2015, Victoria, BC, Canada, 8–12 June 2015. [Google Scholar]
- Filippidis, L.; Xie, H.; Galea, E.R.; Lawrence, P.J. Exploring the potential effectiveness of dynamic and static emergency exit signage in complex spaces through simulation. Fire Saf. J. 2021, 125, 103404. [Google Scholar] [CrossRef]
- Zhu, Y.; Chen, T.; Ding, N.; Chraibi, M.; Fan, W.-C. Follow the evacuation signs or surrounding people during building evacuation, an experimental study. Phys. A Stat. Mech. Its Appl. 2020, 560, 125156. [Google Scholar] [CrossRef]
- Zhu, Y.; Chen, T.; Ding, N.; Chraibi, M.; Fan, W.-C. Follow people or signs? A novel way-finding method based on experiments and simulation. Phys. A Stat. Mech. Its Appl. 2021, 573, 125926. [Google Scholar] [CrossRef]
- Shi, M.; Zhang, Z.; Zhang, W.; Ma, Y.; Li, H.; Lee, E.W. The study of self-organised behaviours and movement pattern of pedestrians during fire evacuations: Virtual experiments and survey. Saf. Sci. 2024, 170, 106373. [Google Scholar] [CrossRef]
- Feng, Z.; González, V.A.; Amor, R.; Lovreglio, R.; Cabrera-Guerrero, G. Immersive virtual reality serious games for evacuation training and research: A systematic literature review. Comput. Educ. 2018, 127, 252–266. [Google Scholar] [CrossRef]
- Fu, M.; Liu, R.; Zhang, Y. Why do people make risky decisions during a fire evacuation? Study on the effect of smoke level, individual risk preference, and neighbor behavior. Saf. Sci. 2021, 140, 105245. [Google Scholar] [CrossRef]
- Galea, E.R.; Xie, H.; Deere, S.; Cooney, D.; Filippidis, L. Evaluating the effectiveness of an improved active dynamic signage system using full scale evacuation trials. Fire Saf. J. 2017, 91, 908–917. [Google Scholar] [CrossRef]
- Feng, Z. Research on Optimal Design of Emergency Sign System in Subway Environment. Master’s Thesis, China University of Mining and Technology, Xuzhou, China, 2020. [Google Scholar]
- Ronchi, E.; Nilsson, D.; Kojić, S.; Eriksson, J.; Lovreglio, R.; Modig, H.; Walter, A.L. A virtual reality experiment on flashing lights at emergency exit portals for road tunnel evacuation. Fire Technol. 2016, 52, 623–647. [Google Scholar] [CrossRef]
- Lerman, J. Study design in clinical research: Sample size estimation and power analysis. Can. J. Anaesth. 1996, 43, 184–191. [Google Scholar] [CrossRef]
- Chow, S.C.; Shao, J.; Wang, H.; Lokhnygina, Y. Sample Size Calculations in Clinical Research; CRC Press: Boca Raton, FL, USA, 2017. [Google Scholar]
- D’orazio, M.; Bernardini, G.; Tacconi, S.; Arteconi, V.; Quagliarini, E. Fire safety in Italian-style historical theatres: How photoluminescent wayfinding can improve occupants’ evacuation with no architecture modifications. J. Cult. Herit. 2016, 19, 492–501. [Google Scholar] [CrossRef]
- Balboa, A.; González-Villa, J.; Cuesta, A.; Abreu, O.; Alvear, D. Testing a real-time intelligent evacuation guiding system for complex buildings. Saf. Sci. 2020, 132, 104970. [Google Scholar] [CrossRef]
- Li, Y. The Influence and Improvement of Guidance Sign and Congestion Degree on Indoor Pathfinding Performance. Master’s Thesis, Shaanxi Normal University, Chang’an, China, 2022. [Google Scholar]
- Piegorsch, W.; Bailer, A. Generalized Linear Models. In Statistics for Environmental Biology and Toxicology; Routledge: Oxfordshire, UK, 2005. [Google Scholar]
- Ali, Y.; Zheng, Z.; Haque, M. Connectivity’s impact on mandatory lane-changing behaviour: Evidences from a driving simulator study. Transp. Res. Part C Emerg. Technol. 2018, 93, 292–309. [Google Scholar] [CrossRef]
- Bernardini, G.; Lovreglio, R.; Quagliarini, E.; D’Orazio, M. Can active and passive wayfinding systems support fire evacuation in buildings? Insights from a virtual reality-based experiment. J. Build. Eng. 2023, 74, 106778. [Google Scholar] [CrossRef]


| Emergency Evacuation Signage System | Design Elements | |||
|---|---|---|---|---|
| Dissuasion Format | Flashing Frequency | Auxiliary Information | ||
| Dynamic Comprehensive Information Signage | Broadcast | |||
| Current Signage System | - | - | - | - |
 Wall-type and ground-type static emergency evacuation signage | ||||
| New Dynamic Signage System | Red X symbol | 2 Hz | Current location and current direction of movement | Emergency notice: A fire has occurred in the subway station. Please follow the emergency evacuation signs and evacuate immediately. |

 Wall-type and ground-type dynamic emergency evacuation signage (with flashing) 
 Dynamic comprehensive information signage Broadcast | ||||
| Current Signage System (Placement as Shown in Figure 3) | New Dynamic Signage System (Placement as Shown in Figure 4) | |
|---|---|---|
| Crowd Condition 5:5 | Scenario 1 | Scenario 2 |
| Crowd Condition 2:8 | Scenario 3 | Scenario 4 |
| Factor | Level | |
|---|---|---|
| Signage System | New Dynamic Signage System | |
| Current Signage System | ||
| Crowd Condition | 2:8 | |
| 5:5 | ||
| Passenger attribute | Gender | Female |
| Male | ||
| Age | Age (≥50 years) | |
| Age (41–50 years) | ||
| Age (31–40 years) | ||
| Age (18–30 years) | ||
| Subway Riding Frequency | Frequency (more than 6 times per week) | |
| Frequency (3–6 times per week) | ||
| Frequency (1–2 times per week) | ||
| Frequency (rarely rides) | ||
| Number of Emergency Events Experienced | Experienced Events (more than 2 times) | |
| Experienced Events (1–2 times) | ||
| Experienced Events (0 times) | ||
| Number of Evacuation Drills | Evacuation Drills (more than 2 times) | |
| Evacuation Drills (1–2 times) | ||
| Evacuation Drills (0 times) | ||
| Spatial Ability Level | Spatial Ability Level (High) | |
| Spatial Ability Level (Medium) | ||
| Spatial Ability Level (Low) | ||
| Dimension | Indicator | Signage System | Mean (Standard Deviation) | Statistical Chart | |
|---|---|---|---|---|---|
| 5:5 | 2:8 | ||||
| Evacuation efficiency | Evacuation time (s) | Current Signage System | 44.52 (8.63) | 54.13 (17.13) | 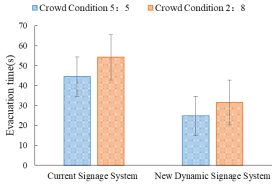 |
| New Dynamic Signage System | 24.75 (7.76) | 31.50 (7.61) | |||
| Evacuation distance (m) | Current Signage System | 78.41 (7.85) | 87.90 (29.95) | 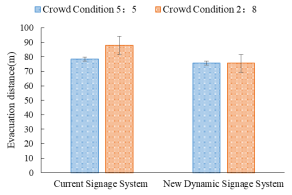 | |
| New Dynamic Signage System | 75.63 (8.72) | 75.56 (13.27) | |||
| Average speed (m/s) | Current Signage System | 2.89 (0.31) | 2.75 (0.28) |  | |
| New Dynamic Signage System | 2.97 (0.35) | 3.01 (0.39) | |||
| Wayfinding process | Number of direction recognitions | Current Signage System | 5.97 (3.10) | 1.8 (1.47) | 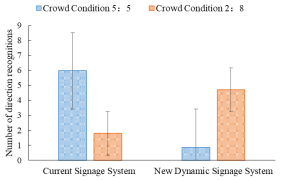 |
| New Dynamic Signage System | 0.86 (1.12) | 4.71 (1.78) | |||
| Number of stops | Current Signage System | 2.71 (2.42) | 4 (2.91) | 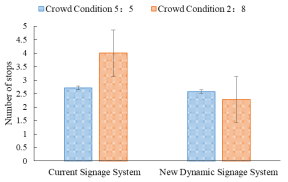 | |
| New Dynamic Signage System | 2.57 (2.74) | 2.28 (2.06) | |||
| Dwell time(s) | Current Signage System | 1.44 (2.56) | 3.59 (4.11) | 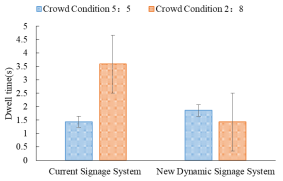 | |
| New Dynamic Signage System | 1.86 (2.99) | 1.43 (1.82) | |||
| Number of errors made | Current Signage System | 1.14 (0.79) | 1.51 (0.93) |  | |
| New Dynamic Signage System | 0.4 (0.59) | 0.34 (0.71) | |||
| Factor | Evacuation Efficiency | Wayfinding Process | |||||||||||||
|---|---|---|---|---|---|---|---|---|---|---|---|---|---|---|---|
| Evacuation Time (s) | Evacuation Distance (m) | Average Speed (m/s) | Number of Direction Recognitions | Number of Stops | Dwell Time (s) | Number of Errors Made | |||||||||
| Wald | Sig. | Wald | Sig. | Wald | Sig. | Wald | Sig. | Wald | Sig. | F | Sig. | F | Sig. | ||
| Signage System | 171.07 | 0.000 *** | 6.84 | 0.009 *** | 7.57 | 0.006 *** | 12.96 | 0.000 *** | 4.31 | 0.038 ** | 4.56 | 0.033 ** | 47.38 | 0.000 *** | |
| Crowd Condition | 27.48 | 0.000 *** | 2.71 | 0.100 | 1.44 | 0.231 | 0.35 | 0.555 | 3.14 | 0.076 * | 10.26 | 0.001 *** | 1.79 | 0.181 | |
| Passenger attribute | Gender | 0.66 | 0.414 | 6.38 | 0.012 ** | 0.11 | 0.742 | 0.39 | 0.528 | 0.12 | 0.727 | 3.07 | 0.080 * | 2.13 | 0.145 |
| Gender | 12.16 | 0.007 *** | 1.62 | 0.654 | 1.52 | 0.678 | 8.16 | 0.043 ** | 0.54 | 0.910 | 13.09 | 0.004 *** | 3.40 | 0.334 | |
| Subway Riding Frequency | 4.79 | 0.187 | 5.30 | 0.151 | 1.57 | 0.665 | 5.31 | 0.151 | 0.15 | 0.986 | 15.79 | 0.001 *** | 14.56 | 0.002 *** | |
| Number of Emergency Events Experienced | 4.42 | 0.110 | 7.36 | 0.025 ** | 0.11 | 0.947 | 0.28 | 0.870 | 0.38 | 0.828 | 3.15 | 0.207 | 8.43 | 0.015 ** | |
| Number of Evacuation Drills | 5.15 | 0.076 * | 8.67 | 0.013 ** | 0.14 | 0.933 | 2.37 | 0.306 | 0.09 | 0.953 | 3.63 | 0.163 | 13.07 | 0.001 *** | |
| Spatial Ability Level | 5.25 | 0.072 * | 0.71 | 0.703 | 2.87 | 0.238 | 5.58 | 0.061 * | 0.12 | 0.944 | 13.11 | 0.001 *** | 0.23 | 0.893 | |
| Signage System × Crowd Condition | 0.75 | 0.386 | 2.75 | 0.097 * | 3.49 | 0.062 * | 132.71 | 0.000 *** | 7.99 | 0.005 *** | 8.26 | 0.004 *** | 3.10 | 0.078 * | |
| Evacuation Efficiency | Wayfinding Process | |||||||||||||
|---|---|---|---|---|---|---|---|---|---|---|---|---|---|---|
| Evacuation Time (s) | Evacuation Distance (m) | Average Speed (m/s) | Number of Direction Recognitions | Number of Stops | Dwell Time (s) | Number of Errors Made | ||||||||
| Parameter | B | Sig. | B | Sig. | B | Sig. | B | Sig. | B | Sig. | B | Sig. | B | Sig. |
| Intercept | 51.850 | 0.000 *** | 84.777 | 0.000 *** | 2.475 | 0.000 *** | 9.439 | 0.000 *** | 4.227 | 0.705 | 1.943 | 0.530 | 0.825 | 0.004 *** |
| New Dynamic Signage System | −19.766 | 0.000 *** | −2.779 | 0.111 | 0.073 | 0.230 | −5.114 | 0.000 *** | −0.143 | 0.782 | 0.429 | 0.407 | −0.743 | 0.000 *** |
| Current Signage System | 0 a | - | 0 a | 0 a | 0 a | 0 a | 0 a | 0 a | ||||||
| Crowd Condition 2:8 | 9.611 | 0.001 *** | 9.497 | 0.064 * | −0.142 | 0.006 ** | −4.171 | 0.000 *** | 1.286 | 0.004 *** | 2.154 | 0.000 *** | 0.371 | 0.050 ** |
| Crowd Condition 5:5 | 0 a | - | 0 a | 0 a | 0 a | 0 a | 0 a | 0 a | ||||||
| Female | 1.720 | 0.414 | −14.481 | 0.012 ** | −0.038 | 0.742 | −0.224 | 0.528 | 0.825 | 0.727 | 2.024 | 0.080 * | −0.222 | 0.145 |
| Male | 0 a | - | 0 a | 0 a | 0 a | 0 a | 0 a | 0 a | ||||||
| Age (≥50 years) | 13.987 | 0.007 *** | −6.614 | 0.503 | −0.316 | 0.300 | 1.526 | 0.048 ** | −1.733 | 0.776 | 1.450 | 0.428 | 0.181 | 0.655 |
| Age (41–50 years) | 4.902 | 0.007 *** | −14.866 | 0.331 | −0.091 | 0.691 | 0.774 | 0.013 ** | 2.808 | 0.532 | 11.823 | 0.030 ** | −0.477 | 0.113 |
| Age (31–40 years) | 6.116 | 0.309 | −7.210 | 0.596 | 0.099 | 0.758 | −0.567 | 0.654 | −0.830 | 0.888 | 13.007 | 0.004 *** | 0.256 | 0.467 |
| Age (18–30 years) | 0 a | - | 0 a | 0 a | 0 a | 0 a | 0 a | 0 a | ||||||
| Frequency (more than 6 times per week) | −2.753 | 0.708 | 5.873 | 0.813 | 0.468 | 0.309 | −2.869 | 0.088 * | −0.451 | 0.972 | 12.548 | 0.020 ** | 0.626 | 0.289 |
| Frequency (3–6 times per week) | −8.203 | 0.137 | 15.271 | 0.291 | 0.383 | 0.216 | −2.207 | 0.114 | −1.711 | 0.850 | 15.516 | 0.001 *** | 0.888 | 0.004 *** |
| Frequency (1–2 times per week) | −4.991 | 0.380 | 3.319 | 0.764 | 0.270 | 0.401 | −1.000 | 0.442 | −1.955 | 0.799 | 14.119 | 0.002 *** | 0.501 | 0.137 |
| Frequency (rarely rides) | 0 a | - | 0 a | 0 a | 0 a | 0 a | 0 a | 0 a | ||||||
| Experienced Events (more than 2 times) | 3.040 | 0.366 | 14.751 | 0.394 | −0.114 | 0.756 | 0.312 | 0.637 | −3.634 | 0.549 | 3.158 | 0.696 | 0.224 | 0.533 |
| Experienced Events (1–2 times) | −3.602 | 0.247 | −27.941 | 0.023 ** | −0.067 | 0.822 | 0.055 | 0.950 | 0.528 | 0.929 | 3.710 | 0.076 * | −0.863 | 0.006 *** |
| Experienced Events (0 times) | 0 a | - | 0 a | 0 a | 0 a | 0 a | 0 a | 0 a | ||||||
| Evacuation Drills (more than 2 times) | −4.698 | 0.037 ** | −38.995 | 0.004 *** | 0.128 | 0.712 | 0.499 | 0.300 | −1.055 | 0.826 | −1.806 | 0.372 | −0.786 | 0.000 *** |
| Evacuation Drills (1–2 times) | −0.116 | 0.956 | −10.700 | 0.195 | 0.008 | 0.944 | −0.151 | 0.714 | 0.394 | 0.869 | 2.100 | 0.103 | −0.291 | 0.098 * |
| Evacuation Drills (0 times) | 0 a | - | 0 a | 0 a | 0 a | 0 a | 0 a | 0 a | ||||||
| Spatial Ability Level (High) | −1.556 | 0.726 | 9.127 | 0.559 | 0.050 | 0.858 | −1.786 | 0.167 | −0.890 | 0.888 | −19.656 | 0.000 *** | 0.099 | 0.722 |
| Spatial Ability Level (Medium) | −6.345 | 0.185 | −0.903 | 0.910 | 0.257 | 0.366 | −2.515 | 0.052 * | −0.118 | 0.986 | −18.306 | 0.000 *** | 0.010 | 0.966 |
| Spatial Ability Level (Low) | 0 a | - | 0 a | 0 a | 0 a | 0 a | 0 a | 0 a | ||||||
| New Dynamic Signage System × 2:8 | −2.863 | 0.386 | −9.563 | 0.097 * | 0.185 | 0.062 * | 8.029 | 0.000 *** | −1.571 | 0.005 *** | −2.589 | 0.004 *** | −0.429 | 0.078 * |
| New Dynamic Signage System × 5:5 | 0 a | - | 0 a | 0 a | 0 a | 0 a | 0 a | 0 a | ||||||
| Current Signage System × 2:8 | 0 a | - | 0 a | 0 a | 0 a | 0 a | 0 a | 0 a | ||||||
| Current Signage System × 5:5 | 0 a | - | 0 a | 0 a | 0 a | 0 a | 0 a | 0 a | ||||||
| Scale | 913.240 | 363.800 | 0.718 | 3.880 | 31.259 | 14.805 | 0.626 | |||||||
Disclaimer/Publisher’s Note: The statements, opinions and data contained in all publications are solely those of the individual author(s) and contributor(s) and not of MDPI and/or the editor(s). MDPI and/or the editor(s) disclaim responsibility for any injury to people or property resulting from any ideas, methods, instructions or products referred to in the content. |
© 2025 by the authors. Licensee MDPI, Basel, Switzerland. This article is an open access article distributed under the terms and conditions of the Creative Commons Attribution (CC BY) license (https://creativecommons.org/licenses/by/4.0/).
Share and Cite
Zhao, X.; Bian, Y.; Zhao, X.; Zhang, Y. Sustainable Development Through Dynamic Emergency Evacuation Signage: A BIM- and VR-Based Analysis of Passenger Behavior. Sustainability 2025, 17, 2626. https://doi.org/10.3390/su17062626
Zhao X, Bian Y, Zhao X, Zhang Y. Sustainable Development Through Dynamic Emergency Evacuation Signage: A BIM- and VR-Based Analysis of Passenger Behavior. Sustainability. 2025; 17(6):2626. https://doi.org/10.3390/su17062626
Chicago/Turabian StyleZhao, Xuena, Yang Bian, Xiaohua Zhao, and Yu Zhang. 2025. "Sustainable Development Through Dynamic Emergency Evacuation Signage: A BIM- and VR-Based Analysis of Passenger Behavior" Sustainability 17, no. 6: 2626. https://doi.org/10.3390/su17062626
APA StyleZhao, X., Bian, Y., Zhao, X., & Zhang, Y. (2025). Sustainable Development Through Dynamic Emergency Evacuation Signage: A BIM- and VR-Based Analysis of Passenger Behavior. Sustainability, 17(6), 2626. https://doi.org/10.3390/su17062626