Hypothesis

A Sustainable Approach to Boost Resilience in Fast-Moving Consumer Goods: The Critical Role of Suppliers and Transportation Capacity Explored Through PLS-SEM and NCA

School of Economics and Management, Chang’an University, Xi’an 710064, China
*
Author to whom correspondence should be addressed.
Sustainability 2025, 17(6), 2625; https://doi.org/10.3390/su17062625
Submission received: 15 February 2025 / Revised: 7 March 2025 / Accepted: 10 March 2025 / Published: 17 March 2025
(This article belongs to the Special Issue Supply Chain Management in a Sustainable Business Environment)

Abstract

:
Supply chain resilience (SRES) is essential for firms aiming to alleviate the impact of interruptions and maintain operational continuity and sustainability in performance. In the context of the FMCG industries of Pakistan and Saudi Arabia, characterized by intricate and vulnerable supply chains, there exists an urgent necessity for solutions that bolster resilience. This study examines the influence of critical factors resilient suppliers (RS), transportation capacity (TC), flexibility (FLEX), network complexity (NC), and supply chain dynamism (SPD) on SRES. A quantitative methodology was utilized, examining survey data from 611 participants with Partial Least Squares Structural Equation Modeling (PLS-SEM) and Necessary Condition Analysis (NCA). The results indicate that RS and TC are essential for directly improving SRES, whereas FLEX and SPD facilitate increased adaptability and reactivity. The NCA emphasizes the need to control NC to avert bottlenecks that may impede resilience. This study indicates that SRES emerges from the dynamic interplay of several elements, rather than from separate enhancements. Although NC exerts a negligible direct influence, adeptly managing complexity is crucial for reducing disruptions and inefficiencies. The results underscore that fortifying RS, TC, and FLEX in unison improves resilience and adaptation to market volatility and disturbances. This study provides various theoretical and managerial insights. A systems theory approach highlights the interdependence of supply chain components, whereas the Theory of Constraints (TOC) posits that excessive NC can hinder resilience. Management should concentrate on maximizing RS and TC until declining returns are evident, thereafter redirecting efforts towards improving FLEX and minimizing NC. Furthermore, optimizing processes and facilitating swift decision-making are essential for maintaining resilience.

1. Introduction

Risk arises from the intricacy of the supply chain, the state of the markets, and outside factors. These factors that pose a danger to global supply chain sustainability include trade disputes involving China, the U.S., and Europe; the impact of COVID-19; conflicts between Ukraine and Russia; and the ongoing issue of global warming [1]. These factors can disrupt supply chains, leading to material shortages, delays, and significant impacts on supply chain performance. In turn, these disruptions emphasize the need for supply chain resilience—the ability to recover quickly, adapt, and continue delivering value despite challenges [2].
The Fast-Moving Consumer Goods (FMCG) sector is anticipated to expand at a Compound Annual Growth Rate (CAGR) of 5.4% from 2018 to 2025, accompanied by a significant growth in marketing expenditures, forecasted to increase from $58 billion in 2022 to $138 billion by 2027 [3,4]. According to Kenton [
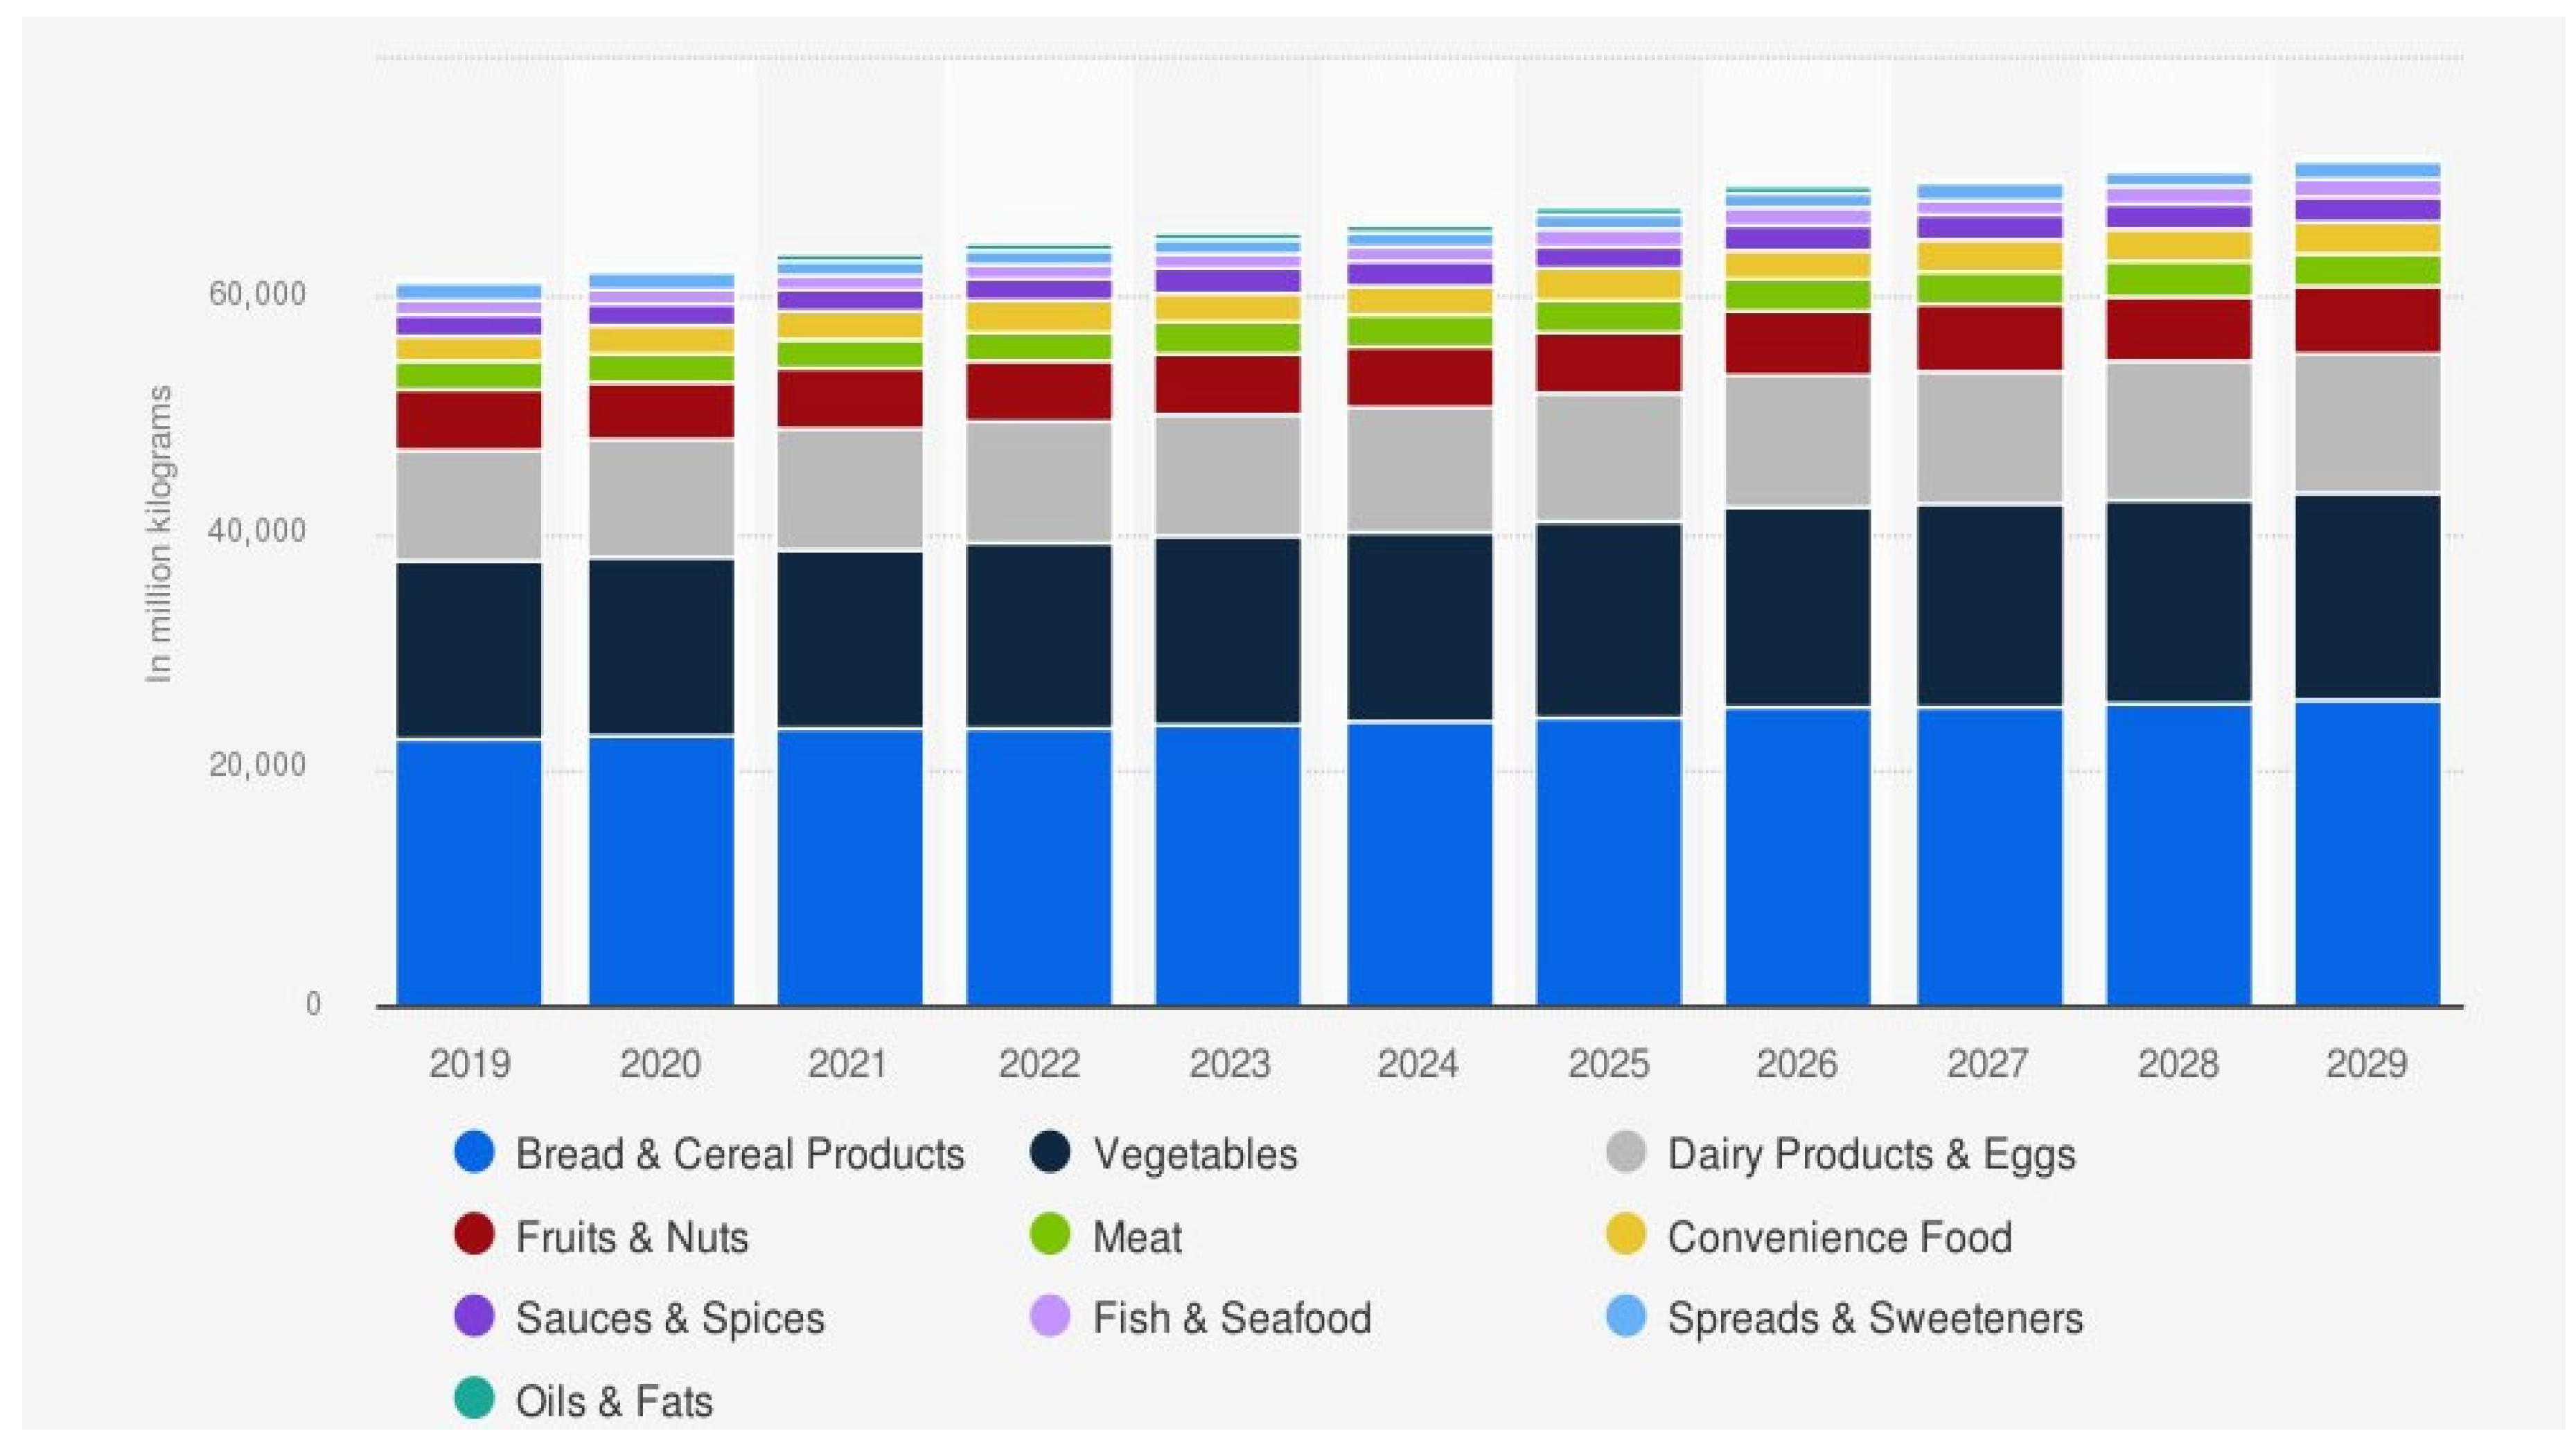
5], FMCG are distinguished by their high demand, inexpensive prices, and rapid consumption rates. According to Figure 1, it was anticipated that the volume of the FMCG (food market) in Pakistan would continue to expand, reaching a total of 6.2 billion kilograms, or an increase of 9.08 percent between the years 2024 and 2029 [6]. 
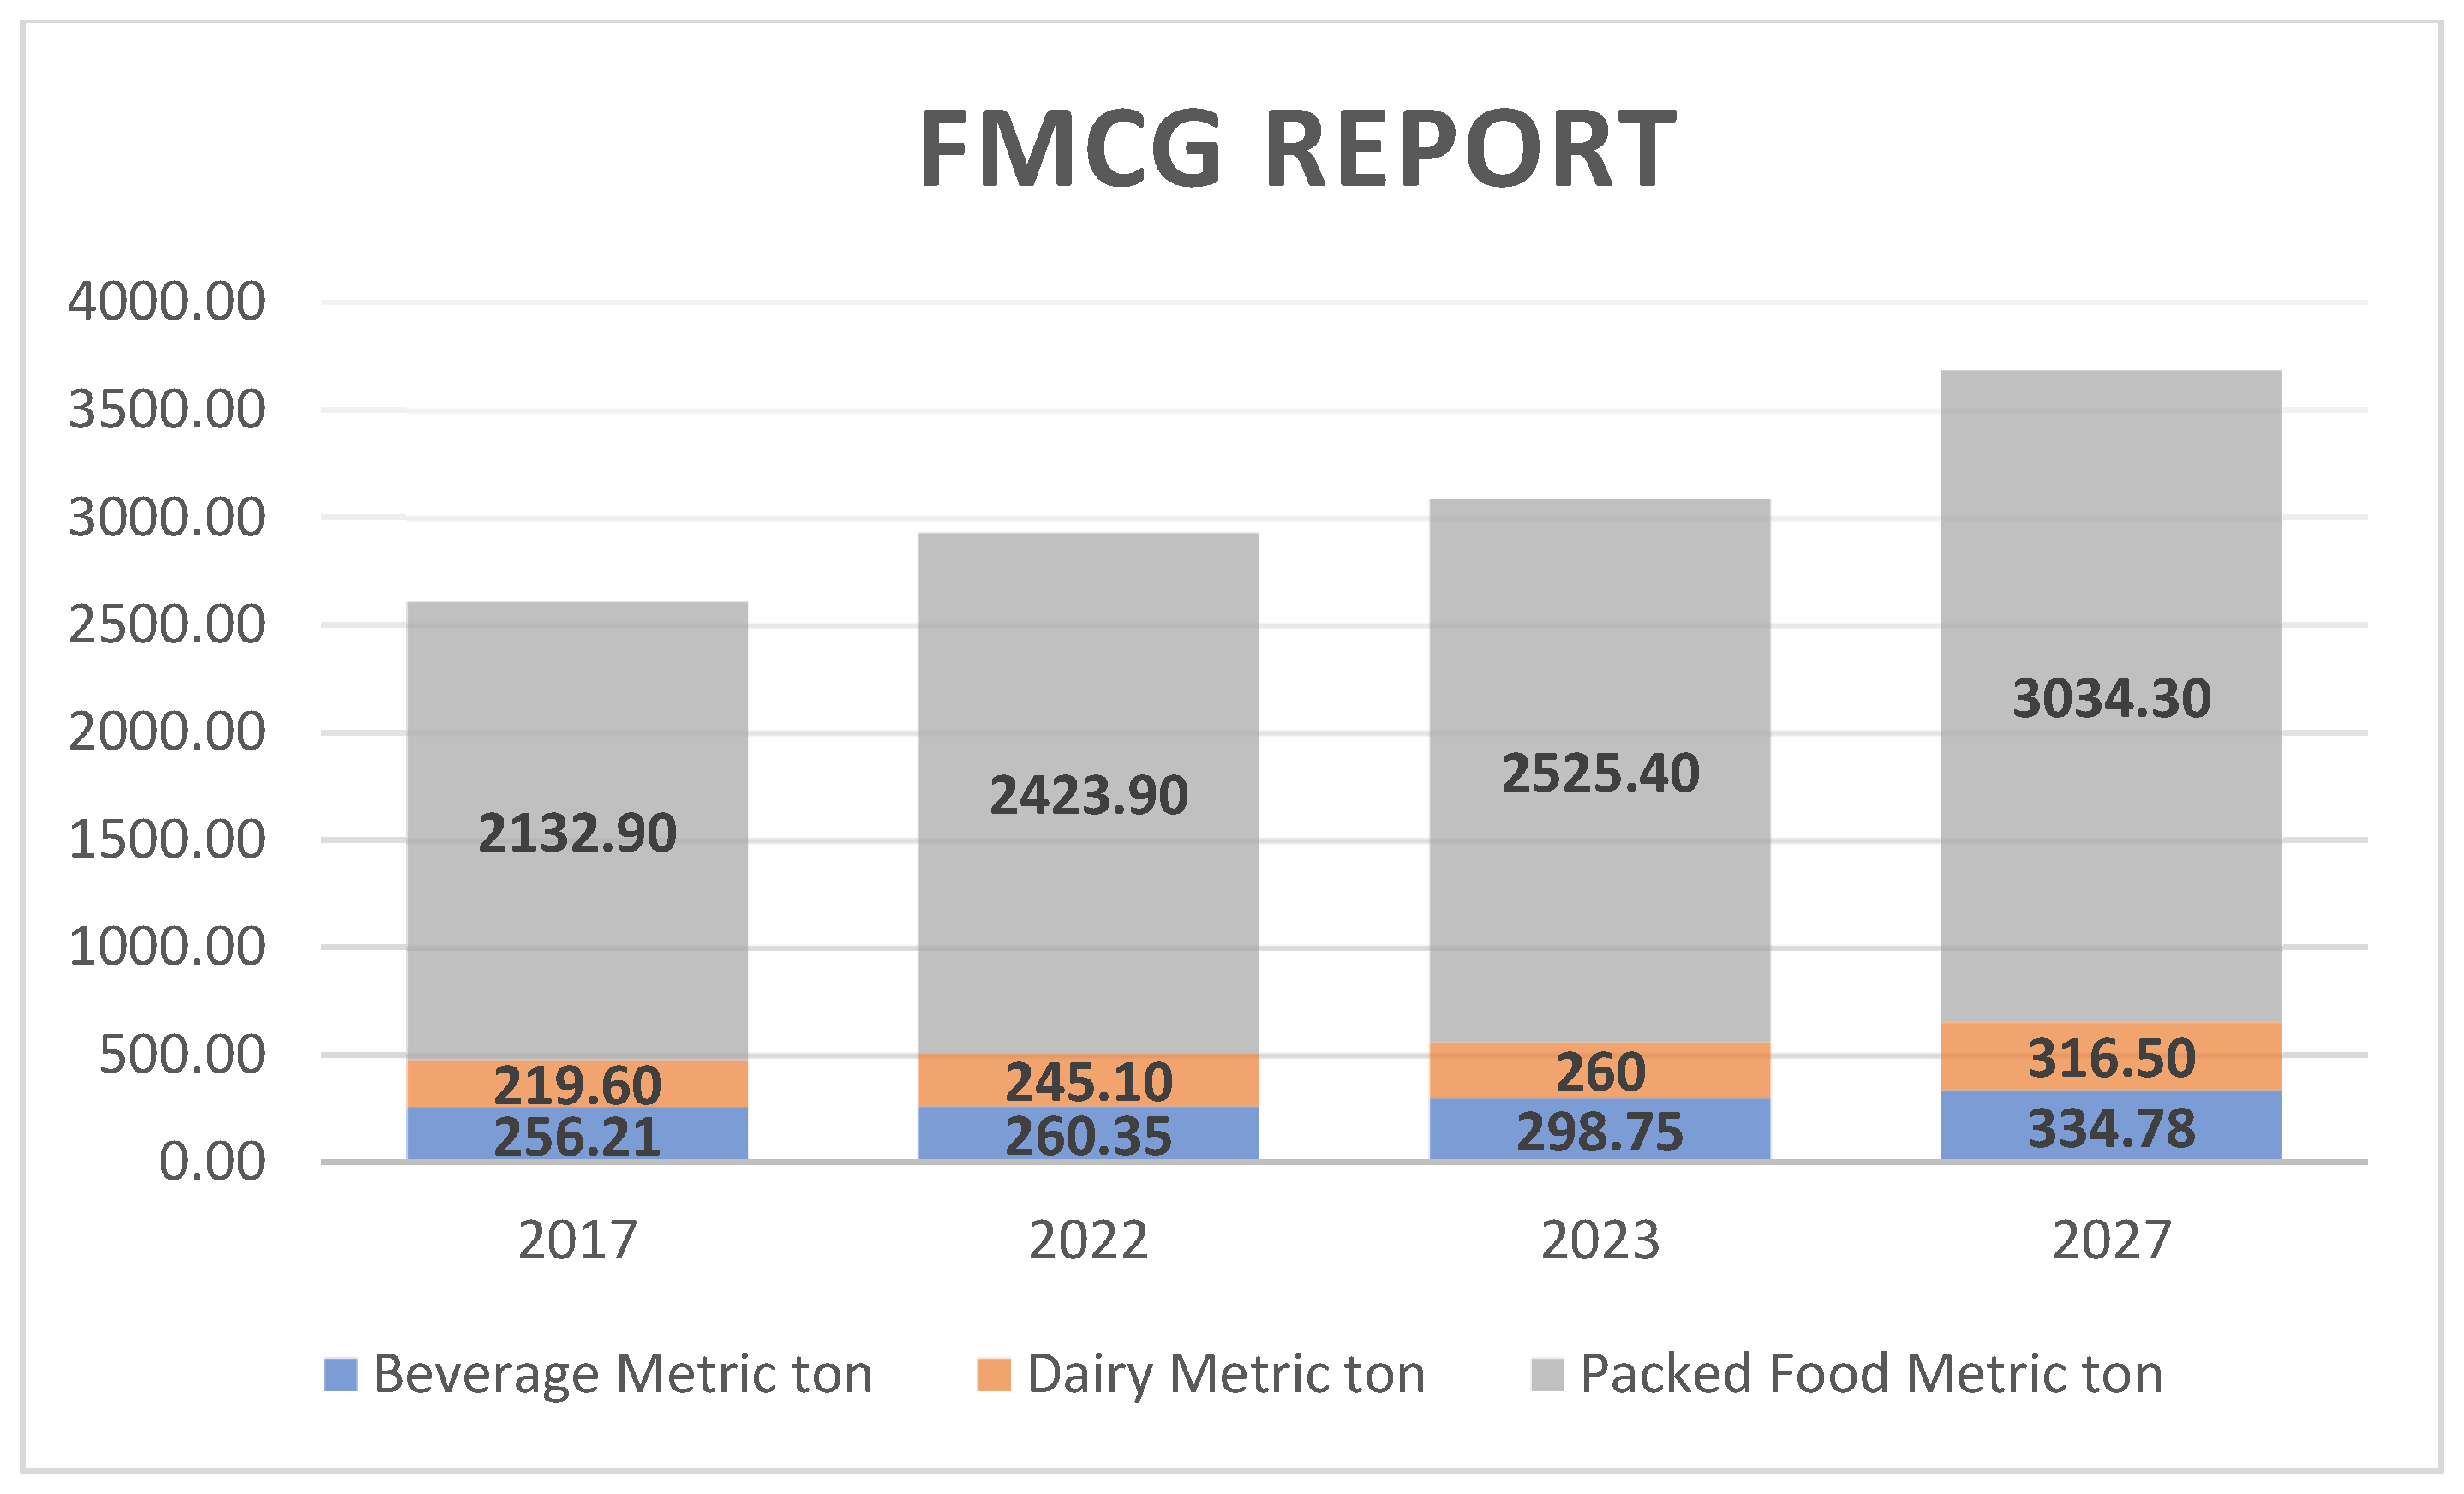
Figure 2 presents the growth in the FMCG sector of Saudi Arabia [7]. FMCG companies in Pakistan and Saudi Arabia have promising opportunities as the FMCG sector grows, but a strong supply chain is needed to meet expanding demand and avoid interruptions. FMCG companies must cultivate robust, enduring connections with local and global suppliers that can swiftly respond to supply disruptions caused by natural catastrophes, geopolitical crises, or economic instability [8], and organizations are required to adapt robust strategies and reaction tactics [9].
Resilient suppliers (RSs) consistently uphold product quality while emphasizing sustainability and ethical sourcing procedures, guaranteeing that the produced food is both responsible and dependable [10]. Furthermore, transportation capacity (TC) is a critical component of supply chain resilience, particularly in a nation such as Pakistan, where infrastructural obstacles may hinder the efficient movement of commodities. Heightened consumption necessitates that FMCG firms engage in the expansion of transportation networks capable of accommodating the increasing volume of commodities, hence ensuring the timely delivery of food products to retail outlets and consumers [11]. The Flexibility (FLEX) of the supply chain network is crucial for responding to evolving market circumstances. The FMCG market in Pakistan and Saudi Arabia has variable customer tastes, seasonal demand variations, and evolving import–export regulations, necessitating agility in the operations of FMCG companies [12]. The degree of flexibility enables FMCG companies to satisfy consumer demands without straining their resources or undertaking imprudent investments [13].
The intricacy of the supply chain network in both countries presents an additional barrier for FMCG companies. As the network’s complexity (NC) increases, so does the likelihood of disruptions, delays, or miscommunications. Consequently, FMCG companies must prioritize the establishment of an integrated, collaborative network that enables fluid communication and the efficient transportation of goods [14]. Supply chain dynamism (SPD) denotes the capacity of the supply chain to adjust and progress in reaction to internal and external influences. This may encompass alterations in consumer behavior, governmental modifications, or environmental influences such as climate change [15]. To maintain competitiveness, FMCG companies must have a dynamic supply chain that not only responds to disturbances but also predicts them [16].
Due to growing importance and the wider spectrum of disruptions and risks, supply chain resilience is under study. Various researchers studied supply chain resilience from multiple perspectives, which highlights its importance, e.g., viable sourcing strategies and resilience [17], the capacity of transportation is helpful to enhance resilience [18], product flow optimization through TC [19], mitigating internal and external uncertainty through flexibility [20], optimizing responsiveness through flexibility [21], the impact of NC on supply chain performance [22], NC decreases operational performance [23], the importance of artificial intelligence and information for resilience [24], and the impact of improved visibility and primary suppliers on resilience [25]. This study introduces a novel approach by utilizing Necessity Condition Analysis (NCA) to determine benchmark levels of key variables (RS, TC, FLEX, and SPD) required to achieve optimal supply chain resilience (SRES). To the best of our knowledge, no previous study has applied NCA in this context. Previous studies have focused on the effects of RS and TC on SRES, but there is a lack of information on SPD and NC, especially in the FMCG industry. This work combines the Theory of Constraints and Systems Theory to identify SRES bottlenecks. It shows how these factors enhance SRES, offering new insights into resilience-building.
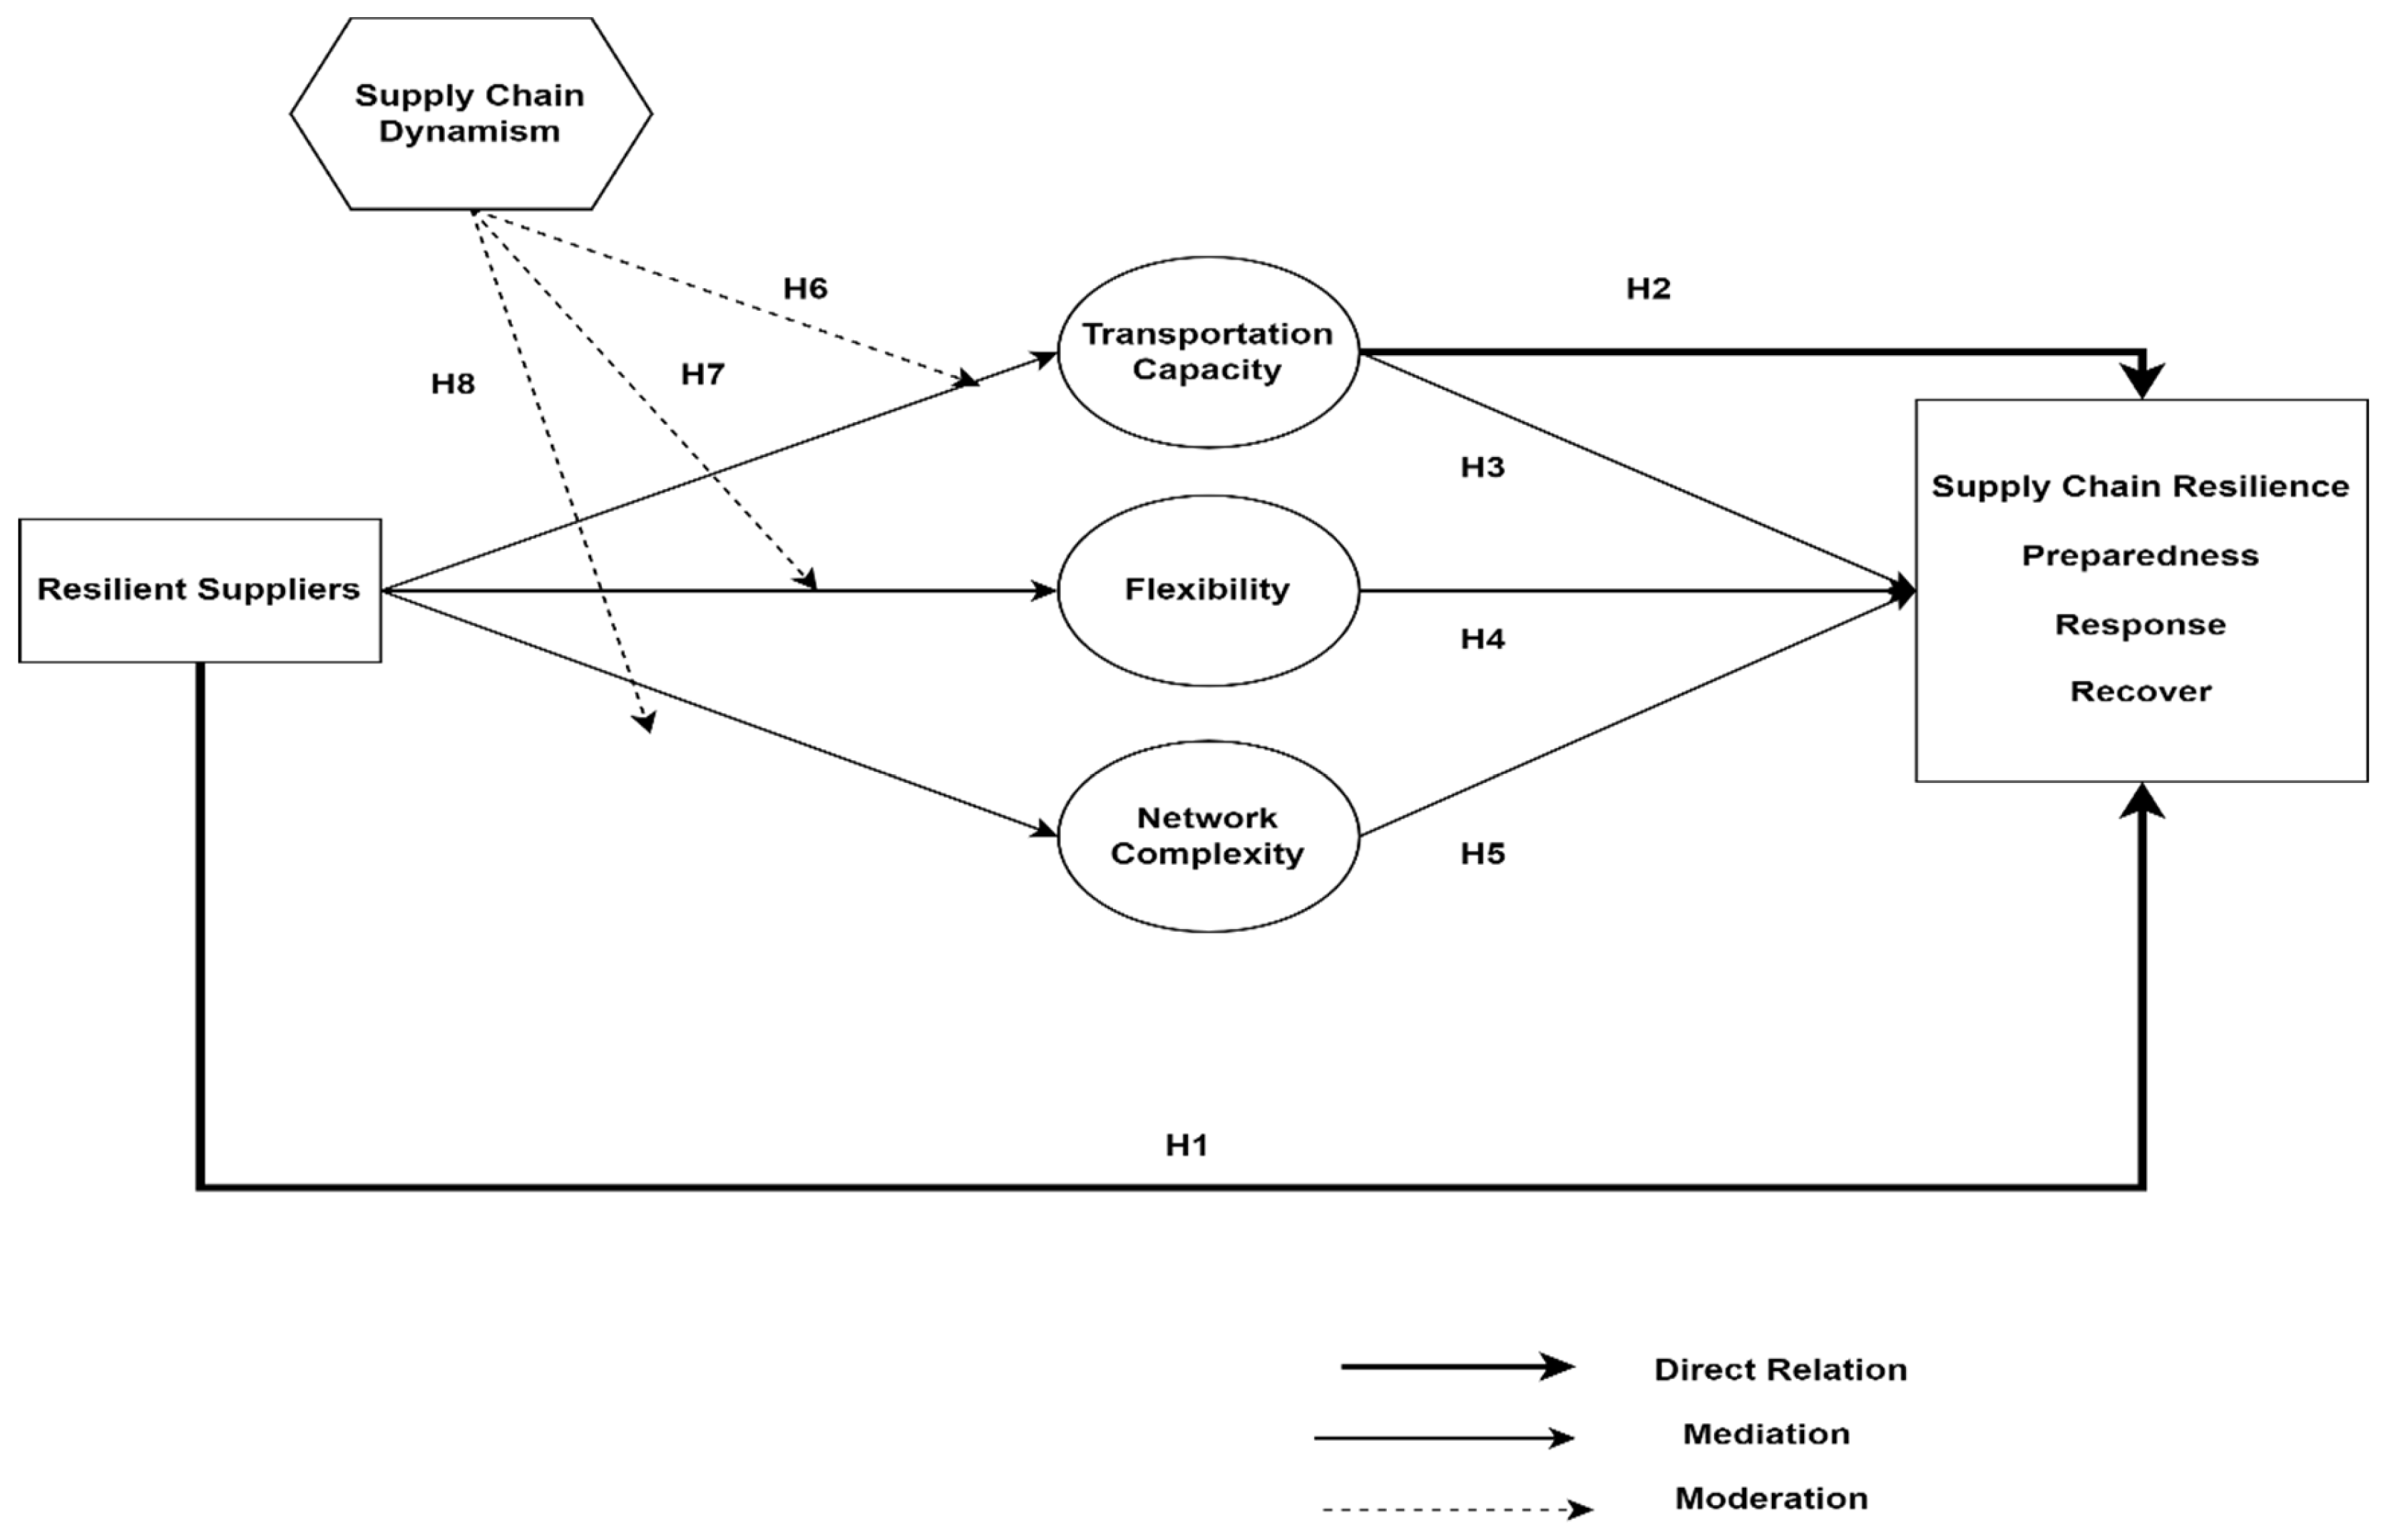
RQ1. How do resilient suppliers (RSs) and transportation capacity contribute to enhancing supply chain resilience in the FMCG sector?
RQ2. How do transportation capacity, flexibility, and network complexity mediate the relationship between RS and SRES?
RQ3. What role does supply chain dynamism play to moderate the relationship between RS, transportation capacity, network complexity, and supply chain resilience?
RQ4. What are the minimum performance thresholds for RS, TC, FLEX, NC, and SPD necessary to ensure optimal operational excellence of supply chain resilience, as determined by NCA?
This research utilizes Partial Least Squares Structural Equation Modeling (PLS-SEM) and Necessary Condition Analysis (NCA) to investigate the interconnections among critical variables RS, TC, FLEX, NC, SPD, and their critical role in enhancing SRES. This study employs these approaches to ascertain the essential conditions for improving supply network resilience and analyzes the interactions of these variables on overall supply chain performance.
To understand their resilience-building role, FLEX, NC, and TC mediation effects are extensively explored. The NCA gives managers clear performance standards to boost resilience. The standards help supply chain managers assess their operations’ resilience. They can identify underperforming components against these requirements, enabling proactive vulnerability mitigation. Managers may properly allocate resources and prioritize operational continuity and disruption prevention using this knowledge. The remaining article is as follows: Section 2: Literature Review and Hypotheses Development; Section 3: Methodology; Section 4: Results; Section 5: Discussion; and Section 6: Conclusions.

2. Literature Review and Hypotheses Development

2.1. Supply Chain Resilience (SRES)

SRES is defined as the ability of a supply chain to decrease the likelihood and/or impacts of possible disruptions and to reduce the restoring and resuming times. The resilience of a supply chain is often evaluated in three key dimensions: Preparedness, Response, and Recovery [26]. Preparedness constitutes the cornerstone of supply chain resilience, allowing organizations to foresee disruptions prior to their manifestation. In the current unstable business landscape, firms must diversify their supply chain networks to diminish dependence on singular sources or channels [27]. Diversification, via numerous suppliers, transportation alternatives, and storage facilities, establishes redundancy that guarantees continuity in the face of local disruptions. This proactive strategy reduces the probability of a total shutdown and enhances adaptability to changing circumstances [28]. The response refers to the prompt response undertaken by an organization in the event of a disturbance. The response phase, in contrast to preparedness, involves implementing a meticulously devised strategy to mitigate damage and sustain operations [29]. Rapidly pivoting and adjusting operations is crucial during the response phase. Adjusting production priorities or altering product offers temporarily can address customer demand amid supply limitations [30]. Recovery is the stage subsequent to an interruption, during which the supply chain is reinstated to full functionality. This dimension emphasizes the restoration of normal production levels, the reestablishment of stakeholder confidence, and the implementation of enhancements to avert future interruptions of a similar nature [26]. Recovery commences with an organization’s business continuity plan, which delineates the procedures for resuming operations following a disruption. The strategy often encompasses deadlines for reinstating crucial functions, prioritizing vital operations, and communication protocols for both internal and external stakeholders [31].

2.2. Resilient Suppliers (RSs) and SRES

RSs refer to suppliers that can effectively withstand, adapt to, and recover from disruptions or challenges in the supply chain. These challenges can come from various sources, such as natural disasters, economic shifts, political instability, technological changes, or global pandemics. RS have robust systems, processes, and strategies in place that allow them to maintain operations, minimize delays, and continue delivering goods or services, even under adverse conditions [32]. The increased resilience of the supply chain leads to an improvement in the overall performance of the company. This is because companies that have robust supplier networks are better equipped to absorb shocks, recover quickly, and return to stable conditions in an efficient manner [32]. Xu et al. [33] emphasized that the ability of RS to continue providing supplies in the face of disruptions and the operational continuity of the supply chain are directly impacted by this ability. In order to maintain resilience, it is vital to have a consistent flow of resources, which helps to minimize production delays and enables uninterrupted distribution [34]. Resilient suppliers minimize the total susceptibility of the supply chain by managing risks in a proactive manner. This can be accomplished by diversified sourcing, inventory buffers, or redundancy measures [35]. Gan et al. [36] emphasize that incorporating resilient suppliers into supply networks enhances resilience by promoting quicker response times and more agile adaptation to disturbances. This integration fosters systemic resilience since robust providers deliver essential stability throughout the network. Echejaf et al. [17] examined the role of RS in facilitating collective recovery within intricate supply networks. They contend that supplier resilience is essential for preserving network integrity during interruptions, as RS can assist one another and sustain supply flows in adverse situations.
H1. 
RS has a positive and significant effect on SRES.

2.3. Transportation Capacity (TC) and SRES

Transportation capacity refers to the maximum amount of goods that can be transported within a given time period using a specific mode of transportation (e.g., road, rail, air, or sea). It is a measure of the ability of the transportation network, infrastructure, and vehicles to handle the movement of goods effectively without overloading or causing delays [37]. The resilience of transport systems is crucial, as the same routes that facilitate the movement of people, products, and information also serve as channels for the transmission of risks [38]. A resilient transport system is one that can anticipate, adjust to, and recuperate from interruptions, preserving its essential functions and mitigating the effects on the wider economic and social systems it underpins [39].
Companies functioning inside this transportation network are directly influenced by its resilience and capacity, as their access to markets, suppliers, and resources depends on the efficacy of the transportation infrastructure [40]. Fugate et al. [41] transport is a significant resilience component because it enables quick alterations in the flow of commodities during disturbances. They believe that varied transport modes and route redundancy enable rapid response, which makes transport a critical factor in resilience. Namdar et al. [42] discovered that supply networks that have backup transportation resources and redundancy methods benefit from better resilience. This ensures that the supply chain remains uninterrupted even in the event that there are problems with the logistics. Supply chains are able to respond quickly and efficiently to interruptions when they have flexible transportation capacity, particularly in last-mile and multi-tier logistics [43].
Hosseini and Khaled [44] said transportation infrastructure that allows fast delivery, inventory optimization, and backup supply routes can improve supplier resilience. They added that suppliers with large transportation capacities can adjust, recover, and maintain continuity, making them more resilient to disruptions. Increased TC helps providers be responsive and reliable in difficult situations. TC is often cited as a key supply chain resilience aspect since it buffers shocks. Because transportation capacity stabilizes [45]. Brusset and Teller [46] stated that transportation flexibility and robust integration across supply chain nodes increase resilience. Their study suggests that RSs need TC to change within the supply chain, improving the network’s shock tolerance. The above-mentioned literature helps to propose the following hypotheses:
H2. 
TC has a significant effect on SRES.
H3. 
TC significantly mediates the relationship between RS and SRES.

2.4. Flexibility (FLEX) and SRES

Flex refers to the ability to rapidly modify production levels, introduce new products, shift sourcing or suppliers, and modify transportation routes and distribution channels in response to fluctuating market demands [21]. Supply chain FLEX pertains to the capacity of collaborating partners to readily adjust to alterations in market conditions and unforeseen circumstances [47]. During turbulent and atypical situations, flexibility is critical for improving supply chain resilience and useful in controlling the risk of supply chain disruption [48]. The concept of supply chain flexibility comprises a wide variety of capabilities that equip businesses with the ability to reduce the impact of both internal and external uncertainty [49]. By nurturing such flexibility, businesses have the ability to improve the responsiveness of their supply chains, which ultimately leads to an improvement in the overall performance of the organization [50]. Procter and Gamble used FLEX contracts to keep their supplies running as smoothly as possible when Storm Katrina flooded their main coffee roasting center in New Orleans in 2005 [51]. FLEX was recognized as a crucial element in managing and mitigating supply chain risk, while also enhancing SRES [48,52]. Therefore, to mitigate the impact of SC interruptions, organizations must fortify the resilience of their manufacturing systems through the incorporation of flexible processes [48]. Akbar and Aslam [53] underlined that supplier integration and flexibility directly affect supply-side robustness. They found that flexibility improves a company’s ability to interact with suppliers during disruptions, proving that flexibility mediates supplier resilience and supply chain resilience. Kamalahmadi et al. [54] proposed a model that minimizes interruptions by using flexibility in supplier selection and demand distribution. Their study found that flexible sourcing strategies, particularly supplier allocation, reduce supply chain interruptions and enhance resilience by maintaining continuity. Flexible supply networks let the organization quickly adapt to disturbances and rearrange its resources. Simply said, a flexible supply chain improves the entire supply chain, even high-volume [48], variety, and unique products, faster changeover and machine setup [13], availability of suitable products, inventory visibility [55], cost-based advantages, accurate product distribution, and availability [56]. Hence, the following hypothesis is suggested:
H4. 
FLEX mediates a positive and significant relationship between RS and SRES.

2.5. Network Complexity (NC) and SRES

NC is characterized by factors such as the number of entities involved, the geographical dispersion of operations, the diversity of product offerings, the variability in demand and supply, and the extent of coordination required between different actors [57]. Multiple tiers of suppliers, a variety of geographic locations, a wide range of transportation modes, and a large number of middlemen and stakeholders are often included in a supply chain that has a high network complexity [58]. According to Brandon-Jones et al. [59], the level of complexity of the network structure of the supply chain has an impact on the degree to which supply chain partners are able to effectively manage their interactions and achieve end-to-end performance. Chowdhury et al. [60] indicate that the management of the supply chain network becomes more difficult as the network becomes more complex. Thus, this may have an adverse effect on the network’s performance and resilience. Wissua et al. [61] found that as the complexity of the network increased, individuals in the supply chain had difficulty coordinating their operations, which resulted in interruptions. Iftikhar et al. [62] suggested supply chain network complexity. results in an increase in operational load, which represents the effort needed to run the network, and uses focal company organizational resources. Complex supplier–logistics network relationships can lead modest disruptions to become catastrophic supply chain breakdowns. This is especially true in tightly connected networks [63]. Chowdhury et al. [64] developed NC by considering network size and geography. Complex networks provide resiliency but also introduce weaknesses. Furthermore, increasing network complexity can cause cascade failures, where a disturbance in one part of the network affects the entire supply chain [65].
In light of the above arguments, this research suggests the following hypothesis:
H5. 
NC significantly mediates the relationship between RS and SRES.

2.6. Supply Chain Dynamism (SPD) and SRES

SPD is the level of supply chain change and unpredictability caused by demand changes, market movements, and technical advances. It emphasizes flexibility and proactive responsiveness to retain efficiency and competitive advantage in the face of constant change [66]. In the year 2023, its significance has been brought to light by a number of problems, including geopolitical tensions, economic volatility, and technological upheavals [67]. These challenges all force organizations to improve their adaptability and resilience in order to survive and thrive in environments that are characterized by their instability [68]. The requirement for robust suppliers and network flexibility is increased as a result of the dynamic nature of the market, which is characterized by frequent shifts in both demand and technology [65]. Schilke [22] suggested that supply chain dynamism increases resilience by making rapid adjustments and buffering unforeseen changes. Network complexity and RS let supply chains adjust quickly to disturbances, maximizing their value in dynamic settings. Additionally, the benefits of RS are maximized. Even though complexity can make a situation more vulnerable, it also has the potential to provide redundancy and flexibility, both of which strengthen resilience [62]. Dynamism, including variable demand, rapidly growing technologies, and changing market conditions, may increase the need for adaptive transportation networks and suppliers [69]. When there is a high level of dynamism, the ability to quickly react becomes even more important, which in turn increases the effectiveness of RS and transportation resources in enabling total supply chain resilience [65]. Zhu and Wu [70] stated that supply chain resilience is most effective in dynamic contexts where sustainability and flexibility promote continual adaptation. This research proposed the following three hypotheses according to the above literature:
H6. 
SPD significantly moderates the relationship between RS, TC, and SRES.
H7. 
SPD significantly moderates the relationship between RS, FLEX, and SRES.
H8. 
SPD significantly moderates the relationship between RS, NC, and SRES.

2.7. Theory of Constraints (TOC)

The TOC management philosophy emphasizes identifying and fixing system bottlenecks to improve performance. Supply chain management uses constraints to identify and fix bottlenecks in product and service flow [71]. The Theory of Constraints (TOC), first introduced by Goldratt in 1990, is a management philosophy that views any system as being constrained by a bottleneck limiting its ability to reach higher performance levels [72]. The core idea behind TOC is to identify and address these bottlenecks to achieve breakthrough improvements in the overall system performance. TOC is grounded in three primary areas: logical thinking, performance measurement, and operations management [73]. In a supply chain, this constraint may manifest as a limitation in production capacity, a transportation bottleneck, or a deficiency in raw materials [74]. Companies can improve supply chain efficiency and profitability by understanding and addressing these restrictions. Constraints provide a systematic way to identify and resolve them. First, identify the system’s limitations, or factors that limit its performance [75]. Upon identifying the constraints, the subsequent step is to leverage it by optimizing its efficiency and output [76]. This may entail modifications to the production process, resource allocation, or inventory management [77]. The next step in system development is to restrict all other components after their exploitation. To avoid constraints overwhelming other activities or resources, this may require modifying other procedures or activities [78]. The notion of constraints underscores the significance of ongoing enhancement. After addressing the restriction, the subsequent stage is to identify the new constraints and reiterate the procedure [72]. The implementation of the idea of limitations in supply chain management has proven successful in enhancing overall performance. By identifying and removing bottlenecks, companies can improve product flow, cut costs, and boost customer satisfaction [79].

2.8. Systems Theory (ST)

ST, a multidisciplinary approach from the natural sciences, provides a useful foundation for understanding and improving supply chain management. ST recognizes supply chains as complex, dynamic systems with interrelated components and feedback loops. This is the fundamental element of systems theory [80]. ST has been essential in directing the design and management of sustainable and resilient supply chains [81]. Studies have shown that by adopting a systems view, businesses are able to better comprehend the interdependencies between the numerous operations that make up the supply chain [82]. This leads to integrated demand forecasting, production planning, procurement, inventory management, and logistics strategies. Additionally, systems dynamics modeling has illuminated the complex feedback mechanisms that control supply network behavior and enhance overall supply chain performance [83,84].
This literature review of the proposed variables and hypotheses developments leads to the development of a hypothetical framework as shown in Figure 3.

3. Methodology

The primary aim of this study is to examine the influence of RS, TC, FLEX, NC, and SPD on supply chain resilience. This study adopted a quantitative explanatory research paradigm and applied a questionnaire approach to fulfill its stated objective. This research employed dual methodologies for in-depth analysis of variables and their contribution to enhancing resilience. Frist, this research utilized partial least square structural equation modeling (PLS-SEM) to ensure the significance of the relationship between variables and used R-programming (the seminr package) for PLS-SEM analysis [85]. PLS-SEM employs ordinary least squares (OLS) regression to estimate path coefficients, aiming to minimize residual variance and maximize R2 in the dependent variables. This method provides robust predictive capabilities, making PLS-SEM a prevalent choice for research aimed at variance explanation and theory development [86]. In order to deepen understanding of the interplay of the variables in enhancing SRES, this research also used Necessary Condition Analysis and R-programming (NCA package). NCA is a methodology intended to evaluate the requirement and extent to which a specific condition (or variable) is essential for an outcome to occur. Unlike traditional methods that focus on the sufficiency of a condition (where the presence of a variable guarantees an outcome), NCA emphasizes the determination of conditions that are essential for the result, even if they do not solely explain the outcome independently [87]. NCA utilizes several concepts and tables to present results, such as ceiling lines, effect size, bottleneck tables, and NCA permutation p-values [88]. This research utilized a reflective model to measure the impact of the variable on the target variable.

3.1. Sampling and Data Collection

This research used probability sampling to reach respondents. Probability sampling selects a sample from a population with a known (non-zero) likelihood of selection. This method uses probability theory to ensure that the sample appropriately represents the population. Probability sampling’s main benefit is its ability to allow researchers to make population-level statistical inferences from sample characteristics [89]. The research concentrated on the FMCG sector of Pakistan and Saudi Arabia. The sampling frame comprises heads of departments, managers, assistant managers, and supervisors from the FMCG sector in Pakistan and Saudi Arabia.

3.2. Measurement and Questionnaire Development

This research employed a questionnaire to gather data. The questionnaire is located in the appendix and may be accessed via the reference. The questionnaire included a 5-point Likert scale from 5 (strongly agree) to 1 (strongly disagree). This study utilized established questions that were used in a number of previous research studies. The three questions of RS have been adopted from the study by Rajesh et al. [90], and two questions from Can Saglam et al. [91] for RS. For TC, four questions have been adopted from the research of Anwer al-Shaboul [30] and one question from Wang et al. [37]. For FLEX, two questions were adopted from the study of Chowdhury et al. [22], and three questions from Liao [92] were selected. Five questions of NC were selected from Asaf-Adjei [65]. For SPD, four questions were selected from Laguir et al. [93] and one question from Belhadi et al. [94]. For SRES, four questions were identified from the research of Gölgeci and Kuivalainen [95], and four questions were identified from research conducted by El Baz and Ruel [96]. A specialized team of seven supply chain professionals and five supply chain academicians evaluated and refined the items and questionnaire to guarantee the appropriateness of question content, phrasing, sequence, format, layout, comprehensibility, instructions, and scale range. Their recommendations were integrated into the questionnaire.
The online questionnaire was initially disseminated digitally to a sample of approximately 945 individuals from a designated industry association mailing list. After screening and eliminating incomplete responses, 611 responses were finalized for further analysis. The detailed demographic analyses were shown in Table 1. The firm size, country, and employment level were kept as control variables.

4. Results

PLS-SEM analysis mainly consists of two models: one is the measurement model, and the other is the structural model [97]. To evaluate the measurement model, this research checks four primary aspects: (1) factor loading, (2) internal consistency reliability, (3) convergent validity, and (4) discriminant validity. The internal consistency reliability encompasses three primary assessments, which are alpha, composite reliability (rhoC), and construct reliability (rhoA). This research ensures that there is no bias and uses the common method bias.

4.1. Common Method Biasness

This study ensures model validity and reliability with common method bias (CMB). When a study’s variation is mostly caused by the measuring procedure rather than the constructs, CMB may mislead the results. VIF is an excellent tool for discovering and analyzing CMB in PLS-SEM. VIF typically assesses multicollinearity in regression analysis, while in CMB, it assesses construct-level collinearity [98]. Kock and Hadya [99] proposed analyzing latent variable collinearity to expand VIF’s CMB detection. Inner VIF values above 3.3 suggest probable common technique bias, implying that a common measuring approach may affect construct variance rather than the constructs themselves. Table 2 shows that all values are less than 3.3. Hence, this confirms that there is no multicollinearity or bias issue.

4.2. Internal Consistency Reliability

According to Hair et al. [100] there are four steps to access the reflective measurement modes:
1.
Factor loading (FL);
2.
Internal consistency reliability;
3.
Convergent reliability;
4.
Discriminant validity.

4.2.1. Factor Loadings (FL) and Internal Consistency Reliability

The first step in evaluating a reflective measurement model is to examine the indicator loadings. The FL of RS ranges from 0.51 to 0.85; FLs of values are 0.67 to 0.80; FLs of FLEX are 0.62 to 0.88; FLs of NC are 0.63 to 0.90; FLs of SPD are 0.63 to 0.80; and FLs of SRES are 0.77 to 0.84. Researchers should keep indicators with loadings of 0.7 or above and remove those with loadings below 0.4. Regarding indicators with loading between 0.4 and 0.7, researchers retain indications if internal consistency reliability and convergent validity values exceed prescribed thresholds [85]. The second phase is to measure internal consistency reliability by Cronbach’s alpha (alpha), composite reliability (rhoC), and construct reliability (rhoA). Composite reliability (rhoC) values ranging from 0.60 to 0.70 are deemed acceptable in exploratory research, 0.70 to 0.90 tolerable to good; however, values beyond 0.95 may indicate redundancy among items and diminished construct validity. Cronbach’s alpha (alpha), a measure of internal consistency, frequently produces lower results than composite reliability since it does not weight items according to their loadings. Dijkstra and Henseler [101] introduced construct reliability (rhoA) as a more precise measure of construct reliability, which often falls between the overly lenient composite reliability and the overly stringent Cronbach’s alpha. This table shows the values of alpha, rhoC, and rhoA for variables RS, FLEX, TC, NC, and SPD. All values meet the required threshold above 0.7. Hence, ensuring the internal consistency reliability of models. Table 3 shows values of FL and internal consistency.

4.2.2. Convergent Validity

The third step in model measurement is to ensure convergent validity. Convergent validity refers to how well a construct explains the variation among its elements. Convergent validity of a construct is evaluated using the average variance extracted (AVE) for all items. To calculate AVE, square the loading of each indicator on a build and determine the mean value. An acceptable AVE of 0.50 or greater indicates that the construct accounts for at least 50% of the variance in its elements. Table 3 shows AVE values of RS is 0.65, TC is 0.65, FLEX is 0.57, NC is 0.57, SPD is 0.51, and SRES is 0.67.

4.2.3. Discriminant Reliability

The fourth step is to evaluate discriminant validity, which measures how different a construct is from others in the structural model. Fornell and Larcker [102] advised comparing each construct’s AVE to the squared inter-construct correlation, which measures shared variance, across all reflectively measured constructs in the structural model. All model constructs should have a common variance no bigger than their AVEs. Henseler et al. [103] suggested the heterotrait–monotrait ratio (HTMT) for correlations. To calculate the HTMT, compare the mean correlations across constructs to the average correlations for items measuring the same construct. Furthermore, he suggested a threshold value of 0.90. In this scenario, an HTMT value above 0.90 indicates no discriminant validity. A cautious threshold value of 0.85 is recommended for conceptions that are more conceptually distinct [103]. Table 4 shows the values of the Fronell and Larcker criteria, and Table 5 shows the HTMT of all variables. All values of the HTMT are less than the 0.85 threshold, which ensures the validity of the model.

4.3. Structural Model

The structural model is evaluated as the subsequent phase in the evaluation of PLS-SEM results once the measurement model assessment is satisfactory. Statistical significance and relevance of the path coefficients, the blindfolding-based cross-validated redundancy measure Q2, and the coefficient of determination (R2) are standard assessment criteria that should be taken into account [104]. The structural model assessment aims to assess the model’s capacity to generate precise predictions and to investigate the interrelations among its components. Hair et al. [100] recommend weak, moderate, and significant R-square values of 0.25, 0.50, and 0.75. A Q2 value above zero implies excellent predictive capacity, whereas below zero indicates weak predictive power. In Table 6, R2, Adjusted R2, and Q2 metrics are used to analyze the correlations between SRES and the independent variables RS and TC. RS and TC explain 45% of the variance in SRES, indicating limited explanatory efficacy (R2 = 0.45). R2 values of 0.44 for RS and 0.30 for TC indicate moderate and weak explanatory power, respectively. SRES achieved an Adjusted R2 of 0.445, confirming the model’s resilience despite lower R2 values. The model’s Q2 values show its predictive power, with robust values for SRES (0.480), RS (0.51), and TC (0.41). In improving SRES, RS is more predictive and explanatory than TC.

4.3.1. Direct Relationship

The dependent variable of this study is SRES; RS and TC are independent variables. The data shown in Table 7 and in Figure 4 offer insightful analysis of the interactions among the several factors in the research. RS → SRES (Hypothesis H1) shows first a statistically significant beneficial influence of RS on SRES. With a modest positive effect, the path coefficient (β = 0.436) means that SRES rises by 0.436 units for every unit increase in RS. Both considerably over the threshold for statistical significance, the t-statistic (9.988) and p-value (0.000) further support this link. Zero is not included in the confidence interval (0.354 to 0.523), so supporting the validity of the hypothesis. With a route coefficient (β = 0.295) and a t-statistic (5.237) above the significance threshold, TC → SRES (Hypothesis H2) likewise reveals a notable positive correlation. Moreover, supporting the acceptance of H2 are the p-value (0.000) and confidence interval (0.179 to 0.400), demonstrating that TC favorably influences SRES.
By contrast, SRES is not much influenced by the control variables Firm Size, Country, and Employment Level. The path coefficient (β = 0.024) for Firm Size is small; the t-statistic (1.68) is below the threshold value of 1.96. Confirming the lack of significance are the p-value, 0.580, and confidence interval, (−0.068 to 0.101). With a coefficient (β = 0.007), a t-statistic (1.253), and a p-value (0.882), Country likewise reveals a minor effect on SRES. With a path coefficient (β = 0.009), a t-statistic (0.980), and a p-value (0.748), Employment Level finally does not influence SRES either.
Overall, the results imply that although RS and TC have a significant positive impact on supply chain resilience, the control variables such firm size, nation, and employment level do not significantly influence the outcome, so underlining the need of RS and TC in driving SRES in this study.

4.3.2. Mediation Relationship

The mediation relationships identified in this study examined the influence of RS on SRES via intermediate variables, including TC, FLEX, and NC.
Hypothesis H3: RS influences SRES indirectly via TC, highlighting the mediating role of TC in this relationship. The results indicate a positive and statistically significant path coefficient (β = 0.211), accompanied by a t-statistic of 8.749, which exceeds the critical value of 1.96. The p-value of 0.035 is below the significance threshold of 0.05, providing additional evidence for the validity of this mediation effect. The confidence interval ranging from 0.167 to 0.261 excludes zero, thereby affirming the significance of the pathway from RS to TC and subsequently to SRES. Consequently, Hypothesis H3 is accepted, demonstrating that TC plays a significant mediating role in the relationship between RS and SRES. Hypothesis H4 posits that flexibility (FLEX) serves as a mediator in the relationship between RS and SRES. The findings indicate a robust positive influence (β = 0.206), accompanied by a t-statistic of 6.020 and a p-value of 0.000, collectively demonstrating a statistically significant mediation effect. The confidence interval ranging from 0.140 to 0.272 indicates that the indirect effect of RS on SRES via FLEX is indeed significant. Consequently, Hypothesis H4 is accepted, reinforcing the notion that FLEX significantly contributes to the enhancement of the relationship between RS and SRES.
Hypothesis H5 posits that Network Complexity mediates the relationship between RS and SRES. The results indicate a relationship that lacks statistical significance. The path coefficient (β = −0.024) exhibits a negative value, while the t-statistic of −0.625 falls significantly short of the critical threshold of 1.96, suggesting that this indirect effect lacks statistical significance. The p-value of 0.08 exceeds the conventional significance threshold of 0.05, and the confidence interval ranging from −0.101 to 0.049 encompasses zero, indicating that NC does not significantly mediate the relationship between RS and SRES. Consequently, Hypothesis H5 is dismissed. The findings demonstrate that TC and FLEX play a significant mediating role in the relationship between RS and SRES, whereas NC does not exhibit this effect. The findings underscore the critical role of TC and FLEX as primary mechanisms by which RS influences SRES, whereas NC appears to have a negligible impact in this mediation pathway. Table 8 and Figure 5 demonstrates the mediation impact of variables.

4.3.3. Moderation Relationship

Table 9 and Figure 6 presents the results that examine the moderation relationships within this study, specifically how SPD influences the connection between RS and SRES through several intermediate variables, including TC, FLEX, and NC.
Hypothesis H6: SPD × RS → TC → SRES examines how SPD moderates the relationship between RS and SRES, with TC acting as a mediator. The results indicate a positive and statistically significant moderating effect (β = 0.169), accompanied by a t-statistic of 2.116 and a p-value of 0.034. This suggests that SPD greatly amplifies the impact of RS on SRES via TC. The confidence interval (0.010 to 0.058) indicates that the moderation effect is positive and statistically significant. Consequently, Hypothesis H6 is accepted, indicating that SPD significantly moderates the RS-TC-SRES relationship.
Hypothesis H7 posits that SPD moderates the relationship between RS and SRES via FLEX. The results indicate a robust positive moderation effect (β = 0.298), accompanied by a t-statistic of 4.072 and a p-value of 0.000. This suggests that SPD significantly enhances the influence of RS on SRES via FLEX. The confidence interval ranging from 0.015 to 0.065 further validates the statistical significance of this moderating effect. Consequently, Hypothesis H7 is accepted, reinforcing the notion that SPD significantly enhances the impact of RS on SRES via FLEX.
Hypothesis H8 posits that SPD moderates the relationship between RS and SRES via Network Complexity (NC). The findings indicate a marginally significant moderating effect (β = 0.011), accompanied by a t-statistic of 0.169 and a p-value of 0.02. This suggests a weak yet statistically significant influence of SPD on the RS-NC-SRES relationship. The confidence interval (0.021 to 0.063) indicates that the moderating effect is quite small yet remains significant. Consequently, Hypothesis H8 is accepted, albeit with a lesser impact compared to the other relationships. In summary, the findings suggest that SPD plays a significant role in moderating the relationship between RS and SRES via TC, FLEX, and NC. The moderation effect is most pronounced through FLEX, followed by TC, while the effect through NC, though weaker, remains significant. The findings highlight the significance of SPD in enhancing the connection between RS and SRES through multiple pathways.

4.4. NCA

4.4.1. Effect Size

Dul [105] presented necessary condition analysis (NCA), where a necessary condition is essential for averting an outcome and is of utmost importance in practical situations, as all criteria must be met to avoid failure. According to the guideline of Dul [105], this research employed quantitative data, prompting selection of the scatter plot technique. Additionally, NCA adheres to the “No Y without X” principle, indicating that the outcome variable (e.g., Y) is contingent upon predictor variables (e.g., X). Therefore, X is essential. Necessity theories focus on the non-occurrence of an event due to the absence of a predictive variable, which serves as the necessary condition [88]. Dul [88] asserted that when a dataset contains X and Y scores with numerous levels, exceeding five, or when the scores are numerical, as in a substantial N study, the scatter plot method can be advantageous. The following are steps of the scatter plot methodology:
1.
Generate the scatter plot.
2.
Identify the empty area.
3.
Illustrate the ceiling line.
4.
Compute the NCA parameters.
5.
Evaluate the NCA parameters.
6.
Formulate the conclusion.
This research employed a dual technique, incorporating NCA alongside PLS-SEM. Richter et al. [87] assert that such an analysis must adhere to certain methods. The latent variable score is obtained from the structural relationships among variables to conduct an NCA. R-programming is commonly employed in NCA investigations to calculate the NCA test parameters, effect size, scope, ceiling zone, and p-values. This study utilizes all exogenous constructs: RSP, INFM, INVT, and FLEX for NCA. Figure 7 and Figure 8 below illustrate stages one and two: Generate the scatter plot and illustrate the ceiling line. Step 3 recommends delineating the ceiling line to assess the NCA attributes. Finally, steps 4 and 5 entail evaluating the NCA parameters and formulating the conclusion; see Table 10. Within the context of NCA, a significant metric is the effect size “d”. Dul [88] characterizes the necessity effect size (d) as the ratio of the unoccupied region above the ceiling to the total space where instances are viewed or can be recognized, defined by the minimum and maximum empirical or theoretical values of X and Y (scope). The “d” effect size ranges from 0 to 1. In accordance with Dul’s [88] recommendation, the subsequent thresholds for effect size (d) are proposed: 0 < d < 0.1 signifies a minor effect, 0.1 ≤ d < 0.3 suggests a moderate effect, 0.3 ≤ d < 0.5 denotes a considerable influence, and d ≥ 0.5 reflects a major effect. An effect size of d = 0.1 is regarded as a benchmark for determining theoretical and practical significance. Dul [88] delineates two separate ceiling lines: Ceiling Envelopment-Free Disposal Hull (CE-FDH) and Ceiling Regression-Free Disposal Hull (CR-FDH). The CE-FDH is generally used for discrete data or data with restricted levels, whereas the CR-FDH is applied to continuous or nearly continuous data. Therefore, based on the attributes of our data, we will employ CE-FDH as the standard to evaluate the NCA parameters. According to Table 10, RS (0.51) exhibits the most substantial effect size; thus, it is plausible to conclude that it is the most critical condition necessary for attaining SPRE. Simultaneously, modest effect size is exhibited by TC (0.36), FLEX (0.24), and SPD (0.27), whereas NC has no effect size (0.0).

4.4.2. Bottleneck Table

The bottleneck analysis of supply chain resilience (SRES) at the 80% benchmark yields critical insights into the performance dynamics of essential supply chain attributes: Resilient Suppliers (RS), Network Complexity (NC), Transportation Capacity (TC), Supply Chain Dynamism (SPD), and Flexibility (FLEX). As SRES escalates, a distinct increasing trajectory is evident in RS, TC, SPD, and FLEX, signifying that enhanced resilience requires concomitant advancements in these domains. RS rises from zero at 0% SRES to 75 at 80% as shown in Table 11 and Figure 9, indicating a significant demand for resilient providers to sustain the system’s increasing complexity and maintain continuity under stress. Correspondingly, TC exhibits a substantial increase, from 5.8 at 10% SRES to 65.4 at 80%, underscoring the escalating demand for transportation capacity as the supply chain broadens and fortifies.
SPD and FLEX demonstrate significant growth, with SPD attaining 66.3 and FLEX peaking at 67 at 80% SRES, indicating that elevated resilience levels enhance the supply chain’s dynamism and flexibility, crucial characteristics for adjusting to disturbances and fluctuating market conditions. Notably, in the 50–60% SRES range, a more complex tendency shows. RS and TC neither exhibit any significant rise in this interval. This finding implies that beyond this point, more expenditures on transportation infrastructure and strong suppliers could have declining benefits. The system essentially achieves a threshold whereby further RS and TC investments do not appreciably increase general supply chain resilience. This emphasizes a crucial realization for supply chain managers: once a certain degree of resilience is reached, the emphasis should turn to improving other resilience elements, especially FLEX and SPD, which have a more immediate and noticeable influence on the general flexibility of the system.
On the other hand, NC remains consistently at zero across all benchmarks, indicating that network complexity does not act as a bottleneck in this analysis and does not appear to impede the improvement of resilience. This suggests that at the current SRES levels, the supply chain’s network complexity is not a major challenge, and hence, no immediate action is needed to address it. This could be due to the fact that the supply chain network is sufficiently streamlined and does not encounter significant complexity-related barriers. In summary, the study of the bottleneck table demonstrates that in order to increase SRES from 0% to 80%, it is necessary to make strategic and concentrated investments in resilient suppliers, transportation capacity, and flexibility. On the other hand, the diminishing returns that were observed between 50% and 60% SRES, in particular for RS and TC, show that once a certain threshold is reached, the marginal benefit of further investments in these sectors becomes reduced. As a consequence of this, resources ought to be allocated toward the enhancement of FLEX and SPD, especially considering the fact that these characteristics play a more substantial role in strengthening supply chain resilience at higher levels. The implementation of this strategy will contribute to the development of a supply chain that is more flexible and adaptive, with the ability to manage risks, deal with interruptions, and react to altering market conditions. This will be accomplished without the need for excessive expenditures on the capacity of suppliers and transportation. Companies are able to ensure that their supply chains continue to be robust, cost-effective, and capable of maintaining a competitive advantage in a global market that is both dynamic and uncertain if they carefully balance the characteristics listed above.
Despite the unpredictability and volatility of modern business environments, companies are able to prosper because of this strategic shift in focus towards FLEX and SPD, which assures a supply chain that is more efficient and responsive. Consequently, while it is essential to improve RS and TC during the initial phases of resilience development, optimizing FLEX and SPD beyond the threshold of 60% SRES can bring benefits that are more long-lasting and result in improved overall performance.

5. Discussion

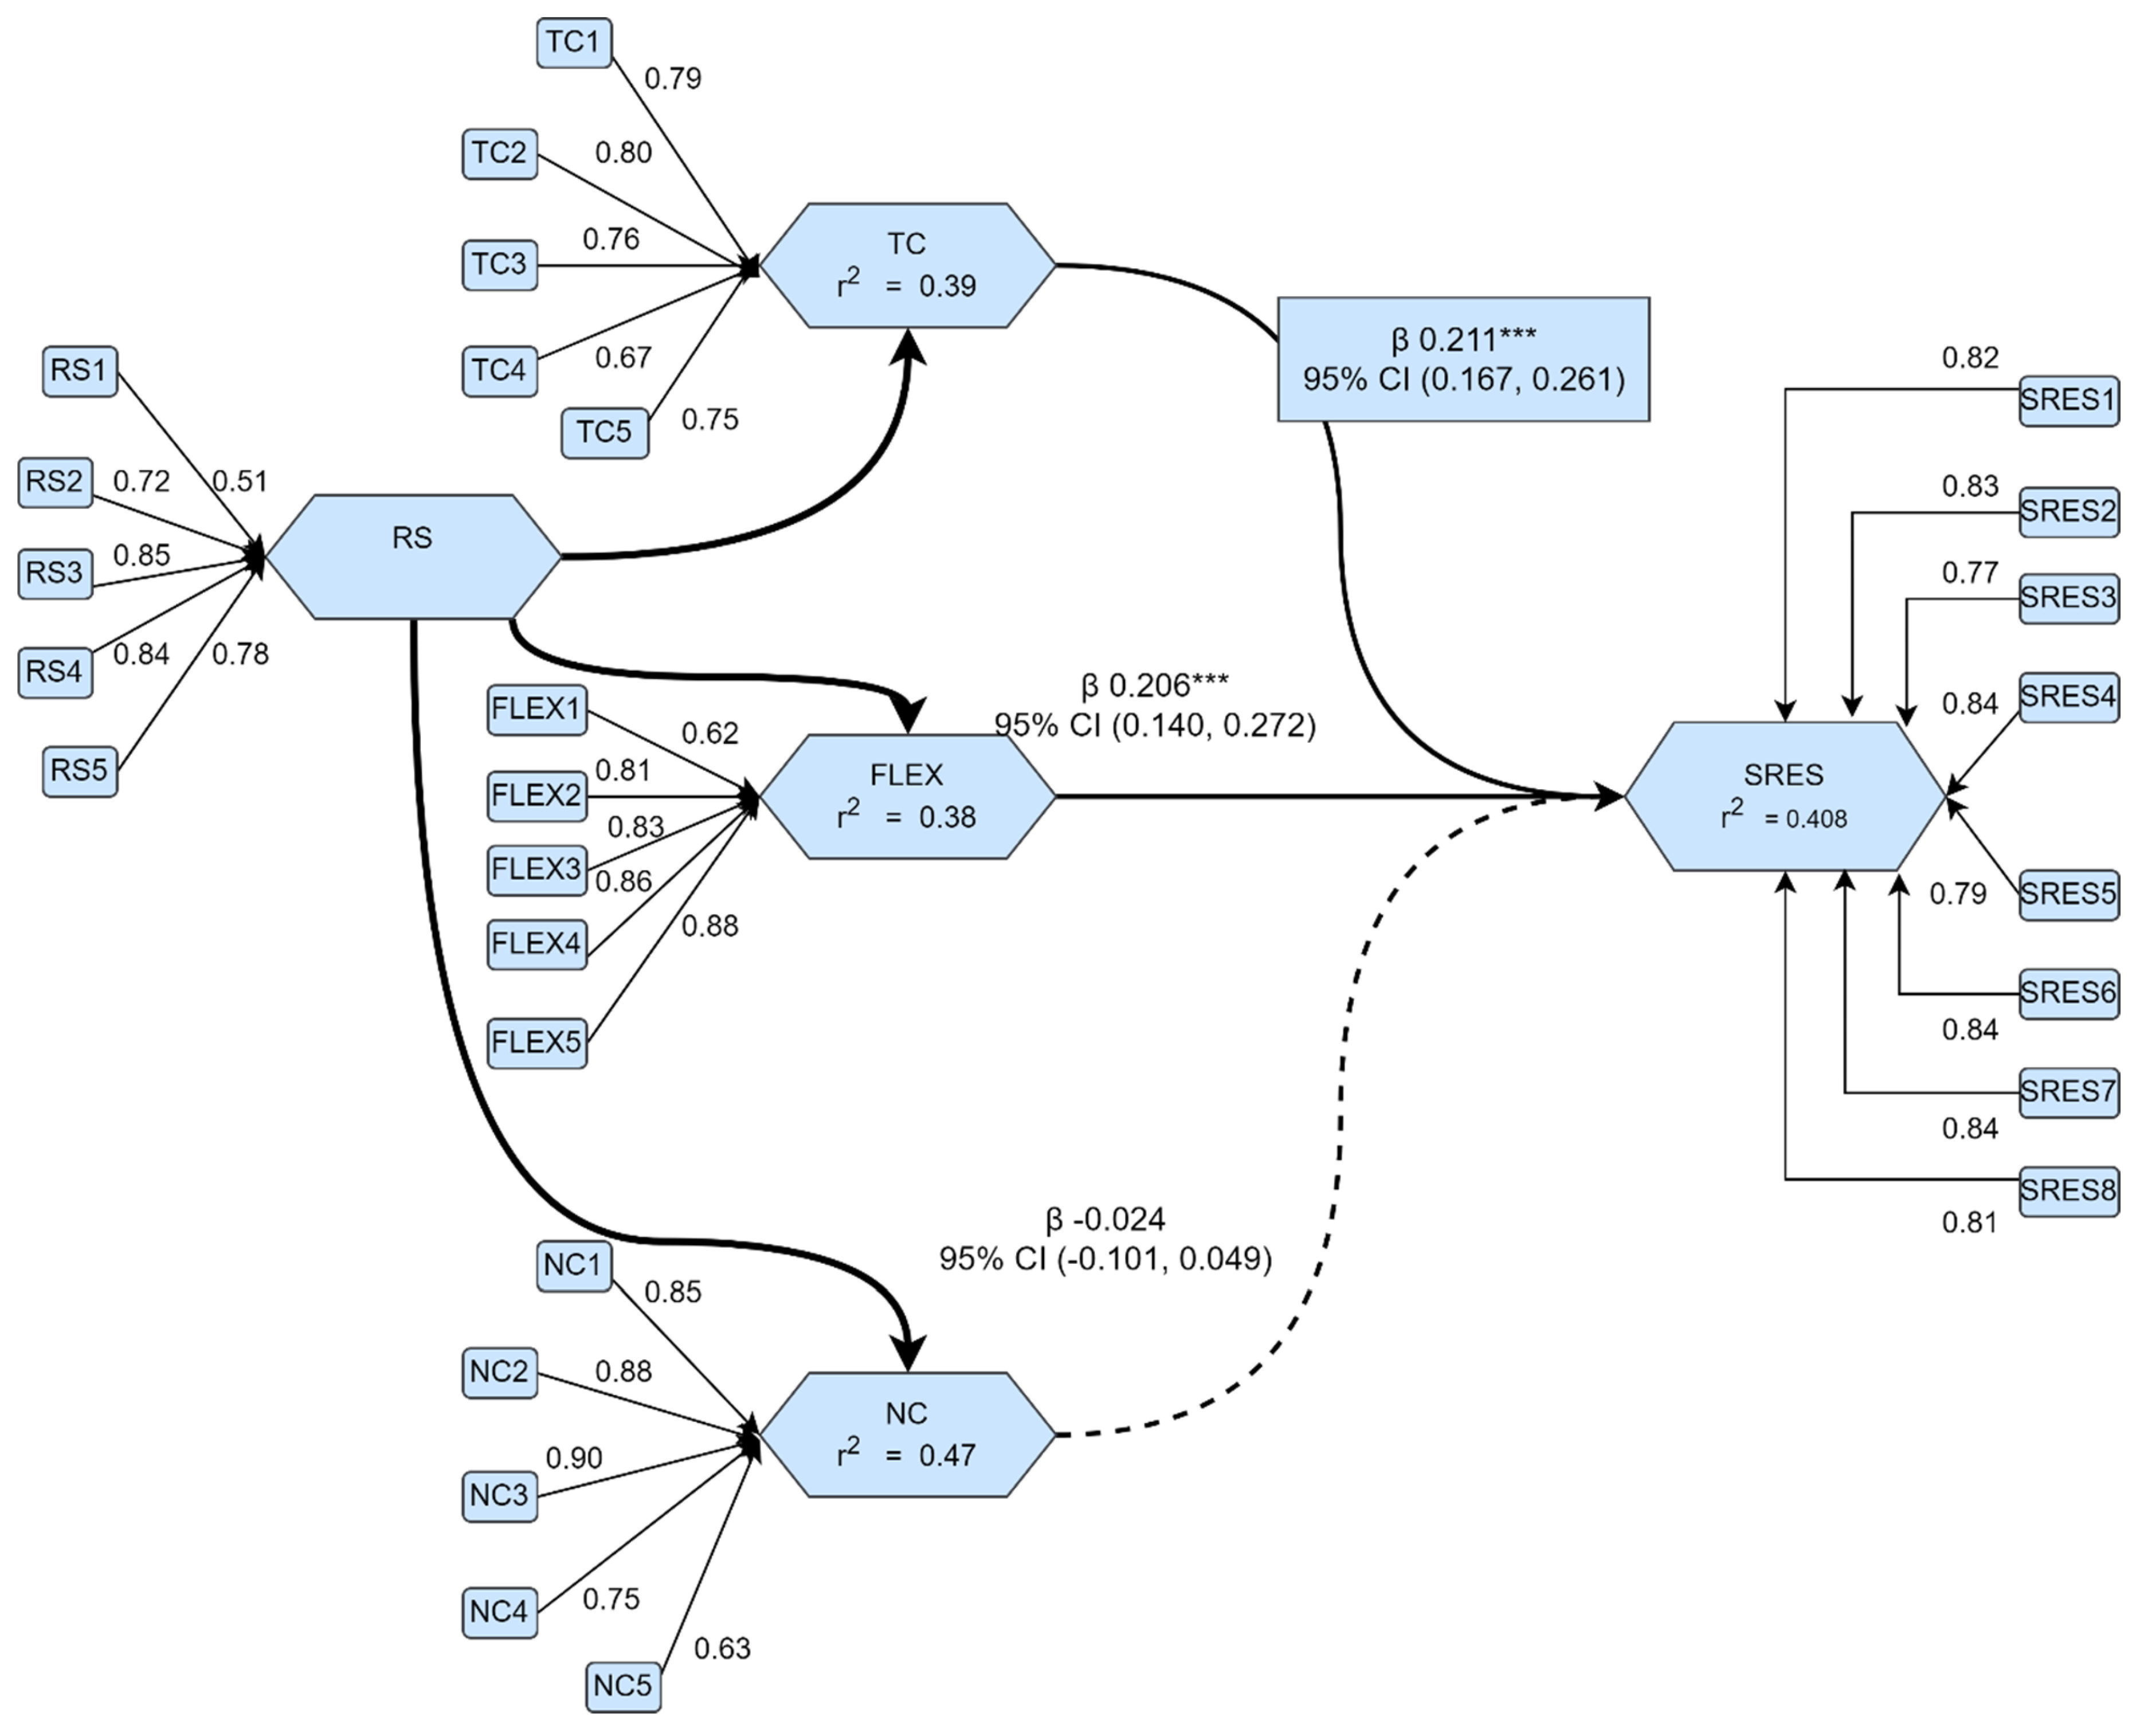
The outcomes of the hypothesis testing on RS and TC in augmenting SRES within the FMCG sector yield substantial insights into the principal determinants of resilience in this business. Hypothesis H1, which asserts a positive correlation between RS and SRES, received robust support with a β value of 0.436 and a highly significant p-value of 0.000. The confidence interval (0.354 to 0.523) reinforces the robustness of this association, showing that resilient providers are essential in enhancing supply chain resilience. RS facilitates an uninterrupted supply of goods and reduces disruptions, so strengthening the overall resilience of the supply chain [53]. Likewise, Hypothesis H2, which investigates the effect of TC on SRES, was accepted with a β value of 0.295 and a p-value of 0.000. The confidence interval for TC (0.179 to 0.400) indicates that transportation capacity is a significant factor influencing supply chain resilience. As supply chains grow increasingly intricate and geographically widespread, adequate transportation capacity is essential to sustain the flow of commodities and respond to interruptions, hence enhancing resilience [39]. These findings answer RQ1 of this study. The findings of H3, H4, and H5 answer RQ2, which indicates that RS and TC are crucial in augmenting SRES within the FMCG sector. RS significantly influences SRES (H3) by fortifying the supply chain, assuring a steady flow of goods during disruptions, and so enhancing overall resilience. The results indicate that RS indirectly improves SRES by positively affecting FLEX (H4). RS provides flexibility by providing options in sourcing or delivery timelines, enabling the supply chain to rapidly adjust to fluctuations in demand or supply circumstances. Conversely, NC does not significantly influence SRES (H5), indicating that, in this case, streamlining the network does not inherently improve resilience. Enhancing the supply chain via RS, sufficient transportation capacity, and adaptability fosters a more flexible and robust system, proficient in successfully addressing disturbances. These aspects collaboratively strengthen the supply chain, guaranteeing its stability and adaptability amid adversities [22,35,49].
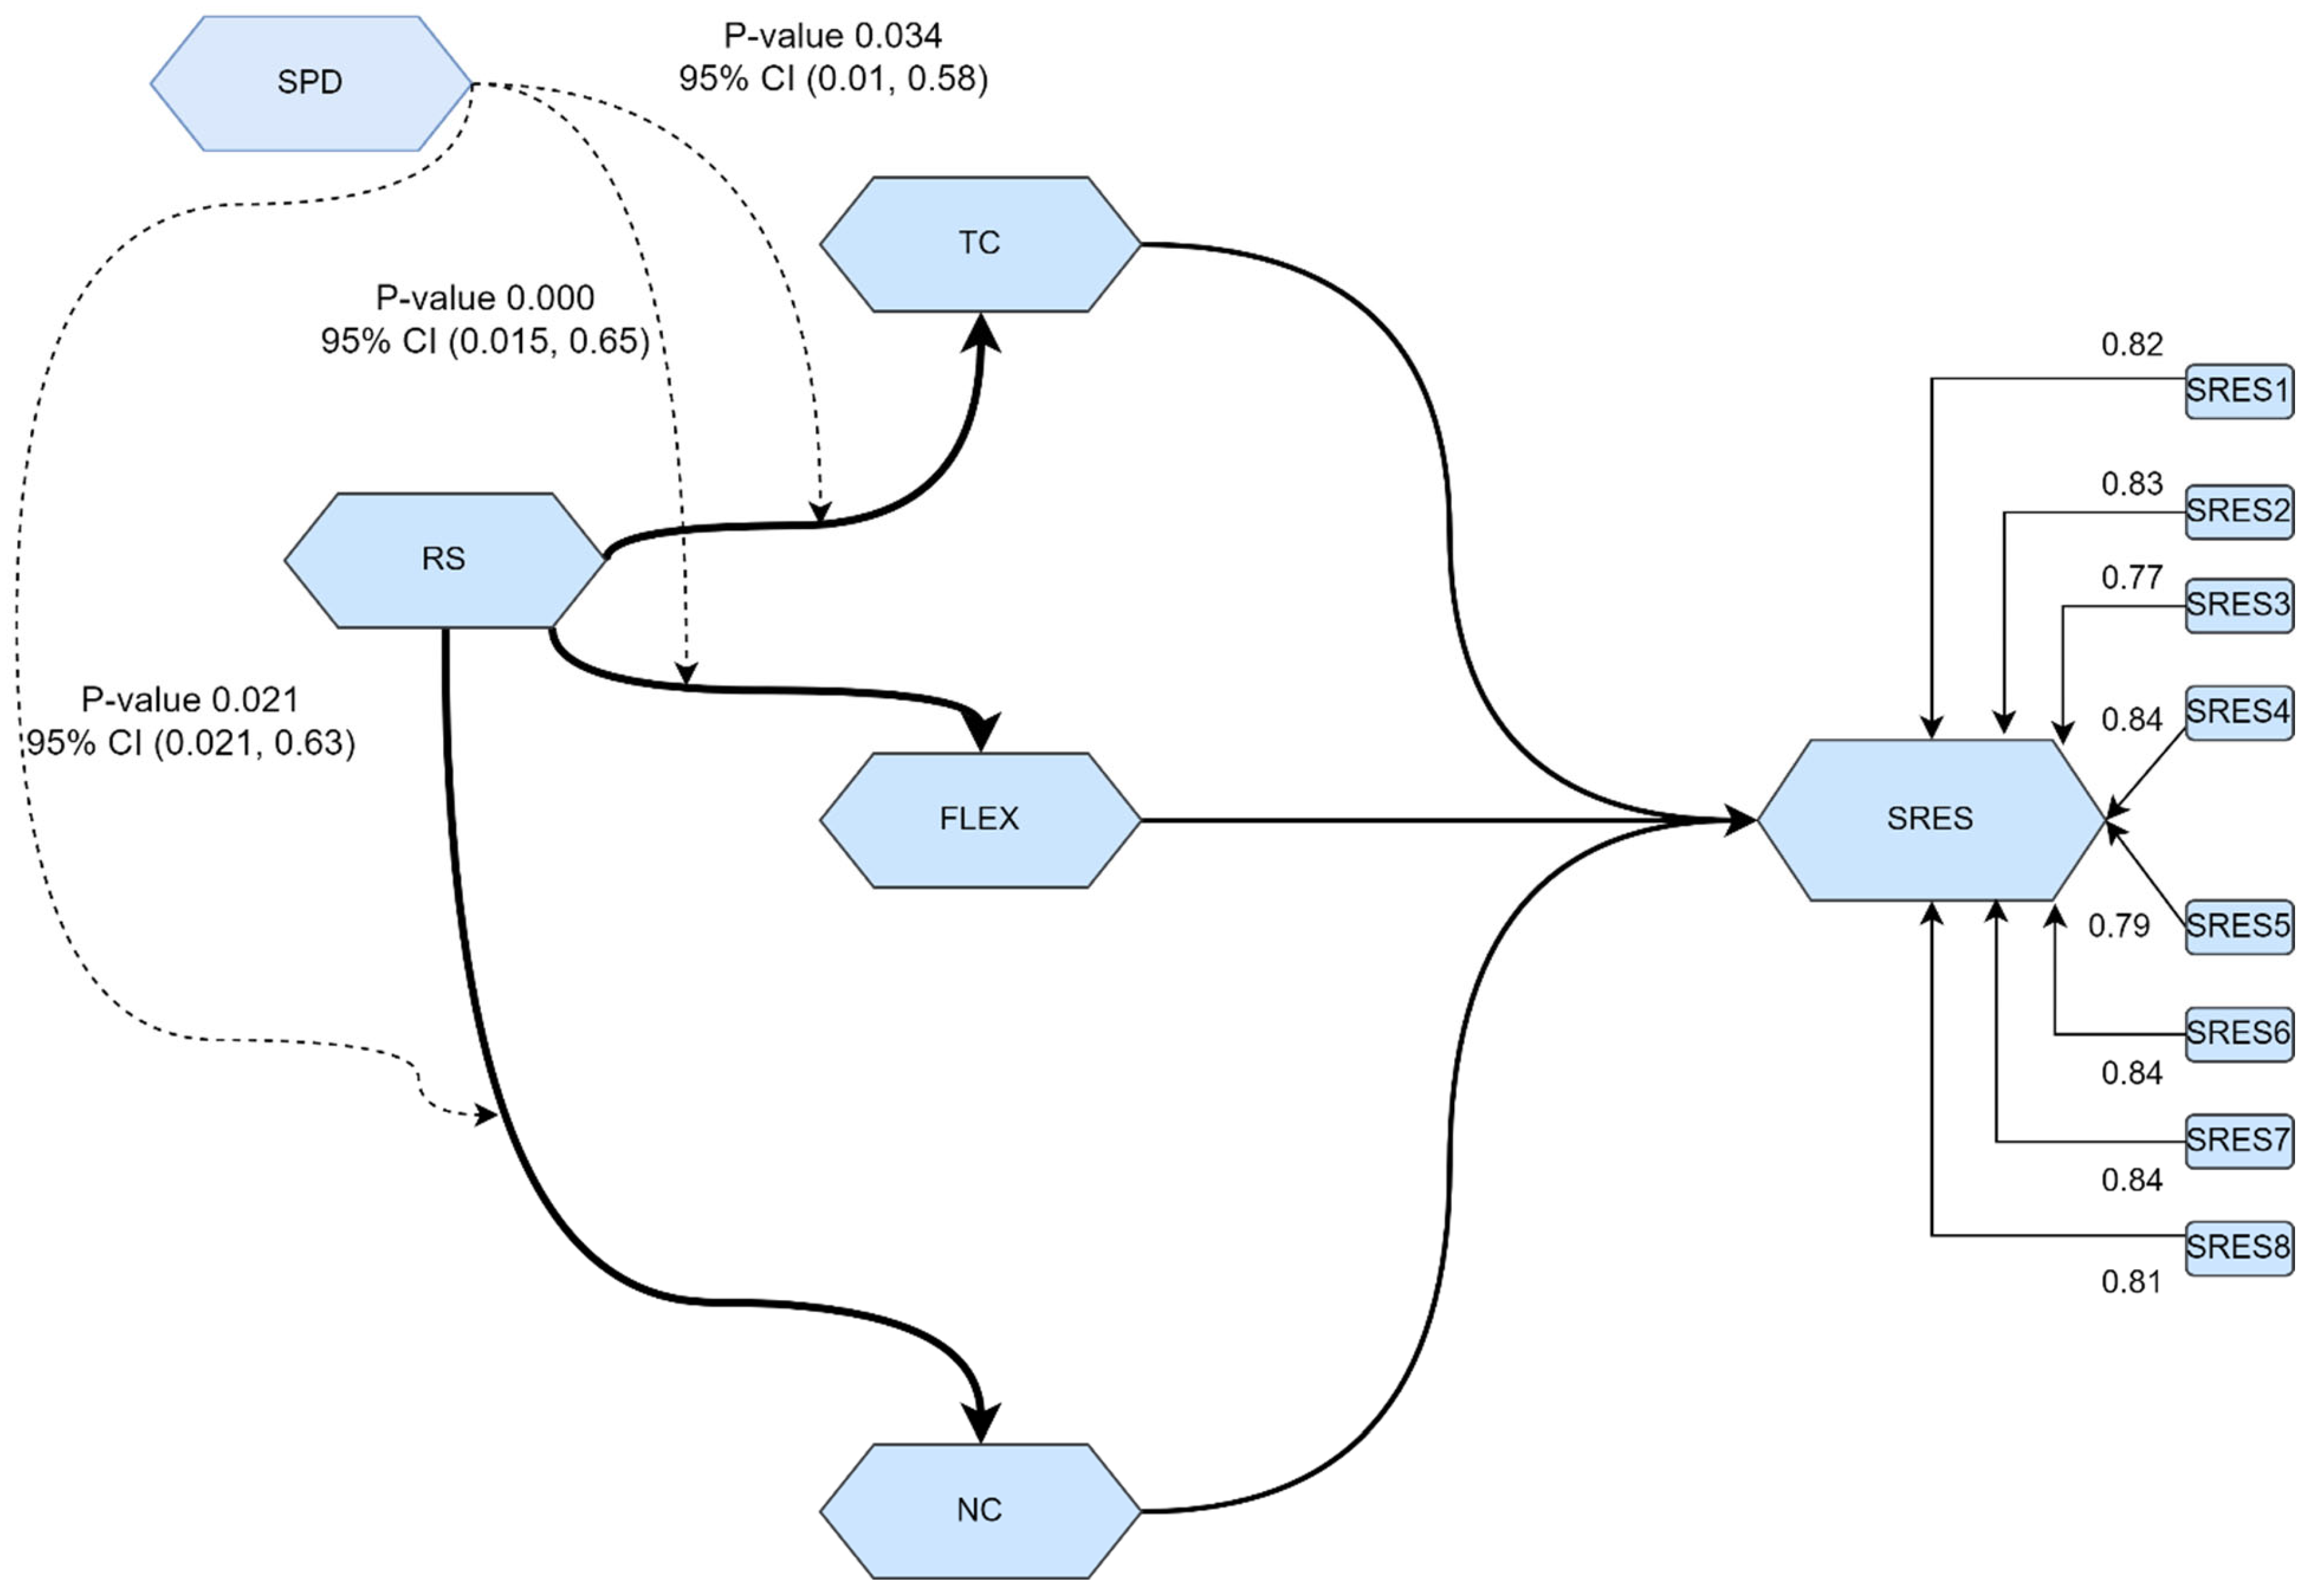
The findings of RQ3 demonstrate how the interplay between SPD and RS augments SRES via several mediating elements. Hypothesis H6 indicates that the synergistic effect of SPD and RS enhances TC, hence reinforcing SRES. A dynamic supply chain, bolstered by robust suppliers, enhances transportation infrastructure, allowing the supply chain to better withstand disturbances and improve its resilience.
Hypothesis H7 indicates that the connection between SPD and RS favorably affects FLEX, hence enhancing SRES. This underscores the essential function of adaptability in a robust supply chain. The capacity to swiftly adjust to variations in demand, supply, and other operational issues is heightened when resilient suppliers collaborate with supply chain dynamism, resulting in improved overall resilience. Hypothesis H8 indicates that the relationship between SPD and RS positively affects NC, which subsequently influences SRES. Although network complexity is a minor contributing component, its association with SPD and RS facilitates the optimization of network design, diminishes inefficiencies, and enhances the supply chain’s responsiveness to interruptions [106,107].
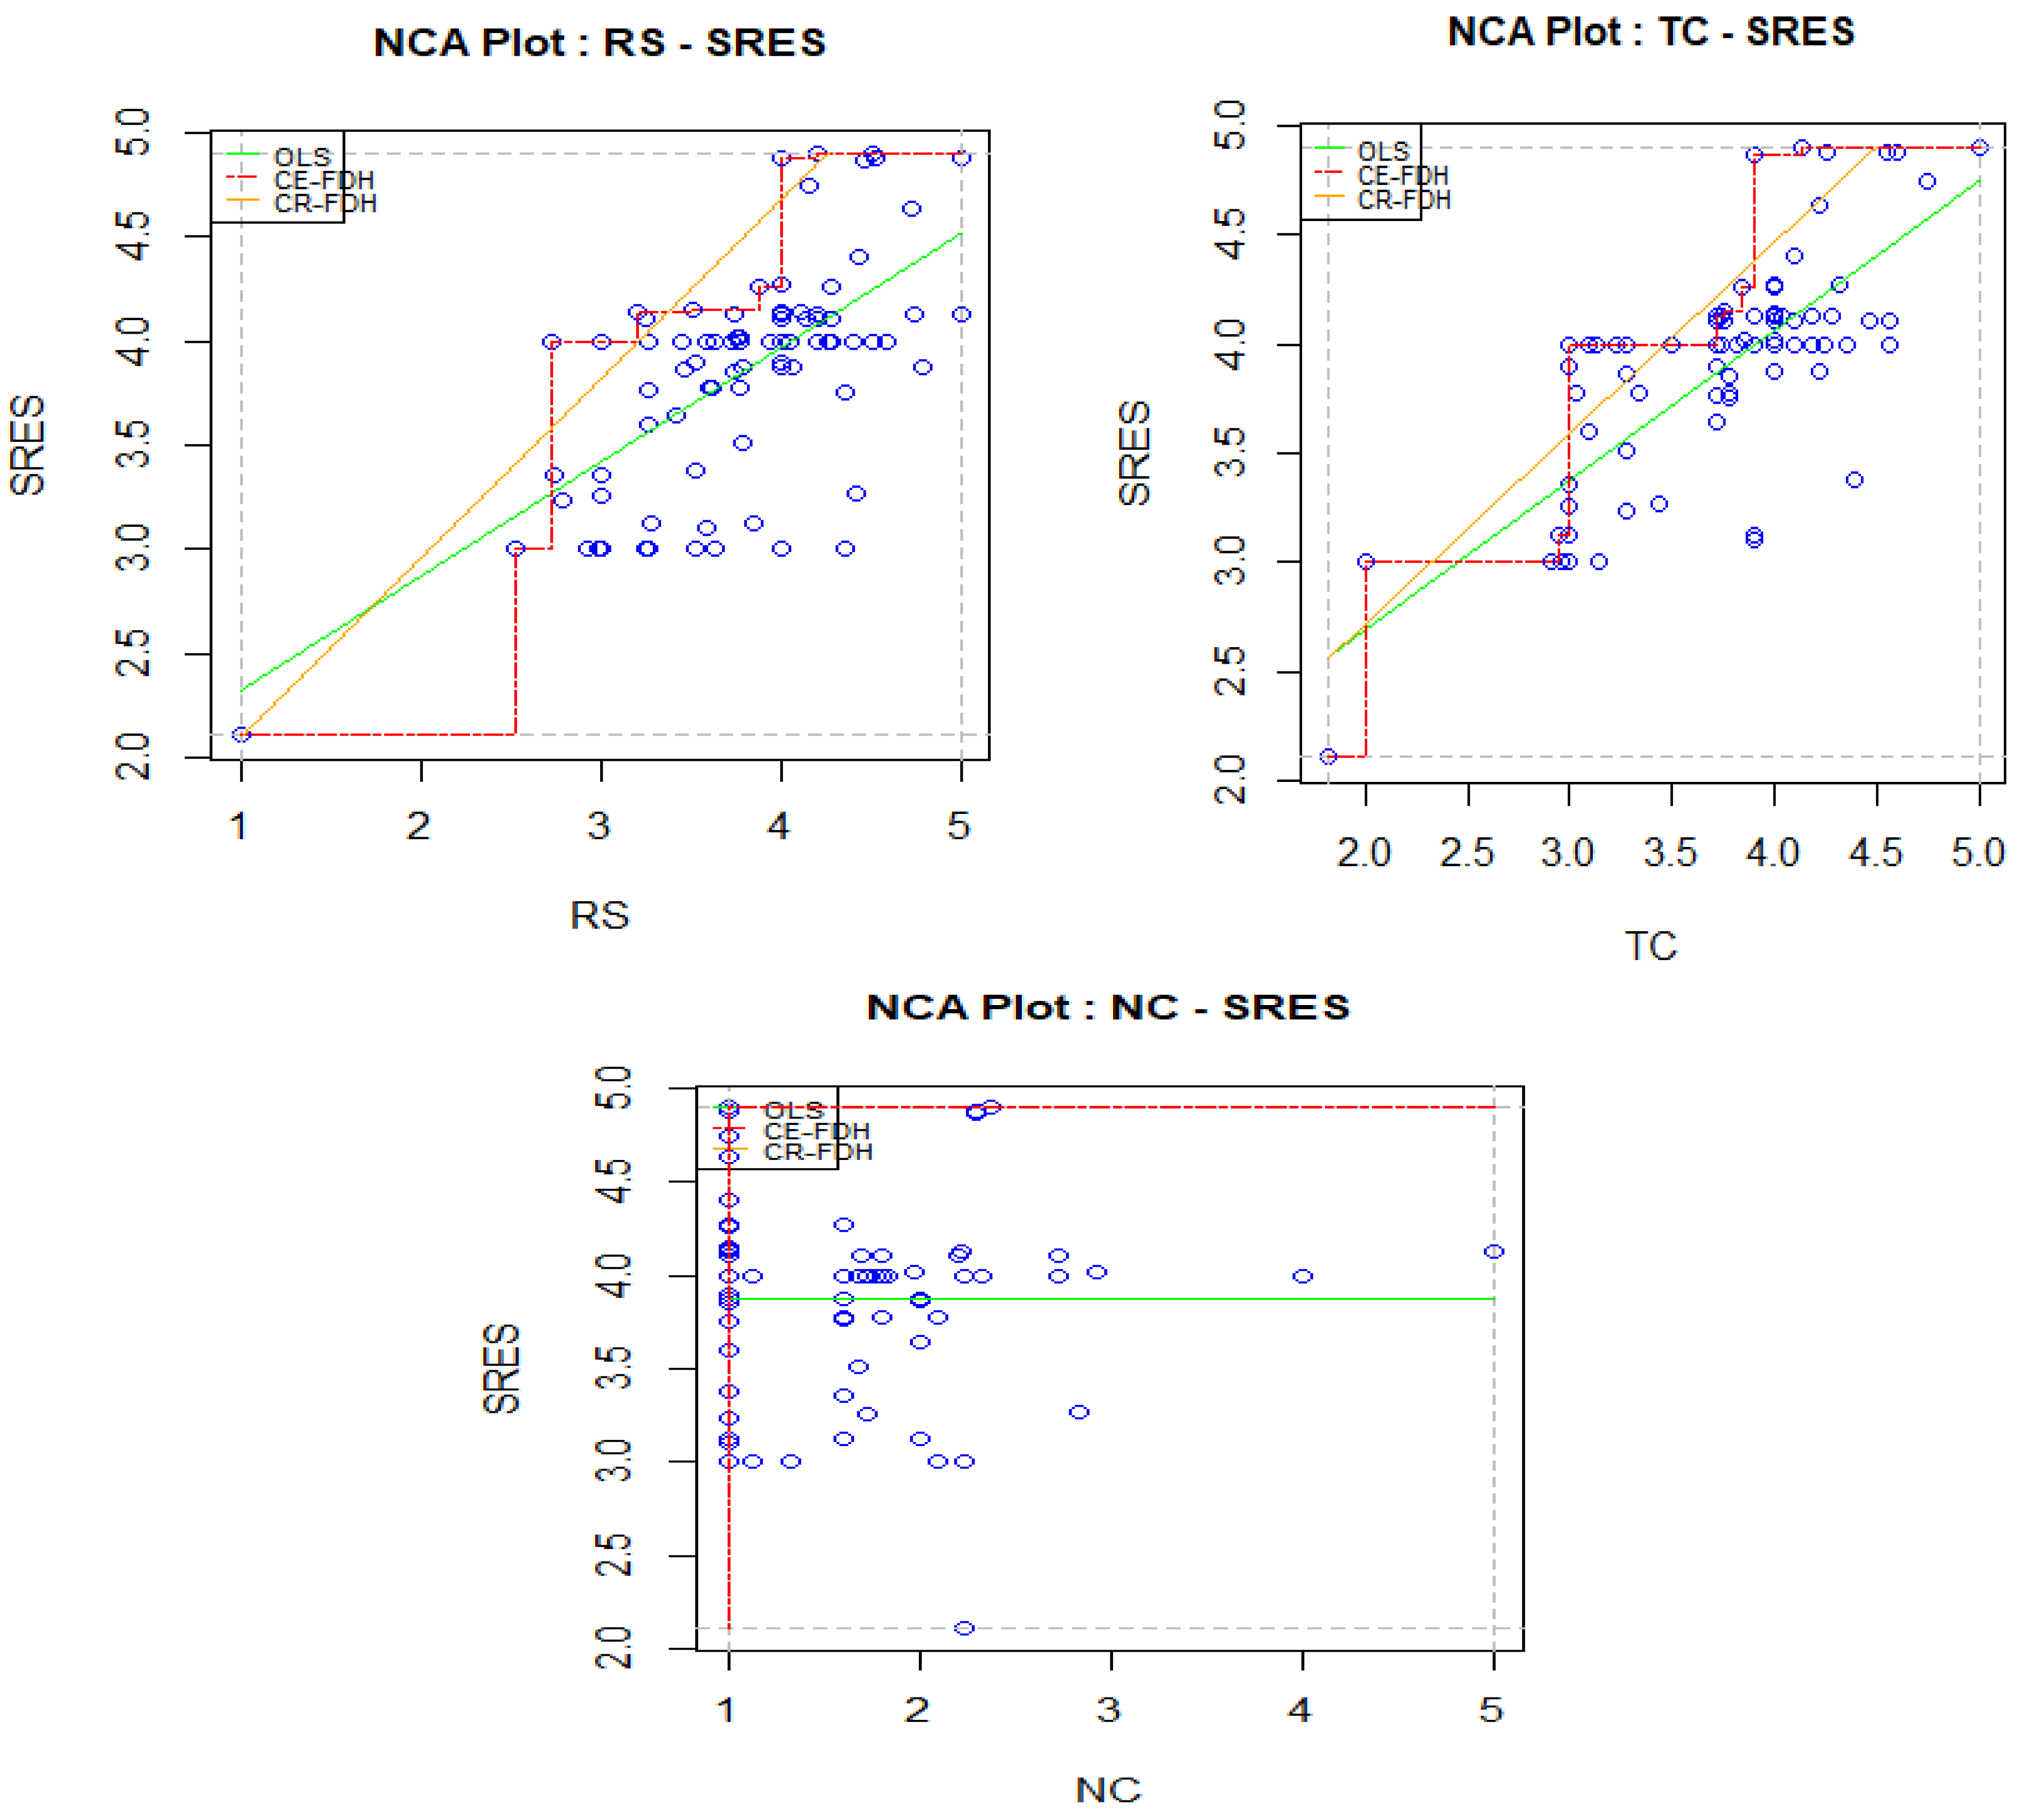
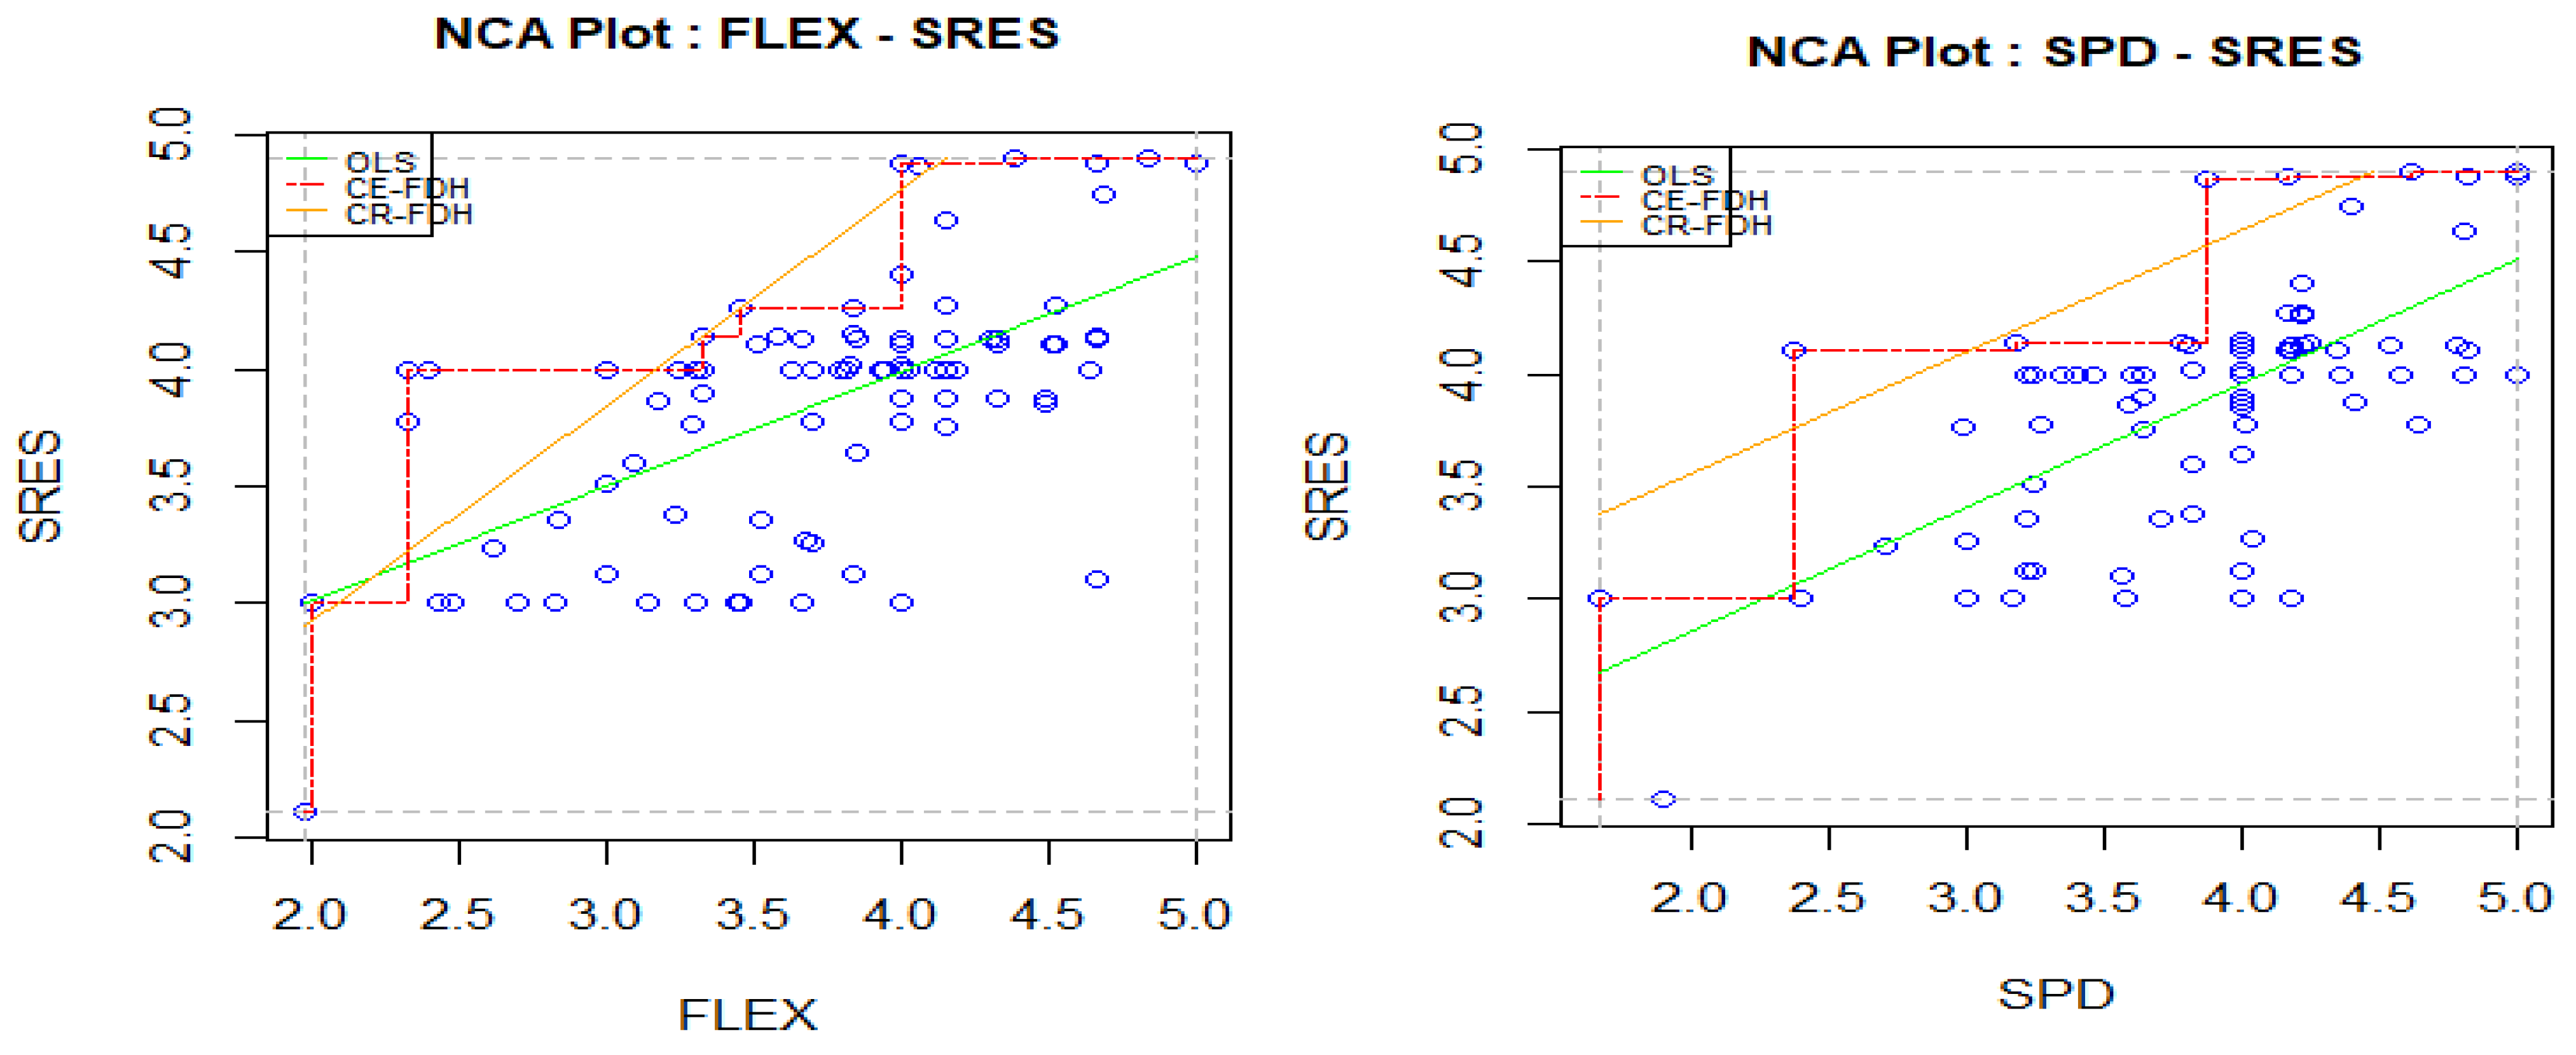
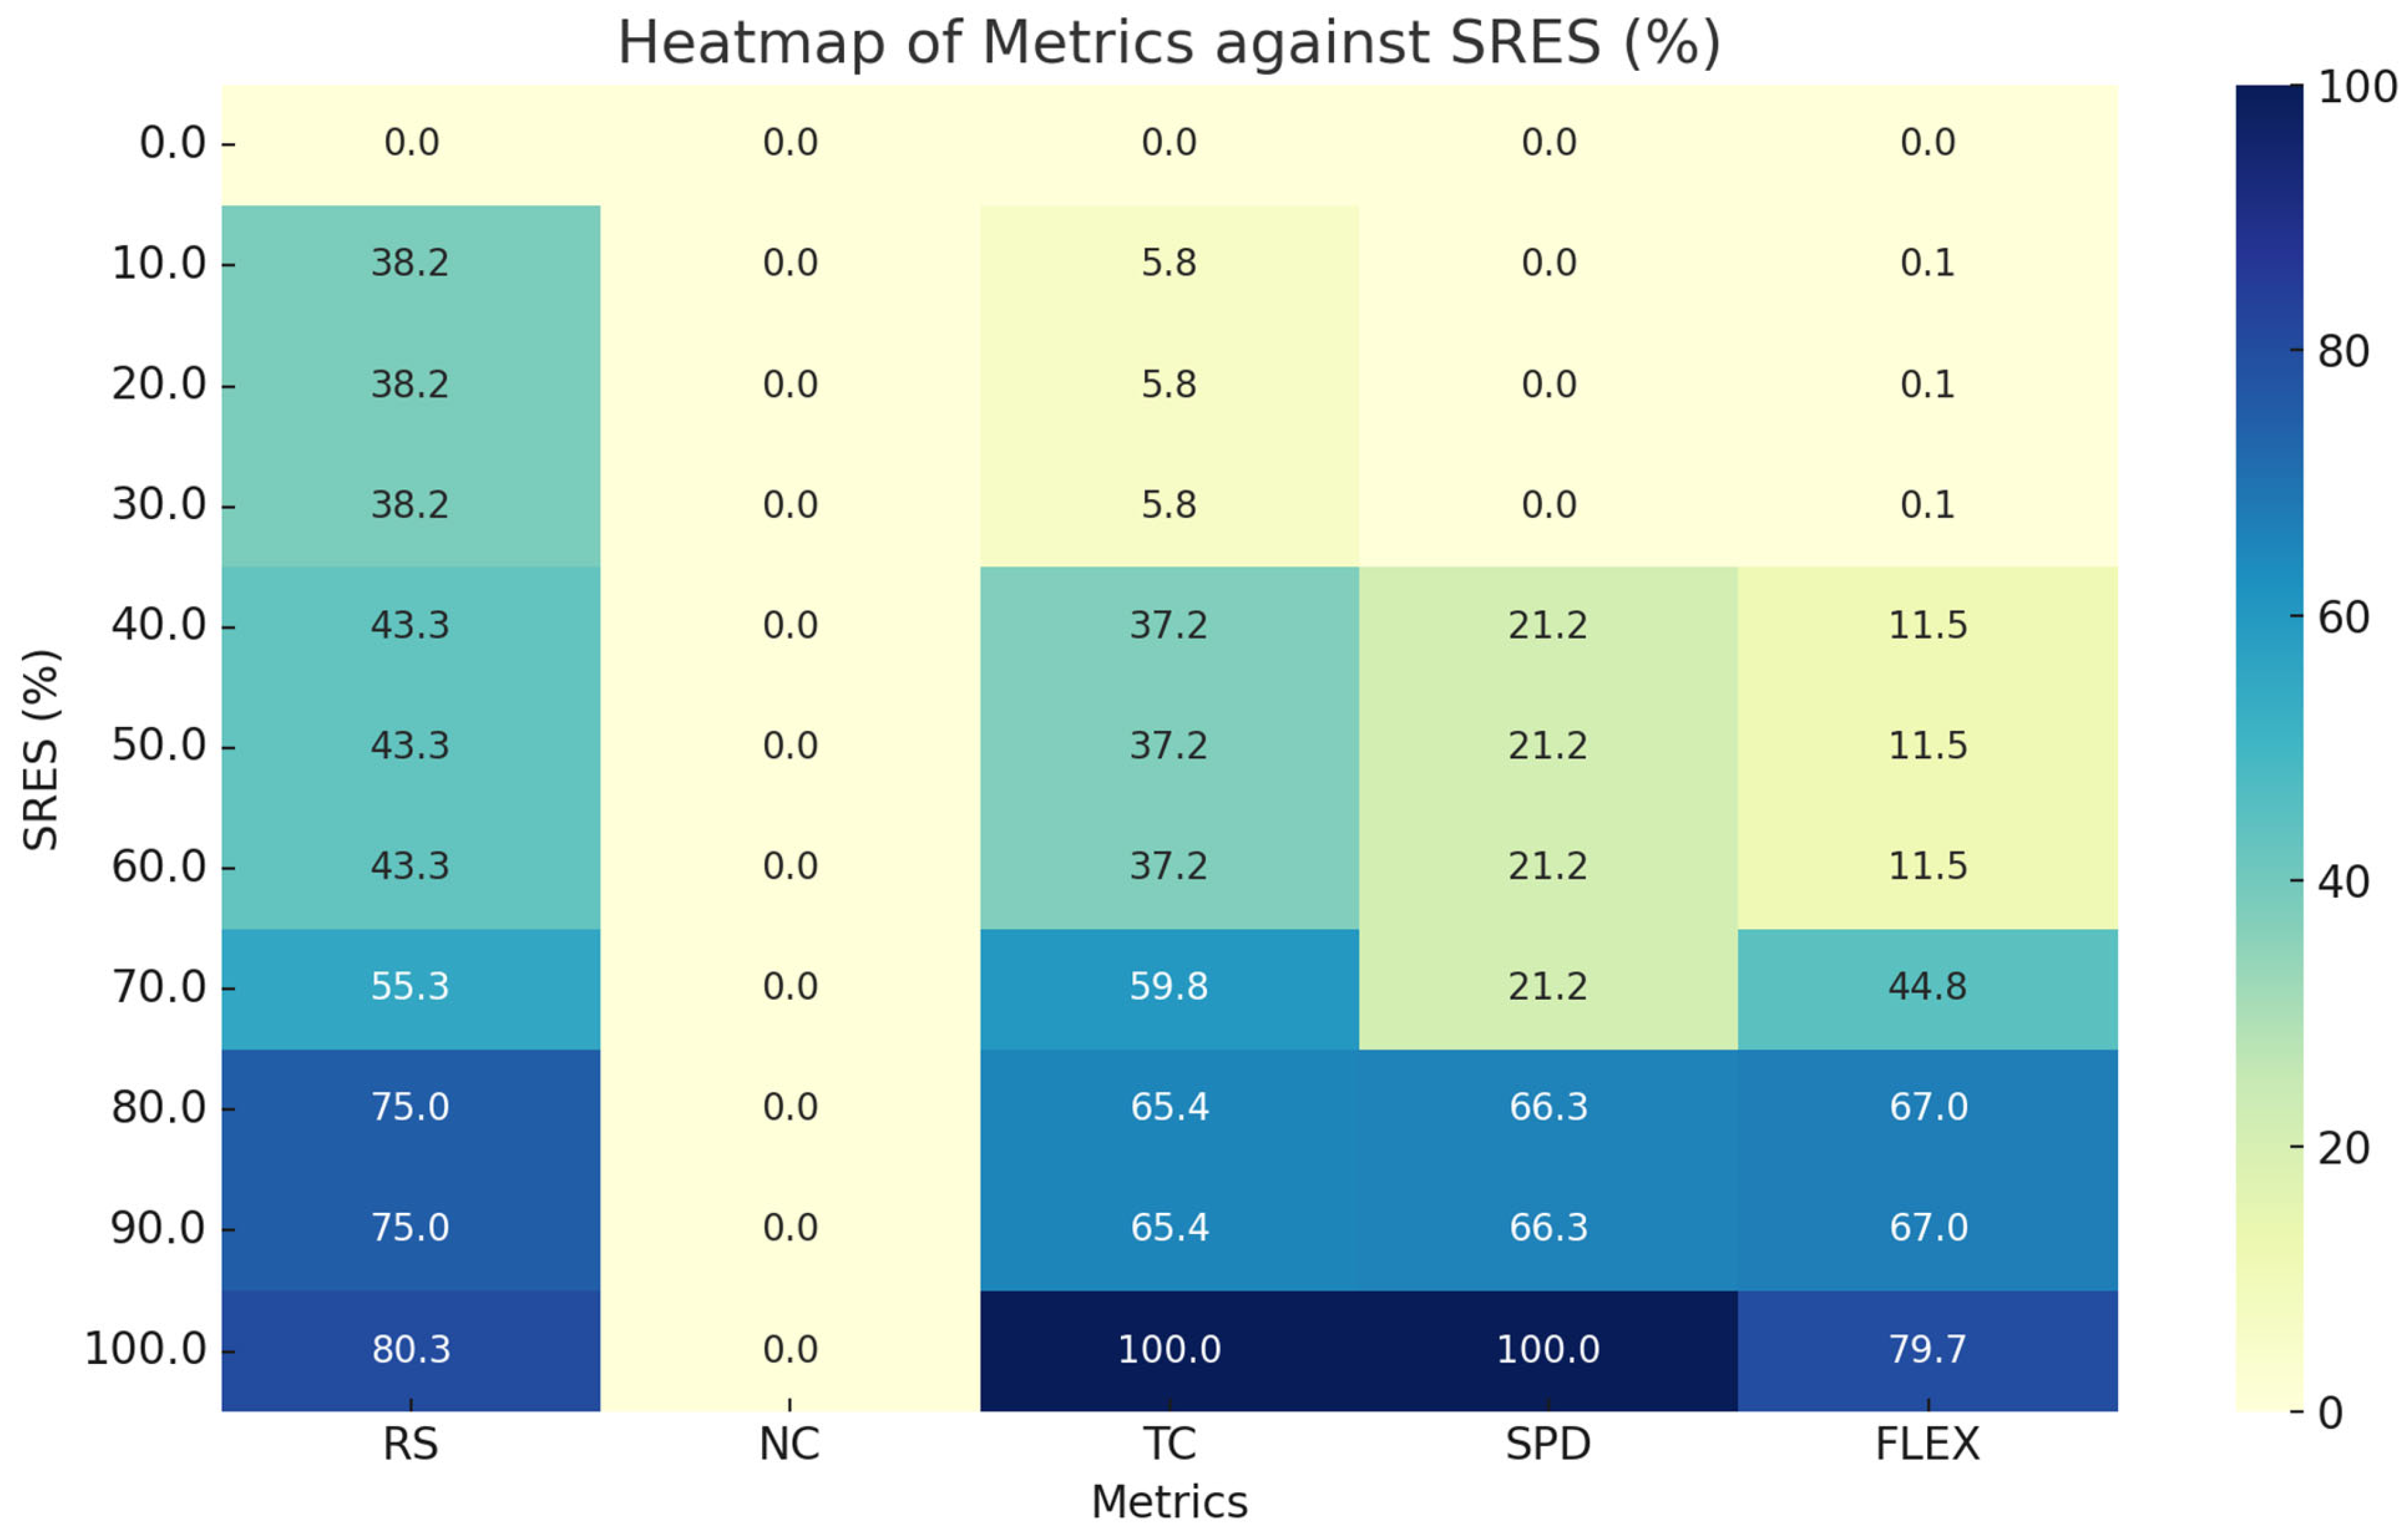
The examination of the bottleneck table yields critical insights into the minimal performance standards required for optimal operational excellence in SRES. Hence, answering RQ 4 Achieving 80% SRES necessitates a balanced and strategic emphasis on RS, TC, FLEX, and SPD. The results indicate that RS and TC are essential at this juncture, with RS attaining a minimum of 75 and TC at 65.4, highlighting the crucial importance of supplier resilience and transportation infrastructure in maintaining overall supply chain stability. RS guarantees a consistent supply of materials despite disruptions, while sufficient transportation capacity is essential to accommodate the heightened needs of a robust supply chain. FLEX and SPD are significant factors, with thresholds of 67% for FLEX and 66.3% for SPD, underscoring the necessity of operational agility and the capacity to adjust dynamically to variations and uncertainties. These features facilitate the supply chain’s effective response to interruptions, guaranteeing uninterrupted operations and minimizing the likelihood of bottlenecks.
Conversely, NC does not provide a substantial impediment to operational excellence, remaining consistently at zero across all benchmarks. This indicates that, in this scenario, NC does not impede the attainment of optimal resilience. To further strengthen resilience, managers should prioritize the cultivation of robust supplier relationships, the assurance of sufficient transportation capacity, and the promotion of operational flexibility and dynamism. Proper alignment of these components can greatly improve supply chain resilience, allowing them to endure and recuperate from disturbances while sustaining operational excellence. In a nutshell, RS, effective TC, operational FLEX, and SPD constitute the fundamental elements of a resilient supply chain. By deliberately concentrating on these domains, businesses can establish a resilient framework that guarantees both stability and adaptation, allowing them to confront future challenges with enhanced resilience and efficiency [60,66].

5.1. Theoretical Implications

This study validates the application of systems theory in the context of supply chain resilience, emphasizing the interdependence of a variety of factors in the supply chain. The research demonstrates that SRES is not the outcome of isolated enhancements in individual components, such as TC, FLEX, RS, or SPD. Rather, it is the result of the dynamic interactions among these factors. Systems theory demonstrates that modifications to a single component, such as RS, can have a cascading effect on others, including TC and FLEX, thereby increasing the system’s overall resilience. This comprehensive, systems-based management approach underscores the significance of observing supply chain resilience as an integrated outcome, where the strengthening of one aspect of the system can have a positive impact on the entire supply chain’s capacity to adapt to change and withstand disruptions.
Furthermore, the recognition of NC as a possible limitation is consistent with TOC, highlighting that excessive complexity might serve as a bottleneck that undermines resilience. Streamlining networks, enhancing coordination, and minimizing redundancies can mitigate these constraints, resulting in more efficient and resilient supply chains. The research illustrates the significance of feedback loops, wherein resilient providers and adaptability enhance information flow and coordination, hence generating a positive reinforcement effect within the supply chain.

5.2. Implications for Management

Managers must first maximize RS and TC if they want to create a strong supply chain. Beyond an ideal level, nevertheless, more investment produces declining benefits. Once these sectors approach efficiency, focus should move to improving FLEX, raising dynamism, and lowering NC for additional resilience increases. Secondly, once these areas are efficient, the focus should shift to improving FLEX, increasing SPD, and reducing NC for additional resilience improvements. FLEX becomes more important as resilience improves, necessitating adaptive production schedules, sourcing strategies, and logistics to ensure rapid reaction to shocks. This study discovered that NC has little effect under moderation on resilience, indicating the need to streamline processes and minimize complexity. As resilience grows, SPD, particularly in decision-making and adaptability, is critical. Managers should invest in systems that allow for speedy decision-making and response. Understanding how these aspects interact allows managers to optimize supply chain operations, ensuring agility and robustness in the face of unanticipated interruptions.

6. Conclusions

The challenges presented by unforeseen disruptions, market fluctuations, and escalating complexity underscore the necessity of enhancing SRES in the contemporary global landscape. This study sought to investigate the influence of critical elements, including RS, TC, FLEX, NC, and supply SPD, on the enhancement of supply chain resilience within the FMCG sector in Pakistan and Saudi Arabia and collect data from 611 respondents. The paper demonstrates, through extensive empirical analysis, the essential function of RS and TC in strengthening SRES, with FLEX and SPD further augmenting adaptability and responsiveness.
This study utilized a systems theory framework, highlighting the interdependence of several supply chain elements, and employed the TOC to NC as a possible impediment. This study utilized a unique and novel dual methodology (PLS-SEM and NCA). The findings of this study indicate that although RS and TC are essential factors in supply chain resilience, the enhancement of flexibility and dynamism is equally significant. Additionally, NC, albeit less critical, was recognized as a limitation inside the system, indicating that prioritizing complexity management is essential to prevent unwanted interruptions and inefficiencies. The findings emphasize the necessity for managers to concentrate on both individual supply chain components and their interconnections. This comprehensive strategy enhances resilience by maximizing the entire system. Establishing a balanced and integrated supply chain, focusing on RS, TC, and FLEX, is essential for enhancing resilience and adaptability to disturbance.

Limitations and Future Directions

This work offers significant insights into supply chain resilience; yet, it possesses some shortcomings that future research could rectify. The research was confined to the FMCG sector in Pakistan and Saudi Arabia, perhaps limiting the generalizability of the results. Subsequent research may investigate supply chain resilience in additional sectors and geographies to augment the generalizability of the findings.
A further limitation is the exclusive reliance on system theory and the TOC to examine the interconnections among supply chain components. Subsequent studies may incorporate additional theories, such as network theory or risk management frameworks, to provide a more holistic understanding of resilience dynamics.
This study’s cross-sectional design restricts its capacity to monitor temporal variations in supply chain resilience. Longitudinal research may yield profound insights into the development and adaptation of resilience during and following disturbances, elucidating the enduring impacts of resilience-building techniques. Finally, the research did not investigate the potential influence of future technologies, such as artificial intelligence, machine learning, and blockchain, on improving supply chain resilience. Future research may investigate the interaction between these technologies and conventional supply chain elements, presenting novel options for improving agility and resilience.

Author Contributions

Conceptualization, methodology, software, validation, formal analysis, and writing—original draft preparation: M.A.A. Writing—review and editing, and supervision: Z.L. All authors have read and agreed to the published version of the manuscript.

Funding

This research received no external funding.

Institutional Review Board Statement

According to Article 32 of the “Measures for Ethical Review of Life Science and Medical Research Involving Human” issued by the Ministry of Science and Technology of China (https://www.gov.cn/zhengce/zhengceku/2023-02/28/content_5743658.htm, accessed on 29 December 2024), ethical review and approval were waived for this study.

Informed Consent Statement

Informed consent was obtained from all subjects involved in the study.

Data Availability Statement

The data are available upon reasonable request.

Acknowledgments

A special thanks to the writing workshop of the International Education School of Chang’an University, China.

Conflicts of Interest

The authors declare no conflicts of interest.

Abbreviations

The following abbreviations are used in this manuscript:
SRESSupply Chain Resilience
RSResilient Suppliers
TCTransportation Capacity
NCNetwork Complexity
FLEXFlexibility
SPDSupply Chain Dynamism
STSystems Theory
TOCTheory of Constraints
FMCGFast Moving Consumer Goods
PLS-SEMPartial Least Square Structural Equation Modeling
NCANecessary Condition Analysis
rhoCComposite Reliability
rhoAConstruct Validity
alphaCronbach’s Alpha
FLFactor Loadings
AVEAverage Variance Extract
VIFVariance Inflation Factor
HTMTHeterotrait–Monotrait Ratio
βOriginal Est.
CIConfidence Interval
SDStandard Deviation
R2Coefficient of Determination
Q2Blindfold Redundancy
CE-FDHCeiling Envelopment-Free Disposal Hull
CR-FDHCeiling Regression-Free Disposal Hull

References

  1. Aming’a, M.; Marwanga, R.; Annan, J. Is it practical to uphold both resilience and sustainability of supply chains using closed-loop supply chain models considering circular economy? An empirical investigation from Kenya. Cogent Bus. Manag. 2024, 11, 2315666. [Google Scholar] [CrossRef]
  2. Xiao, Q.; Khan, M.S. Exploring factors influencing supply chain performance: Role of supply chain resilience with mixed method approach empirical evidence from the Chinese healthcare Sector. Cogent Bus. Manag. 2024, 11, 2287785. [Google Scholar] [CrossRef]
  3. Halosta, C.M. Get The Numbers Behind the Exploding In-Store Retail Media Opportunity. Advertima. Available online: https://advertima.com/blog/detail/retail-media-market-report-highlights/ (accessed on 6 December 2024).
  4. FMCG Market Share, Size, Trends—Industry Growth 2022–2031. Allied Market Research. Available online: https://www.alliedmarketresearch.com/fmcg-market (accessed on 6 December 2024).
  5. Kenton, W. Fast-Moving Consumer Goods (FMCG) Industry: Definition, Types, and Profitability. Investopedia. Available online: https://www.investopedia.com/terms/f/fastmoving-consumer-goods-fmcg.asp (accessed on 6 December 2024).
  6. Malik, W. The FMCG Market and The Pakistani Economy. Available online: https://www.crux.pk/the-fmcg-market-and-the-pakistani-economy/ (accessed on 1 December 2024).
  7. Topic: FMCG Sector in Saudi Arabia. Statista. Available online: https://www.statista.com/topics/9629/fmcg-sector-in-saudi-arabia/ (accessed on 16 November 2024).
  8. Khan, S.A.R.; Zhang, Y.; Golpîra, H.; Qianli, D. The Impact of Green Supply Chain Practices in Business Performance: Evidence from Pakistani FMCG Firms. J. Adv. Manuf. Syst. 2018, 17, 267–275. [Google Scholar] [CrossRef]
  9. Weber, A.N. Responding to supply chain disruptions caused by the COVID-19 pandemic: A Black Swan event for omnichannel retailers. J. Transp. Supply Chain Manag. 2021, 15, 2310–8789. [Google Scholar] [CrossRef]
  10. Li, Y.; Tsang, Y.; Wu, C.; Lee, C. A multi-agent digital twin–enabled decision support system for sustainable and resilient supplier management. Comput. Ind. Eng. 2024, 187, 109838. [Google Scholar] [CrossRef]
  11. Ma, W.; Lin, S.; Ci, Y.; Li, R. Resilience evaluation and improvement of post-disaster multimodal transportation networks. Transp. Res. Part A Policy Pract. 2024, 189, 104243. [Google Scholar] [CrossRef]
  12. Dantas, R.; Sabir, I.; Martins, J.M.; Majid, M.B.; Rafiq, M.; Martins, J.N.; Rana, K. Role of green and multisensory packaging in environmental sustainability: Evidence from FMCG sector of Pakistan. Cogent Bus. Manag. 2023, 10, 2285263. [Google Scholar] [CrossRef]
  13. Agrawal, N.; Sharma, M.; Raut, R.D.; Mangla, S.K.; Arisian, S. Supply Chain Flexibility and Post-pandemic Resilience. Glob. J. Flex. Syst. Manag. 2023, 24, 119–138. [Google Scholar] [CrossRef]
  14. Ho, C.M.; Ko, K.-C.; Liu, S.; Wu, C.-C. Stormy sales: The influence of weather expectations on FMCG consumption. J. Prod. Brand Manag. 2024, 33, 801–814. [Google Scholar] [CrossRef]
  15. Shakur, S.; Lubaba, M.; Debnath, B.; Bari, A.B.M.M.; Rahman, M.A. Exploring the Challenges of Industry 4.0 Adoption in the FMCG Sector: Implications for Resilient Supply Chain in Emerging Economy. Logistics 2024, 8, 27. [Google Scholar] [CrossRef]
  16. Found, P.A.; Mogale, D.; Xu, Z.; Yang, J. Food supply chain resilience in major disruptions. J. Manuf. Technol. Manag. 2024, 35, 655–681. [Google Scholar] [CrossRef]
  17. Echefaj, K.; Charkaoui, A.; Cherrafi, A.; Ivanov, D. Design of resilient and viable sourcing strategies in intertwined circular supply networks. Ann. Oper. Res. 2024, 337, 459–498. [Google Scholar] [CrossRef]
  18. Ju, C.; Zhao, J.; Li, K.; Bao, F.; Xu, C.; Ran, J. Supply Chain Recovery Strategies for High Demand Products Based on the Impact of Capacity and Transportation Disruptions. Systems 2022, 10, 88. [Google Scholar] [CrossRef]
  19. Agyei, V.; Adom-Asamoah, G.; Poku-Boansi, M. Sustainable transportation in Africa: A bibliometric, visualisation and thematic analysis. J. Clean. Prod. 2024, 462, 142727. [Google Scholar] [CrossRef]
  20. Ghomi, V.; Nooraei, S.V.R.; Shekarian, N.; Shokoohyar, S.; Parast, M. Improving supply chain resilience through investment in flexibility and innovation. Int. J. Syst. Sci. Oper. Logist. 2023, 10, 2221068. [Google Scholar] [CrossRef]
  21. Yang, Z.; Wu, M.; Sun, J.; Zhang, Y. Aligning redundancy and flexibility for supply chain resilience: A literature synthesis. J. Risk Res. 2024, 27, 313–335. [Google Scholar] [CrossRef]
  22. Chowdhury, M.H.; Quaddus, M.; Chowdhury, M. Managing relational practices for performance improvement in a complex supply chain network: The mediating roles of proactive and reactive resilience in apparel industry of Bangladesh. Int. J. Logist. Manag. 2022, 34, 34–59. [Google Scholar] [CrossRef]
  23. Chatha, K.; Jalil, M. Complexity in three-echelon supply chain network and manufacturing firm’s operational performance. Comput. Ind. Eng. 2022, 169, 108196. [Google Scholar] [CrossRef]
  24. Hirsch, K.; Niemann, W.; Swart, B. Artificial Intelligence and Information Systems Capabilities for Supply Chain Resilience: A Study in the South African Fast-Moving Consumer Goods Industry. J. Transp. Supply Chain. Manag. 2024, 18, 1–16. [Google Scholar] [CrossRef]
  25. Manzoor, R.; Sahay, B.; Gumte, K.; Singh, S.K. Blockchain-backed resilient strategies in a stochastic supply chain sourcing and distribution environment under disruption: Implications for B2B sector. J. Bus. Ind. Mark. 2024, 40, 223–249. [Google Scholar] [CrossRef]
  26. Chowdhury, P.; Paul, S.K.; Kaisar, S.; Moktadir, M.A. COVID-19 pandemic related supply chain studies: A systematic review. Transp. Res. Part E Logist. Transp. Rev. 2021, 148, 102271. [Google Scholar] [CrossRef] [PubMed]
  27. Mawonde, D.; Samuel, B.; Nyoni, J.; Muzenda, A.C. The effect of supply chain resilient strategies on operational performance of humanitarian organisations in Zimbabwe during the Coronavirus period. Cogent Bus. Manag. 2023, 10, 2246741. [Google Scholar] [CrossRef]
  28. Ruiz-Benítez, R.; López, C.; Real, J.C. The lean and resilient management of the supply chain and its impact on performance. Int. J. Prod. Econ. 2018, 203, 190–202. [Google Scholar] [CrossRef]
  29. Shamout, M.D. The role of supply chain analytics on supply chain responsiveness, resilience, and restoration (3Rs) capabilities in the United Arab Emirates. Bus. Strat. Dev. 2024, 7, e374. [Google Scholar] [CrossRef]
  30. Al-Shboul, M.A. An investigation of transportation logistics strategy on manufacturing supply chain responsiveness in developing countries: The mediating role of delivery reliability and delivery speed. Heliyon 2022, 8, e11283. [Google Scholar] [CrossRef]
  31. Orlando, B.; Tortora, D.; Pezzi, A.; Bitbol-Saba, N. The disruption of the international supply chain: Firm resilience and knowledge preparedness to tackle the COVID-19 outbreak. J. Int. Manag. 2022, 28, 100876. [Google Scholar] [CrossRef]
  32. Liang, D.; Li, Y.; Li, Y.; Xin, J. Dynamic selection and order allocation of resilient suppliers based on improved fuzzy multi-criteria decision method. J. Chin. Inst. Eng. 2024, 47, 442–455. [Google Scholar] [CrossRef]
  33. Xu, M.; Radhakrishnan, S.; Kamarthi, S.; Jin, X. Resiliency of Mutualistic Supplier-Manufacturer Networks. Sci. Rep. 2019, 9, 13559. [Google Scholar] [CrossRef]
  34. Schmelzle, U.; Mukandwal, P.S. The impact of supply chain relationship configurations on supplier performance: Investigating buyer–supplier relations in the aerospace industry. Int. J. Logist. Manag. 2023, 34, 1301–1321. [Google Scholar] [CrossRef]
  35. Gligor, D. Performance implications of the fit between suppliers ‘flexibility and their customers’ expected flexibility: A dyadic examination. J. Oper. Manag. 2018, 58–59, 73–85. [Google Scholar] [CrossRef]
  36. Gan, J.; Zhong, S.; Liu, S.; Yang, D. Resilient Supplier Selection Based on Fuzzy BWM and GMo-RTOPSIS under Supply Chain Environment. Discret. Dyn. Nat. Soc. 2019, 2019, 2456260. [Google Scholar] [CrossRef]
  37. Wang, M.; Wood, L.C.; Wang, B. Transportation capacity shortage influence on logistics performance: Evidence from the driver shortage. Heliyon 2022, 8, e09423. [Google Scholar] [CrossRef] [PubMed]
  38. Gaitanidou, E.; Tsami, M.; Bekiaris, E. A review of resilience management application tools in the transport sector. Transp. Res. Procedia 2017, 24, 235–240. [Google Scholar] [CrossRef]
  39. Ahmed, S.; Dey, K. Resilience modeling concepts in transportation systems: A comprehensive review based on mode, and modeling techniques. J. Infrastruct. Preserv. Resil. 2020, 1, 8. [Google Scholar] [CrossRef]
  40. Zhou, Y.; Wang, J.; Yang, H. Resilience of Transportation Systems: Concepts and Comprehensive Review. IEEE Trans. Intell. Transp. Syst. 2019, 20, 4262–4276. [Google Scholar] [CrossRef]
  41. Fugate, B.S.; Davis-Sramek, B.; Goldsby, T.J. Operational collaboration between shippers and carriers in the transportation industry. Int. J. Logist. Manag. 2009, 20, 425–447. [Google Scholar] [CrossRef]
  42. Namdar, J.; Torabi, S.A.; Sahebjamnia, N.; Pradhan, N.N. Business continuity-inspired resilient supply chain network design. Int. J. Prod. Res. 2021, 59, 1331–1367. [Google Scholar] [CrossRef]
  43. Chen, H.; Zhou, R.; Chen, H.; Lau, A. Static and dynamic resilience assessment for sustainable urban transportation systems: A case study of Xi’an, China. J. Clean. Prod. 2022, 368, 133237. [Google Scholar] [CrossRef]
  44. Hosseini, S.; Al Khaled, A. A hybrid ensemble and AHP approach for resilient supplier selection. J. Intell. Manuf. 2019, 30, 207–228. [Google Scholar] [CrossRef]
  45. Zhang, J.; Cai, W.; Philbin, S.P.; Li, H.; Lu, Q.-C.; Ballesteros-Pérez, P.; Yang, G.-L. Measuring the capacity utilization of China’s transportation industry under environmental constraints. Transp. Res. Part D Transp. Environ. 2020, 85, 102450. [Google Scholar] [CrossRef]
  46. Brusset, X.; Teller, C. Supply chain capabilities, risks, and resilience. Int. J. Prod. Econ. 2017, 184, 59–68. [Google Scholar] [CrossRef]
  47. Erboz, G.; Hüseyinoğlu, I.Ö.Y. The role of Industry 4.0 on supply chain cost and supply chain flexibility. Bus. Process. Manag. J. 2023, 29, 1330–1351. [Google Scholar] [CrossRef]
  48. Piprani, A.Z.; Jaafar, N.I.; Ali, S.M.; Mubarik, M.S.; Shahbaz, M. Multi-dimensional supply chain flexibility and supply chain resilience: The role of supply chain risks exposure. Oper. Manag. Res. 2022, 15, 307–325. [Google Scholar] [CrossRef]
  49. Tamym, L.; Benyoucef, L.; Moh, A.N.S.; El Ouadghiri, M.D. Big data analytics-based approach for robust, flexible and sustainable collaborative networked enterprises. Adv. Eng. Inform. 2023, 55, 101873. [Google Scholar] [CrossRef]
  50. Dubey, R.; Gunasekaran, A.; Childe, S.J. Big data analytics capability in supply chain agility: The moderating effect of organizational flexibility. Manag. Decis. 2018, 57, 2092–2112. [Google Scholar] [CrossRef]
  51. Azadegan, A.; Modi, S.; Lucianetti, L. Surprising supply chain disruptions: Mitigation effects of operational slack and supply redundancy. Int. J. Prod. Econ. 2021, 240, 108218. [Google Scholar] [CrossRef]
  52. Zhang, H.; Jia, F.; You, J.-X. Striking a balance between supply chain resilience and supply chain vulnerability in the cross-border e-commerce supply chain. Int. J. Logist. Res. Appl. 2023, 26, 320–344. [Google Scholar] [CrossRef]
  53. Akbar, B.; Aslam, H. Reinforcing resilience on the supply side: The role of supplier capabilities. Bus. Process. Manag. J. 2023, 29, 1938–1957. [Google Scholar] [CrossRef]
  54. Kamalahmadi, M.; Shekarian, M.; Parast, M.M. The impact of flexibility and redundancy on improving supply chain resilience to disruptions. Int. J. Prod. Res. 2022, 60, 1992–2020. [Google Scholar] [CrossRef]
  55. Jafari, H.; Eslami, M.H.; Paulraj, A. Postponement and logistics flexibility in retailing: The moderating role of logistics integration and demand uncertainty. Int. J. Prod. Econ. 2022, 243, 108319. [Google Scholar] [CrossRef]
  56. Jum’A, L.; Bushnaq, M. Investigating the role of flexibility as a moderator between supply chain integration and firm performance: The case of manufacturing sector. J. Adv. Manag. Res. 2024, 21, 203–227. [Google Scholar] [CrossRef]
  57. Yan, F.; Yin, S.; Chen, L.; Jia, F. Complexity in a platform-based servitization: A complex adaptability theory perspective. Int. J. Logist. Res. Appl. 2024, 27, 1092–1111. [Google Scholar] [CrossRef]
  58. Chen, J.; Liu, G.; Wang, Y. Enhance or impair: How does downstream complexity influence supply chain resilience with reconciling effects of intelligent manufacturing? J. Manuf. Technol. Manag. 2023, 34, 1356–1376. [Google Scholar] [CrossRef]
  59. Brandon-Jones, E.; Squire, B.; Autry, C.W.; Petersen, K.J. A Contingent Resource-Based Perspective of Supply Chain Resilience and Robustness. J. Supply Chain Manag. 2014, 50, 55–73. [Google Scholar] [CrossRef]
  60. Chowdhury, M.H.; Chowdhury, P.; Quaddus, M.; Rahman, K.W.; Shahriar, S. Flexibility in Enhancing Supply Chain Resilience: Developing a Resilience Capability Portfolio in the Event of Severe Disruption. Glob. J. Flex. Syst. Manag. 2024, 25, 395–417. [Google Scholar] [CrossRef]
  61. Wissuwa, F.; Durach, C.F.; Choi, T.Y. Selecting resilient suppliers: Supplier complexity and buyer disruption. Int. J. Prod. Econ. 2022, 253, 108601. [Google Scholar] [CrossRef]
  62. Iftikhar, A.; Ali, I.; Stevenson, M. The silver lining of supply chain complexity: Building supply chain resilience and robustness through exploitation and exploration. Supply Chain Manag. Int. J. 2023, 29, 244–259. [Google Scholar] [CrossRef]
  63. Donadoni, M.; Caniato, F.; Cagliano, R. Linking product complexity, disruption and performance: The moderating role of supply chain resilience. Supply Chain Forum Int. J. 2018, 19, 300–310. [Google Scholar] [CrossRef]
  64. Chowdhury, M.H.; Quaddus, M.; Agarwal, R. Supply chain resilience for performance: Role of relational practices and network complexities. Supply Chain Manag. Int. J. 2019, 24, 659–676. [Google Scholar] [CrossRef]
  65. Asafo-Adjei, E.; Hamidu, Z.; Issau, K.; Seidu, B.A.; Adam, A.M. The dark and bright side of network complexity: Novel insights from an asymmetric supply chain recovery and disruption approach. Cogent Bus. Manag. 2023, 10, 2225808. [Google Scholar] [CrossRef]
  66. Mashiloane, M.W.; Mafini, C.; Pooe, R.D. Supply chain dynamism, information sharing, inter-organisational relationships and supply chain performance in the manufacturing sector. Acta Commer. 2018, 18, 1–15. [Google Scholar] [CrossRef]
  67. Isnaini, D.B.Y.; Nurhaida, T.; Pratama, I. Moderating Effect of Supply Chain Dynamic Capabilities on the Relationship of Sustainable Supply Chain Management Practices and Organizational Sustainable Performance: A Study on the Restaurant Industry in Indonesia. International Journal of Supply Chain Management. February 2020. Available online: https://www.semanticscholar.org/paper/Moderating-Effect-of-Supply-Chain-Dynamic-on-the-of-Isnaini-Nurhaida/5036afdfb0460be64ae5606eda6b4d4f5439c679 (accessed on 6 November 2024).
  68. Singh, R.K. Strengthening resilience in supply chains: The role of multi-layer flexibility, supply chain risks and environmental dynamism. Int. J. Logist. Manag. 2024, 35, 1807–1826. [Google Scholar] [CrossRef]
  69. Faruquee, M.; Paulraj, A.; Irawan, C.A. The dual effect of environmental dynamism on proactive resilience: Can governance mechanisms negate the dark side? Prod. Plan. Control 2023, 35, 2113–2130. [Google Scholar] [CrossRef]
  70. Zhu, X.; Wu, Y.J. How Does Supply Chain Resilience Affect Supply Chain Performance? The Mediating Effect of Sustainability. Sustainability 2022, 14, 14626. [Google Scholar] [CrossRef]
  71. Wolniak, R.; Skotnicka-Zasadzień, B.; Gębalska-Kwiecień, A. Identification of bottlenecks and analysis of the state before applying lean management. MATEC Web Conf. 2018, 183, 01001. [Google Scholar] [CrossRef]
  72. Puche, J.; Ponte, B.; Costas, J.; Pino, R.; de la Fuente, D. Systemic approach to supply chain management through the viable system model and the theory of constraints. Prod. Plan. Control 2016, 27, 421–430. [Google Scholar] [CrossRef]
  73. Hinckeldeyn, J.; Dekkers, R.; Altfeld, N.; Kreutzfeldt, J. Expanding bottleneck management from manufacturing to product design and engineering processes. Comput. Ind. Eng. 2014, 76, 415–428. [Google Scholar] [CrossRef]
  74. Tsou, C.-M. On the strategy of supply chain collaboration based on dynamic inventory target level management: A theory of constraint perspective. Appl. Math. Model. 2013, 37, 5204–5214. [Google Scholar] [CrossRef]
  75. Saleh, C.; Immawan, T.; Hassan, A.B.; Zakka, M.N. Profit Optimization Through the Application of Theory of Constraints (TOC): A Case Study in Printing Company. IOP Conf. Series Mater. Sci. Eng. 2019, 530, 012045. [Google Scholar] [CrossRef]
  76. Blackstone, J.H. Theory of constraints—A status report. Int. J. Prod. Res. 2001, 39, 1053–1080. [Google Scholar] [CrossRef]
  77. Şimşit, Z.T.; Günay, N.S.; Vayvay, Ö. Theory of Constraints: A Literature Review. Procedia Soc. Behav. Sci. 2014, 150, 930–936. [Google Scholar] [CrossRef]
  78. Wu, H.-H.; Lee, A.H.; Tsai, T.-P. A two-level replenishment frequency model for TOC supply chain replenishment systems under capacity constraint. Comput. Ind. Eng. 2014, 72, 152–159. [Google Scholar] [CrossRef]
  79. Machado, M.P.; Abreu, J.L.; Morandi, M.I.M.; Piran, F.S.; Lacerda, D.P. Exploratory decision robustness analysis of the theory of constraints focusing process using system dynamics modeling. Int. J. Prod. Econ. 2023, 260, 108856. [Google Scholar] [CrossRef]
  80. Wilson, M.C. The impact of transportation disruptions on supply chain performance. Transp. Res. Part E Logist. Transp. Rev. 2007, 43, 295–320. [Google Scholar] [CrossRef]
  81. Zhang, Y.; Niu, Z.; Liu, C.; Liu, C.; Hou, K. System Dynamics Analysis for Impact of Cloud-Based Information-Sharing on Supply Chain Performance. Int. J. Ind. Eng. Theory Appl. Pract. 2024, 31, 234–257. [Google Scholar] [CrossRef]
  82. Ralston, P.M.; Schwieterman, M.; Bell, J.E.; Ellram, L.M. The building blocks of a supply chain management theory: Using factor market rivalry for supply chain theorizing. J. Bus. Logist. 2023, 44, 141–159. [Google Scholar] [CrossRef]
  83. Göçer, A.; Brockhaus, S.; Fawcett, S.E.; Vural, C.A.; Knemeyer, A.M. Supply chain sustainability, risk and transformational tension: A systems perspective. Int. J. Logist. Manag. 2024, 36, 21–45. [Google Scholar] [CrossRef]
  84. Wieland, A.; Durach, C.F. Two perspectives on supply chain resilience. J. Bus. Logist. 2021, 42, 315–322. [Google Scholar] [CrossRef]
  85. Hair, J.F.; Hult, G.T.M.; Ringle, C.M.; Sarstedt, M.; Danks, N.P.; Ray, S. Partial Least Squares Structural Equation Modeling (PLS-SEM) Using R: A Workbook. In Classroom Companion: Business; Springer International Publishing: Cham, Switzerland, 2021. [Google Scholar] [CrossRef]
  86. Hwang, H.; Sarstedt, M.; Cheah, J.H.; Ringle, C.M. A concept analysis of methodological research on composite-based structural equation modeling: Bridging PLSPM and GSCA. Behaviormetrika 2020, 47, 219–241. [Google Scholar] [CrossRef]
  87. Richter, N.F.; Hauff, S.; Ringle, C.M.; Sarstedt, M.; Kolev, A.E.; Schubring, S. How to Apply Necessary Condition Analysis in PLS-SEM. In Partial Least Squares Path Modeling: Basic Concepts, Methodological Issues and Applications; Latan, H., Jr., Hair Joseph, F., Noonan, R., Eds.; Springer International Publishing: Cham, Switzerland, 2023; pp. 267–297. [Google Scholar] [CrossRef]
  88. Dul, J.; Hauff, S.; Bouncken, R.B. Necessary condition analysis (NCA): Review of research topics and guidelines for good practice. Rev. Manag. Sci. 2023, 17, 683–714. [Google Scholar] [CrossRef]
  89. Acharya, A.S.; Prakash, A.; Saxena, P.; Nigam, A. Sampling: Why and How of it? Indian J. Med. Spéc. 2013, 4, 330–333. [Google Scholar] [CrossRef]
  90. Rajesh, R. A fuzzy approach to analyzing the level of resilience in manufacturing supply chains. Sustain. Prod. Consum. 2019, 18, 224–236. [Google Scholar] [CrossRef]
  91. Can Saglam, Y.; Yildiz Çankaya, S.; Sezen, B. Proactive risk mitigation strategies and supply chain risk management performance: An empirical analysis for manufacturing firms in Turkey. J. Manuf. Technol. Manag. 2021, 32, 1224–1244. [Google Scholar] [CrossRef]
  92. Liao, Y. An integrative framework of supply chain flexibility. Int. J. Prod. Perform. Manag. 2020, 69, 1321–1342. [Google Scholar] [CrossRef]
  93. Laguir, I.; Choi, T.-M.; Stekelorum, R.; Gupta, S.; Kumar, A. Roles of Mobilized Controls and Environmental Uncertainty on Supply Chain Resilience: An Empirical Study from Dynamic-Capabilities-View and Levers-of-Control Perspectives. IEEE Trans. Eng. Manag. 2024, 71, 2296–2309. [Google Scholar] [CrossRef]
  94. Belhadi, A.; Kamble, S.; Subramanian, N.; Singh, R.K.; Venkatesh, M. Digital capabilities to manage agri-food supply chain uncertainties and build supply chain resilience during compounding geopolitical disruptions. Int. J. Oper. Prod. Manag. 2024, 44, 1914–1950. [Google Scholar] [CrossRef]
  95. Gölgeci, I.; Kuivalainen, O. Does social capital matter for supply chain resilience? The role of absorptive capacity and marketing-supply chain management alignment. Ind. Mark. Manag. 2020, 84, 63–74. [Google Scholar] [CrossRef]
  96. El Baz, J.; Ruel, S. Can supply chain risk management practices mitigate the disruption impacts on supply chains’ resilience and robustness? Evidence from an empirical survey in a COVID-19 outbreak era. Int. J. Prod. Econ. 2021, 233, 107972. [Google Scholar] [CrossRef]
  97. Kaufmann, L.; Gaeckler, J. A structured review of partial least squares in supply chain management research. J. Purch. Supply Manag. 2015, 21, 259–272. [Google Scholar] [CrossRef]
  98. Wetzels, M.; Odekerken-Schröeder, G.; Van Oppen, C. Using PLS Path Modeling for Assessing Hierarchical Construct Models: Guidelines and Empirical Illustration. MIS Q. 2009, 33, 177–195. [Google Scholar] [CrossRef]
  99. Kock, N.; Hadaya, P. Minimum sample size estimation in PLS-SEM: The inverse square root and gamma-exponential methods. Inf. Syst. J. 2018, 28, 227–261. [Google Scholar] [CrossRef]
  100. Hair, J.F.; Risher, J.J.; Sarstedt, M.; Ringle, C.M. When to use and how to report the results of PLS-SEM. Eur. Bus. Rev. 2019, 31, 2–24. [Google Scholar] [CrossRef]
  101. Dijkstra, T.K.; Henseler, J. Consistent Partial Least Squares Path Modeling. Available online: https://misq.umn.edu/consistent-partial-least-squares-path-modeling.html (accessed on 18 January 2025).
  102. Fornell, C.; Larcker, D.F. Structural Equation Models with Unobservable Variables and Measurement Error: Algebra and Statistics. Struct. Equ. Models 1981, 18, 382–388. [Google Scholar] [CrossRef]
  103. Henseler, J.; Ringle, C.M.; Sarstedt, M. A new criterion for assessing discriminant validity in variance-based structural equation modeling. J. Acad. Mark. Sci. 2015, 43, 115–135. [Google Scholar] [CrossRef]
  104. Hair, J.; Hult, G.T.M.; Ringle, C.; Sarstedt, M. A Primer on Partial Least Squares Structural Equation Modeling (PLS-SEM); Springer International Publishing: Cham, Switzerland, 2022. [Google Scholar]
  105. Dul, J. Necessary Condition Analysis (NCA): Logic and Methodology of ‘Necessary but Not Sufficient’ Causality. Organ. Res. Methods 2016, 19, 10–52. [Google Scholar] [CrossRef]
  106. Ali, A.A.A.; Sharabati, A.-A.A.; Allahham, M.; Nasereddin, A.Y. The Relationship between Supply Chain Resilience and Digital Supply Chain and the Impact on Sustainability: Supply Chain Dynamism as a Moderator. Sustainability 2024, 16, 3082. [Google Scholar] [CrossRef]
  107. Laguir, I.; Modgil, S.; Gupta, S.; Kumar, S.; Stekelorum, R. Supply chain dynamism and ambidexterity for sustainable performance. Prod. Plan. Control. 2024, 1–18. [Google Scholar] [CrossRef]
Figure 1. Predicted report on Consumer Goods. Source [6].
Sustainability 17 02625 g001
Figure 2. Prediction of Consumer Goods. Source [6], created by authors.
Sustainability 17 02625 g002
Figure 3. Research Framework. Source: authors.
Sustainability 17 02625 g003
Figure 4. Direct relationship.
Sustainability 17 02625 g004
Figure 5. Mediation relationship, ***: Significant at p < 0.001 (99.9% confidence level).
Sustainability 17 02625 g005
Figure 6. Moderation relationship.
Sustainability 17 02625 g006
Figure 7. Scatter plots of RS, NC, and TC.
Sustainability 17 02625 g007
Figure 8. Scatter plots of FLEX and SPD.
Sustainability 17 02625 g008
Figure 9. Heatmap of variables.
Sustainability 17 02625 g009
Table 1. Demographics analysis.
DemographicDetailNo. of AppearancePercentageTotal
CountryPakistan34462.7611
Saudi Arabia27788.7
Age25–3023538611
30–3525542
35 and above12120
GenderFemale19732611
Male41468
QualificationBA/Undergraduate21836611
Master/Graduation37662
Ph.D.193.11
Working ExperienceLess than 5 years23338611
More than 5 years37862
Employment LevelSupervisor12320611
Assistant Manager20534
Manager22637
Above Manager579
Number of EmployeesLess than 50–1008514611
100–50022236
More than 50030450
Table 2. VIF of variables.
VariablesVIFVariablesVIF
SPD1.319TC1.973
1.7292.381
1.7152.107
2.3721.614
2.2911.228
NC2.551SRES2.685
2.6692.868
2.8322.009
1.7832.629
1.4682.398
RS1.1672.833
1.4513.149
2.4432.607
1.829
FLEX1.302
1.842
2.170
2.974
3.106
Table 3. Internal consistency and validity.
VariablesConstructsLoadingsAlpharhoCAVErhoA
SPDSPD10.690.760.840.510.78
SPD20.64
SPD30.63
SPD40.80
SPD50.78
NCNC10.850.800.860.570.82
NC20.88
NC30.90
NC40.75
NC50.63
RSRS10.510.860.900.650.87
RS20.72
RS40.84
RS50.78
FLEXFLEX10.620.830.870.570.89
FLEX20.81
FLEX30.83
FLEX40.86
FLEX50.88
TCTC10.790.860.900.650.89
TC20.80
TC30.76
TC40.67
TC50.75
SRESSRES10.820.930.940.670.93
SRES20.83
SRES30.77
SRES40.84
SRES50.79
SRES60.84
SRES70.84
SRES80.81
Table 4. Fronell–Larker criterion.
VariablesSPDRSFLEXTCNCSRES
SPD0.71
RS0.450.75
FLEX0.600.560.81
TC0.640.510.630.75
NC0.590.510.580.680.81
SRES0.390.590.550.290.390.82
Table 5. HTMT ratio.
VariableSPDRSFLEXTCNCSRES
SPD
RS0.59
FLEX0.750.67
TC0.790.610.71
NC0.750.620.700.78
SRES0.450.670.610.290.43
Table 6. Prediction power of direct variables.
VariablesR-SquareAdjusted R-SquareQ2
SRES0.450.4450.480
RS0.440.4350.51
TC0.300.2940.41
Table 7. Direct relationship between variables.
RelationshipHypothesisβSDT Stat.Confidence Intervalp-ValueResult
Lower LimitUpper Limit
RS → SRESH10.4360.0449.9880.3540.5230.000Accepted
TC → SRESH20.2950.0565.2370.4000.1790.000Accepted
Control Variable
Firm Size 0.0240.0611.68−0.0680.1010.580Not Significant
Country 0.0070.0591.253−0.700.1070.882Not Significant
Employment Level 0.0090.0480.980−0.0430.0640.748Not Significant
Table 8. Mediation relationships.
RelationshipHypothesisβSDT Stat.Confidence Intervalp-ValueResult
Lower LimitUpper Limit
RS-TC-SRESH30.2110.0248.7490.1670.2610.035Accepted
RS-FLEX-SRESH40.2060.0346.0200.1400.2720.000Accepted
RS-NC-SRESH5−0.0240.039−0.625−0.1010.0490.08Rejected
Table 9. Moderation results.
RelationshipHypothesesβSDT Stat.Confidence Intervalp-ValueResult
Lower LimitUpper Limit
SPD × RS → TC → SRESH60.1690.0802.1160.0100.0580.034Accepted
SPD × RS → FLEX → SRESH70.2980.0734.0720.0150.0650.000Accepted
SPD × RS → NC → SRESH80.0110.0680.1690.0210.0630.02Accepted
Table 10. Effect size of variables.
SRES
VariableEffect SizeAccuracyCeiling ZoneScopep-Value
RS0.51100%5.6611.150.001
NC0.0100%011.1521
FLEX0.24100%2.038.440.001
TC0.36100%3.128.870.001
SPD0.27100%2.259.310.000
Table 11. Bottleneck table.
SRESRSNCTCSPDFLEX
0.00%00000
10.00%38.205.800.09
20.00%38.205.800.09
30.00%38.205.800.09
40.00%43.3037.221.211.5
50.00%43.3037.221.211.5
60.00%43.3037.221.211.5
70.00%55.3059.821.244.8
80.00%75065.466.367
90.00%75065.466.367
100.00%80.3010010079.7
Disclaimer/Publisher’s Note: The statements, opinions and data contained in all publications are solely those of the individual author(s) and contributor(s) and not of MDPI and/or the editor(s). MDPI and/or the editor(s) disclaim responsibility for any injury to people or property resulting from any ideas, methods, instructions or products referred to in the content.

