Article

Investigating the Role of Organic Aerosol Schemes in the Simulation of Atmospheric Particulate Matter in a Large Mediterranean Urban Agglomeration

by
Anastasia Poupkou
1,*,
Serafim Kontos
2,
Natalia Liora
1,2,
Dimitrios Tsiaousidis
2,
Ioannis Kapsomenakis
1,
Stavros Solomos
1,
Eleni Liakakou
3,
Eleni Athanasopoulou
3,
Georgios Grivas
3,
Aikaterini Bougiatioti
3,
Kalliopi Petrinoli
3,
Evangelia Diapouli
4,
Vasiliki Vasilatou
4,
Stefanos Papagiannis
4,
Athena Progiou
5,
Pavlos Kalabokas
1,
Dimitrios Melas
2,6,
Nikolaos Mihalopoulos
3,
Evangelos Gerasopoulos
3,
Konstantinos Eleftheriadis
4 and
Christos Zerefos
1
add Show full author list remove Hide full author list
1
Research Centre for Atmospheric Physics and Climatology, Academy of Athens, 10680 Athens, Greece
2
Laboratory of Atmospheric Physics, Aristotle University of Thessaloniki, 54124 Thessaloniki, Greece
3
Institute for Environmental Research and Sustainable Development, National Observatory of Athens, 15236 Athens, Greece
4
Environmental Radioactivity & Aerosol Technology for Atmospheric and Climate Impact Laboratory, Institute of Nuclear & Radiological Sciences & Technology, Energy & Safety, National Centre For Scientific Research “Demokritos”, 15310 Athens, Greece
5
AXON Enviro-Group Ltd., 11257 Athens, Greece
6
Center of Interdisciplinary Research and Innovation, Aristotle University of Thessaloniki, 10th Km Thessalonikis-Thermis, 57001 Thermi, Greece
*
Author to whom correspondence should be addressed.
Sustainability 2025, 17(6), 2619; https://doi.org/10.3390/su17062619
Submission received: 20 January 2025 / Revised: 28 February 2025 / Accepted: 7 March 2025 / Published: 16 March 2025
(This article belongs to the Section Pollution Prevention, Mitigation and Sustainability)

Abstract

:
Air quality simulations were performed for Athens (Greece) in ~1 km resolution applying the models WRF-CAMx for July and December 2019 with the secondary organic aerosol processor (SOAP) and volatility basis set (VBS) organic aerosol (OA) schemes. CAMx results were evaluated against particulate matter (PM) and OA concentrations from the regulatory monitoring network and research monitoring sites (including PM2.5 low-cost sensors). The repartition of primary OA (POA) and secondary OA (SOA) by CAMx was compared with positive matrix factorization (PMF)-resolved OA components based on aerosol chemical speciation monitor (ACSM) measurements. In July, OA concentrations underestimation was decreased by up to 24% with VBS. In December, VBS introduced small negative biases or resulted in more pronounced (but moderate) underestimations of OA with respect to SOAP. CAMx performance for POA was much better than for SOA, while VBS decreased the overestimation of POA and the underestimation of SOA in both study periods. Despite the SOA concentrations increases by VBS, CAMx still considerably underestimated SOA (e.g., by 65% in July). Better representation of simulated OA concentrations in Athens could benefit by accounting for the missing cooking emissions, by improvements in the biomass burning emissions, or by detailed integration of processes related to OA chemical aging.

1. Introduction

Air pollution stands as the leading environmental health threat in Europe. Fine particulate matter (PM) concentrations above the 2021 World Health Organization guideline limits resulted in 238,000 premature deaths in the EU-27 Member States [1]. Organic aerosol (OA) represents a significant portion of fine PM concentrations, with values from 20% to more than 50% [2]. OA emission sources, composition, and atmospheric processes that determine OA concentrations are still characterized by large uncertainties. Chemical transport models (CTM) often underestimate secondary OA (SOA), which comprises a dominant fraction of OA [3,4,5]. Overcoming this limitation by developing improved OA and, consequently, fine PM model simulations will allow for effective air pollution control and mitigation measures for cleaner air, improved human health, and better long-term environmental sustainability. OA schemes in CTM used to consider the primary OA (POA) as non-volatile and chemically inert, as in the case of the secondary organic aerosol processor (SOAP) scheme [6]. According to the SOAP scheme, the formed SOA species are in equilibrium with condensable gasses produced by volatile organic compounds (VOC) through oxidation. The SOAP scheme accounts for the photolytic loss of SOA.
However, POA can be semi-volatile with the vapor phase undergoing photochemical oxidation [7]. Also, volatility change associated with SOA chemical aging is not considered by traditional OA schemes [8]. Consequently, the volatility basis set (VBS) scheme was developed and used in CTM [8]. VBS provides a unified framework for the gas–aerosol partitioning and chemical aging of both POA and SOA. It uses a set of semi-volatile OA species with volatility equally spaced in a logarithmic scale (the basis set), which can further react in the atmosphere, leading to changes in volatility. In the first-generation VBS schemes, organic compounds were grouped only by volatility (1-D VBS). Subsequently, a 2-D VBS scheme was developed to account also for organic compounds categorized by oxidation state [9,10].
Previous studies have shown that the use of the VBS scheme generally improves the CTM performance for SOA [11,12]. The use of the VBS approach for the simulation of particulate matter over Europe in May 2008 resulted in improved OA quantification [13]. A considerable improvement in the wintertime modeled OA mass concentrations has been identified for Europe when using a modified VBS scheme based on more recent wood-burning smog chamber experiments [12]. Bergstrom et al. [14] showed that VBS can give reasonably satisfactory results in Europe mainly for summer than for winter conditions. According to Bartík et al. [15], the use of the VBS scheme, together with the estimates of intermediate-volatility and semi-volatile organic compounds emissions, resulted in a slight improvement (i.e., increase) of the model prediction of PM2.5 in Central European cities compared to the SOAP scheme (study period 2018–2019). However, the impact of the OA scheme selection on the CTM performance in the simulation of total OA concentrations is still under investigation. In addition, similar modeling studies for the Mediterranean area and urban centers, where the combination of anthropogenic emissions with abundant biogenic emissions from vegetation and the Mediterranean climate favor photochemical production of SOA [16,17,18], are limited. According to a CTM evaluation study conducted in Italy during the winter, the SOAP scheme outperformed the VBS, but the VBS provided a more accurate attribution of POA and SOA compared to the SOAP scheme [19]. According to Basla et al. [20], the VBS scheme with improved emissions for intermediate-volatility organic species was more appropriate for the simulation of OA over the Po Valley (Italy) during the 2013 summer season (from May to July).
The main aim of the present study was to investigate the role of OA schemes in improving the simulation of atmospheric PM and OA concentrations at very high spatial resolution (~1 km) in the large Mediterranean urban agglomeration of Athens (the largest in Greece) and the Greater Athens Area (GAA), under distinct and contrasting atmospheric conditions: a summer month, when photochemical activity is enhanced and biospheric emissions are higher, and a winter month, when anthropogenic PM emissions are more pronounced (primarily due to heating sector emissions) and photochemical activity is low. For this reason, the CTM results produced with the use of SOAP and VBS schemes in model runs were evaluated against a large dataset of surface PM and OA measurements from the regulatory monitoring network and from research-oriented monitoring sites (including also a low-cost sensor network for PM2.5 levels). The measurements were combined with positive matrix factorization (PMF) analysis to provide OA concentrations and components (related to primary sources and secondary processing). This paper is structured as follows: In Section 2, the modeling system set-up is described and the observational data used are presented. In Section 3, the photochemical model results are evaluated against PM with an average aerodynamic diameter of up to 10 μm (PM10), PM with an average aerodynamic diameter of up to 2.5 μm (PM2.5), and OA measurements to understand which OA gas–aerosol partitioning and oxidation scheme performs better. Section 4 provides more insights on the repartition of POA and SOA in model runs also considering the characteristics of the seasonal emission sources in the study area. The conclusions of this study are in Section 5. A supplementary file accompanies this paper, which includes a list of all abbreviations in Table S1.

2. Materials and Methods

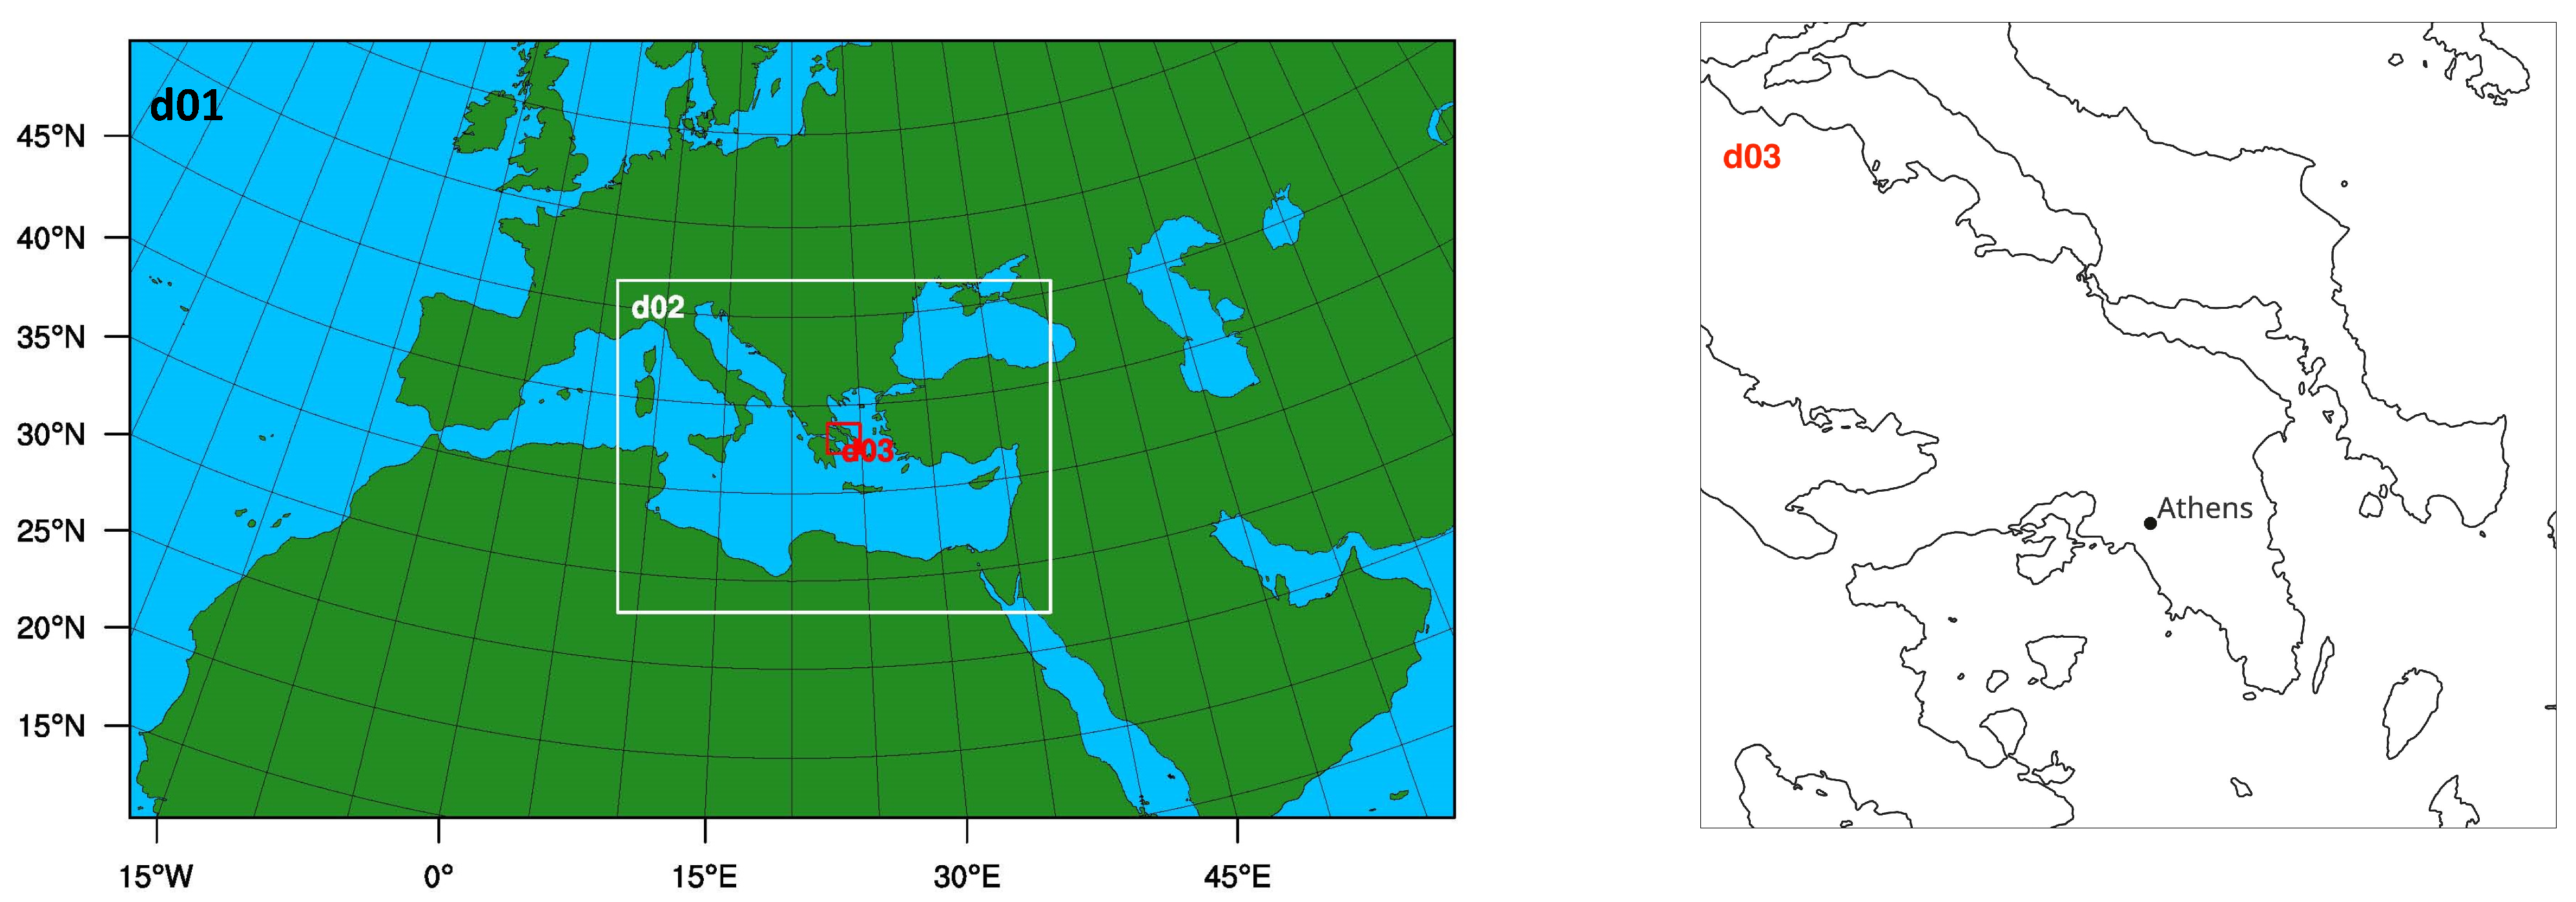
2.1. Modeling System Set-Up

The modeling system, composed of the meteorological model WRF [21] and the photochemical model CAMx (v7.2) [22], was applied over three nested domains covering Europe and North Africa (in 18 km), the Central and Eastern Mediterranean (in 6 km), and the GAA and neighboring areas (in 1.2 km) (Figure 1). WRF model was driven by initial and boundary conditions from the ERA5 reanalysis data, while CAMx was driven by the CAMS-IFS global model [23]. Homogeneous gas phase reactions in CAMx were simulated with the CB06 mechanism [24]. The inorganic aqueous aerosol chemistry is the RADM-AQ [25] with updates and the inorganic gas–aerosol thermodynamics/partitioning is according to the ISORROPIA algorithm [26]. CAMx includes algorithms for organic oxidation and gas-aerosol partitioning (SOAP or VBS). The aerosol scheme is based on two static modes (coarse and fine). The simulations were performed for a warm and a cold month of the year 2019, more specifically, for July and December.
Anthropogenic gaseous (carbon monoxide (CO), nitrogen oxides (NOx), non-methane volatile organic compounds (NMVOC), ammonia (NH3), and sulfur dioxide (SO2)) and PM10/PM2.5 emissions were used in the CAMx runs. For the European countries, the anthropogenic emissions database of CAMS-REGv6.1 [27,28,29] for the year 2019 was used, which provides sectoral and gridded pollutant annual emissions in ~6 km spatial resolution. The anthropogenic emissions for the non-European countries within the modeling domains were obtained from the EDGAR v.6.1 database [30] for the year 2018 (resolution of 0.1 degree). The emission data were temporally resolved (on a monthly, weekly, and hourly basis) and chemically speciated using split factors provided on a country basis by The Netherlands Organization (TNO) along with the CAMS-REGv6.1 database. Chemical speciation was performed for NMVOC into 23 species (including benzene, toluene, and xylenes as SOA precursors) and for PM into 5 species: elemental carbon (EC), organic carbon (OC), sodium (Na), sulfate (SO4), and other PM (mostly minerals). Moreover, annual potential particle dust emissions from resuspension due to road traffic gridded over the CAMS-REG domain were provided by TNO [31]. The potential anthropogenic dust emissions were spatially distributed over the modeling domains and were temporally analyzed using profiles of the CAMS-REGv6.1 database, also taking into account meteorological restrictions on the basis of the 2019 hourly WRF meteorological data, i.e., dust emissions were forced to zero during precipitation events. A detailed emission inventory for the GAA was prepared for the year 2019, including emissions for the residential and commercial heating (including biomass burning) and road transportation (exhaust and non-exhaust) sectors calculated on the basis of activity data and WRF meteorology [32]. Sea salt, windblown dust, and biogenic NMVOC (i.e., isoprene and monoterpenes being SOA precursors and other non-speciated NMVOC) emissions were calculated using the natural emissions model NEMO driven by WRF [33,34,35,36].
CAMx runs were performed and compared using the SOAP (version 2.2) and VBS (1.5-D) schemes for organic gas–aerosol partitioning and oxidation. The SOAP scheme consists of VOC gas-phase oxidation chemistry and equilibrium partitioning between gas and aerosol phases of anthropogenic and biogenic origin [22]. The 1.5-D VBS scheme uses five basis sets to describe varying degrees of oxidation in ambient OA: two basis sets for anthropogenic and biogenic chemically-aged oxygenated OA (PAS and PBS, respectively), and three for freshly emitted OA, i.e., OA from meat-cooking (PCP), “other anthropogenic sources” (PAP) (e.g., fossil-fuel related), and biomass burning OA (PFP). Each basis set has five volatility bins with the first bin representing non-volatile OA and the others roughly covering the volatility range of semi-volatile organic compounds (SVOC) [8,37]. Total OA is the sum in all volatility bins of POA (=PAP + PCP + PFP) and SOA (=PAS + PBS).
Table S2 in the Supplementary Materials lists the input emission species prepared for the SOAP and VBS OA schemes. In CAMx simulations using the VBS scheme, source-specific intermediate-volatility organic compound (IVOC) emissions must be included alongside the traditional SOA precursor anthropogenic and biogenic NMVOCs utilized by SOAP. IVOC are important SOA precursors but are generally missing from the emission inventories. In the current study, they were assumed to be 1.5 times the POA emissions [19]. In addition, the VBS scheme accounts for source-specific POA emissions, which are allocated to volatility bins using source-specific volatility distribution factors according to Ramboll Environment and Health [22]. More specifically, in the current study, POA emissions were split into four categories: POA from gasoline vehicles (POA_GV), diesel vehicles (POA_DV), “other anthropogenic sources” (POA_OP) (e.g., shipping, industries, etc.), and biomass burning (POA_BB). In general, POA emissions from the “other anthropogenic sources” and biomass burning categories are considered more volatile than diesel and gasoline vehicles’ POA emissions.
Figure 2 presents the spatial distribution of anthropogenic POA emissions and those of benzene, as a gaseous anthropogenic SOA precursor, in the domain with the GAA for July and December. During the warm period, maximum POA emissions are over the industrial areas as well as in the urban center and suburban areas of Athens, while higher emission values are along the shipping routes and the major road axes of the domain (Figure 2a). In December, POA emissions become more enhanced over the greater part of the domain, and their spatial distribution is mostly configured by the operation of heating systems (Figure 2b). During the winter period studied, POA is emitted mostly by the biomass burning for heating. In July, the main POA emission sources are the shipping sector and the road transport of diesel vehicles (exhaust emissions) (Figure S1 in the Supplementary Material). The spatial distribution of benzene emissions (similar for toluene and xylenes) presents maximum values in the large urban agglomeration of Athens, while, along the major road axes, emission values are also higher (Figure 2c,d). Benzene is mainly emitted by road transportation (i.e., exhaust emissions of gasoline vehicles). Biomass burning for heating is also an important source of benzene in the cold period (Figure S1). Toluene and xylenes are emitted mainly by the use of solvents and the road transportation of gasoline vehicles (exhaust emissions) (Figure S1).

2.2. Observational Data and CAMx Evaluation Methodology

The PM simulated results were evaluated against in situ surface measurements for July and December 2019. PM10 and PM2.5 hourly concentrations were used as measured in the National Air Pollution Monitoring Network (NAPMN) of the Greek Ministry of Environment and Energy (ΜΕΕΝ). PM measurements in the NAPMN are performed with beta-attenuation monitors providing data at a 1 h resolution [38].
The PANACEA research monitoring network includes two stations in Athens: (a) the urban background Thissio station operated by the National Observatory of Athens [39] and (b) the suburban Demokritos station operated by the National Centre For Scientific Research “Demokritos” [40]. Both stations measure daily PM2.5 total mass concentrations and chemical composition (OC at Demokritos station is measured on a 3 h basis). PM2.5 samples were continuously collected at Thissio, on quartz fiber filters (Flex Tissuquartz, 2500QAT-UP 47 mm, Pall) over 24 h intervals using low-volume samplers [41]. The filters were chemically analyzed inter alia for OC concentrations via the Thermal-Optical Transmission technique using a Sunset Laboratory OC/EC Analyzer and applying the EUSAAR-2 protocol [42]. In the monitoring site of Demokritos, 24 h PM2.5 samples were collected by a low-volume reference sampler (Sequential 47/50-CD, Sven Leckel GmbH, Berlin, Germany) on Teflon filters, and PM mass concentrations were determined gravimetrically. OC concentrations in PM2.5 were quantified on a 3 h basis by applying the Thermal-Optical Transmission method and the EUSAAR-2 protocol, using a semi-continuous OC-EC field analyzer (Model-4, Sunset Laboratory, Inc., Tigard, OR, USA), equipped with an in-line parallel carbon denuder for the removal of organic gases.
An aerosol chemical speciation monitor (ACSM) (Aerodyne Inc., Billerica, MA, USA) [43] at Thissio was used to obtain 30 min resolution data on the chemical composition of non-refractory submicron aerosols. The ACSM-determined OA is apportioned to OA components using PMF receptor modeling on the organic spectra by implementing the multilinear engine (ME-2) solver [44] via the SoFi toolkit [45]. Details on ACSM measurements and source apportionment are provided by Stavroulas et al. [46,47].
Finally, hourly PM2.5 values were also measured by the PANACEA monitoring network of PM2.5 low-cost sensors [48], which, in the GAA, have been operated by the National Observatory of Athens since July 2019. PM2.5 was measured with Purple Air PA-II monitors, the performance of which was evaluated during several ambient intercomparison campaigns in Greece (including the city of Athens), and their measurements were calibrated through comparison with reference-equivalent PM2.5 monitors and application of linear regression models [49,50] to mitigate inherent uncertainties affecting the accuracy of sensor-based PM measurements. According to Stavroulas et al. [49], the mean absolute percentage errors in PM2.5 measurements with the low-cost sensors in Athens were in the order of 0.18 after the PM2.5 data calibration with linear regression models. Hourly-averaged PM2.5 data from seven monitoring locations within the Athens basin were used.
The locations of monitoring sites are presented in the Supplementary Material along with their characterization (Map S1, Tables S3 and S4). OC measurements were scaled to OA using a factor equal to 1.6 to allow comparison with the model OA outputs.
For model validation, the following statistical indicators were estimated: normalized mean bias (NMB), normalized mean square error (NMSE), index of agreement (IOA), mean fractional bias (MFB), and mean fractional error (MFE). The definition of the statistical indicators is provided in the Supplementary Material along with the criteria for satisfactory model performance (Table S5) [3,51,52,53]. NMB and MFB aim to assess the magnitude of systematic errors, NMSE and MFE are more related to random errors, while IOA is a normalized measure of the agreement with respect to the temporal variability taking into account the influence of the error [19,54].

3. Results

Figure 3 presents the percentage differences in the simulated monthly OA, POA, and SOA concentration values between the VBS and SOAP schemes. The use of the VBS scheme results in rather important percentage differences in concentrations with respect to SOAP.
In July 2019, OA mean concentrations increased between 20% and 35% in the urban and suburban areas of the GAA when VBS was used (Figure 3a). This enhancement was driven by the increase in SOA levels (Figure 3c), which outweighs the decrease in POA treated as volatile and undergoing chemical aging in VBS (Figure 3b). The highest decrease in POA levels, ranging between 30% and 35%, is identified in the maritime area south of Athens and could also be associated with the enhanced density of POA shipping emissions falling under the category of “other anthropogenic sources” in the model runs, which is characterized by higher volatility. Over that area, the increase in OA is more limited (between 5% and 15%).
In December 2019, the OA concentrations modeled in the urban and suburban areas of the GAA with VBS were less by about 20–35% when compared to those simulated with SOAP (Figure 3d). This is because the primary component of OA has lower values when VBS is applied (rather than SOAP) (Figure 3e), and this POA negative difference between schemes is more pronounced than the respective SOA surplus produced when VBS is used (Figure 3f). The spatial pattern indicates the maritime area south of Athens as the one affected mostly by the OA atmospheric mechanism (i.e., decreases in OA mean values ranging between 35% and 43%).

3.1. Comparison by OA Scheme of CAMx Performance in the Simulation of PM Concentrations

The evaluation of the statistical indicators for PM10 and PM2.5 is summarized in Table 1 and Table 2 for July and December 2019, respectively. The statistics are shown by the OA scheme and were averaged by the type of monitoring station, i.e., Urban Traffic (UT), Urban Background (UB), and Suburban Background (SB). In July 2019, although CAMx tends to underestimate PM levels, the overall performance of the modeling system is considered satisfactory, as most indicators take values that fall within or near the criteria limits (Table 1). VBS generally improves the model performance. Average NMSE, MFB, and MFE are reduced by 3.5%, 12.6%, and 5.8% respectively, while mean NMB is about 30% lower with the VBS than with SOAP in the PM10 simulation. The reductions in errors and biases can be more pronounced in the case of PM2.5, i.e., average NMSE, MFB, and MFE are decreased by 10.7%, 22.2%, and 8.6%, respectively. IOA is almost unchanged. In December 2019, CAMx applied with the SOAP scheme may overestimate or underestimate PM concentrations (Table 2). The use of VBS reduces biases and errors at the stations where overestimations exist and increases them at the stations where CAMx results are characterized by underestimations (even in the latter case, the statistical indicators take values within the criteria limits for satisfactory model performance). For example, there is a reduction of 55% in the mean NMB for PM10 and for PM2.5 at the NAPMN sites when simulated with VBS rather than with SOAP, and the average NMSE is decreased by 1.6% in the case of PM10 and by 7.9% in the case of PM2.5. The improvements introduced by the VBS scheme are clearer at the urban traffic sites in both study periods.

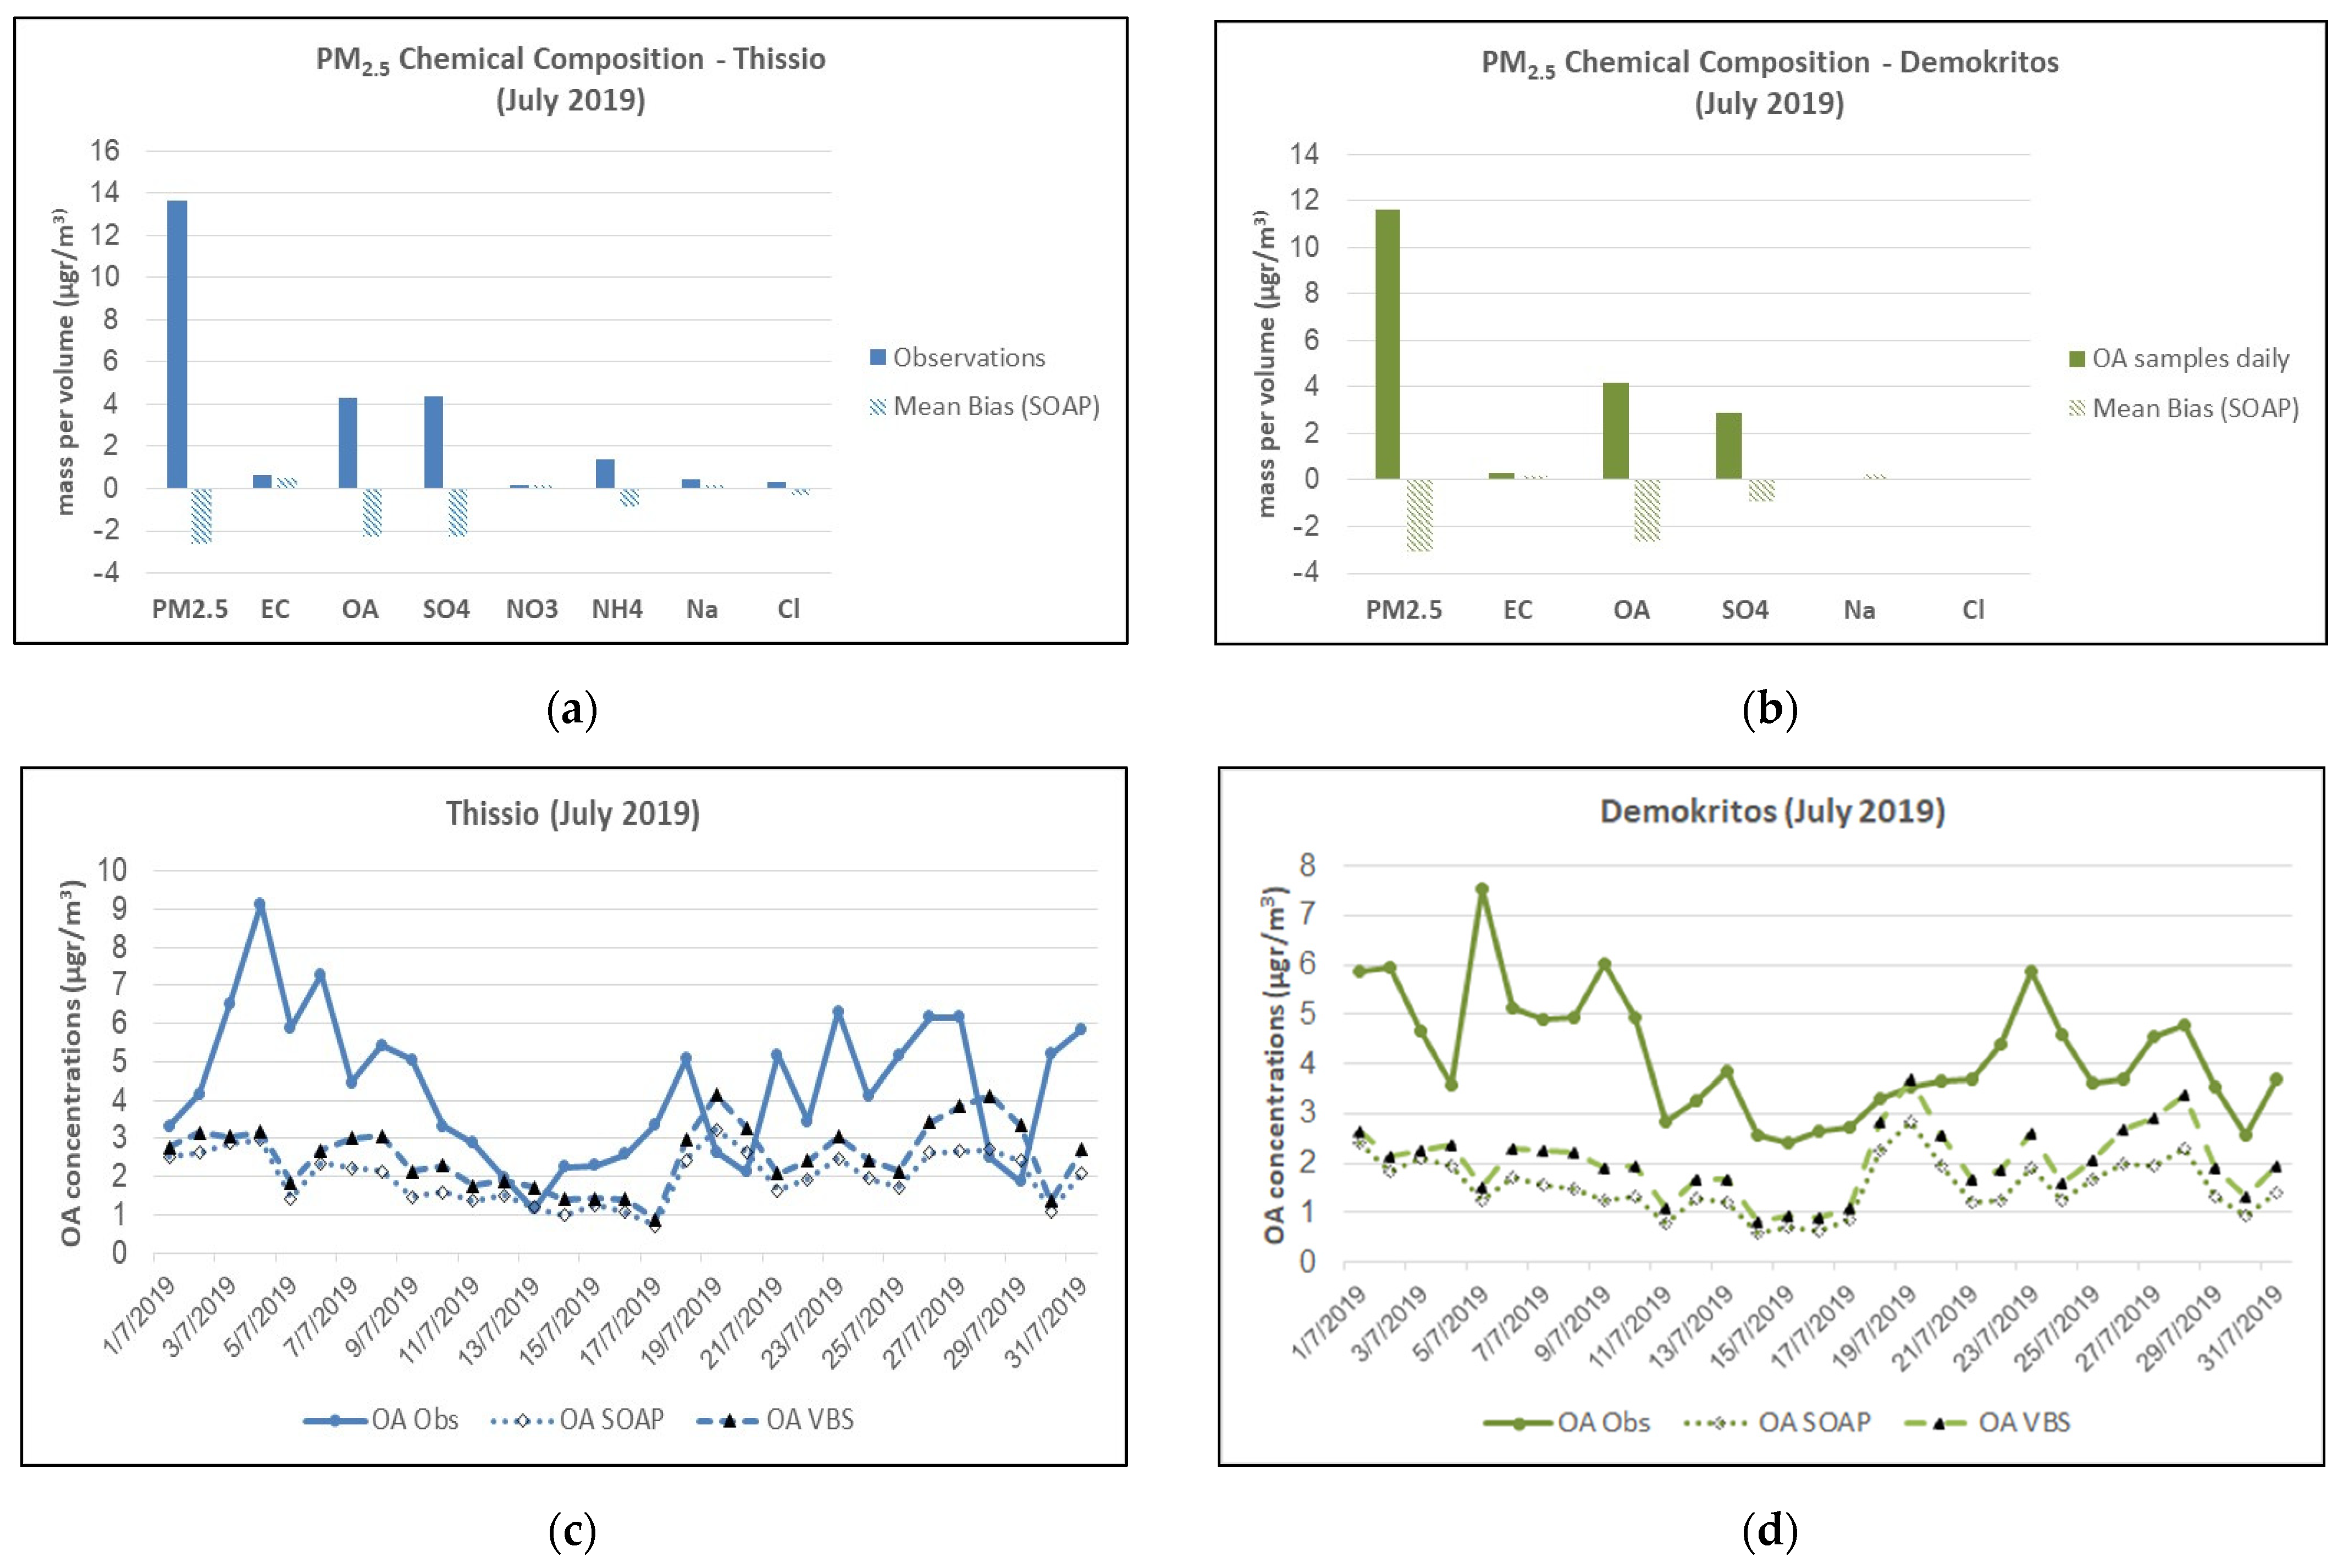
3.2. Comparison by OA Scheme of CAMx Performance in the Simulation of OA Concentrations

At the PANACEA research sites of Thissio and Demokritos, OA represented an important share of the PM2.5 mass in July 2019 (about 31% and 35%, respectively) (Figure 4a,b). CAMx daily PM2.5 concentrations are almost systematically underestimated when simulated with SOAP with a mean bias of about −2.6 μg/m3 at Thissio and −3.1 μg/m3 at Demokritos. More than 40% of the underestimation can be explained by the underestimation of OA levels, a finding that indicates the necessity for improvements in OA simulated results in the warm period of the year. The use of VBS improves the model performance, reducing biases and errors in the simulation of PM2.5 atmospheric levels (Table 3). This is because the use of VBS outperforms SOAP, reducing OA underestimation at Thissio (NMB and NMSE are decreased by 24% and 44%, respectively) and at Demokritos (NMB and NMSE are decreased by 19% and 46%, respectively). Similarly, it has been demonstrated that the warm period OA predictions at the Finokalia site in Crete (Greece) improved when the original SORGAM scheme (OA aging excluded) was replaced by VBS [13]. The July 2019 OA daily concentrations observed at Thissio and Demokritos and simulated with CAMx using the SOAP and VBS schemes are shown in Figure 4c,d. The higher OA values, measured at the beginning of July 2019, were partly associated with forest fires that broke out on 4 July 2019, in Evia island (about 70 km away from Athens); thus, these values cannot be reproduced by the model since forest fire emissions were not accounted for in the model runs. The VBS scheme increases in the simulated daily OA mass concentrations can represent up to 56% and 24% of the daily observed values at the Thissio and Demokritos sites, respectively. The analysis based on the 3-hourly OC measurements reveals more enhanced percentage increases at Demokritos with the VBS compared to SOAP, which may be up to 36% of the 3-hourly OA observed values (Figure S2 in the Supplementary Materials).
In December 2019, OA comprised about 33% of the total PM2.5 mass at Thissio, while the respective share at Demokritos was 42% (Figure 5a,b). This is in agreement with previous studies for the urban background locations in the GAA [41]. At Thissio, CAMx is mostly underestimating daily PM2.5 with SOAP (mean bias about −4 μg/m3) (Figure 5a), while it may both overestimate and underestimate the daily OA concentrations (Figure 5c). The use of VBS introduces moderate negative bias in the simulation of daily OA levels (NMB = −30%) and increases the underestimation of PM2.5 (e.g., NMB from −13% becomes −24%), although it remains within the criteria values for satisfactory model performance, as can be seen in Table 3. At Demokritos, the underestimation of OA atmospheric levels with SOAP appears to worsen when VBS is used, as evidenced by the dashed line falling below the dotted line in Figure 5d (see also Figure S2 in the Supplementary Materials). However, PM2.5 is generally overestimated with SOAP (Figure 5b), and the use of VBS improves the performance of CAMx in the representation of the total PM2.5 mass concentration, as presented in Table 3 (NMB is reduced from +33% to +24%), since the overestimation of mass concentrations of chemical components other than OA is compensated for.

4. Discussion

In this section, the VBS and SOAP schemes are evaluated regarding their capacity to apportion OA between POA and SOA. For this reason, a PMF source apportionment was conducted on ACSM organic mass spectra obtained at Thissio to quantify primary and secondary (i.e., oxidized) OA components [46,47]. POA is the aggregate of hydrocarbon-like OA (HOA), cooking OA (COA), and biomass burning OA (BBOA) constrained PMF components (corresponding VBS species are PAP, PCP, and PFP, respectively). The remaining OA mass was classified into two oxygenated OA fractions (less- and more-oxidized), which, for the purposes of this study, are combined to provide the SOA fraction.

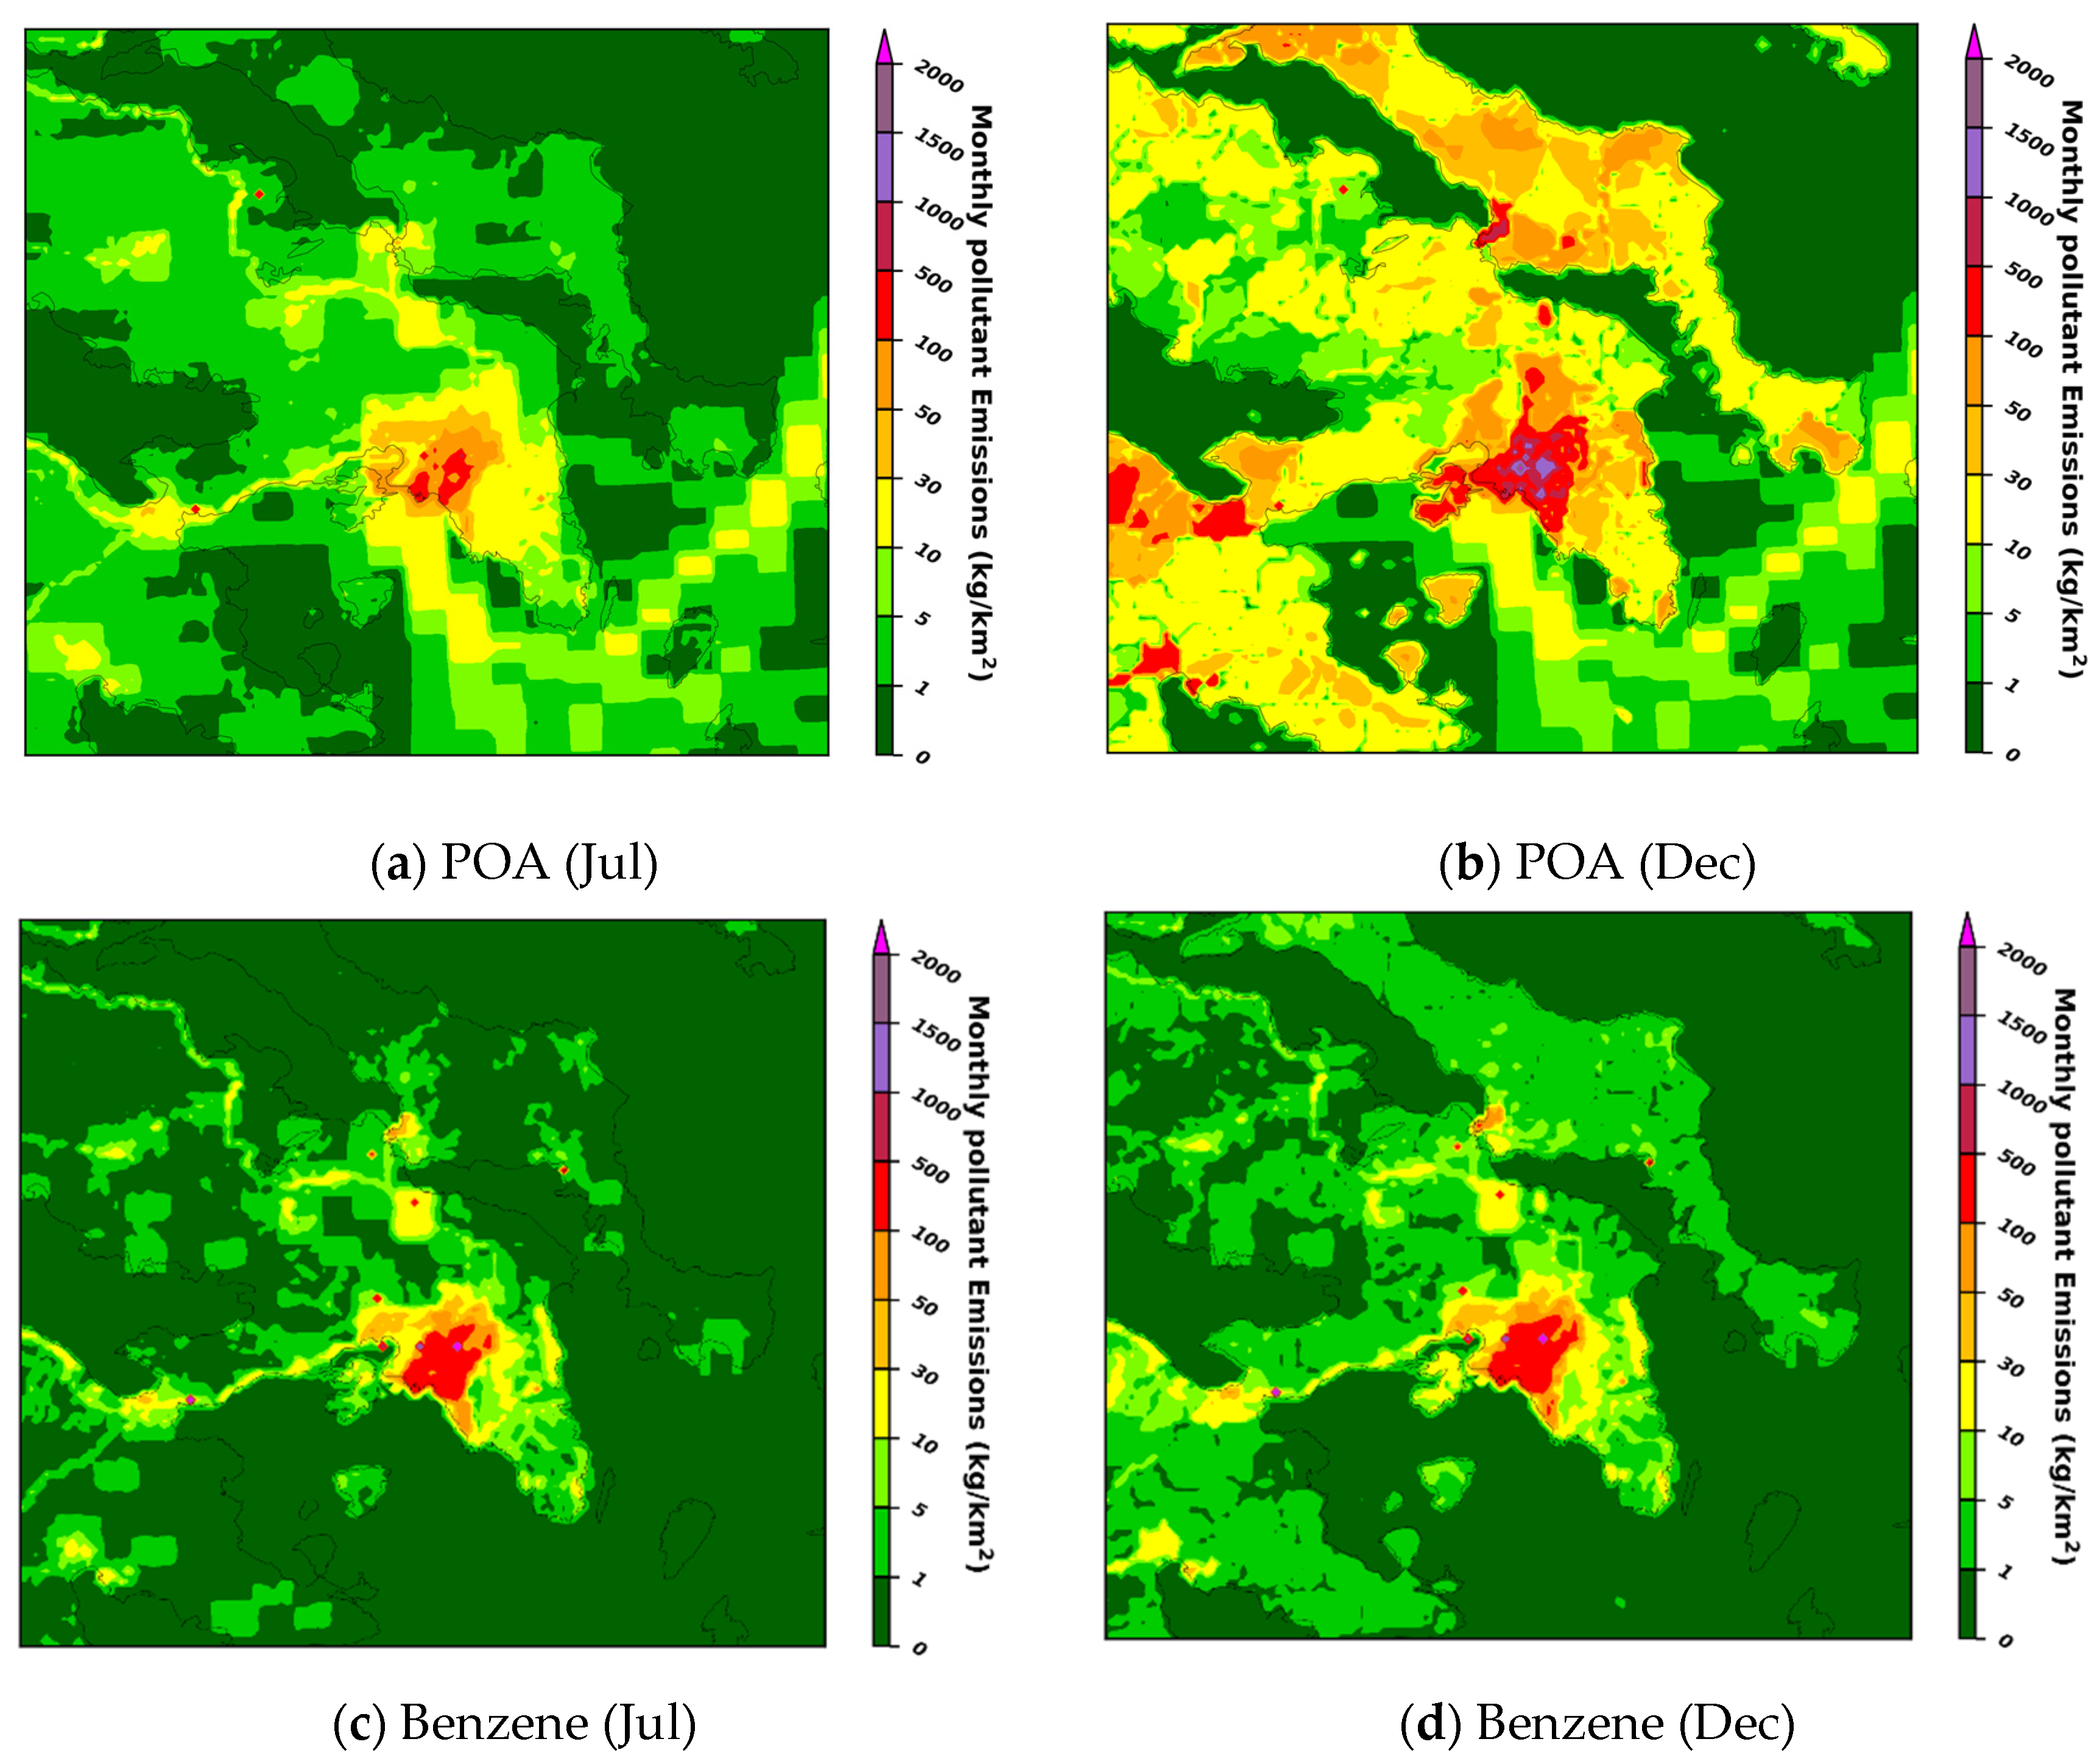
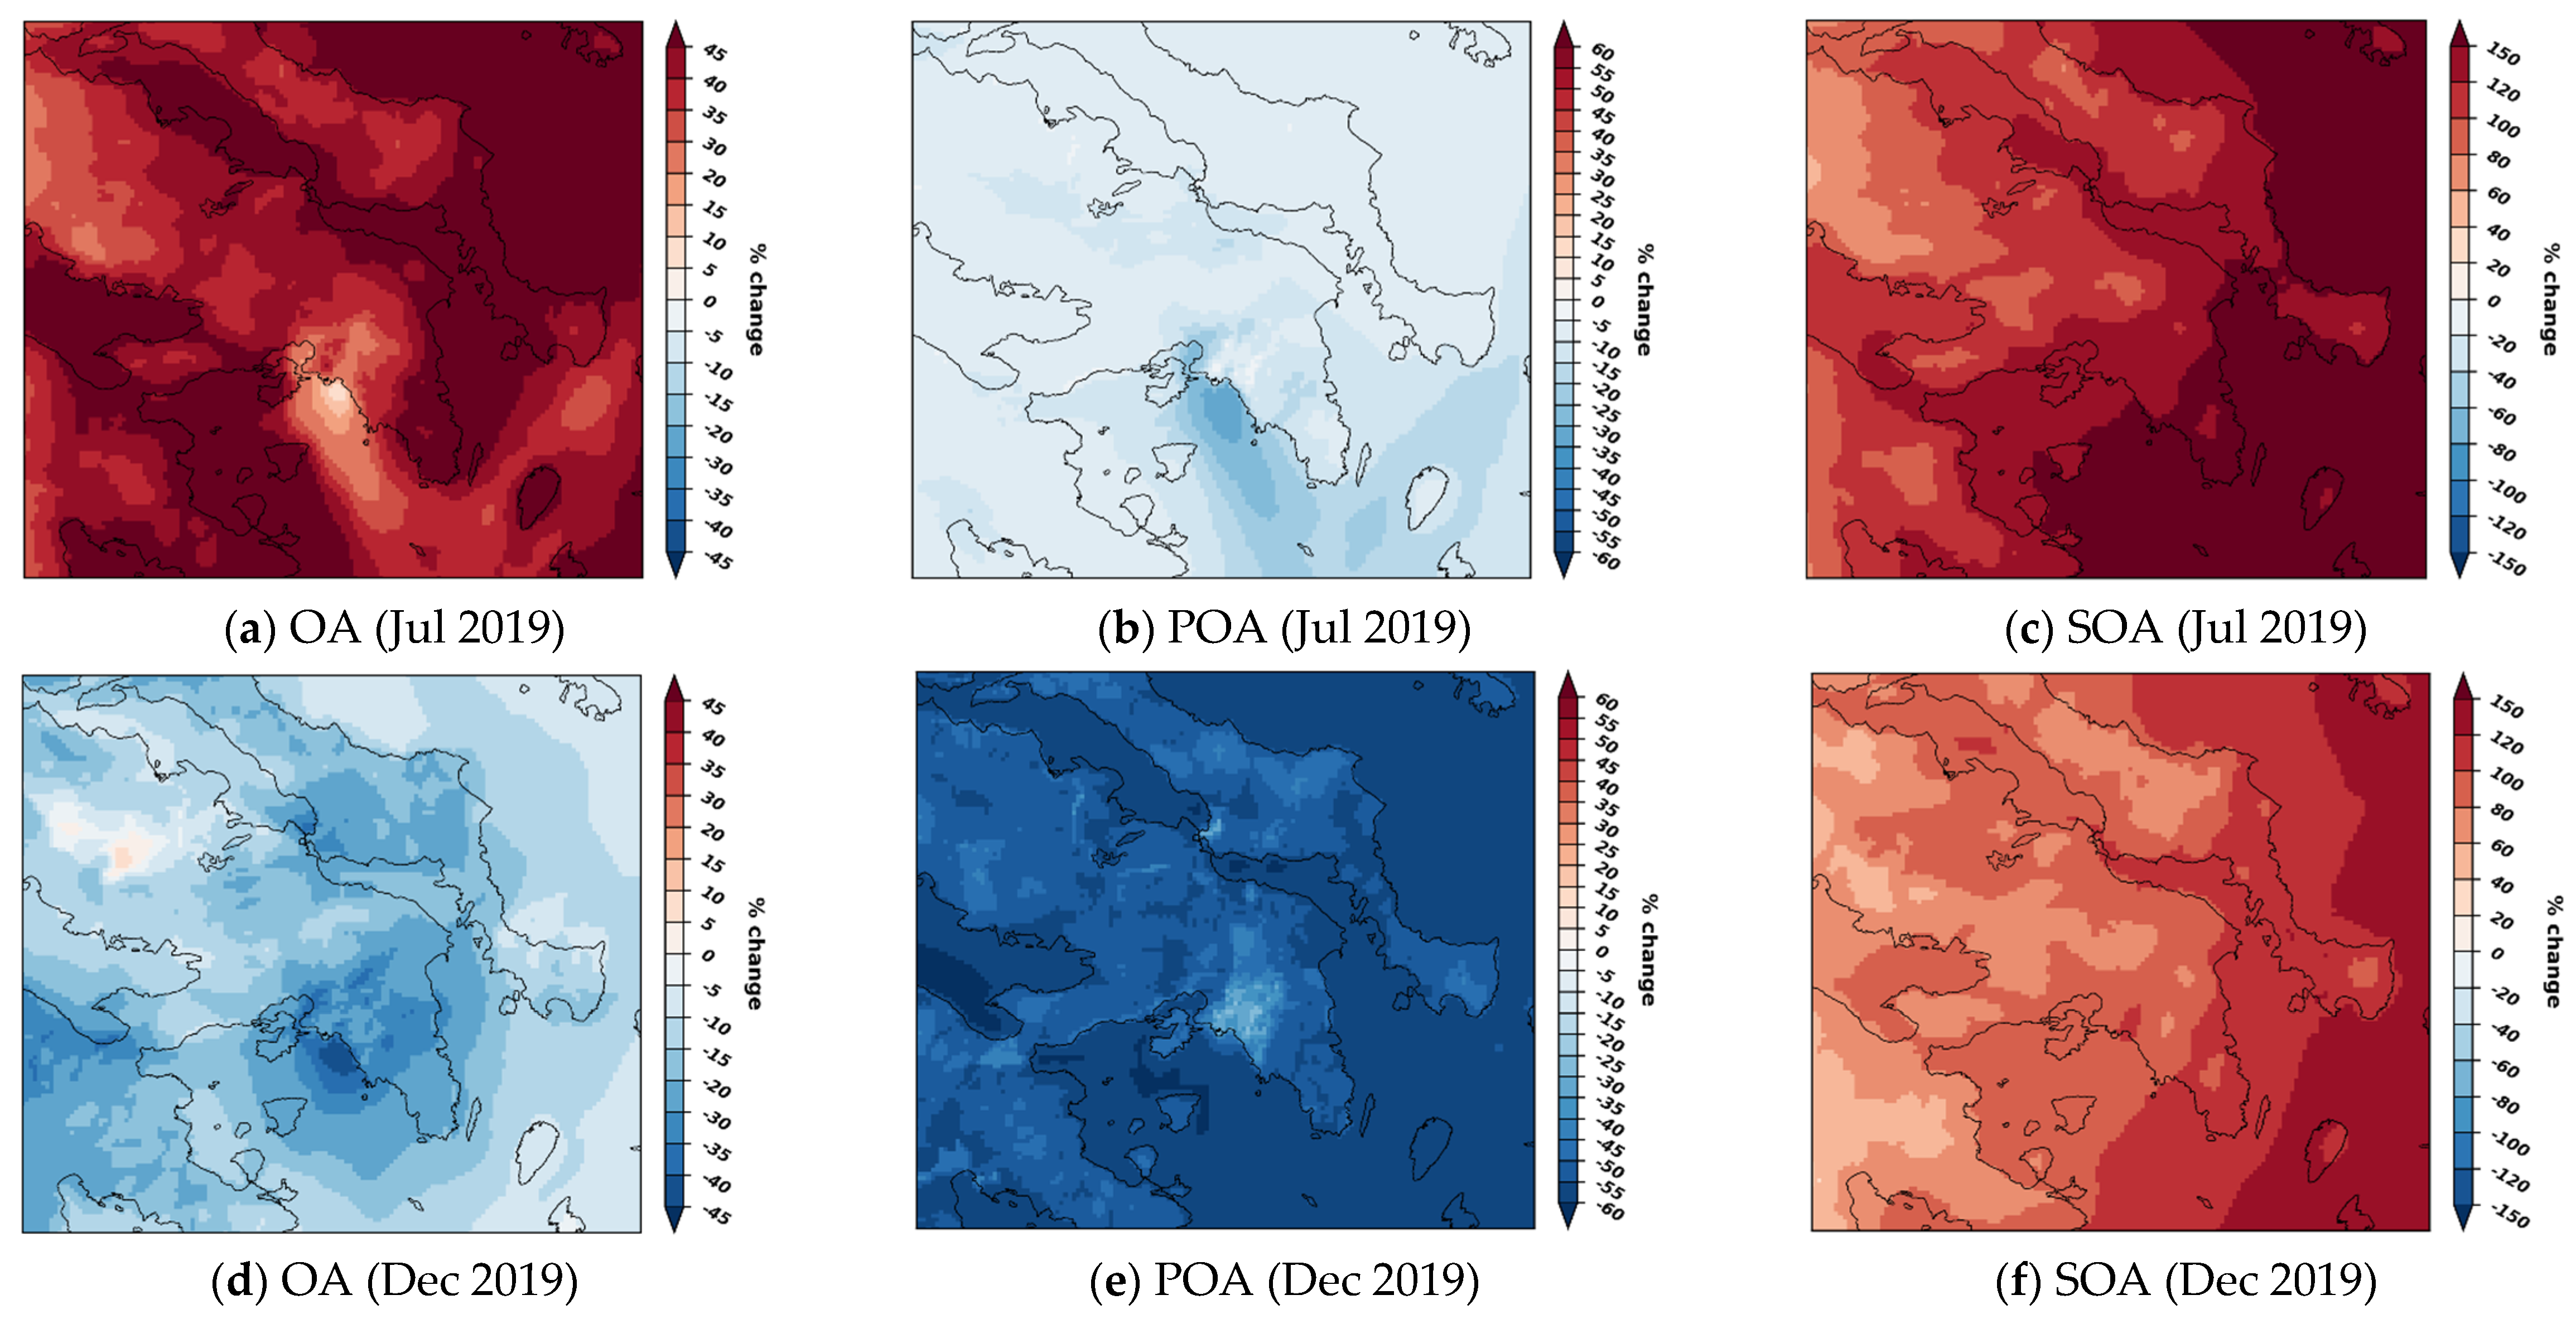
4.1. POA and SOA Concentrations Apportionment by OA Scheme

Figure 6 and Figure 7 show the time series of the daily values and mean diurnal variations of POA and SOA based on PMF analysis and CAMx results using the SOAP and VBS schemes for July 2019 and December 2019, respectively.
In July 2019, SOA represented 75% of the OA mass according to the PMF analysis, which is in agreement with Stavroulas et al. [46], while HOA represented 7% and COA represented 18%. According to Figure 6, there is a very good agreement in terms of magnitude and temporal variation (IOA = ~0.80) between POA values from PMF and POA simulated with CAMx using both OA schemes (Figure 6a). The NMB is +17% and the NMSE equals 0.10 when POA are simulated with SOAP. The use of VBS results in a decrease in the overestimation of POA (NMB = +6%, NMSE = 0.08). The comparison of the mean diurnal variations reveals that POA concentrations simulated with the VBS scheme are slightly higher than those estimated with PMF during almost all hours of the day except for the early nighttime hours (Figure 6b). These differences in the diurnal variations are configured mostly by CAMx PAP concentrations being higher compared to PMF HOA values in all hours of the day and the diurnal variation PMF POA concentrations associated with cooking emissions, which are not included in CAMx runs, being maximum in the early nighttime hours (Figure 6b and Figure S3 in the Supplementary Material). The decrease in the overestimation of POA and in the underestimation of SOA with VBS compared to SOAP resulted in an overall reduction in the model underestimation for OA (in agreement with the results presented in Table 3). On a daily basis, SOA with VBS is up to three times higher than SOA with SOAP (Figure 6c), while, on an hourly basis, the increase is more pronounced (up to 5.2 times). The PMF-estimated mean diurnal variation of SOA concentrations in the summer is limited (Figure 6d), which is indicative of the SOA levels in the major city of Athens being dominated by SOA mostly from long-range transportation [55,56]. Similar is the pattern of the CAMx-modeled SOA mean diurnal variation being influenced mostly by the diurnal profile of biogenic SOA (BSOA) rather than anthropogenic SOA (ASOA) (Figure 6d). Despite the SOA increases obtained using the VBS scheme, CAMx still underestimates SOA by about 65% on average.
In December 2019, SOA represented 40% of the OA mass and POA 60% (i.e., 23%, 22%, and 15% for HOA, COA, and BBOA, respectively) according to the PMF analysis. The use of VBS considerably improves the representation of POA daily values, with the NMB (NMSE) being reduced from +77% (1.04) when SOAP is used to +20% (0.78) with VBS (Figure 7a). The POA mean diurnal variations when simulated with CAMx-VBS or estimated by PMF are similar (Figure 7b). However, given the absence of cooking emissions in CAMx runs, the overestimations of POA by CAMx with the use of VBS, mostly observed during nighttime (Figure 7b), could be partly related to overestimated biomass burning POA (Figure S3 in the Supplementary Material). It should also be considered that CAMx-modeled and PMF-estimated POA associated with anthropogenic sources other than biomass burning and cooking (i.e., PAP and HOA, respectively) compare very well (Figure S3 in the Supplementary Material). As in July 2019, SOA concentrations simulated with VBS were several times higher than those with SOAP (Figure 7c,d). The simulated mean diurnal variation of SOA levels is flat and determined by that of BSOA when the SOAP scheme is used. In the case of the VBS scheme, ASOA and BSOA (including in the VBS scheme also biomass burning SOA) have an almost equal contribution to the determination of the mean diurnal profile of SOA concentrations, presenting slightly more enhanced values during the night hours, which is in better agreement with the diurnal profile estimated for SOA with PMF (Figure 7d). Despite the improvements introduced by the VBS scheme, CAMx significantly underestimates SOA by about 90% on average. The enhanced levels of SOA identified by the PMF can partially originate from the fast oxidation of primary biomass burning emissions for heating purposes, especially during nighttime [57]. In this case, CAMx probably considers this part of OA mostly as POA, while PMF considers it as SOA. Fountoukis et al. [58] also highlighted the significant underestimation of the SOA fraction in a polluted environment characterized by high NOx concentrations and low photochemical activity, as in Paris during wintertime. Overall, the decrease in the overestimation of POA is higher than the decrease in the underestimation of SOA with VBS compared to SOAP and, as a result, the performance of CAMx in the simulation of OA shifts from a slight overestimation with SOAP (NMB = +10%) to a rather small underestimation with VBS (NMB = −23%).
The above discussion reveals that CAMx performance for OA is better for POA than for SOA. In the warm period studied, the underestimation of SOA concentrations, which, in fact, determines the underestimation of OA, although improved with the use of VBS, is still high. In the cold period studied, VBS may allow a better representation of POA and SOA than the SOAP scheme, as identified also by Meroni et al. [19] for Po Valley (Italy) in wintertime. However, SOA levels are seriously underestimated even when the VBS scheme is used.

4.2. Insights on SOA Levels Underestimation by CAMx

The underestimation of SOA by the VBS scheme could be related to the SOA precursor emissions, e.g., to underestimated IVOC and absent SVOC emissions in CAMx runs, as they were not included in the original emission inventory used. In this study, the IVOC emissions were assumed to be 1.5 times that of POA according to Meroni et al. [19]. Ciarelli et al. [12] followed a more source-oriented approach and accounted for IVOC emissions from biomass burning as 4.5 times the respective POA emissions while studying CAMx OA levels at the European scale in wintertime. SVOC emissions are highly uncertain and, although there have been previous modeling studies that increased POA emissions by a factor of 3 to compensate for missing SVOC [11,12], this factor may present substantial inter-country variability with a potential for over- or underestimations of OA emissions, indicating the necessity for more specific research [20,59].
The modeled atmospheric processes to be accounted for in CAMx runs with VBS may also result in better model performance. For example, the chemical aging of BSOA (biogenic and biomass burning SOA belonging in the same basis set, i.e., PBS) to describe shifting to lower volatility bins is disabled by default in CAMx based on previous modeling studies, which indicated significant over-prediction of OA levels in rural areas of the United States [60,61]. However, Jiang et al. [3] enabled the aging processes for biomass burning SOA in a European scale study, while Giani et al. [54] enabled aging for biomass burning and biogenic related SOA in northern Italy, providing some evidence of a more realistic SOA representation. The summertime SOA concentrations in the GAA, being highly determined by long-range transportation, may be underestimated by CAMx partially due to the presence of very oxidized SOA from processed biomass burning from wildfires [62], characterized as SOA by the PMF. In CAMx runs, wildfire emissions were influencing the atmospheric processes in the modeling domains only through the boundary conditions. According to Vasilakopoulou et al. [62], wildfires were responsible for approximately half of the total OA in Europe during July 2022 since they are rapidly physicochemically transformed to secondary oxidized organic aerosol and lead to a regionally distributed background of OA. Finally, wintertime SOA, especially during nighttime, may be underestimated by CAMx due to rapid dark aging. Kodros et al. [57] estimated that dark chemical processing may substantially influence over 70% of OA from biomass burning.

5. Conclusions

The performance of the modeling system WRF-CAMx, applied in very high spatial resolution (~1 km), in the simulation of PM concentrations in the GAA was assessed with a special focus on the OA species. Model runs were performed for July and December 2019 using the SOAP and the VBS OA schemes. CAMx results were evaluated against PM10, PM2.5, and OA concentrations measured at the regulatory monitoring network and at the PANACEA research-oriented monitoring sites. In addition, the repartition of POA and SOA by CAMx was compared to ACSM OA measurements analyzed with PMF source apportionment.
The choice of the OA scheme had an important impact on the simulated aerosol concentrations. The VBS scheme resulted in significant percentage differences in modeled POA and SOA atmospheric levels (reductions and increases, respectively) when compared to the SOAP results.
The VBS reduced the OA and PM concentrations underestimation found in the SOAP simulations for July 2019. Model comparisons with the ACSM measurements at the urban background site of Thissio revealed an improved performance in SOA simulation with VBS, characterized by a decrease in SOA underestimation (daily SOA concentrations were up to three times higher than those with SOAP), in addition to the decrease in POA overestimation. SOA modeled atmospheric levels were determined by the major contribution of biogenic origin SOA.
The use of VBS in the CAMx simulations for December 2019 had a more complicated impact. VBS may introduce negative biases or may result in more pronounced underestimations of OA concentrations; however, these are moderate. Such a performance was explained at Thissio by a decrease in the overestimation of POA concentrations being much higher than the decrease in the underestimation of SOA with VBS. At Thissio, SOA daily concentrations simulated with VBS could be up to 3.2 times higher than those simulated with SOAP, and simulated SOA levels were determined by the comparable contribution of both anthropogenic and biogenic origin SOA. With respect to PM, the VBS scheme reduced biases and errors at the stations where PM overestimations existed while compensating the overestimations in mass concentrations of chemical components other than OA, and increased biases and errors at the stations where CAMx results were characterized by underestimations, with the statistical indicators taking values within the criteria limits for satisfactory model performance.
The CAMx performance for POA was much better than for SOA both in the warm and cold periods simulated, while VBS improved the repartition of POA and SOA both in July and December 2019. The crucial role of SOA in the atmospheric composition in the study area is considerably underestimated by the model OA schemes, although VBS is more effective.
The inclusion of cooking source sector emissions and the improvements in biomass burning emissions (for heating purposes, from wildfires) will allow for a better representation of simulated OA concentrations in the large urban agglomeration of Athens. IVOC is an important SOA precursor and, until the IVOC emissions are included in the official inventories, future modeling studies in the GAA could adopt a more source-oriented scaling of IVOC emissions with respect to POA. Detailed integration of atmospheric processes (e.g., primary biomass burning emissions nighttime oxidation) could also facilitate the improved reconciliation between OA model results and observations in the Mediterranean urban agglomeration of Athens, with substantial implications for a better understanding of the environmental effects of aerosols and for more sustainable air quality management planning.

Supplementary Materials

The following supporting information can be downloaded at: https://www.mdpi.com/article/10.3390/su17062619/s1, Figure S1: Sectoral contribution to anthropogenic POA, benzene, toluene and xylenes emissions in the modeling domain with the GAA for (a,c,e,g) July and (b,d,f,h) December; Figure S2: OA 3-hourly concentrations observed at the Demokritos research monitoring site and simulated with CAMx using SOAP and VBS schemes (a) July 2019 and (b) December 2019; Figure S3: PMF estimated versus CAMx (with VBS scheme) simulated mean diurnal variations of (a,b) biomass burning, (c,d) cooking and (e,f) “other anthropogenic sources” POA concentrations at Thissio station for July 2019 (left) and December 2019 (right) (cooking emissions were missing and not included in CAMx simulations); Table S1: List of abbreviations; Table S2: Input emission species for OA schemes; Table S3: Description of the stations of the NAPMN of MEEN used in this study; Table S4: Description of the stations of the PANACEA monitoring network of PM2.5 low-cost sensors used in this study; Table S5: Statistical indicators definition and criteria for satisfactory model performance; Map S1: Locations of: (a) stations of NAPMN of ΜΕΕΝ (in purple), (b) the PANACEA research monitoring network (in brown) and (c) the PANACEA monitoring network of PM2.5 low-cost sensors (in red).

Author Contributions

Conceptualization, A.P. (Anastasia Poupkou); investigation, S.K., N.L., D.T., E.L., E.A., G.G., A.B., K.P., E.D., V.V., S.P. and A.P. (Athena Progiou); methodology, A.P. (Anastasia Poupkou), S.K., N.L., P.K., D.M., N.M., E.G., K.E. and C.Z.; software, S.K., N.L. and D.T.; validation, A.P. (Anastasia Poupkou), S.K., N.L., D.T., I.K. and S.S.; writing—original draft, A.P. (Anastasia Poupkou); writing—review and editing, A.P. (Anastasia Poupkou), S.K., N.L., D.T., I.K., S.S., E.L., E.A., G.G., A.B., K.P., E.D., V.V., S.P., A.P. (Athena Progiou), P.K., D.M., N.M., E.G., K.E. and C.Z. All authors have read and agreed to the published version of the manuscript.

Funding

The authors acknowledge the support of the EU project titled “Copernicus Atmosphere Monitoring Service CAMS2_82: Evaluation and quality control (EQA) of Global products”. CAMS is one of six services that form Copernicus, the European Union’s Earth observation programme.

Institutional Review Board Statement

Not applicable.

Informed Consent Statement

Not applicable.

Data Availability Statement

Data are contained within the article and Supplementary Materials.

Acknowledgments

We thank The Netherlands Organization for providing the potential anthropogenic dust resuspension emission data.

Conflicts of Interest

The authors declare no conflicts of interest.

References

  1. European Environmental Agency. Health Impacts of Air Pollution in Europe. European Environmental Agency Web Report. 2022. Available online: https://www.eea.europa.eu/publications/air-quality-in-europe-2022/health-impacts-of-air-pollution (accessed on 14 December 2024).
  2. Kanakidou, M.; Seinfeld, J.H.; Pandis, S.N.; Barnes, I.; Dentener, F.J.; Facchini, M.C.; Van Dingenen, R.; Ervens, B.; Nenes, A.; Nielsen, C.J.; et al. Organic Aerosol and Global Climate Modelling: A Review. Atmos. Chem. Phys. 2005, 5, 1053–1123. [Google Scholar] [CrossRef]
  3. Jiang, J.; Aksoyoglu, S.; El-Haddad, I.; Ciarelli, G.; Denier Van Der Gon, H.A.C.; Canonaco, F.; Gilardoni, S.; Paglione, M.; Minguillón, M.C.; Favez, O.; et al. Sources of Organic Aerosols in Europe: A Modeling Study Using CAMx with Modified Volatility Basis Set Scheme. Atmos. Chem. Phys. 2019, 19, 15247–15270. [Google Scholar] [CrossRef]
  4. Tsigaridis, K.; Daskalakis, N.; Kanakidou, M.; Adams, P.J.; Artaxo, P.; Bahadur, R.; Balkanski, Y.; Bauer, S.E.; Bellouin, N.; Benedetti, A.; et al. The AeroCom Evaluation and Intercomparison of Organic Aerosol in Global Models. Atmos. Chem. Phys. 2014, 14, 10845–10895. [Google Scholar] [CrossRef]
  5. Tsiaousidis, D.T.; Liora, N.; Kontos, S.; Poupkou, A.; Akritidis, D.; Melas, D. Evaluation of PM Chemical Composition in Thessaloniki, Greece Based on Air Quality Simulations. Sustainability 2023, 15, 10034. [Google Scholar] [CrossRef]
  6. Strader, R.; Lurmann, F.; Pandis, S.N. Evaluation of Secondary Organic Aerosol Formation in Winter. Atmos. Environ. 1999, 33, 4849–4863. [Google Scholar] [CrossRef]
  7. Robinson, A.L.; Donahue, N.M.; Shrivastava, M.K.; Weitkamp, E.A.; Sage, A.M.; Grieshop, A.P.; Lane, T.E.; Pierce, J.R.; Pandis, S.N. Rethinking Organic Aerosols: Semivolatile Emissions and Photochemical Aging. Science 2007, 315, 1259–1262. [Google Scholar] [CrossRef]
  8. Koo, B.; Knipping, E.; Yarwood, G. 1.5-Dimensional Volatility Basis Set Approach for Modeling Organic Aerosol in CAMx and CMAQ. Atmos. Environ. 2014, 95, 158–164. [Google Scholar] [CrossRef]
  9. Donahue, N.M.; Epstein, S.A.; Pandis, S.N.; Robinson, A.L. A Two-Dimensional Volatility Basis Set: 1. Organic-Aerosol Mixing Thermodynamics. Atmos. Chem. Phys. 2011, 11, 3303–3318. [Google Scholar] [CrossRef]
  10. Donahue, N.M.; Kroll, J.H.; Pandis, S.N.; Robinson, A.L. A Two-Dimensional Volatility Basis Set—Part 2: Diagnostics of Organic-Aerosol Evolution. Atmos. Chem. Phys. 2012, 12, 615–634. [Google Scholar] [CrossRef]
  11. Fountoukis, C.; Megaritis, A.G.; Skyllakou, K.; Charalampidis, P.E.; Pilinis, C.; Denier Van Der Gon, H.A.C.; Crippa, M.; Canonaco, F.; Mohr, C.; Prévôt, A.S.H.; et al. Organic Aerosol Concentration and Composition over Europe: Insights from Comparison of Regional Model Predictions with Aerosol Mass Spectrometer Factor Analysis. Atmos. Chem. Phys. 2014, 14, 9061–9076. [Google Scholar] [CrossRef]
  12. Ciarelli, G.; Aksoyoglu, S.; Crippa, M.; Jimenez, J.-L.; Nemitz, E.; Sellegri, K.; Äijälä, M.; Carbone, S.; Mohr, C.; O’Dowd, C.; et al. Evaluation of European Air Quality Modelled by CAMx Including the Volatilitybasis Set Scheme. Atmos. Chem. Phys. 2016, 16, 10313–10332. [Google Scholar] [CrossRef]
  13. Athanasopoulou, E.; Vogel, H.; Vogel, B.; Tsimpidi, A.P.; Pandis, S.N.; Knote, C.; Fountoukis, C. Modeling the Meteorological and Chemical Effects of Secondary Organic Aerosols during an EUCAARI Campaign. Atmos. Chem. Phys. 2013, 13, 625–645. [Google Scholar] [CrossRef]
  14. Bergström, R.; Denier Van Der Gon, H.A.C.; Prévôt, A.S.H.; Yttri, K.E.; Simpson, D. Modelling of Organic Aerosols over Europe (2002–2007) Using a Volatility Basis Set (VBS) Framework: Application of Different Assumptions Regarding the Formation of Secondary Organic Aerosol. Atmos. Chem. Phys. 2012, 12, 8499–8527. [Google Scholar] [CrossRef]
  15. Bartík, L.; Huszár, P.; Karlický, J.; Vlček, O.; Eben, K. Modeling the Drivers of Fine PM Pollution over Central Europe: Impacts and Contributions of Emissions from Different Sources. Atmos. Chem. Phys. 2024, 24, 4347–4387. [Google Scholar] [CrossRef]
  16. Poupkou, A.; Markakis, K.; Liora, N.; Giannaros, T.M.; Zanis, P.; Im, U.; Daskalakis, N.; Myriokefalitakis, S.; Kaiser, J.W.; Melas, D.; et al. A Modeling Study of the Impact of the 2007 Greek Forest Fires on the Gaseous Pollutant Levels in the Eastern Mediterranean. Atmos. Res. 2014, 149, 1–17. [Google Scholar] [CrossRef]
  17. Im, U.; Kanakidou, M. Impacts of East Mediterranean Megacity Emissions on Air Quality. Atmos. Chem. Phys. 2012, 12, 6335–6355. [Google Scholar] [CrossRef]
  18. Kanakidou, M.; Mihalopoulos, N.; Kindap, T.; Im, U.; Vrekoussis, M.; Gerasopoulos, E.; Dermitzaki, E.; Unal, A.; Koçak, M.; Markakis, K.; et al. Megacities as Hot Spots of Air Pollution in the East Mediterranean. Atmos. Environ. 2011, 45, 1223–1235. [Google Scholar] [CrossRef]
  19. Meroni, A.; Pirovano, G.; Gilardoni, S.; Lonati, G.; Colombi, C.; Gianelle, V.; Paglione, M.; Poluzzi, V.; Riva, G.M.; Toppetti, A. Investigating the Role of Chemical and Physical Processes on Organic Aerosol Modelling with CAMx in the Po Valley during a Winter Episode. Atmos. Environ. 2017, 171, 126–142. [Google Scholar] [CrossRef]
  20. Basla, B.; Agresti, V.; Balzarini, A.; Giani, P.; Pirovano, G.; Gilardoni, S.; Paglione, M.; Colombi, C.; Belis, C.A.; Poluzzi, V.; et al. Simulations of Organic Aerosol with CAMx over the Po Valley during the Summer Season. Atmosphere 2022, 13, 1996. [Google Scholar] [CrossRef]
  21. Skamarock, W.; Klemp, J.; Dudhia, J.; Gill, D.; Barker, D.; Wang, W.; Huang, X.-Y.; Duda, M. A Description of the Advanced Research WRF Version 3; U.S. National Center for Atmospheric Research: Boulder, CO, USA, 2008. [Google Scholar]
  22. Ramboll Environment and Health. User’s Guide: The Comprehensive Air Quality Model with Extensions (CAMx) Version 7.2; Ramboll US Consulting, Inc.: Arlington, VA, USA, 2022. [Google Scholar]
  23. Inness, A.; Blechschmidt, A.-M.; Bouarar, I.; Chabrillat, S.; Crepulja, M.; Engelen, R.J.; Eskes, H.; Flemming, J.; Gaudel, A.; Hendrick, F.; et al. Data Assimilation of Satellite-Retrieved Ozone, Carbon Monoxide and Nitrogen Dioxide with ECMWF’s Composition-IFS. Atmos. Chem. Phys. 2015, 15, 5275–5303. [Google Scholar] [CrossRef]
  24. Yarwood, G.; Jung, J.; Whitten, G.Z.; Heo, G.; Mellberg, J.; Estes, E. Updates to the Carbon Bond Mechanism for Version 6 (CB6). In Proceedings of the 9th Annual CMAS Conference, Chapel Hill, NC, USA, 11–13 October 2010. [Google Scholar]
  25. Chang, J.S.; Brost, R.A.; Isaksen, I.S.A.; Madronich, S.; Middleton, P.; Stockwell, W.R.; Walcek, C.J. A Three-dimensional Eulerian Acid Deposition Model: Physical Concepts and Formulation. J. Geophys. Res. 1987, 92, 14681–14700. [Google Scholar] [CrossRef]
  26. Nenes, A.; Pilinis, C.; Pandis, S.N. ISORROPIA: A New Thermodynamic Model for Multiphase Multicomponent Inorganic Aerosols. Aquat. Geochem. 1998, 4, 123–152. [Google Scholar] [CrossRef]
  27. Kuenen, J.; van Der Gon, H.D.; Super, I.; Dellaert, S.; Visschedijk, A.; Guevara, M.; Jalkanen, J.-P.; Majamäki, E.; Schindlbacher, S.; Matthews, B.; et al. Recent Developments in the CAMS European Regional Emissions Data (CAMS-REG). CAMS, 29 June 2021. Available online: https://atmosphere.copernicus.eu/sites/default/files/custom-uploads/CAMS-5thPUW/5.%20Kuenen_CAMS_emissions_PUW_Remote_20210629.pdf (accessed on 14 December 2024).
  28. Kuenen, J.; Dellaert, S.; Visschedijk, A.; Jalkanen, J.-P.; Super, I.; Denier Van Der Gon, H. CAMS-REG-v4: A State-of-the-Art High-Resolution European Emission Inventory for Air Quality Modelling. Earth Syst. Sci. Data 2022, 14, 491–515. [Google Scholar] [CrossRef]
  29. Darras, S.; Granier, C.; Liousse, C.; Boulanger, D.; Elguindi, N.; Le Vu, H. The ECCAD Database, Version 2: Emissions of Atmospheric Compounds & Compilation of Ancillary Data. 2018 hal-02144878. Available online: https://hal.science/hal-02144878/document (accessed on 6 March 2025).
  30. EDGAR v.6.1 Database. Available online: https://edgar.jrc.ec.europa.eu/index.php/dataset_ap61 (accessed on 14 December 2024).
  31. Schaap, M.; Manders, A.M.M.; Hendriks, E.C.J.; Cnossen, J.M.; Segers, A.J.S.; Denier van Der Gon, H.A.C.; Jozwicka, M. Regional Modelling of Particulate Matter for the Netherlands. Research Program on Particulate Matter; PBL: Bilthoven, The Netherlands, 2009. [Google Scholar]
  32. Liora, N.; Kontos, S.; Parliari, D.; Akritidis, D.; Poupkou, A.; Papanastasiou, D.K.; Melas, D. “On-Line” Heating Emissions Based on WRF Meteorology—Application and Evaluation of a Modeling System over Greece. Atmosphere 2022, 13, 568. [Google Scholar] [CrossRef]
  33. Liora, N.; Markakis, K.; Poupkou, A.; Giannaros, T.M.; Melas, D. The Natural Emissions Model (NEMO): Description, Application and Model Evaluation. Atmos. Environ. 2015, 122, 493–504. [Google Scholar] [CrossRef]
  34. Liora, N.; Poupkou, A.; Giannaros, T.M.; Kakosimos, K.E.; Stein, O.; Melas, D. Impacts of Natural Emission Sources on Particle Pollution Levels in Europe. Atmos. Environ. 2016, 137, 171–185. [Google Scholar] [CrossRef]
  35. Kontos, S.; Liora, N.; Giannaros, C.; Kakosimos, K.; Poupkou, A.; Melas, D. Modeling Natural Dust Emissions in the Central Middle East: Parameterizations and Sensitivity. Atmos. Environ. 2018, 190, 294–307. [Google Scholar] [CrossRef]
  36. Poupkou, A.; Giannaros, T.; Markakis, K.; Kioutsioukis, I.; Curci, G.; Melas, D.; Zerefos, C. A Model for European Biogenic Volatile Organic Compound Emissions: Software Development and First Validation. Environ. Model. Softw. 2010, 25, 1845–1856. [Google Scholar] [CrossRef]
  37. Hildebrandt Ruiz, L.; Koo, B.; Yarwood, G. Sources of Organic Particulate Matter in Houston: Evidence from DISCOVER-AQ Data—Modeling and Experiments; Final Report Prepared for the Texas AQRP (Project 14-024); University of Texas at Austin and Ramboll Environ: Novato, CA, USA, 2015. [Google Scholar]
  38. YPEN. Annual Air Quality Report 2019; Hellenic Ministry of Environment and Energy: Athens, Greece, 2020. (In Greek) [Google Scholar]
  39. Liakakou, E.; Stavroulas, I.; Kaskaoutis, D.G.; Grivas, G.; Paraskevopoulou, D.; Dumka, U.C.; Tsagkaraki, M.; Bougiatioti, A.; Oikonomou, K.; Sciare, J.; et al. Long-Term Variability, Source Apportionment and Spectral Properties of Black Carbon at an Urban Background Site in Athens, Greece. Atmos. Environ. 2020, 222, 117137. [Google Scholar] [CrossRef]
  40. Eleftheriadis, K.; Gini, M.I.; Diapouli, E.; Vratolis, S.; Vasilatou, V.; Fetfatzis, P.; Manousakas, M.I. Aerosol Microphysics and Chemistry Reveal the COVID19 Lockdown Impact on Urban Air Quality. Sci. Rep. 2021, 11, 14477. [Google Scholar] [CrossRef]
  41. Theodosi, C.; Tsagkaraki, M.; Zarmpas, P.; Grivas, G.; Liakakou, E.; Paraskevopoulou, D.; Lianou, M.; Gerasopoulos, E.; Mihalopoulos, N. Multi-Year Chemical Composition of the Fine-Aerosol Fraction in Athens, Greece, with Emphasis on the Contribution of Residential Heating in Wintertime. Atmos. Chem. Phys. 2018, 18, 14371–14391. [Google Scholar] [CrossRef]
  42. Cavalli, F.; Viana, M.; Yttri, K.E.; Genberg, J.; Putaud, J.-P. Toward a Standardised Thermal-Optical Protocol for Measuring Atmospheric Organic and Elemental Carbon: The EUSAAR Protocol. Atmos. Meas. Tech. 2010, 3, 79–89. [Google Scholar] [CrossRef]
  43. Ng, N.L.; Herndon, S.C.; Trimborn, A.; Canagaratna, M.R.; Croteau, P.L.; Onasch, T.B.; Sueper, D.; Worsnop, D.R.; Zhang, Q.; Sun, Y.L.; et al. An Aerosol Chemical Speciation Monitor (ACSM) for Routine Monitoring of the Composition and Mass Concentrations of Ambient Aerosol. Aerosol. Sci. Technol. 2011, 45, 780–794. [Google Scholar] [CrossRef]
  44. Paatero, P. The Multilinear Engine—A Table-Driven, Least Squares Program for Solving Multilinear Problems, Including the n -Way Parallel Factor Analysis Model. J. Comput. Graph. Stat. 1999, 8, 854–888. [Google Scholar] [CrossRef]
  45. Canonaco, F.; Crippa, M.; Slowik, J.G.; Baltensperger, U.; Prévôt, A.S.H. SoFi, an IGOR-Based Interface for the Efficient Use of the Generalized Multilinear Engine (ME-2) for the Source Apportionment: ME-2 Application to Aerosol Mass Spectrometer Data. Atmos. Meas. Tech. 2013, 6, 3649–3661. [Google Scholar] [CrossRef]
  46. Stavroulas, I.; Bougiatioti, A.; Grivas, G.; Paraskevopoulou, D.; Tsagkaraki, M.; Zarmpas, P.; Liakakou, E.; Gerasopoulos, E.; Mihalopoulos, N. Sources and Processes That Control the Submicron Organic Aerosol Composition in an Urban Mediterranean Environment (Athens): A High Temporal-Resolution Chemical Composition Measurement Study. Atmos. Chem. Phys. 2019, 19, 901–919. [Google Scholar] [CrossRef]
  47. Stavroulas, I.; Grivas, G.; Liakakou, E.; Kalkavouras, P.; Bougiatioti, A.; Kaskaoutis, D.G.; Lianou, M.; Papoutsidaki, K.; Tsagkaraki, M.; Zarmpas, P.; et al. Online Chemical Characterization and Sources of Submicron Aerosol in the Major Mediterranean Port City of Piraeus, Greece. Atmosphere 2021, 12, 1686. [Google Scholar] [CrossRef]
  48. PANACEA Monitoring Network of PM2.5 Low-Cost Sensors. Available online: https://air-quality.gr (accessed on 14 December 2024).
  49. Stavroulas, I.; Grivas, G.; Michalopoulos, P.; Liakakou, E.; Bougiatioti, A.; Kalkavouras, P.; Fameli, K.; Hatzianastassiou, N.; Mihalopoulos, N.; Gerasopoulos, E. Field Evaluation of Low-Cost PM Sensors (Purple Air PA-II) Under Variable Urban Air Quality Conditions, in Greece. Atmosphere 2020, 11, 926. [Google Scholar] [CrossRef]
  50. Dimitriou, K.; Stavroulas, I.; Grivas, G.; Chatzidiakos, C.; Kosmopoulos, G.; Kazantzidis, A.; Kourtidis, K.; Karagioras, A.; Hatzianastassiou, N.; Pandis, S.Ν.; et al. Intra- and Inter-City Variability of PM2.5 Concentrations in Greece as Determined with a Low-Cost Sensor Network. Atmos. Environ. 2023, 301, 119713. [Google Scholar] [CrossRef]
  51. Thunis, P.; Pederzoli, A.; Pernigotti, D. Performance Criteria to Evaluate Air Quality Modeling Applications. Atmos. Environ. 2012, 59, 476–482. [Google Scholar] [CrossRef]
  52. Kontos, S.; Kakosimos, K.; Liora, N.; Poupkou, A.; Melas, D. Towards a Regional Dust Modeling System in the Central Middle East: Evaluation, Uncertainties and Recommendations. Atmos. Environ. 2021, 246, 118160. [Google Scholar] [CrossRef]
  53. Boylan, J.W.; Russell, A.G. PM and Light Extinction Model Performance Metrics, Goals, and Criteria for Three-Dimensional Air Quality Models. Atmos. Environ. 2006, 40, 4946–4959. [Google Scholar] [CrossRef]
  54. Giani, P.; Balzarini, A.; Pirovano, G.; Gilardoni, S.; Paglione, M.; Colombi, C.; Gianelle, V.L.; Belis, C.A.; Poluzzi, V.; Lonati, G. Influence of Semi- and Intermediate-Volatile Organic Compounds (S/IVOC) Parameterizations, Volatility Distributions and Aging Schemes on Organic Aerosol Modelling in Winter Conditions. Atmos. Environ. 2019, 213, 11–24. [Google Scholar] [CrossRef]
  55. Tsiflikiotou, M.A.; Kostenidou, E.; Papanastasiou, D.K.; Patoulias, D.; Zarmpas, P.; Paraskevopoulou, D.; Diapouli, E.; Kaltsonoudis, C.; Florou, K.; Bougiatioti, A.; et al. Summertime Particulate Matter and Its Composition in Greece. Atmos. Environ. 2019, 213, 597–607. [Google Scholar] [CrossRef]
  56. Paraskevopoulou, D.; Bougiatioti, A.; Zarmpas, P.; Tsagkaraki, M.; Nenes, A.; Mihalopoulos, N. Impact of COVID-19 Lockdown on Oxidative Potential of Particulate Matter: Case of Athens (Greece). Toxics 2022, 10, 280. [Google Scholar] [CrossRef]
  57. Kodros, J.K.; Papanastasiou, D.K.; Paglione, M.; Masiol, M.; Squizzato, S.; Florou, K.; Skyllakou, K.; Kaltsonoudis, C.; Nenes, A.; Pandis, S.N. Rapid Dark Aging of Biomass Burning as an Overlooked Source of Oxidized Organic Aerosol. Proc. Natl. Acad. Sci. USA 2020, 117, 33028–33033. [Google Scholar] [CrossRef]
  58. Fountoukis, C.; Megaritis, A.G.; Skyllakou, K.; Charalampidis, P.E.; Denier van der Gon, H.A.C.; Crippa, M.; Prévôt, A.S.H.; Fachinger, F.; Wiedensohler, A.; Pilinis, C.; et al. Simulating the Formation of Carbonaceous Aerosol in a European Megacity (Paris) during the MEGAPOLI Summer and Winter Campaigns. Atmos. Chem. Phys. 2016, 16, 3727–3741. [Google Scholar] [CrossRef]
  59. Denier Van Der Gon, H.A.C.; Bergström, R.; Fountoukis, C.; Johansson, C.; Pandis, S.N.; Simpson, D.; Visschedijk, A.J.H. Particulate Emissions from Residential Wood Combustion in Europe—Revised Estimates and an Evaluation. Atmos. Chem. Phys. 2015, 15, 6503–6519. [Google Scholar] [CrossRef]
  60. Lane, T.E.; Donahue, N.M.; Pandis, S.N. Simulating Secondary Organic Aerosol Formation Using the Volatility Basis-Set Approach in a Chemical Transport Model. Atmos. Environ. 2008, 42, 7439–7451. [Google Scholar] [CrossRef]
  61. Murphy, B.N.; Pandis, S.N. Simulating the Formation of Semivolatile Primary and Secondary Organic Aerosol in a Regional Chemical Transport Model. Environ. Sci. Technol. 2009, 43, 4722–4728. [Google Scholar] [CrossRef]
  62. Vasilakopoulou, C.N.; Matrali, A.; Skyllakou, K.; Georgopoulou, M.; Aktypis, A.; Florou, K.; Kaltsonoudis, C.; Siouti, E.; Kostenidou, E.; Błaziak, A.; et al. Rapid Transformation of Wildfire Emissions to Harmful Background Aerosol. npj Clim. Atmos. Sci. 2023, 6, 218. [Google Scholar] [CrossRef]
Figure 1. WRF-CAMx modeling domains (d01: Europe and North Africa domain, d02: Central and Eastern Mediterranean domain, d03: Greater Athens Area (GAA) and neighboring areas domain).
Sustainability 17 02619 g001
Figure 2. Maps of anthropogenic primary organic aerosol (POA) and benzene emissions in the domain of the GAA and neighboring areas for (a,c) July and (b,d) December.
Sustainability 17 02619 g002
Figure 3. Percentage differences ((VBS-SOAP)/SOAP, in %) in simulated monthly concentration values between volatility basis set (VBS) and secondary organic aerosol processor (SOAP) schemes for organic aerosol (OA), POA, secondary OA (SOA) in (ac) July 2019 and (df) December 2019.
Sustainability 17 02619 g003
Figure 4. (a,b) PM2.5 chemical composition observed at the PANACEA research monitoring sites and CAMx simulations mean biases with the use of SOAP scheme (PM species presented are explicitly modeled by CAMx and are in common with measurements, i.e., elemental carbon (EC), OA, sulfate (SO4), nitrate (NO3), ammonium (NH4), sodium (Na) and chloride (Cl)), (c,d) OA daily concentrations observed at the PANACEA research monitoring sites and simulated with CAMx using SOAP and VBS schemes for July 2019.
Sustainability 17 02619 g004
Figure 5. (a,b) PM2.5 chemical composition observed at the PANACEA research monitoring sites and CAMx simulations mean biases with the use of SOAP scheme (PM species presented are explicitly modeled by CAMx and are in common with measurements, i.e., EC, OA, SO4, NO3, NH4, Na, and Cl), (c,d) OA daily concentrations observed at the PANACEA research monitoring sites and simulated with CAMx using SOAP and VBS schemes for December 2019.
Sustainability 17 02619 g005
Figure 6. Positive matrix factorization (PMF) estimated versus CAMx simulated time series with SOAP and VBS schemes of daily concentrations and mean diurnal variations of (a,b) POA (PMF POA as the aggregate of hydrocarbon-like OA (HOA) and cooking OA (COA)) and (c,d) SOA (CAMx SOA as the aggregate of anthropogenic SOA (ASOA) and biogenic SOA (BSOA)) at Thissio station for July 2019.
Sustainability 17 02619 g006
Figure 7. PMF estimated versus CAMx simulated time series with SOAP and VBS schemes of daily concentrations and mean diurnal variations of (a,b) POA (PMF POA as the aggregate of HOA, COA and biomass burning OA (BBOA)) and (c,d) SOA (CAMx SOA as the aggregate of ASOA and BSOA) at Thissio station for December 2019.
Sustainability 17 02619 g007
Table 1. Comparison between modeled and observed daily concentrations of PM with an average aerodynamic diameter of up to 10 μm (PM10) and PM with an average aerodynamic diameter of up to 2.5 μm (PM2.5) by organic aerosol (OA) scheme (secondary organic aerosol processor (SOAP) and volatility basis set (VBS)) and type of monitoring station (July 2019).
PM10 *PM2.5 *PM2.5 **
UTUBSBUTSBUBSB
Statistical Indicator
(Unit) ***
SOAPVBSSOAPVBSSOAPVBSSOAPVBSSOAPVBSSOAPVBSSOAPVBS
NMB (%)−12.21−10.353.966.56−13.56−10.99−21.78−18.03−36.28−32.437.4312.61−14.44−9.16
NMSE (-)0.330.320.540.520.800.770.210.180.450.390.250.240.340.30
IOA (-)0.600.600.530.520.470.470.620.630.490.510.480.480.480.49
MFB (-)−0.27−0.24−0.12−0.09−0.37−0.33−0.30−0.25−0.52−0.46−0.010.04−0.24−0.18
MFE (-)0.420.400.350.330.550.520.400.360.590530.350.330.460.42
* Measurements from the National Air Pollution Monitoring Network (NAPMN) of the Greek Ministry of Environment and Energy (MEEN). ** Measurements from the PM2.5 low-cost sensors of the PANACEA network in the GAA. *** The values in bold are within the limits indicating satisfactory model performance [defined in the Supplementary Materials, Table S5]. [Type of monitoring station—UT: Urban Traffic; UB: Urban Background; SB: Suburban Background, Statistical Indicator—NMB: Normalized Mean Bias; NMSE: Normalized Mean Square Error; IOA: Index Of Agreement; MFB: Mean Fractional Bias; MFE: Mean Fractional Error].
Table 2. As in Table 1 for December 2019.
PM10 *PM2.5 *PM2.5 **
UTUBSBUTSBUBSB
Statistical Indicator
(Unit) ***
SOAPVBSSOAPVBSSOAPVBSSOAPVBSSOAPVBSSOAPVBSSOAPVBS
NMB (%)+15.90+6.06+4.08−1.84+12.09+8.67+23.88+10.88+9.86+4.12+23.50+10.59−14.50−20.58
NMSE (-)0.140.120.140.140.160.170.180.130.210.210.270.240.310.38
IOA (-)0.880.890.900.900.930.930.860.890.850.860.790.810.680.65
MFB (-)+0.16+0.08+0.05−0.01+0.02−0.02+0.24+0.14+0.02−0.04+0.22+0.13−0.19−0.27
MFE (-)0.340.320.340.330.330.330.390.360.320.330.420.400.370.42
* Measurements from the NAPMN monitoring network of MEEN. ** Measurements from the PM2.5 low-cost sensors of the PANACEA network in the GAA. *** The values in bold are within the limits indicating satisfactory model performance [defined in the Supplementary Materials, Table S5]. [Type of monitoring station—UT: Urban Traffic; UB: Urban Background; SB: Suburban Background, Statistical Indicator—NMB: Normalized Mean Bias; NMSE: Normalized Mean Square Error; IOA: Index Of Agreement; MFB: Mean Fractional Bias; MFE: Mean Fractional Error].
Table 3. Statistical indicators’ values to compare modeled and observed daily PM2.5 and OA (in parenthesis) concentrations by OA scheme (SOAP and VBS) at the PANACEA research stations for July and December 2019.
ThissioDemokritos
July 2019December 2019July 2019December 2019
Statistical Indicator (Unit) *SOAPVBSSOAPVBSSOAPVBSSOAPVBS
NMB (%)−19.23
(−53.18)
−15.07
(−40.30)
−13.15
(−2.27)
−23.78
(−30.35)
−26.67
(−63.43)
−22.37
(−51.28)
+33.40
(−31.62)
+23.73
(−54.07)
NMSE (-)0.40
(0.93)
0.36
(0.52)
0.17
(0.98)
0.23
(1.30)
0.36
(1.30)
0.31
(0.70)
0.16
(0.29)
0.11
(0.76)
IOA (-)0.49
(0.52)
0.50
(0.56)
0.81
(0.52)
0.76
(0.50)
0.56
(0.42)
0.57
(0.47)
0.86
(0.58)
0.90
(0.48)
MFB (-)−0.18
(−0.66)
−0.13
(−0.44)
−0.12
(−0.15)
−0.24
(−0.10)
−0.38
(−0.93)
−0.32
(−0.69)
+0.29
(−0.45)
+0.21
(−0.77)
MFE (-)0.45
(0.66)
0.43
(0.49)
0.41
(0.69)
0.44
(0.69)
0.51
(0.93)
0.45
(0.69)
0.31
(0.51)
0.26
(0.77)
* The values in bold are within the limits indicating satisfactory model performance in PM2.5 simulations [defined in the Supplementary Materials, Table S5]. [Statistical Indicator—NMB: Normalized Mean Bias; NMSE: Normalized Mean Square Error; IOA: Index Of Agreement; MFB: Mean Fractional Bias; MFE: Mean Fractional Error].
Disclaimer/Publisher’s Note: The statements, opinions and data contained in all publications are solely those of the individual author(s) and contributor(s) and not of MDPI and/or the editor(s). MDPI and/or the editor(s) disclaim responsibility for any injury to people or property resulting from any ideas, methods, instructions or products referred to in the content.

