Abstract
The clustering and collaborative development among cities, as a strategic measure concerning regional inclusivity and sustainable development, is both a current practice and a future trend, as evidenced by numerous successful cases worldwide. Scholarly research has extensively validated, from a macro-level perspective, its positive effects on social and economic aspects. However, relatively little research has examined its impact on the behavior of micro-level enterprises. To bridge this gap, this study leverages China’s urban integration strategy as a natural experimental framework and employs a two-way fixed effects model to conduct an in-depth investigation. The empirical results indicate that coordinated urban agglomeration development significantly enhances the technological complexity of enterprises within the region. The primary mechanism underlying this relationship is that the urban integration strategy facilitates regional financial concentration, fosters industrial collaborative agglomeration, and advances firm specialization, thereby enhancing the innovation capacity of enterprises. Furthermore, the heterogeneity analysis indicates that the findings are particularly pronounced for core cities within urban clusters, cities with lower levels of industrial specialization, and those with higher levels of financial development. Additionally, the effects are more significant for firms that face fewer financing constraints and inherently possess strong innovation capabilities. These findings not only augment the existing research on the micro-level effects of urban cluster development but also provide valuable insights for local governments in crafting policies to further enhance the sustainable innovation capacity of enterprises.
1. Introduction
In this era that emphasizes cooperation and mutual benefit, just as individuals collaborate with one another, cities are also increasingly seeking to develop through collective efforts, evolving from a model of “going it alone” to one of “advancing together through coordination”. The development of urban agglomerations has become a key strategy for countries worldwide to enhance regional economic vitality. It is also an essential prerequisite for promoting more inclusive and sustainable regional development. Prominent examples, including the New York Metropolitan Area, the San Francisco Bay Area, the Greater Tokyo Area, the London and Paris Metropolitan Areas, as well as China’s Yangtze River Delta, Pearl River Delta, and Beijing-Tianjin-Hebei clusters, highlight the transformative impact of city clusters and coordinated regional development on economic growth. The core economic rationale behind the development of such clusters primarily lies in the radiating and driving role of central cities [1], along with the integration and optimal allocation of resources within urban agglomerations [2,3].
Specifically, by breaking administrative boundaries and forming integrated development, the collaborative development of urban agglomerations facilitates the seamless flow of people, goods, and capital within these clusters [4], while promoting industrial agglomeration and coordination [5], as well as enhancing industrial chains and supporting infrastructure. Furthermore, as economic resources become more abundant and supporting industrial chains are progressively refined, enterprises within the region will experience more precise and specialized roles in the division of labor along the value chain, enabling them to focus more intently on research and development (R&D) within their respective fields. Thus, a follow-up question naturally arises: does the integrated development of city clusters promote enterprises in enhancing their innovation capabilities? This is a crucial question that warrants attention both in terms of local government policy-making and academic research in urban economics. At the academic level, exploring this issue can enhance the understanding of the impacts on coordinated development within urban agglomerations, particularly by delving into the micro-level of enterprises. On a practical level, examining this issue provides empirical insights that can aid local governments in crafting policies to strengthen the innovation capabilities of local enterprises. However, to the best of our knowledge, this issue remains unexplored in existing studies. Therefore, this study aims to address and fill this research gap.
China provides a suitable research context for exploring this issue. In recent years, Chinese enterprises have made significant strides in enhancing their innovation capabilities. Meanwhile, since the early 21st century, the Chinese government has progressively implemented an urban integration strategy for city clusters nationwide, aiming to advance urbanization and promote the overall economic development of metropolitan regions. The implementation of this strategy coincides temporally with firms’ innovation advancements while remaining entirely exogenous. Hence, we leverage this strategy to establish a natural experiment, employing causal identification methods to investigate the core issue of this study.
The innovative contribution of this study lies, firstly, in its use of China’s urban integration development strategy to explore the impact of coordinated development within urban clusters on firms’ innovation quality, thereby effectively addressing the endogeneity issue in the exploration of this topic. Secondly, as existing research on the economic impact of coordinated development within urban clusters has predominantly focused on the regional level, this study further advances the field by extending the analysis to the micro-level perspective of firms. More specifically, it pioneers an exploration of how urban cluster development strategies influence the innovation capacity of local enterprises, addressing an unexplored perspective and research gap. Thirdly, this study also contributes by examining a macro-environmental factor that influences firms’ innovation capabilities.
The remainder of this paper is organized as follows. Section 2 presents a review of the relevant literature. Section 3 describes the model estimation strategy and the methodology for calculating variables. Section 4 reports the empirical results of this study. In Section 5, we discuss the economic implications of the findings. Finally, Section 6 concludes the paper with key takeaways.
2. Literature Review
2.1. Collaborative Development of Urban Agglomerations
The development of urban agglomeration integration generally refers to the process through which multiple geographically proximate and culturally similar cities coordinate and integrate their development across economic, social, and transportation domains. According to Zhou (2016) [6], urban development is a process of interactive “space-industry” evolution, in which external economies are continuously internalized. Meanwhile, the division of labor within the value chain also evolves in response to changes in urban spatial structures. The integration of urban clusters, akin to an extension of a single city’s spatial structure, will reshape this process on a larger geographic scale. Essentially, it involves breaking down administrative barriers [7] and optimizing resource allocation across a broader region beyond individual cities [8], ultimately aiming to enhance overall regional competitiveness. Therefore, this is a policy measure that contributes to promoting inclusive and sustainable regional development.
The integration of urban agglomerations is characterized by several key features. Firstly, there is a blending of residential spaces across different cities. For example, in the New York metropolitan area, many professionals working in sectors such as finance and media in Manhattan choose to reside in nearby cities like Jersey City, Newark, and Hoboken. Similarly, in the Tokyo metropolitan area, a substantial number of commuters live in surrounding satellite cities such as Yokohama, Chiba, and Saitama. This aspect often necessitates the integration of nearby cities into a “one-hour living circle” through the development of transportation infrastructure. Secondly, there is the clustering and optimization of industrial chains within urban agglomeration regions. For instance, in the Yangtze River Delta urban agglomeration, Tesla’s factory in Shanghai is supported by a well-integrated supply chain network, with Suzhou supplying key components and Ningbo providing batteries, thereby creating a specialized cluster for the new energy vehicle industry. Likewise, in the semiconductor industry of the San Francisco Bay Area, different cities perform specialized functions: Silicon Valley focuses on chip design, Oakland specializes in packaging and testing, while San Jose hosts major end-user technology firms such as Intel, Apple, and IBM.
Thirdly, there is policy coordination among cities. In Germany’s Ruhr metropolitan region, several cities have collaborated to establish a regional coordination committee aimed at harmonizing urban policies and management while resolving policy conflicts between cities. Additionally, the German government has created regional coordination organizations, such as the “Ruhr Regional Development Corporation,” tasked with formulating unified economic development plans and fostering intercity collaboration within the region. In China, when “urban integration” is incorporated into a province’s five-year development plan, municipal governments at the prefectural level typically follow up by signing intercity cooperation frameworks. These frameworks serve as a foundation for implementing a series of concrete policy measures to advance urban integration. Such measures often include the establishment of joint industrial parks, the integration of healthcare and social security systems, and coordinated land-use planning.
2.2. The Impact of Urban Agglomeration Development
Existing research on the impact of urban agglomeration development has largely been confined to analyses at the macro-regional level. First, from an economic perspective, most studies acknowledge the positive impact of urban cluster coordination on regional economic growth. For instance, Wang et al. (2023) state that urban cluster development strategies contribute to overall regional economic advancement through the aggregation of green development initiatives, medical resources, and the expansion of the logistics industry [9]. Similarly, Wang and Wang (2024) suggest that urban cluster construction enhances common prosperity in bordering counties across provincial lines by improving infrastructure, driving investment, and facilitating industrial upgrading [10]. However, Yuan et al. (2024) claim that due to variations in economic foundations among cities, urban cluster policies may, in fact, exacerbate development disparities within the cluster rather than promoting balanced growth [11]. In the process of influencing regional economic development, the role of central cities has sparked considerable debate. The work of Hu et al. (2024) shows that central cities may create a siphon effect on resources within urban clusters, promoting the growth of the central cities themselves while failing to foster balanced regional economic development [12]. In contrast, Zhang and Mao (2024) argue that urban cluster integration strategies, through mechanisms such as technology diffusion, industrial investment, and population mobility, can mitigate the siphon effect caused by central city expansion, thereby promoting economic growth in peripheral cities [13]. Moreover, some studies suggest that urban cluster development strategies also impact the industrial structure within the cluster. For instance, Liu et al. (2023), in their analysis of the coordinated development of the Beijing–Tianjin–Hebei urban cluster, concluded that peripheral cities absorb some of Beijing’s “non-capital functions”. This is reflected in a reduction in Beijing’s share in traditional industries such as agriculture, forestry, animal husbandry, fishing, and manufacturing. However, this process further strengthens Beijing’s position in technology-intensive and knowledge-intensive industries, including information technology, finance, and science and technology [14].
Secondly, in terms of environmental aspects, scholars generally hold a positive view of urban cluster development. Some researchers contend that urban cluster construction can reduce the overall concentration of air pollutants, thereby improving urban air quality [15]. Others suggest that urban agglomerations can lower regional carbon emissions [16] and drive the green development of cities [17]. Finally, regarding social impacts, Cao et al. (2023) argue that the higher the level of urban agglomeration development, the greater the degree of population concentration [18]. Building on the existing literature, we observe that research on the impact of the coordinated development of urban clusters remains largely at the macro level, with limited exploration at the micro level, particularly regarding its effects on firm innovation. Notably, no studies have specifically addressed this aspect. Therefore, this paper aims to bridge this research gap.
2.3. Factors Influencing Corporate Innovation Levels
This study is also related to the research on factors influencing firm innovation. The existing literature extensively explores these factors, generally classifying them into internal and external categories. Internal factors include characteristics such as the firm’s corporate social responsibility practices [19], financial constraints [20], environmental information disclosure [21], and the attributes of stakeholders, including shareholders [22] and management [23,24]—all of which have been empirically shown to impact corporate innovation. This study primarily focuses on factors related to the external environment. External factors influencing firm innovation can generally be categorized into three broad dimensions: cultural, policy, and market factors. In the cultural dimension, research indicates that regional cultures characterized by a higher propensity for gambling [25] or greater creativity [26] tend to foster firm innovation. In contrast, national cultures with lower levels of individualism or higher levels of uncertainty avoidance are often associated with lower innovation efficiency [27]. In the policy dimension, uncertainties in fiscal [28], economic [29], and trade policies [30] can exert a suppressive effect on firm innovation. Amore et al. (2013) found that the deregulation of interstate banking has a positive effect on both the quantity and quality of firm innovation [31]. Tu and Shi (2023) pointed out that China’s carbon trading policy has enhanced the quality of firm innovation but has had no significant impact on the quantity of innovation [32]. In the market dimension, the liberalization of stock markets [33] and competitive behavior among peers [34,35] both serve as catalysts for firm innovation.
3. Methods and Analysis
3.1. Econometric Estimation Strategy
This study employs the phased implementation of China’s nationwide urban cluster integration development strategy as a policy shock to construct a natural experiment framework, aiming to explore how urban cluster integration affects the innovation levels of enterprises within these regions. Accordingly, this section first provides an overview of China’s urban integration development strategy.
To further urbanization and promote regional economic development, the Chinese government began implementing the “integrated development of city clusters” strategy in the early 21st century. This approach gained notable emphasis with the release of the Outline of the 11th Five-Year Plan for National Economic and Social Development in 2006, which underscored city clusters as the core framework for advancing urbanization while ensuring balanced development among large, medium, and small cities and towns. Since then, the Chinese government has consistently reinforced its dedication to this strategic vision. The 13th Five-Year Plan (2016) expanded on this strategy by introducing a “two horizontal, three vertical” city cluster layout nationwide. Most recently, the 14th Five-Year Plan (2021) called for leveraging the radiating influence of major central cities, improving coordinated development within one-hour commuting circles, and fostering the growth of highly integrated and modern metropolitan areas. These milestones highlight the government’s recognition of and consistent adherence to the city cluster development strategy.
At the same time, local governments have actively responded to the central government’s call by seeking mutual cooperation, resulting in the formation of numerous city clusters pursuing integrated development. As of the end of 2023, approximately 26 city clusters have implemented the integrated development strategy. The specific list of these city clusters and their official start dates are presented in Table 1, while the spatial distribution of the city clusters is shown in Figure 1. The integrated development strategies implemented by various cities are not directly economically linked to the innovation investments or outcomes of local enterprises. As such, the impact of these policies can be considered relatively exogenous to the research question addressed in this paper.

Table 1.
Timeline for urban integration.
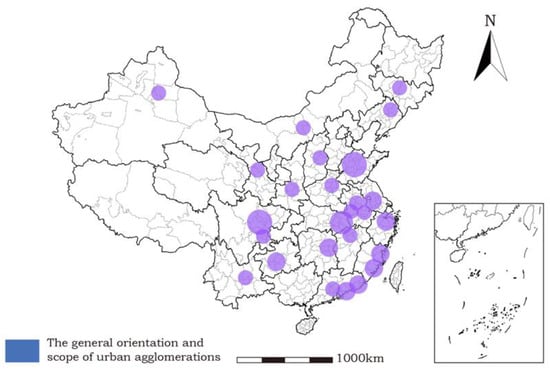
Figure 1.
Spatial distribution of the urban integration strategy.
Based on the above analysis, it is evident that the urban integration development strategy, promoted by the Chinese government, aims to enhance socioeconomic coordination within urban agglomerations. However, it does not directly target the innovation capabilities of firms within these regions, nor can firms readily anticipate the potential impacts of this strategy on their innovation performance. The policy shock, therefore, possesses sufficiently strong exogeneity conditions in the context of this study. Moreover, we have made efforts to control variables that could influence the innovation capacity or technological complexity of the enterprises. Given that the urban agglomeration development strategies in various Chinese city clusters have been implemented at different points in time, this paper employs a two-way fixed effects model for empirical analysis. Additionally, the strategy has been gradually implemented since the early 21st century, with new urban clusters continuing to join the initiative as recently as the end of 2023, resulting in a notably extended time span. Considering the significant economic and social transformations that may take place in the sample cities over such a lengthy period, numerous additional factors could influence the research. Therefore, this study is confined to the period between 2000 and 2015 to ensure the reliability and accuracy of its conclusions. The specific model configuration is as follows.
In the formula, denotes the technological complexity of the firm. represents a variable that characterizes whether a city participates in the urban integration process. If city c begins to engage in the urban integration development strategy from year t, takes the value of 1 starting from year t; otherwise, it takes the value of 0. Firm_controls represent the control variables at the firm level, which include company size (Size), leverage (Lev), cash holdings (Cash), return on assets (ROA), business growth rate (Grow), and the proportion of shares held by the top 10 shareholders (Top10). City_controls represent the control variables at the prefecture city level, which include economic growth rate (GDPg), innovation level (Innov), and trade openness (Trade), among others. To control the impact of different industries on corporate innovation, we included industry fixed effects () in the model. and represent fixed effects at the city and year levels, respectively. For all continuous variables, we applied 1% and 99% winsorization. Additionally, standard errors were clustered at the prefecture-level city.
3.2. Variable Selection
3.2.1. Dependent Variable
The enterprise innovation examined in this study primarily focuses on substantive innovation. Therefore, we measure the level of enterprise innovation based on innovation quality rather than quantity. Accordingly, we select a firm’s technological complexity as the dependent variable in this study, as it not only reflects the knowledge content and intricacy of the patents it holds but also serves as an indicator of the firm’s technological expertise and monopoly power. The greater the complexity of the knowledge embedded in a firm’s patents, the more difficult it becomes for competitors to imitate its products, leading to fewer substitute products in the market. The existing literature on measuring a firm’s technological complexity follows a consistent approach, which relies on the use of International Patent Classification (IPC) codes in patent documents, along with the specialized field information within these codes. A single patent may correspond to multiple IPC codes. For instance, a patent from a certain firm may have the IPC codes C07K14/435, C12N15/12, C12N15/63, C12Q1/68, A61K39/395, and A61K38/17—six in total. Among these, C07K14, C12N15, C12Q1, A61K39, and A61K38 represent the “main group” classification, while the numbers following the “/” symbol indicate the “subgroup” classification. The greater the number of main group classifications, the more diverse the knowledge domains contained in the patent, and, consequently, the higher its technological complexity.
Specifically, there are two main approaches for measuring a firm’s technological complexity. One method, proposed by Zhang and Zheng (2018), first utilizes information at the main group level and applies a weighting scheme based on the Herfindahl–Hirschman Index, expressed as follows: [36]. This formula is used to calculate the technological complexity of an individual patent. Specifically, represents the ratio of the number of IPC codes within a given main group to the total number of IPC codes. Next, the technological complexity of each patent is averaged, or the median is taken to derive the firm-level technological complexity indicator. A higher value of this indicator corresponds to greater technological complexity for the firm. In this study, we primarily use this method as the main measure of a firm’s technological complexity. In the second step of the above calculation process, the final indicator obtained using the median serves as the primary dependent variable (Complex1), while the final indicator derived from the mean is used as the dependent variable for robustness checks (Complex2). This is because, according to the research conducted by Zhang and Zheng (2018) [36], employing the median to compute technological complexity at the firm level is deemed more appropriate.
Another measure of a firm’s technological complexity, proposed by Li, Wang, and Wu (2021), is similar to that of Zhang and Zheng (2018), with slight differences [37]. The patent knowledge breadth at the firm level is defined as follows: . In the equation, represents the cumulative number of IPC for invention and model patents held by firm i in the m main group up to year t, while denotes the cumulative number of IPC across all main groups held by firm i up to year t. A larger value of this indicator indicates a greater breadth of the firm’s patent knowledge, or, alternatively, a higher level of technological complexity associated with the firm’s patents. In this study, we also apply this method to develop an indicator of firm technological complexity (Complex3), which is used in robustness tests.
3.2.2. Mechanism Variables
In the mechanism testing section, we introduce three mediating variables: financial concentration, collaborative agglomeration, and corporate specialization level. First, financial concentration, in a narrow sense, refers to the static industrial spatial organization formed by financial institutions within a region. In a broader sense, it refers to the dynamic process in which financial resources and industries shift toward a less densely concentrated distribution within a certain space [38]. Here, we adopt its broader definition, drawing on the works of Wang et al. (2019) [39], Cai and Shu (2024) [40], and Deng and Kuang (2024) [41], and quantify the degree of financial concentration in prefecture-level cities using a composite index (FCI): 60% weight for the proportion of deposits and loans held by financial institutions, 30% weight for the proportion of financial professionals, and 10% weight for the proportion of IPO-listed companies. Each of these shares is calculated by dividing the corresponding variable at the prefecture-level city by its national counterpart.
Second, collaborative agglomeration. The literature contains the concept of “collaborative agglomeration of manufacturing and producer services,” which refers to the geographic concentration of manufacturing industries and the enterprises providing supporting production services [42]. Such industrial agglomeration aims to reduce transaction costs and enhance service quality [43], while also exemplifying the optimization of industrial layout within a specific region. For this variable, we draw on the works of Ellison, Glaeser, and Kerr (2010) [44], Yang, Song, and Chahine (2016) [45], and Zheng and He (2022) [46], and apply the following formula for measurement.
where and denote the levels of agglomeration in the manufacturing sector and the productive services sector, respectively, for city c in year t. The degree of industrial agglomeration is calculated using the location entropy method. Specifically, (or ) = . represents the number of workers employed in industry j in city c in year t, with industry j being sourced from the manufacturing sector (or productive services sector). represents the total employment in city c in year t. refers to the total number of workers employed in industry j nationwide during year t, and indicates the total employment across the country in year t. Here, we define the productive services sector as comprising the following industries: information transmission, computer services and software; transportation, warehousing, postal and telecommunications services; scientific research, technical services, and geological exploration; leasing and business services, and finance.
Third, regarding the measurement of a company’s degree of specialization, we draw on the works of Buzzell (1983) [47], Fan and Peng (2017) [48], and Yuan et al. (2021) [49], and employ the method of value added to sales (VAS) for assessment. The primary logic of this method is that the higher the proportion of a firm’s value added to its sales revenue, the greater its level of vertical integration. Vertical integration and specialization are opposing concepts within a firm. The formula is expressed as follows.
where value added is defined as the difference between a company’s sales and procurement amounts, while normal profit is represented by the product of net assets and the average return on assets. VA denotes value added, NPAT stands for net profit after tax, NP refers to normal profit, and MOR signifies main operating revenue. Furthermore, the procurement amount is calculated using the following formula.
where CP denotes cash payments for purchased goods and services, and stand for beginning prepayments and ending prepayments, and represent beginning accounts payable and ending accounts payable, and denote beginning notes payable and ending notes payable, and signify beginning inventory and ending inventory, VAT is the VAT Rate on purchased goods. Finally, the degree of specialization of the firm (Spec) is calculated as 1—VAS. A higher value indicates a greater level of specialization.
The descriptive statistics of the main variables in this study are presented in Table 2.
Table 2.
Summary statistics for the main variables.
3.3. Data Sources
This study primarily employs four distinct databases across two levels—firm and regional. At the firm level, it includes patent data and financial information, while at the regional level, it comprises fiscal and economic indicators at the prefecture city level and a list of cities that have implemented urban integration strategies. The patent database is sourced from the China National Intellectual Property Administration (CNIPA). We matched the patent data with the financial data of enterprises using an exact matching method based on the Chinese names of the enterprises contained in the database. To ensure the technological substance of the patents, this study considers only invention patents and utility model patents, excluding design patents. For companies with incorrect or missing information in their Chinese names, we conduct manual verification by referring to online sources.
The financial data at the company level is sourced from the CSMAR database for listed companies, while the financial data for industrial enterprises is derived from the database of all industrial enterprises above a designated size, published by the National Bureau of Statistics of China for the period of 2000–2014. The exclusion of the 2015 data is due to the fact that the industrial enterprise data for that year lacks company names and organizational codes, which renders it impossible to align with data from previous years or the patent database. For the company samples, we excluded those exhibiting financial anomalies. Specifically, for listed companies, we excluded samples designated as ST or *ST, those belonging to the financial industry, or those with a debt-to-equity ratio greater than 1. For industrial enterprise samples, we excluded those with total assets, total industrial output value, or net fixed assets less than or equal to zero, as well as those with fewer than eight employees. Additionally, samples with significant missing data for certain variables across years were also removed.
The fiscal and economic indicator data at the regional level are sourced from the statistical yearbooks or statistical bulletins of various prefecture-level cities. The data relevant to the urban integration development strategy was manually collected through the internet.
4. Results
4.1. Main Results
4.1.1. Baseline Regression
Table 3 reports the baseline regression results based on Equation (4). The results in column (1) do not include control variables at the firm level and serve as the benchmark reference. Columns (2) through (4) present the results with a stepwise inclusion of additional firm characteristics. Specifically, each subsequent column incorporates new attributes: basic characteristics in Column (2), growth status in Column (3), and ownership concentration in Column (4). In the regression results across the columns, the coefficient of the key explanatory variable, Integ, is positive and statistically significant at the 1% level. This indicates that the strategy of urban integration has significantly enhanced the technological complexity of enterprises within city clusters.
Table 3.
Results of main regressions.
As a prerequisite for the validity of the conclusion, we need to ensure that, in the years prior to the policy shock, there are no significant differences in technological complexity between the treatment and control groups, after controlling for a series of firm- and region-level characteristic variables. To this end, we use the year preceding the policy shock as the benchmark for comparison and conduct a “parallel trend test”. The results, as shown in Figure 2, confirm the validity of the parallel trends assumption. Additionally, to ensure that the treatment effects observed in column (4) of Table 3 are not due to random chance, we conducted an individual placebo test. The sample firms were randomly assigned into a treatment group and a control group, with the original timing of the treatment group’s entry into the treatment state maintained. We then performed the regression again to obtain the coefficient values and p-values for the core explanatory variable. After 500 iterations, the resulting coefficient values and their distribution are illustrated in Figure 3. The figure illustrates that the treatment effect value in the main regression (0.1034) is located at the tail end of the entire coefficient distribution, thereby rejecting the null hypothesis that the treatment effect is a random observation.
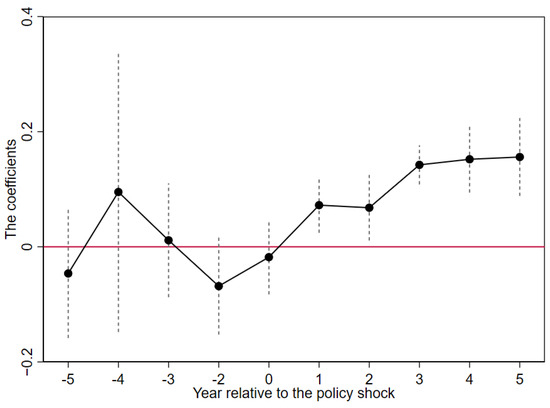
Figure 2.
Parallel trends test results. Note: In the figure, the horizontal axis represents the years relative to the occurrence of the policy shock, while the vertical axis represents the coefficient values. The black dots indicate the coefficient values of the core variable, Integ, for each period, and the gray dashed line represents the 95% confidence interval of the standard error. The figure shows that, prior to the policy shock, the coefficient values are not significant and fluctuate around the zero axis. However, after the policy shock, there is a clear upward trend above the zero axis, with all coefficients becoming statistically significant.
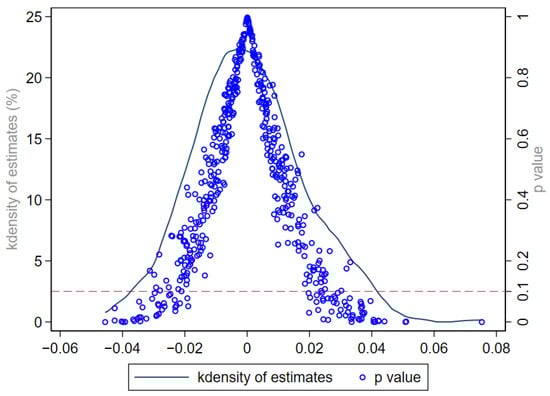
Figure 3.
Individual placebo test results. Note: The horizontal axis in the figure represents the scale for the estimated coefficient values, the left vertical axis corresponds to the scale for the kernel density estimates, and the right vertical axis indicates the range of p-values. The distribution of coefficient values in the figure approximates a normal distribution, centered around the zero axis. Notably, the coefficient value of 0.1034 lies towards the right tail of the distribution curve, exceeding the range covered by the figure.
4.1.2. Robustness Test
To enhance the robustness of the conclusions derived from the baseline regression, we conducted a series of additional tests. First, we modified the measurement method for the dependent variable, the firm’s technological complexity, by using Complex2 and Complex3, and re-estimated the regressions. The results, shown in Columns (1) and (2) of Table 4, indicate that the coefficient of the key explanatory variable, Integ, remains positive and statistically significant. Second, to rule out the potential influence of other contemporaneous variables on the dependent variable, we lagged all control variables by one period. The results, presented in Column (3) of Table 4, confirm that the conclusion remains unchanged. Third, to ensure that the firm samples are as similar as possible in terms of technological complexity and certain financial characteristics prior to the policy shock, we employed the propensity score matching (PSM) method to filter the sample before conducting the regression analysis. The results, displayed in Column (4) of Table 4, show that the coefficient of the variable Integ remains significantly positive.
Table 4.
Results of robustness tests—part A.
Fourth, we substituted the company’s sample database with data from industrial enterprises and re-conducted the regression analysis. This necessitated recalculating the technological complexity at the level of industrial enterprises. During this process, due to the prevalence of errors, inconsistencies, and omissions in the Chinese names within the industrial enterprise database, manual searches of relevant online information were relied upon to assist in identification, enabling the matching of industrial enterprise data with patent data. Due to the limited availability of financial data in the industrial enterprise database, it was not possible to reconstruct all firm-level control variables used in the regression analysis based on the listed company data. To address this, we substituted the missing variables with approximate ones, ensuring as much consistency as possible in the control variables across the regression analyses conducted with the two datasets. Additionally, due to constraints in data availability, the study period is limited to the years 2000 to 2014. As shown in Table 5, based on the sample data from industrial enterprises, the coefficient of the coefficients of variable Integ remains significantly positive, further confirming the role of the urban integration development strategy in enhancing the technological complexity of enterprises within urban agglomerations.
Table 5.
Results of robustness tests—part B.
4.2. Mechanism Test
In this section, we seek to further investigate the specific pathways through which the strategy of urban integration influences the technological complexity of enterprises within metropolitan areas. After multiple trials, we ultimately identified three key pathways: financial concentration, collaborative agglomeration, and firm specialization. In the process of validating the mechanisms, two methods were employed to enhance the robustness of the conclusions. The first method involves the “X-M-Y” mediation test (Di Giuli & Laux, 2022) [50], while the second method utilizes regression analysis based on mediation variable grouping.
4.2.1. Mechanism of Financial Concentration
Table 6 presents the results of the financial concentration mechanism test. Columns (1) to (3) correspond to the results of the first testing method. Specifically, the results in Column (2) show that the quantitative indicator of urban integration (Integ) has a significant positive effect on the financial concentration index of the urban agglomeration (FCI). Considering that a region’s financial development level can significantly impact its ability to attract financial concentration, we have included the financial development level (FD) as an additional control variable in the regional controls to isolate its effect on the results presented in Column (2). The financial development level in a city is measured by the ratio of the balance of deposits and loans in financial institutions to the city’s GDP. The results reported in Column (1) are those obtained by adding the control for the financial development level to the baseline regression, serving as a benchmark for comparison. The results in Column (3) are based on the regression in Column (1), with the addition of the FCI indicator. The findings indicate that after including the financial concentration indicator, the coefficient of the core variable, Integ, remains significantly positive, but its magnitude has notably decreased. This result confirms that the degree of financial concentration serves as an intermediary channel through which the urban integration strategy influences the technological complexity of firms within city clusters.
Table 6.
Results of the mechanism of financial concentration.
Furthermore, to validate this conclusion, we calculate the average financial concentration level for each city in the sample and divided the cities into two groups based on the median financial concentration level: high financial concentration (high FCI) and low financial concentration (low FCI). Regression analyses are then performed for each group separately. The results show that the urban integration strategy significantly promotes the technological complexity of firms only in regions with a higher level of financial concentration. No such effect is observed in the low financial concentration group. Thus, the results shown in Columns (4) and (5) of Table 6 indirectly confirm the mediating role of financial concentration.
4.2.2. Mechanism of Collaborative Agglomeration
Table 7 presents the results of testing the collaborative agglomeration mechanism. Columns (1) to (3) show the results based on the stepwise mediation mechanism test, while Columns (4) and (5) report the results from the subgroup regression analysis. Due to limitations in the availability of employment data at the prefecture-level city, indicators for the degree of collaborative agglomeration between manufacturing and producer services at the city level (Collagg) are only accessible from 2003 onward. Consequently, the regression analysis in this section is confined to the period from 2003 to 2015. The results in Column (2) indicate that the urban integration strategy significantly promotes the degree of collaborative agglomeration among cities within the region. Given the potential impact of regional industrial structure on the degree of collaborative agglomeration, we additionally control for the share of secondary industry value-added (Second) and the share of tertiary industry value-added (Third) in the regression. Column (1) presents the results of the baseline regression after including the variables Second and Third, serving as a benchmark for comparison. Column (3) reports the results of the regression in Column (1) after adding the Collagg variable. The results indicate that, after incorporating the collaborative agglomeration indicator, the coefficient for Integ remains significant, but both its significance level and coefficient value have decreased. These findings suggest that the urban integration strategy promotes firms’ technological complexity by enhancing the degree of industrial collaborative agglomeration within urban clusters.
Table 7.
Results of the mechanism of collaborative agglomeration.
To validate this conclusion, we grouped the cities based on their level of industrial collaborative agglomeration and conducted subgroup regressions. Specifically, for each city sample, we calculated the average value of its Collagg index value across all periods. Then, using the median of the collaborative agglomeration levels from all city samples, we divided the cities into two groups: the high Collagg group and the low Collagg group. Separate regressions were performed for each group. The results, presented in Columns (4) and (5) of Table 7, show that the coefficient of Integ is positive and statistically significant only in the high agglomeration group.
4.2.3. Mechanism of Corporate Specialization
Table 8 presents the results of testing the mechanism underlying the level of corporate specialization. Due to data availability constraints, only relevant data from 2003 onward could be obtained for calculating the level of corporate specialization (Spec). As a result, the regression analysis in this section is limited to the period from 2003 to 2015. Similarly to the preceding text, Columns (1) to (3) present the results of the mediation mechanism tests based on stepwise regression, while Columns (4) and (5) report the outcomes derived from the group-based regression analysis. To control the influence of other potential variables, we included two additional factors in the regression model of Column (2): the proportion of R&D personnel (RDP) in firms and the level of urbanization (Urban) in cities. Column (1) presents the results from the baseline regression that incorporates these two variables, serving as the reference for comparison. The results in Column (2) confirm that the strategy of urban agglomeration enhances the specialization of firms within the city cluster. Column (3) presents the regression results after incorporating the firm specialization indicator Spec into the regression from Column (1). The results show that after including Spec, the coefficient of the Spec variable is positive and statistically significant, whereas the significance of the core variable Integ diminishes. These results confirm that the strategy of urban agglomeration enhances firms’ specialization, thereby increasing their technological complexity. To further test this conclusion, we divide the sample firms into two groups based on the median specialization level: a high specialization group (high Spec) and a low specialization group (low Spec). Regression analyses are then conducted separately for each group. The results, presented in Columns (4) and (5) of Table 8, show that the urban agglomeration strategy significantly enhances the technological complexity of firms only in the high specialization group.
Table 8.
Results of the mechanism of corporate specialization.
4.3. Further Exploration
Building on the main results, we conduct further extended analyses. First, we modify the experimental design by restricting the sample to urban clusters that have implemented the urban integration strategy. Within these agglomerations, we redefine the “core cities” as the treatment group and the “non-core cities” as the control group and subsequently re-estimate the regression analysis. In this context, “core cities” refer to cities within an urban agglomeration that are relatively more economically developed or serve as transportation hubs. These cities are typically provincial capitals or special economic zones. For example, in the two urban agglomerations in Fujian Province, namely “Fuzhou–Putian–Ningde” and “Xiamen–Zhangzhou–Quanzhou,” Fuzhou, as the provincial capital, has a larger economic scale compared to Putian and Ningde, playing a pivotal role in driving and radiating development across the region. Xiamen, as a special economic zone, may not necessarily surpass the other two cities in terms of economic scale, but it serves as a key transportation hub within its urban agglomeration. As shown in Column (1) of Table 9, the coefficient of the interaction term between the quantitative indicator of urban integration strategy and the core city dummy variable, Integ × Core_city, is significantly positive. This indicates that, after the implementation of the urban integration strategy, the increase in the technological complexity of enterprises in core cities is greater than that of enterprises in non-core cities.
Table 9.
Results of further exploration—part A.
Second, we examine the moderating effect of the degree of industrial specialization in cities on the main findings of this study. Following the approach of Cheng and Huang (2005) [51] and Zhang et al. (2019) [52], we use the Krugman specialization index (Krugman, 1992) [53] to measure the level of industrial specialization in cities (Urban_Spec). This index then interacts with the urban integration indicator (Integ) and is included in the main regression analysis. The results, as shown in Column (2) of Table 9, indicate that the coefficient of Integ remains significantly positive, while the coefficient of the Integ × Urban_Spec interaction term is significantly negative at the 1% level. This result suggests that if a city initially exhibits a higher level of industrial specialization, the degree of specialization among firms within its jurisdiction is likely to be similarly high, thereby diminishing the positive effect of urban integration strategies on the firms’ technological complexity. It also indirectly reaffirms the “mechanism of firm specialization” proposed in Section 4.2.3 of this paper.
Third, we further investigate the moderating effect of the level of financial development in cities on the main conclusions of this study. In this context, the variable FD is employed to measure the financial development level of prefecture-level cities. It is then multiplied by Integ and included in the main regression model. As indicated in column (3) of Table 9, the coefficient for Integ remains significantly positive, while the coefficient for the interaction term Integ × FD is significantly negative. This implies that when a city already has a high degree of financial development, the impact of the urban integration strategy on the technological complexity of local firms is weakened. This finding further supports the “financial concentration mechanism” discussed in Section 4.2.1 of this paper.
Furthermore, we investigate the heterogeneous effects of certain key firm characteristics on the primary conclusions of this study. First, we focus on the characteristics of firms’ financial constraints. We use the KZ index (Kaplan & Zingales, 1997) to measure the degree of financial constraints faced by firms and divide the sample into two groups based on the median: the high financial constraint group (high FC) and the low financial constraint group (low FC) [54]. As shown in Columns (1) and (2) of Table 10, the main conclusions of this study hold true only for the low financial constraint group. This suggests that when a firm faces higher financial constraints, the positive impact of the urban integration strategy on the firm’s technological complexity is diminished. Second, considering the potential impact of a firm’s intrinsic innovation capability on the main conclusions of this study, we categorize firms into groups with high innovation ability (high IA) and low innovation ability (low IA), and conduct subgroup regression analysis. Here, we quantify a firm’s innovation capability by the number of patents it has been granted and use the median of this measure to classify the sample firms. Refer to Columns (3) and (4) of Table 10 for the results, which show that the conclusions of this study are more pronounced only within the sample of firms with high innovation capability. This suggests that when a firm possesses strong intrinsic innovation capability, the positive impact of the urban integration strategy on the technological complexity of firms within the region is amplified.
Table 10.
Results of further exploration—part B.
5. Discussion
5.1. Urban Agglomeration Integration and Enterprise Innovation Quality
The integrated development of city clusters, by overcoming administrative boundaries, facilitates resource flow and complementarities among cities. This process strengthens regional industrial advantages and promotes the optimization of industrial chains. Furthermore, enterprises within the urban agglomerations that implement urban integration strategy can access a broader range of economic and financial resources, along with enhanced industrial support services. As a result, these enterprises may be better positioned to focus more on the R&D of their core business. Technological innovation in enterprises requires a favorable and stable external environment [55]. When the industrial chain is refined and resource constraints are alleviated, conditions become more favorable for enterprises to achieve higher-quality R&D outcomes. Based on the empirical results in Section 4.1, we find that urban agglomeration integration has indeed significantly improved the innovation quality of enterprises.
5.2. The Mechanistic Pathways of Urban Agglomeration Integration and Enterprise Innovation Quality
The urban integration strategy, focusing on industrial collaboration and the merging of residential living areas, inevitably entails developing industrial parks and implementing transportation infrastructure projects. These initiatives raise the financial demands on cities in the region. Moreover, the coordinated growth between cities promotes the unification of regional markets, generating more opportunities and heightening enterprises’ financing needs. These factors collectively drive the concentration of financial resources. Compared to other economic resources like fixed assets, equipment, and talent, financial resources are distinguished by their higher liquidity, allowing them to rapidly concentrate within urban clusters in the short term. Furthermore, as regional financial resources become concentrated, enterprises’ financial accessibility improves to some extent, thereby easing constraints on their cash flow [56]. Research has indicated that when a company’s financial cash flow increases, its investment in R&D also rises [57], which in turn promotes greater innovation outcomes and improves quality. Based on the results in Section 4.2.1, our reasoning is confirmed: the concentration of financial resources indeed serves as a mediating mechanism in the relationship between urban agglomeration integration and enterprise innovation quality.
The implementation of an urban integration development strategy between cities facilitates the planning of industrial layouts within a broader regional framework [58]. This, in turn, encourages the clustering of enterprises in related industries, generating synergistic development effects. Furthermore, the optimization of industrial layout, manifested in the collaborative agglomeration of the production services and manufacturing sectors, will provide local enterprises with better production support services and a more conducive business environment. Naturally, enterprises will be better positioned to focus on their production operations and R&D. In this context, the technological complexity of these enterprises increases correspondingly. Based on the results in Section 4.2.2, the mediating role of collaborative agglomeration is validated.
Under urban integration strategies, industrial collaboration within urban agglomerations is expected to become increasingly cohesive. Each city capitalizes on its distinct industrial strengths, fostering complementary advantages that enhance synergy between cities. This, in turn, promotes a more distinct and efficient division of labor across industries within the agglomeration. Consequently, this clearer inter-industry division of labor further facilitates a more defined and efficient distribution of responsibilities among enterprises within their respective industrial chains. In addition, the coordinated development of city clusters plays a pivotal role in dismantling the regional market protectionism that previously segmented individual cities [59]. This process, combined with the continuous improvement of transportation infrastructure within the urban agglomeration, enables businesses to significantly expand their market reach and operational scope. Meanwhile, policy coordination and harmonization among municipal governments will help alleviate regional administrative barriers and institutional obstacles, thereby substantially reducing government intervention and rent-seeking behavior. As a result, transaction costs for enterprises operating within the city cluster will be significantly lowered.
The transaction cost theory posits that a firm’s degree of specialization is determined by the balance between internal control costs and external transaction costs [60]. A clearer division of labor within the industrial chain enhances the firm’s operational model, thereby reducing internal control costs. Likewise, a decline in regional market segmentation and government intervention lowers external transaction costs. Both factors contribute to the firm’s advancement in specialization. Therefore, as firms place greater emphasis on enhancing their specialization, they are likely to devote more resources and effort to R&D within their core business domains. Such a strategic shift is expected to lead to corresponding improvements in both the quantity and quality of innovation within the enterprises [61]. Based on the empirical results in Section 4.2.3, we can ascertain that urban agglomeration integration partially influences the innovation quality of local enterprises by enhancing their specialization level.
5.3. Heterogeneity Analysis of the Main Finding
Grounded in certain relevant characteristics of the sample, the main conclusions of this study also exhibit heterogeneity. From the perspective of regional characteristics within the sample, core cities within an urban agglomeration, owing to their status as economic centers, tend to exert a certain degree of resource siphoning effect on surrounding cities [62]. Compared to peripheral cities, core cities hold relative advantages in terms of financial resource concentration and the agglomeration of producer services. Consequently, the main finding of this study—that urban agglomeration integration enhances enterprise innovation quality—is expected to be more pronounced in core cities. The results in Column (1) of Table 9 confirm this hypothesis. Secondly, if a region develops one or more relatively complete industrial chains, leading to a higher degree of industrial specialization, this will, in turn, foster a relatively stable operating environment for enterprises along the supply chain. As firms focus on their respective roles within the chain, they are better positioned to enhance their own specialization. Therefore, according to the mediation mechanism of enterprise specialization discussed in Section 4.2.3, the core finding of this study is more pronounced in regions with a higher degree of industrial specialization. The results in Column (2) of Table 9 confirm this logic. Thirdly, regions with higher levels of financial development tend to exhibit a greater concentration of financial resources. Therefore, according to the “financial concentration mechanism” discussed in Section 4.2.1, the core relationship of this study is more pronounced in regions with higher levels of financial development. The results in Column (3) of Table 9 provide empirical support for this hypothesis.
From the perspective of the characteristics of the companies within the sample we examine how two features—financial constraints and innovation capabilities—affect the heterogeneity of the study’s conclusions. First, firms with higher financing constraints have fewer funds available for R&D investment, which, in turn, lowers the likelihood of achieving high innovation quality. Under such cases, the impact of urban integration development on firms’ innovation quality is also diminished. Second, if a company already possesses strong R&D capabilities, the various advantages brought by urban integration development will have a more pronounced effect on the firm. Consequently, for such companies, we would expect to observe more significant improvements in innovation quality. The results in Table 10 empirically validate these two perspectives.
6. Conclusions
The findings of this study highlight the significant role of urban integration development strategies in fostering enterprise innovation capabilities. While previous research has predominantly examined the macro-level societal and economic impacts of coordinated development of urban agglomerations, this study uniquely shifts the focus to the micro-level, exploring how these strategies shape firm behavior and innovation outcomes. By leveraging enterprise technological complexity as a research entry point, we employ urban integration strategies across various city clusters in China as a natural experimental setting to assess their influence on the quality of enterprise innovation.
Empirical analysis confirms that urban integration development strategies have significantly contributed to the enhancement of enterprise technological complexity within city clusters. This conclusion is supported by a series of robustness checks. Mechanism tests indicate that urban integration strategies enhance the technological complexity of enterprises by fostering increased regional financial agglomeration, optimizing industrial layout through industrial collaborative agglomeration, and elevating the level of enterprise specialization. These findings suggest that intercity collaborative development fosters greater resource agglomeration, more efficient industrial layouts, and improved industrial support services. These factors collectively contribute to a relatively stable external environment, enabling enterprises to focus more intensively on R&D within their specific domains.
In our extended analysis, we find that the main conclusions of this study are even more pronounced in samples drawn from core cities, cities with lower levels of industrial specialization, or those with higher degrees of financial development. Additionally, the effects are more evident among enterprises facing lower financial constraints or demonstrating stronger innovation capabilities. These findings further corroborate the mediating role of the mechanism channels identified in this study. Besides enriching the research in the relevant academic fields, this study also offers valuable insights for local governments in crafting policy frameworks aimed at cultivating enterprises’ sustainable innovation capabilities within their jurisdictions. Notably, small and micro enterprises in emerging high-tech industries often grapple with substantial resource constraints. Consequently, in their pursuit of government subsidies, they may resort to assembling low-value, low-technological-content patents. In this context, the advancement of integration development within urban agglomerations, characterized by enhanced resource concentration and improved industrial synergy, is expected to play a significant role in elevating the quality of their innovation. Admittedly, this study has certain limitations, primarily due to the lack of availability of some data and indicators. This deficiency hinders the thoroughness and comprehensiveness of the empirical research, preventing a more detailed exploration of the channels through which policy impacts operate. It is hoped that this study will serve as a catalyst, offering some inspiration for future research in related fields.
Author Contributions
Conceptualization, Z.L.; methodology, Z.L.; software, Z.L.; resources, Y.L.; writing—original draft preparation, Z.L.; writing—review and editing, Z.L. and Y.L. All authors have read and agreed to the published version of the manuscript.
Funding
This research received no external funding.
Institutional Review Board Statement
Not applicable.
Informed Consent Statement
Not applicable.
Data Availability Statement
The datasets analyzed in this study are available from the corresponding author upon reasonable request.
Acknowledgments
The authors express gratitude to the anonymous reviewers for their valuable feedback.
Conflicts of Interest
The authors declare no conflicts of interest.
References
- Fu, J.; Yu, X.; Xu, Q. Standard Radiation: A New Perspective Leading the Coordinated Development of Urban Agglomerations. Sustainability 2023, 15, 1282. [Google Scholar] [CrossRef]
- Huang, Y.; Li, L.; Yu, Y. Does Urban Cluster Promote the Increase of Urban Eco-efficiency? Evidence from Chinese Cities. J. Clean. Prod. 2018, 197, 957–971. [Google Scholar] [CrossRef]
- Li, H.; Huang, X.; Xu, Q.; Wang, S.; Guo, W.; Liu, Y.; Huang, Y.; Wang, J. A New Approach to Evaluate the Sustainability of Ecological and Economic Systems in Megacity Clusters: A Case Study of the Guangdong–Hong Kong–Macau Bay Area. Sustainability 2023, 15, 5881. [Google Scholar] [CrossRef]
- Luo, X.; Cheng, C.; Pan, Y.; Yang, T. Coupling Coordination and Influencing Factors of Land Development Intensity and Urban Resilience of the Yangtze River Delta Urban Agglomeration. Water 2022, 14, 1083. [Google Scholar] [CrossRef]
- Liu, Y.; He, Z. Synergistic Industrial Agglomeration, New Quality Productive Forces and High-quality Development of the Manufacturing Industry. Int. Rev. Econ. Financ. 2024, 94, 103373. [Google Scholar] [CrossRef]
- Zhou, T. Analysis of the Interactive Development of Urban “Space-Industry” from the Perspective of Spatial Production and Spatial Innovation. Bus. Econ. Res. 2016, 12, 187–189. [Google Scholar]
- Fang, C. The Basic Law of the Formation and Expansion in Urban Agglomerations. J. Geogr. Sci. 2019, 29, 1699–1712. [Google Scholar] [CrossRef]
- Fu, W.; Luo, C.; He, S. Does Urban Agglomeration Promote the Development of Cities? An Empirical Analysis Based on Spatial Econometrics. Sustainability 2022, 14, 14512. [Google Scholar] [CrossRef]
- Wang, S.; Yang, C.; Hou, D.; Dai, L. How Do Urban Agglomerations Drive Economic Development? A Policy Implementation and Spatial Effects Perspective. Econ. Anal. Policy 2023, 80, 1224–1238. [Google Scholar] [CrossRef]
- Wang, S.; Wang, F. The Common Prosperity Effect of the National-level Urban Cluster–Evidence from Adjacent Countries Surrounding Provincial Borders. Inq. Econ. Issues 2024, 11, 124–144. [Google Scholar]
- Yuan, C.; Ren, S.; Han, Z.; Shang, M.; Hu, Z. Do National Urban Agglomeration Policies Reduce Regional Disparity? Evidence from Nineteen Urban Agglomerations in China. Int. J. Urban Sci. 2024, 1–35. [Google Scholar] [CrossRef]
- Hu, P.; Huang, Y.; He, Q.; Zhang, G. Can Urban Agglomeration Policies Promote Regional Economic Agglomeration? Evidence from the Yangtze River Economic Belt in China. Environ. Plan. B Urban Anal. City Sci. 2024, 23998083241293217. [Google Scholar] [CrossRef]
- Zhang, Q.; Mao, Y. Will Urban Integration Development Improve the “Agglomeration Shadow”? J. Fin. Econ. 2024, 50, 19–32. [Google Scholar]
- Liu, R.; Wang, H.; Ning, X.; Cai, X.; Zhang, X. The Impact of Coordinated Development Policy on the Spatiotemporal Changes of Industrial Structure of Beijing–Tianjin–Hebei Urban Agglomeration. Sustainability 2023, 15, 8427. [Google Scholar] [CrossRef]
- Zhang, W.; Cui, R.; Li, C.; Ge, H.; Zhang, Z.; Tang, X. Impact of Urban Agglomeration Construction on Urban Air Quality–Empirical Test Based on PSM–DID Model. Sci. Rep. 2023, 13, 15099. [Google Scholar] [CrossRef]
- Hu, R.; Xu, W.; Liu, L.; Cui, Z.; Zhao, C. The Impact of Urban Agglomerations on Carbon Emissions in China: Spatial Scope and Mechanism. J. Clean. Prod. 2023, 419, 138250. [Google Scholar] [CrossRef]
- Liao, B.; Li, L. How Can Urban Agglomeration Market Integration Promote Urban Green Development: Evidence from China’s Yangtze River Economic Belt. Environ. Sci. Pollut. Res. 2022, 29, 10649–10664. [Google Scholar] [CrossRef]
- Cao, Y.; Zhang, R.; Zhang, D.; Zhou, C. Urban Agglomerations in China: Characteristics and Influencing Factors of Population Agglomeration. Chin. Geogr. Sci. 2023, 33, 719–735. [Google Scholar] [CrossRef]
- Chkir, I.; Hassan, B.E.H.; Rjiba, H.; Saadi, S. Does Corporate Social Responsibility Influence Corporate Innovation? International Evidence. Emerg. Mark. Rev. 2021, 46, 100746. [Google Scholar] [CrossRef]
- Li, Q.; Wang, J.; Cao, G.; Zhang, J. Financial Constraints, Government Subsidies, and Corporate Innovation. PLoS ONE 2021, 16, e0259642. [Google Scholar] [CrossRef]
- Luo, Y.; Xiong, G.; Mardani, A. Environmental Information Disclosure and Corporate Innovation: The “Inverted U-shaped” Regulating Effect of Media Attention. J. Bus. Res. 2022, 146, 453–463. [Google Scholar] [CrossRef]
- Xu, E.; Zhang, H. The Impact of State Shares on Corporate Innovation Strategy and Performance in China. Asia Pac. J. Manag. 2008, 25, 473–487. [Google Scholar] [CrossRef]
- Chemmanur, T.J.; Tang, D.; Wu, C. Lonely Leadership: The Influence of Single-Child CEOs on Corporate Innovation and Culture. Rev. Financ. 2025, rfaf005. [Google Scholar] [CrossRef]
- Shen, H.; Lan, F.; Xiong, H.; Lv, J.; Jian, J. Does Top Management Team’s Academic Experience Promote Corporate Innovation? Evidence from China. Econ. Model. 2020, 89, 464–475. [Google Scholar] [CrossRef]
- Adhikari, B.K.; Agrawal, A. Religion, Gambling Attitudes and Corporate Innovation. J. Corp. Financ. 2016, 37, 229–248. [Google Scholar] [CrossRef]
- Ucar, E. Local Creative Culture and Corporate Innovation. J. Bus. Res. 2018, 91, 60–70. [Google Scholar] [CrossRef]
- Chen, Y.; Podolski, E.J.; Veeraraghavan, M. National Culture and Corporate Innovation. Pac. Basin Financ. J. 2017, 43, 173–187. [Google Scholar] [CrossRef]
- Wen, H.; Lee, C.C.; Zhou, F. How Does Fiscal Policy Uncertainty Affect Corporate Innovation Investment? Evidence from China’s New Energy Industry. Energy Econ. 2022, 105, 105767. [Google Scholar] [CrossRef]
- Cui, X.; Wang, C.; Liao, J.; Fang, Z.; Cheng, F. Economic Policy Uncertainty Exposure and Corporate Innovation Investment: Evidence from China. Pac. Basin Financ. J. 2021, 67, 101533. [Google Scholar] [CrossRef]
- Shen, H.; Hou, F. Trade Policy Uncertainty and Corporate Innovation Evidence from Chinese Listed Firms in New Energy Vehicle Industry. Energy Econ. 2021, 97, 105217. [Google Scholar] [CrossRef]
- Amore, M.D.; Schneider, C.; Žaldokas, A. Credit Supply and Corporate Innovation. J. Financ. Econ. 2013, 109, 835–855. [Google Scholar] [CrossRef]
- Tu, C.; Shi, Y. Market-Incentive Environmental Regulation and the Quality of Corporate Innovation. Sustainability 2023, 15, 5924. [Google Scholar] [CrossRef]
- Wang, S. How Does Stock Market Liberalization Influence Corporate Innovation? Evidence from Stock Connect Scheme in China. Emerg. Mark. Rev. 2021, 47, 100762. [Google Scholar] [CrossRef]
- Gordon, E.A.; Hsu, H.T.; Huang, H. Peer R&D Disclosure and Corporate Innovation: Evidence from American Depositary Receipt Firms. Adv. Account. 2020, 49, 100471. [Google Scholar]
- Xu, R.; He, C.; Li, Y.; Kong, L. Peer Effects of Corporate Green Innovation: Evidence from China’s Listed Firms. Fin. Res. Lett. 2024, 61, 105025. [Google Scholar] [CrossRef]
- Zhang, J.; Zheng, W. Has Catch-up Strategy of Innovation Inhibited the Quality of China’s Patents? Econ. Res. J. 2018, 53, 28–41. [Google Scholar]
- Li, H.; Wang, Y.; Wu, D. Research on Patent Quality’s Impact Mechanism on the Competitiveness of Enterprises for Export: The Exploration from Perspective of Knowledge Width. World Econ. Stud. 2021, 1, 32–46+134. [Google Scholar]
- Zhao, S.; Guo, N.; Li, C.; Smith, C. Megacities, the World’s Largest Cities Unleashed: Major Trends and Dynamics in Contemporary Global Urban Development. World Dev. 2017, 98, 257–289. [Google Scholar] [CrossRef]
- Wang, R.; Wang, Z.; Liang, Q.; Chen, J. Financial Agglomeration and Urban Hierarchy. Econ. Res. J. 2019, 54, 165–179. [Google Scholar]
- Cai, Q.; Shu, S. Financial Development Empowers the Cultivation and Innovation of “Little Giant” Enterprises: From Financial Agglomeration to Fintech. Financ. Trade Econ. 2024, 45, 72–88. [Google Scholar]
- Deng, K.; Kuang, P. Urban Agglomeration Policy and Urban Commercial Banks’ Liquidity Creation: Dual Perspectives Based on Agglomeration Effect and Market Integration Effect. Financ. Trade Res. 2024, 35, 17–34. [Google Scholar]
- Helsley, R.W.; Strange, W.C. Coagglomeration, Clusters, and the Scale and Composition of Cities. J. Political Econ. 2014, 122, 1064–1093. [Google Scholar] [CrossRef]
- Zhuang, R.; Mi, K.; Feng, Z. Industrial Co-agglomeration and Air Pollution Reduction: An Empirical Evidence Based on Provincial Panel Fata. Int. J. Environ. Res. Public Health 2021, 18, 12097. [Google Scholar] [CrossRef]
- Ellison, G.; Glaeser, E.L.; Kerr, W.R. What Causes Industry Agglomeration? Evidence from Coagglomeration Patterns. Am. Econ. Rev. 2010, 100, 1195–1213. [Google Scholar] [CrossRef]
- Yang, Z.; Song, T.; Chahine, T. Spatial Representations and Policy Implications of Industrial Co-agglomerations, A Case Study of Beijing. Habitat Int. 2016, 55, 32–45. [Google Scholar] [CrossRef]
- Zheng, H.; He, Y. How Does Industrial Co-agglomeration Affect High-quality Economic Development? Evidence from Chengdu-Chongqing Economic Circle in China. J. Clean. Prod. 2022, 371, 133485. [Google Scholar] [CrossRef]
- Buzzell, R.D. Is Vertical Integration Profitable? Harv. Bus. Rev. 1983, 61, 92–102. [Google Scholar]
- Fan, Z.; Peng, F. The Effects of “Business Tax Replaced with VAT Reform” on Firms’ Tax Cuts and Industrial Division Based on the Perspective of Industrial Interconnection. Econ. Res. J. 2017, 52, 82–95. [Google Scholar]
- Yuan, C.; Xiao, T.; Geng, C.; Sheng, Y. Digital Transformation and Division of Labor between Enterprises: Vertical Specialization or Certical Integration. China Ind. Econ. 2021, 9, 137–155. [Google Scholar]
- Di Giuli, A.; Laux, P.A. The Effect of Media-linked Directors on Financing and External Governance. J. Financ. Econ. 2022, 145, 103–131. [Google Scholar] [CrossRef]
- Cheng, D.; Huang, W. The Location and Regional Specialization of Service Industry in China. Financ. &Trade Econ. 2005, 7, 73–81. [Google Scholar]
- Zhang, W.; Wu, Q.; Wang, B.; Huang, J. Multidimensional Study of Specialized Agglomeration and Diversified Agglomeration on Urban Land Use Efficiency. China Popul. Resour. Environ. 2019, 29, 100–110. [Google Scholar]
- Krugman, P. Geography and Trade; MIT press: Cambridge, MA, USA, 1992. [Google Scholar]
- Kaplan, S.N.; Zingales, L. Do Investment-cash Flow Sensitivities Provide Useful Measures of Financing Constraints? Q. J. Econ. 1997, 112, 169–215. [Google Scholar] [CrossRef]
- Xu, W.; Liu, C. External Environment Uncertainty, Key Resources Acquisition, and Corporate Technological Innovation. Manag. Decis Econ. 2024, 45, 4–18. [Google Scholar] [CrossRef]
- Cao-Alvira, J.J.; Gomez-Gonzalez, J.E. On Regional Bank Concentration and Firm Leverage: The Case of Colombia. Emerg. Mark. Finance Trade 2025, 61, 80–93. [Google Scholar] [CrossRef]
- Cui, D.; Cheng, L.; You, J. Financing Constraints and Patent Investment in Small and Medium-sized Enterprises: A Family Entrepreneurial Perspective. Financ. Res. Lett 2024, 63, 105318. [Google Scholar] [CrossRef]
- Li, H.; Wang, L. Research on the Influence of Urban Agglomeration Development Planning on the Flow and Efficient Agglomeration of Elements. Economist 2020, 12, 52–61. [Google Scholar]
- Wang, Y.; Zhang, H.; He, X.; Li, R. Can Urban Agglomeration Policy Promote Enterprise Specialization? Evidence from Chinese Listed Companies. J. Financ. Rcon. 2023, 49, 19–33. [Google Scholar]
- Williamson, O.E. The Economic Institutions of Capitalism; Free Press: New York, NY, USA, 1985. [Google Scholar]
- Corts, K.S. Focused Firms and the Incentive to Innovate. J. Econ. Manag. Strat. 2000, 9, 339–362. [Google Scholar] [CrossRef]
- Zhou, L.; Tian, L.; Gao, Y.; Ling, Y.; Fan, C.; Hou, D.; Shen, T.; Zhou, W. How Did Industrial Land Supply Respond to Transitions in State Strategy? An Analysis of Prefecture-level Cities in China from 2007 to 2016. Land Use Policy 2019, 87, 104009. [Google Scholar] [CrossRef]
Disclaimer/Publisher’s Note: The statements, opinions and data contained in all publications are solely those of the individual author(s) and contributor(s) and not of MDPI and/or the editor(s). MDPI and/or the editor(s) disclaim responsibility for any injury to people or property resulting from any ideas, methods, instructions or products referred to in the content. |
© 2025 by the authors. Licensee MDPI, Basel, Switzerland. This article is an open access article distributed under the terms and conditions of the Creative Commons Attribution (CC BY) license (https://creativecommons.org/licenses/by/4.0/).