
Leveraging Environmental Regulation: How Green Innovation Moderates the Relationship Between Carbon Information Disclosure and Firm Value


Abstract
1. Introduction
2. Literature Review and Hypotheses Development
2.1. Carbon Information Disclosure and Firm Value
2.2. The Moderating Effect of Green Innovation on the Relationship Between Carbon Information Disclosure and Firm Value
2.3. The Moderating Moderated Effect of Environmental Regulation to Green Innovation on the Relationship Between Carbon Information Disclosure and Firm Value
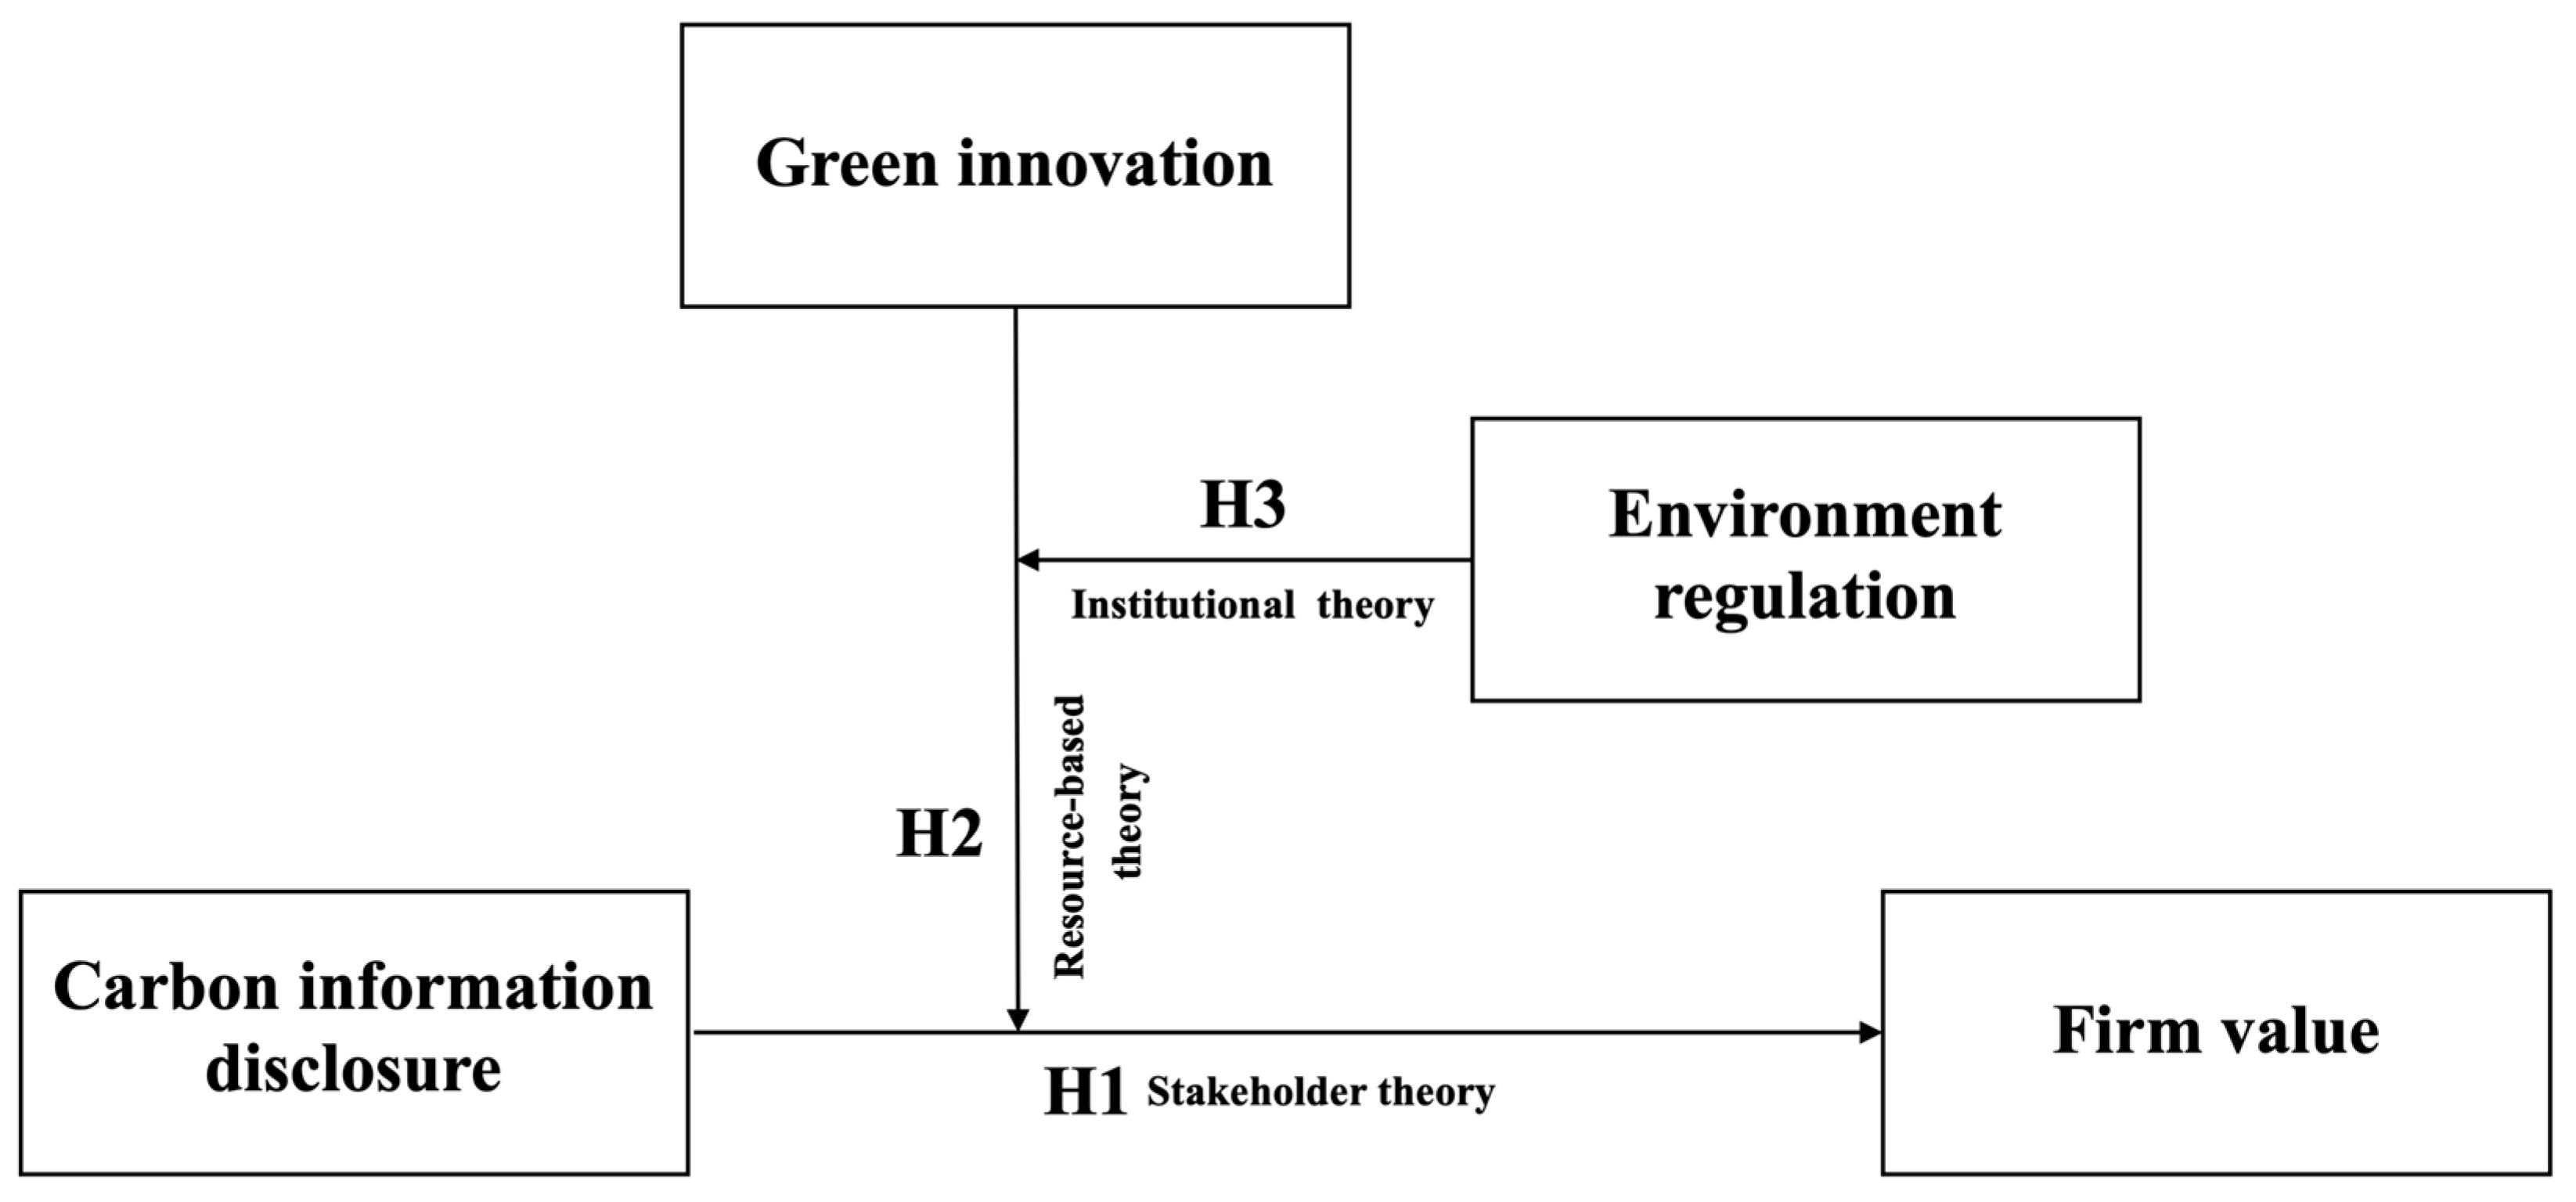
3. Conceptual Framework and Methodology
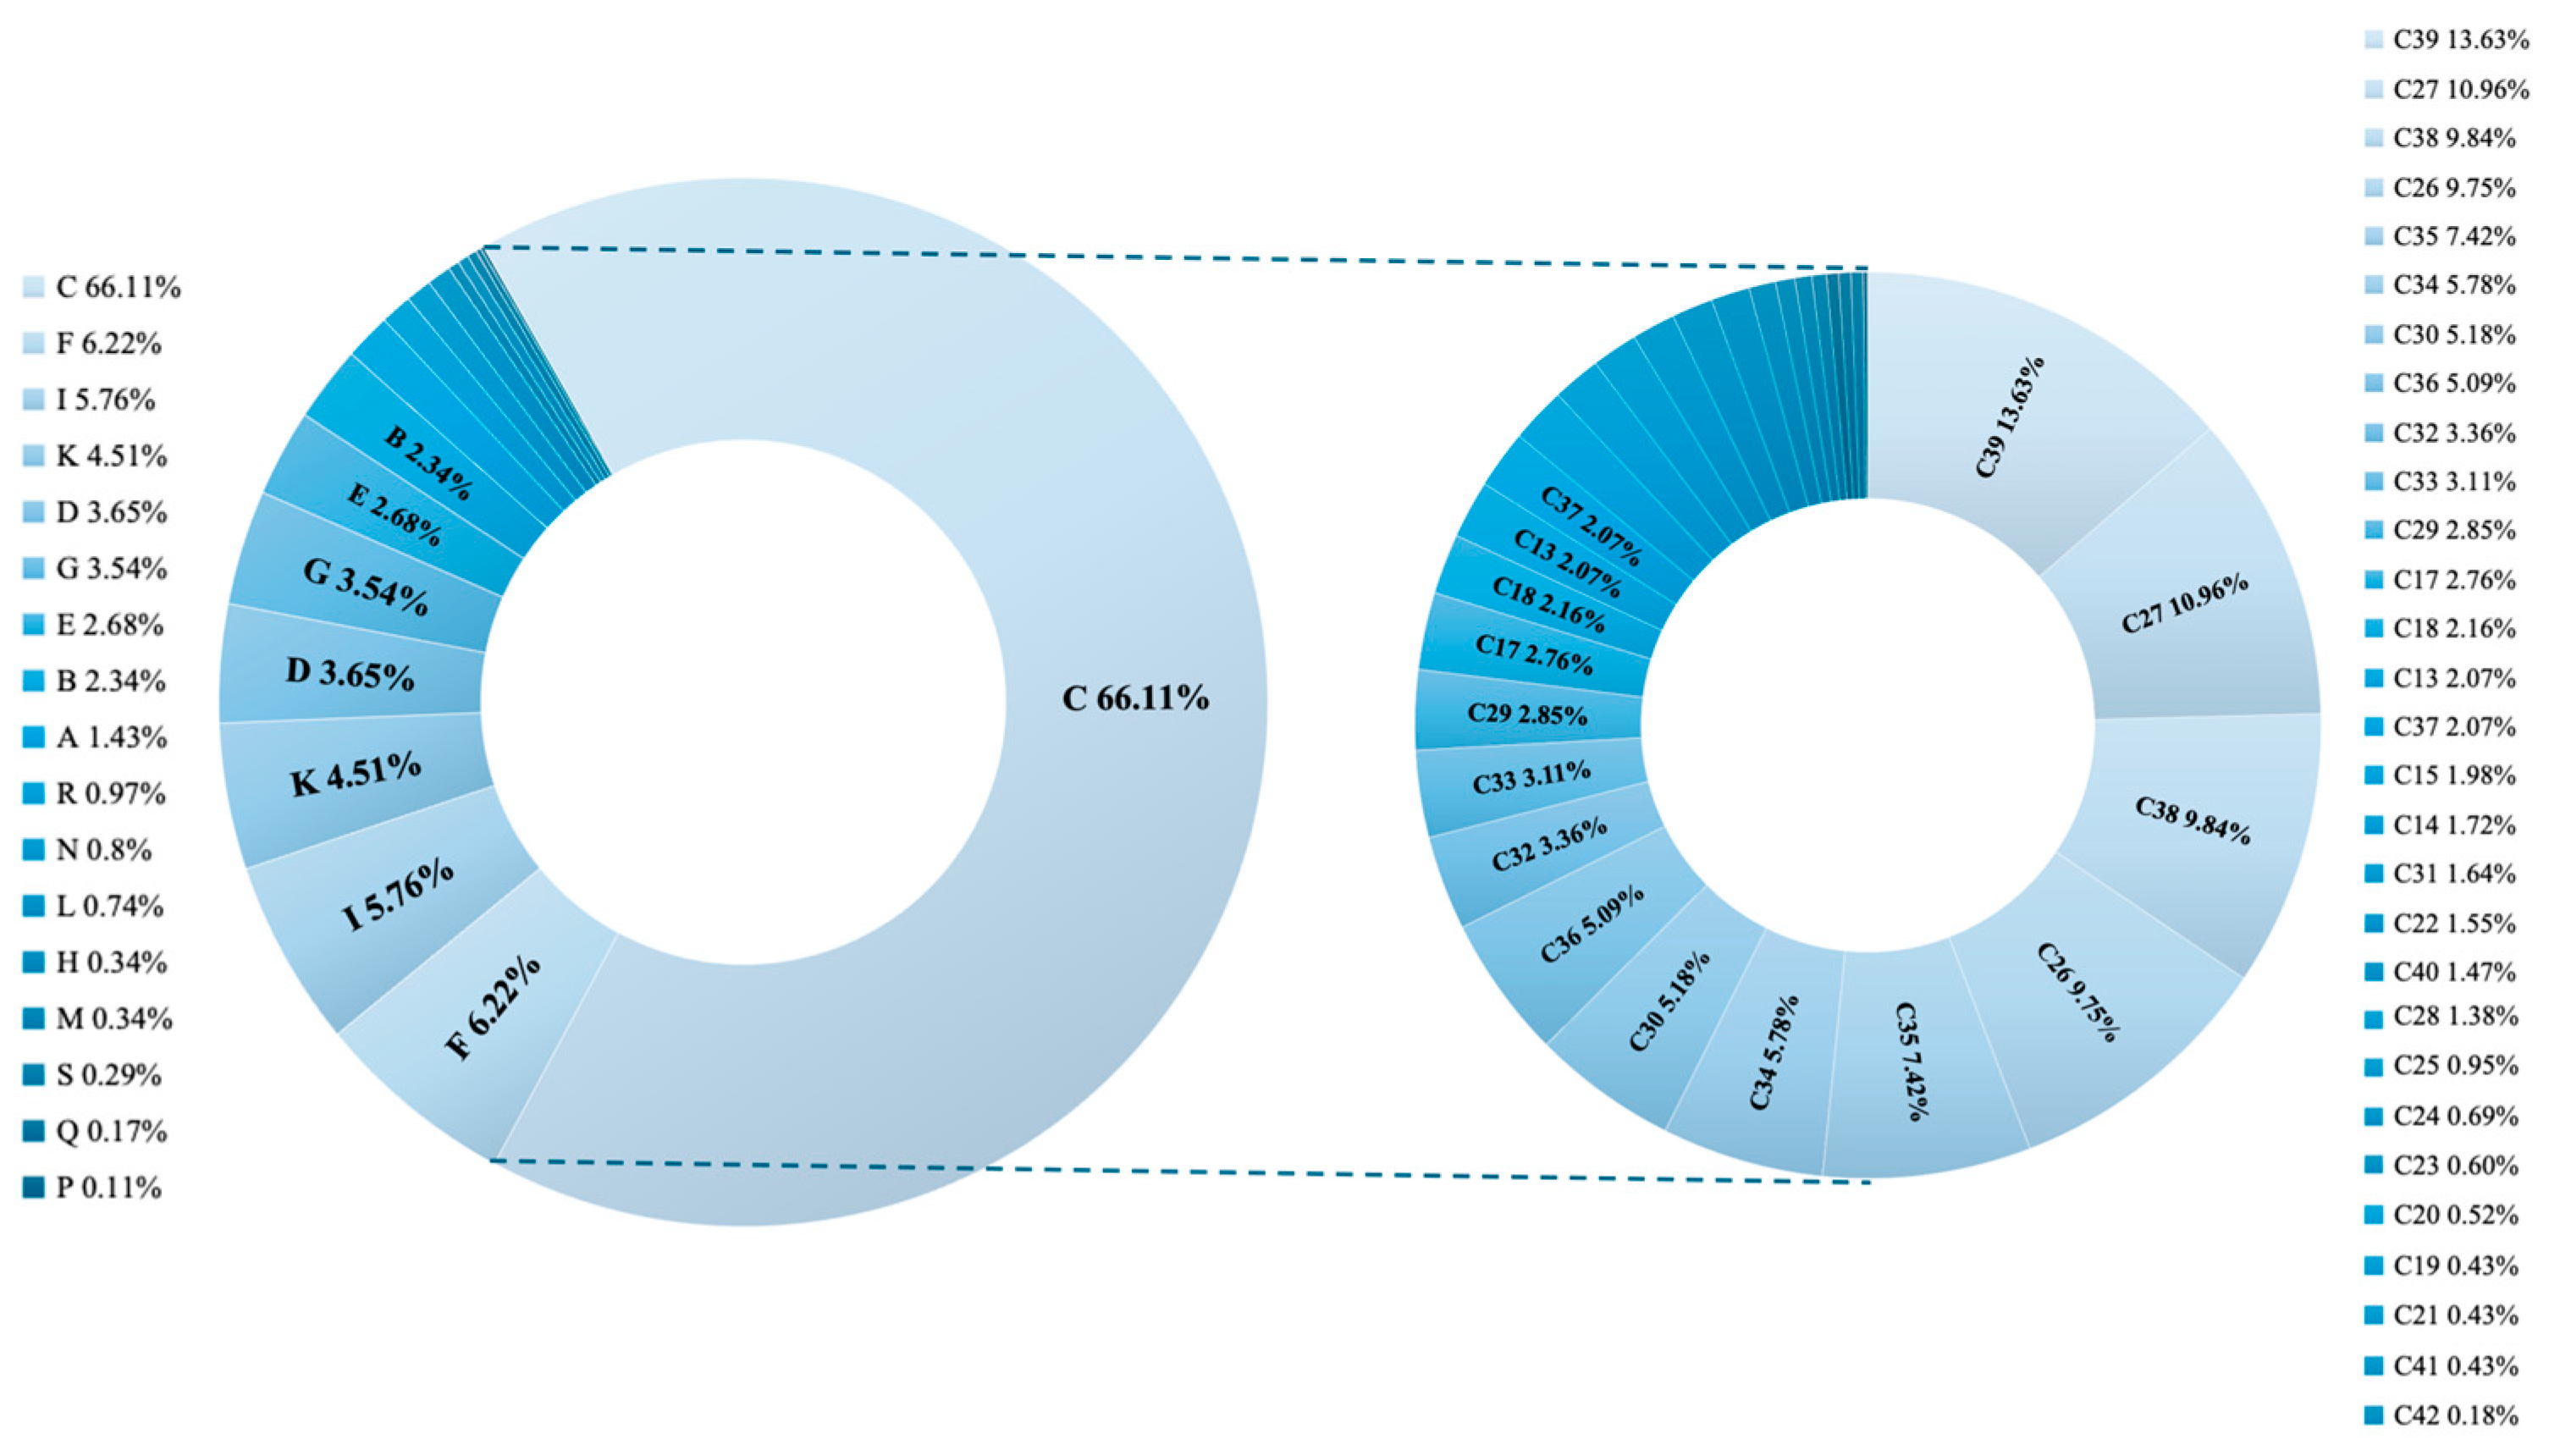
3.1. Data and Sample
3.2. Variables
4. Results
4.1. Descriptive Statistics
4.2. Correlation Analysis and Multicollinearity Test
4.3. F Test, LM Test, and Hausman Test
4.4. Base Regression Analysis
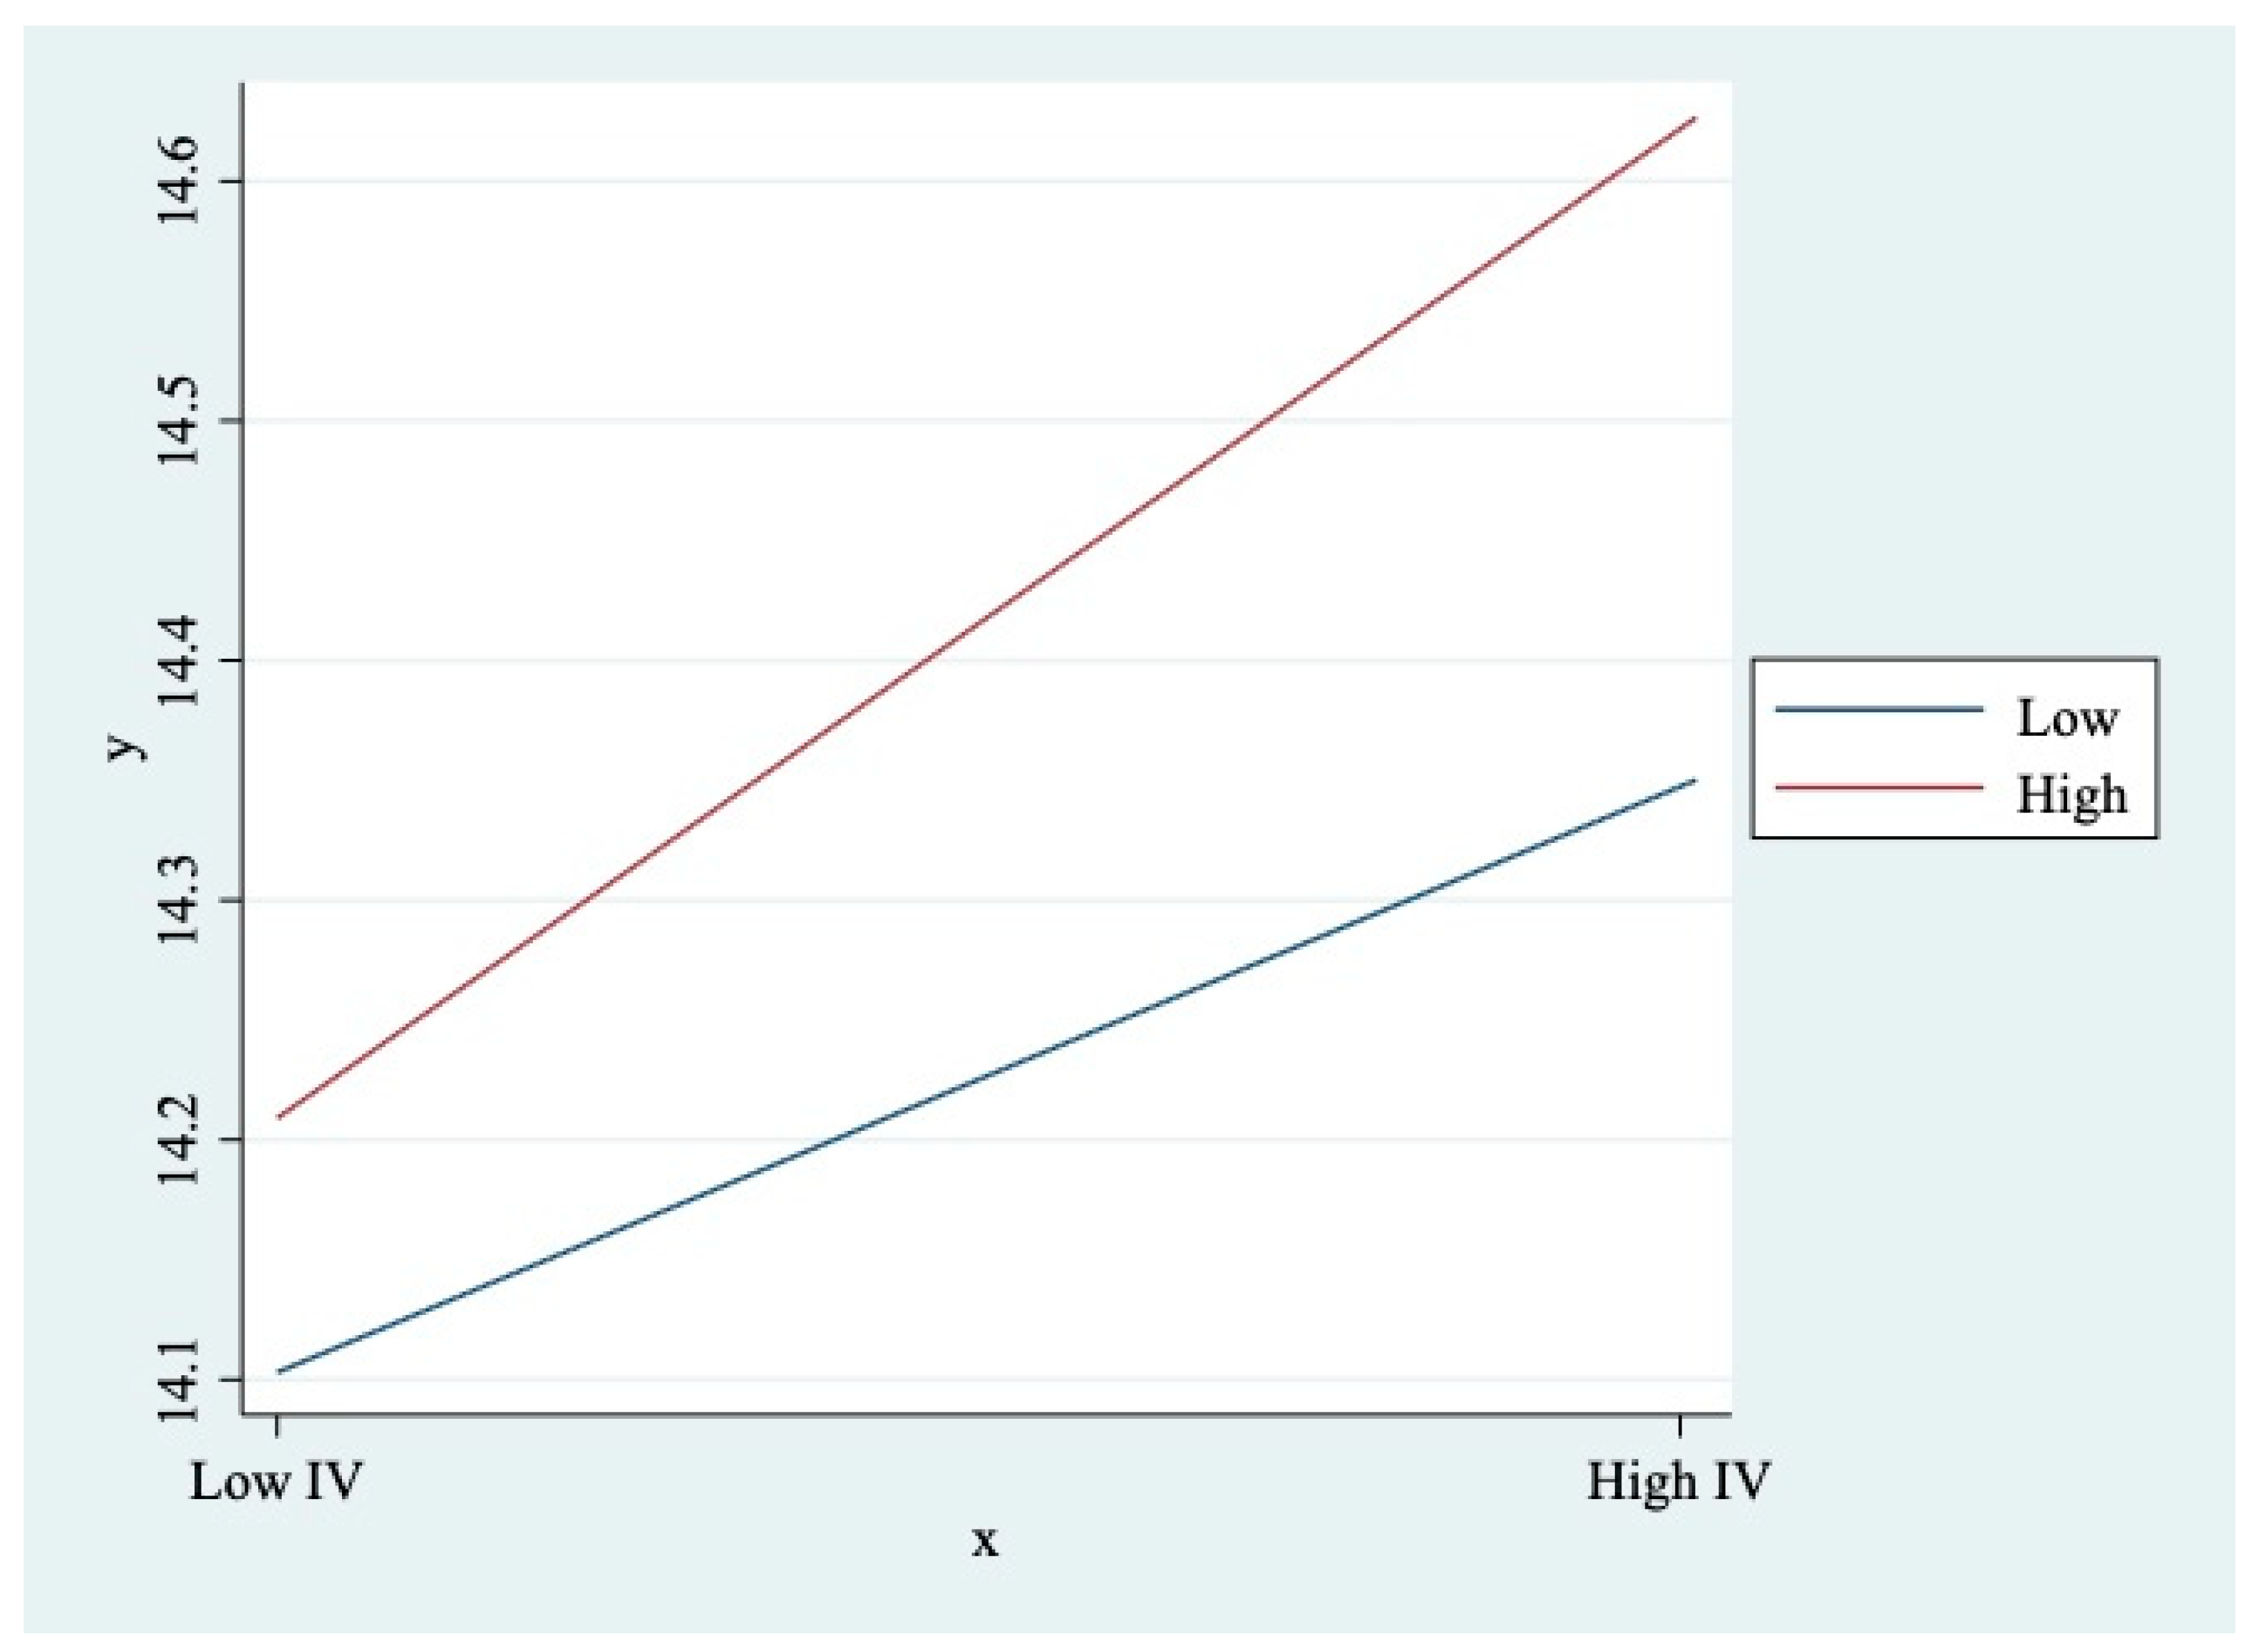
4.5. The Moderating Effect of Green Innovation on the Relationship Between Carbon Information Disclosure and Firm Value
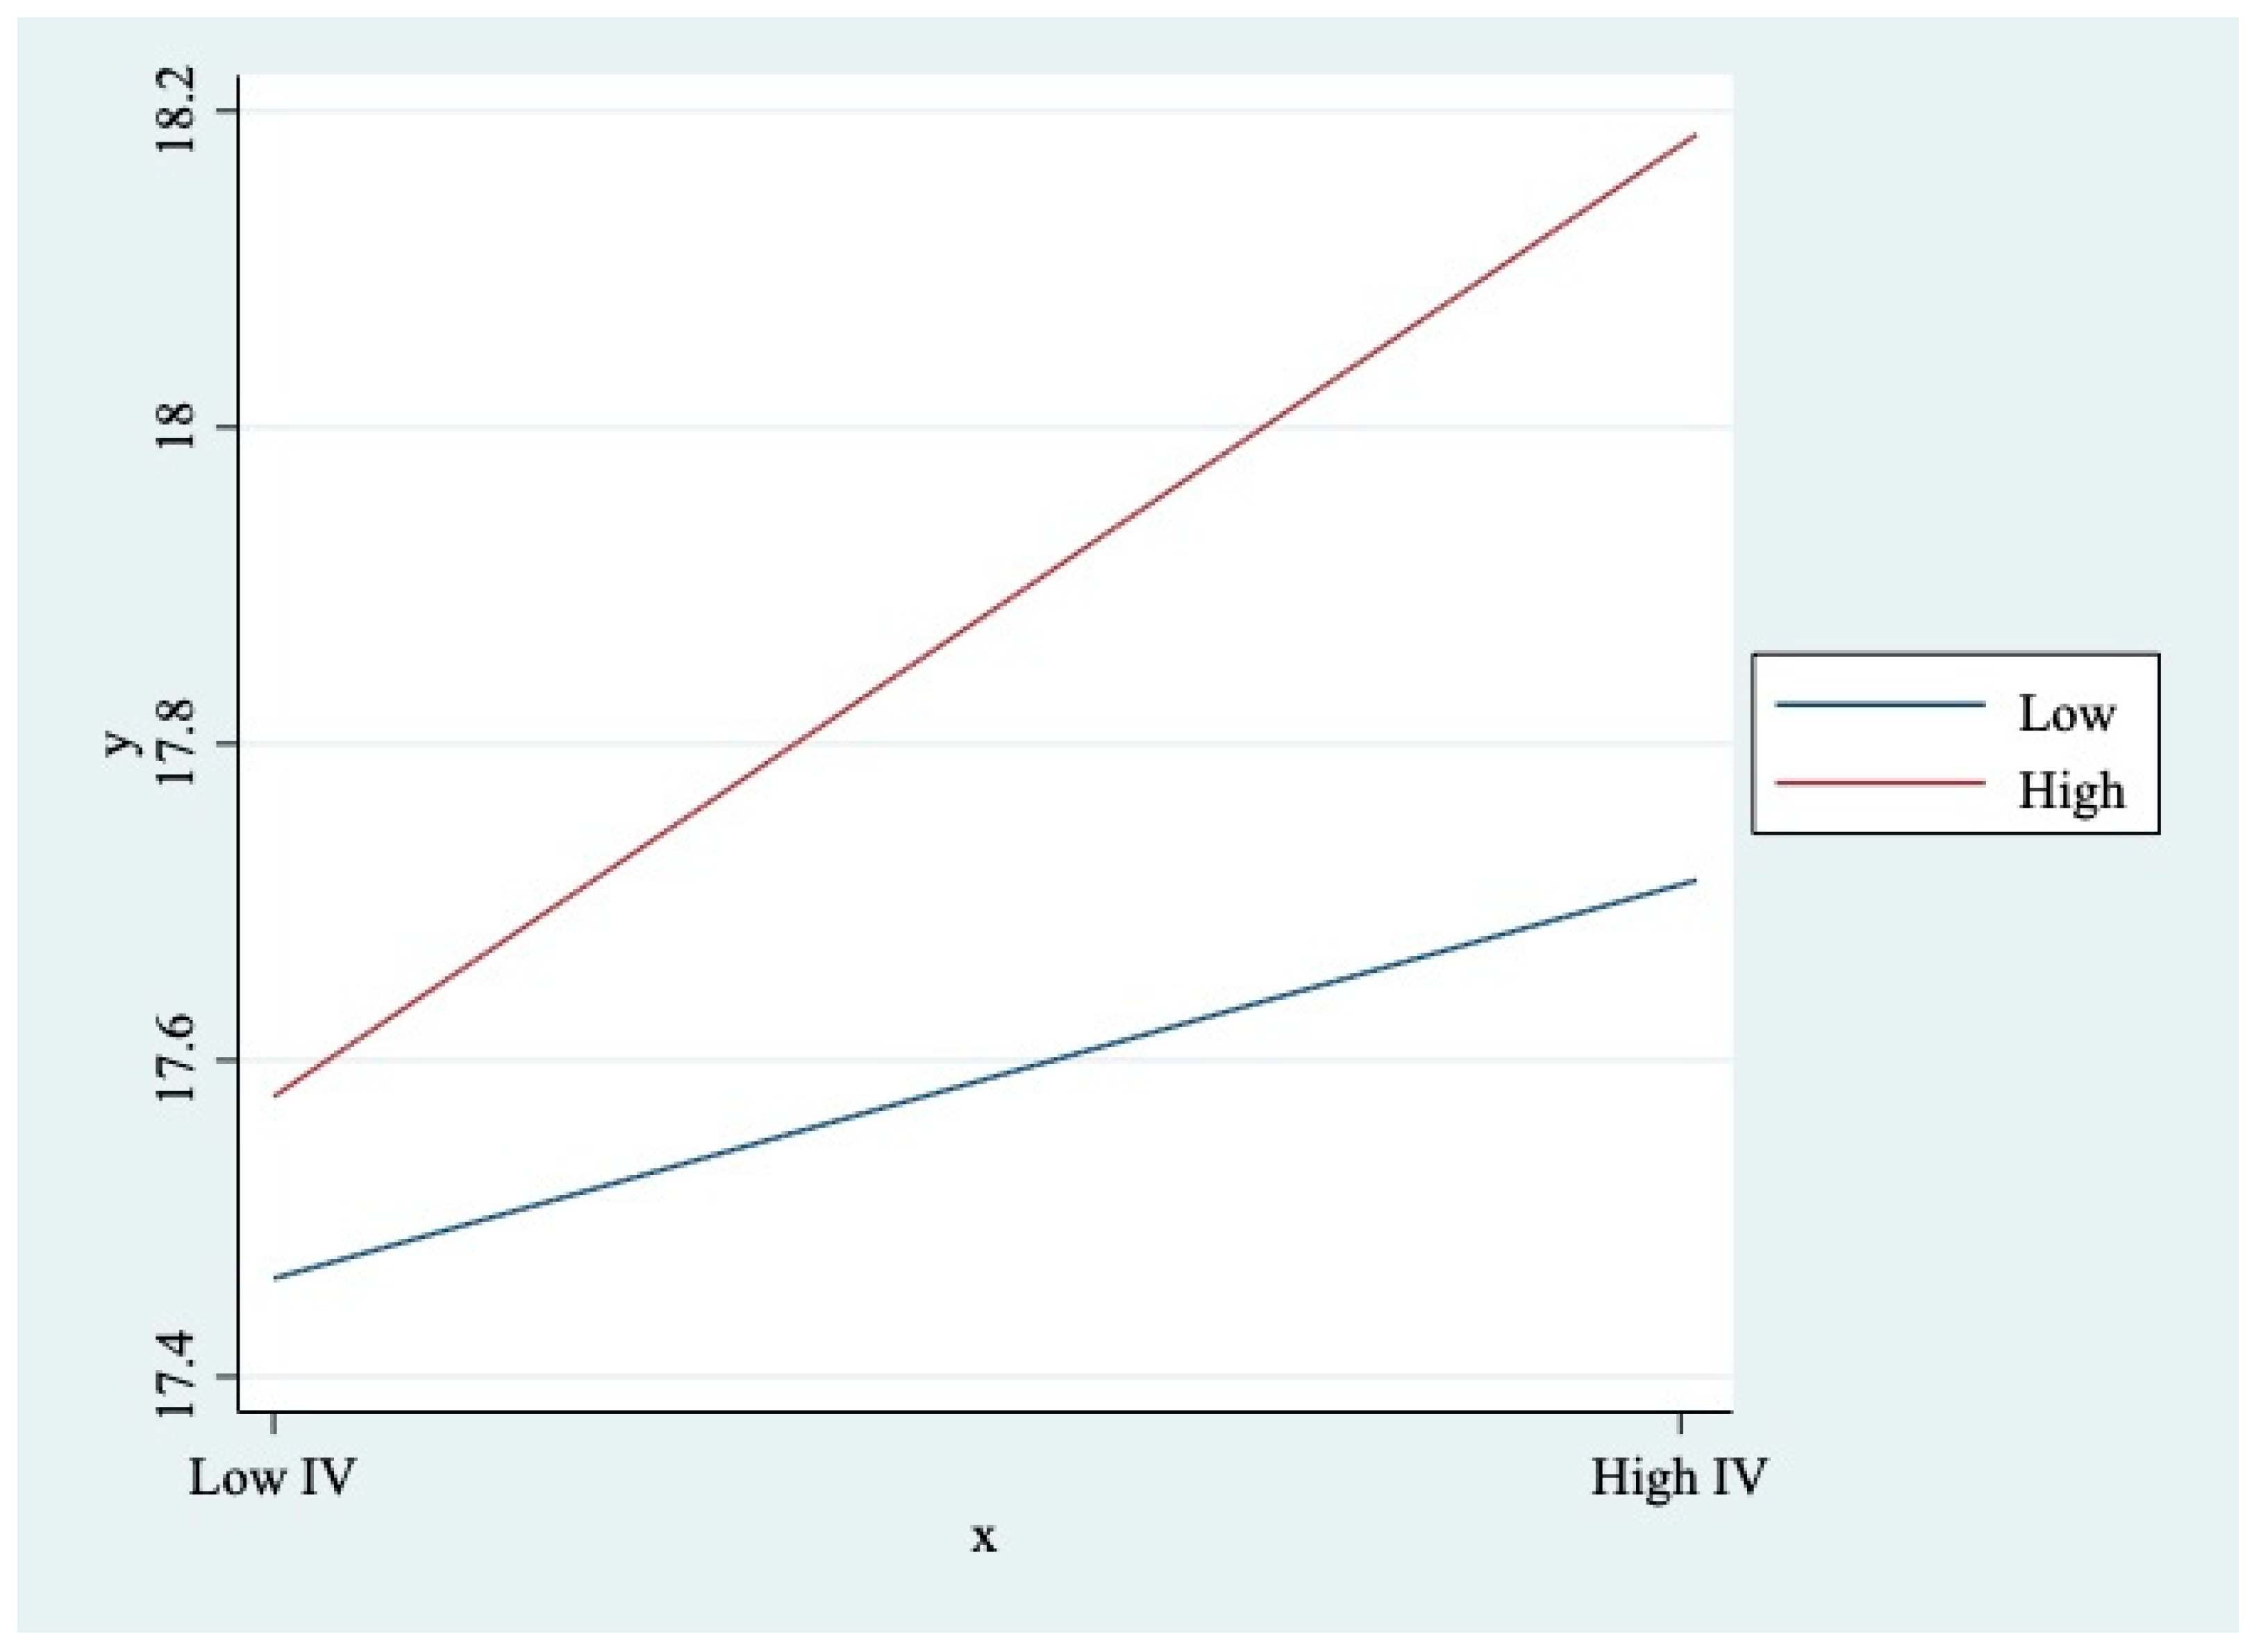
4.6. The Moderating Moderated Effect of Environmental Regulation to Green Innovation on the Relationship Between Carbon Information Disclosure and Firm Value
5. Discussion
6. Conclusions
Author Contributions
Funding
Institutional Review Board Statement
Informed Consent Statement
Data Availability Statement
Acknowledgments
Conflicts of Interest
Abbreviations
| CID | carbon information disclosure |
| FV | firm value |
| GI | green innovation |
| ER | environmental regulation |
Appendix A

| Code | Industry | Code | Industry |
|---|---|---|---|
| A | Agriculture, Forestry, Animal Husbandry, and Fishery | C34 | General Equipment Manufacturing |
| B | Mining | C35 | Specialized Equipment Manufacturing |
| C | Manufacturing | C36 | Automobile Manufacturing |
| C13 | Processing of Agricultural and Sideline Food Products | C37 | Railway, Shipbuilding, Aerospace, and Other Transportation Equipment Manufacturing |
| C14 | Food Manufacturing | C38 | Electrical Machinery and Equipment Manufacturing |
| C15 | Alcoholic Beverages, Soft Drinks, and Refined Tea Manufacturing | C39 | Computer, Communication, and Other Electronic Equipment Manufacturing |
| C17 | Textile Industry | C40 | Instrumentation Manufacturing |
| C18 | Textile, Apparel, and Accessories Industry | C41 | Other Manufacturing Industries |
| C19 | Leather, Fur, Feather, and Related Products and Footwear Manufacturing | C42 | Comprehensive Utilization of Waste Resources |
| C20 | Wood Processing and Manufacturing of Wood, Bamboo, Rattan, Palm, and Straw Products | D | Electricity, Heat, Gas, and Water Production and Supply |
| C21 | Furniture Manufacturing | E | Construction |
| C22 | Paper and Paper Products Industry | F | Wholesale and Retail Trade |
| C23 | Printing and Reproduction of Recorded Media | G | Transportation, Warehousing, and Postal Services |
| C24 | Manufacturing of Cultural, Educational, Arts and Crafts, Sports, and Entertainment Products | H | Accommodation and Catering Services |
| C25 | Petroleum, Coal, and Other Fuel Processing Industry | I | Information Transmission, Software, and Information Technology Services |
| C26 | Chemical Raw Materials and Chemical Products Manufacturing | K | Real Estate Industry |
| C27 | Pharmaceutical Manufacturing | L | Leasing and Business Services |
| C28 | Chemical Fiber Manufacturing | M | Scientific Research and Technical Services |
| C29 | Rubber and Plastic Products Industry | N | Water Conservancy, Environment, and Public Facilities Management |
| C30 | Non-metallic Mineral Products Industry | P | Education |
| C31 | Ferrous Metal Smelting and Rolling Processing Industry | Q | Health and Social Work |
| C32 | Non-ferrous Metal Smelting and Rolling Processing Industry | R | Culture, Sports, and Entertainment |
| C33 | Metal Products Industry | S | Public Administration, Social Security, and Social Organizations |
| Control Variable | Symbol | Descriptions | Justification |
| Size | Size | Natural logarithm of the total assets | Total assets provide a stable measure of firm scale, accounting for a company’s resource base and long-term investment capacity. Unlike revenue, which fluctuates due to market conditions, or the number of employees, which varies by industry structure, total assets offer a consistent and cross-comparable metric across different sectors. |
| Solvency | Lev | Asset-liability ratio, Total Liabilities/Total Assets | Leverage is a widely accepted indicator of a firm’s financial stability and risk exposure. Higher leverage increases financial risk, potentially impacting market valuation. Alternative solvency indicators, such as the debt-to-equity ratio, were considered but may be less stable due to capital structure variations across industries. |
| Liquidity | Liquid | Current Ratio, Current Assets/Current Liabilities | Liquidity reflects a firm’s short-term financial health and ability to meet immediate obligations. It serves as an important risk measure, as insufficient liquidity may lead to financial distress, negatively affecting firm value. Other liquidity measures, such as the quick ratio, were considered but may not fully capture firms’ working capital management strategies. |
| Development ability | Growth | Growth Rate of Net Profit, (Current Period Net Profit-Last Period Net Profit)/Last Period Net Profit | Growth potential reflects a firm’s ability to expand operations and generate future earnings, directly influencing firm valuation. Revenue growth is a preferred measure as it is less influenced by accounting choices compared to other metrics like asset growth or investment intensity. |
| Profitability | Loss | The net profit of the year was less than 0, plus 1; otherwise, plus 0 | This approach effectively captures financial distress and differentiates between profitable and unprofitable firms. Unlike continuous profitability measures such as ROA or ROE, this dummy variable directly reflects a firm’s financial sustainability and earnings stability, allowing for a clearer distinction between firms experiencing financial difficulties and those generating positive returns. |
| Size of Board | Board | The natural logarithm of board size | Larger boards may improve strategic decision-making but could also lead to inefficiencies. Board size is included as it influences corporate governance effectiveness and firm performance. |
| Governance Capability | Indep | The ratio of independent directors to the total number of directors | Independent directors enhance corporate oversight, reducing information asymmetry and mitigating agency problems, which are critical for firm valuation. |
| External Monitoring Ability | IShare | Institutional Ownership Ratio, Total Institutional Shares/Total Shares Outstanding | Institutional investors play a key role in corporate governance by monitoring managerial actions and influencing strategic decisions, making this an important control variable. |
| Financial Transparency | Big4 | If audited by one of the Big Four (PwC, Deloitte, KPMG, EY), plus 1; otherwise, plus 0 | Audit quality affects financial reporting reliability, which impacts investor confidence and firm valuation. |
| Reliability | Opinion | If an Unqualified audit opinion is issued for its financial report in that year, plus 1; otherwise, plus 0 | The auditor’s opinion on financial statements ensures the credibility of financial reporting and mitigates financial misrepresentation risks. |
| Variables | FV | CID | GI | ER | Size | Lev | Liquid | Growth | Loss | Board | Indep | IShare | Big4 | Opinion |
|---|---|---|---|---|---|---|---|---|---|---|---|---|---|---|
| FV | 1 | |||||||||||||
| CID | −0.180 *** | 1 | ||||||||||||
| GI | −0.129 *** | 0.267 *** | 1 | |||||||||||
| ER | 0.047 *** | −0.190 *** | −0.120 *** | 1 | ||||||||||
| Size | −0.442 *** | 0.310 *** | 0.415 *** | −0.080 *** | 1 | |||||||||
| Lev | −0.345 *** | 0.132 *** | 0.211 *** | −0.006 | 0.520 *** | 1 | ||||||||
| Liquid | 0.280 *** | −0.147 *** | −0.169 *** | 0.003 | −0.360 *** | −0.656 *** | 1 | |||||||
| Growth | 0.065 *** | 0.001 | 0.036 *** | 0.026 *** | 0.038 *** | 0.024 *** | −0.029 *** | 1 | ||||||
| Loss | −0.018 ** | 0.023 *** | −0.035 *** | −0.086 *** | −0.078 *** | 0.137 *** | −0.083 *** | −0.199 *** | 1 | |||||
| Board | −0.135 *** | 0.064 *** | 0.074 *** | 0.075 *** | 0.259 *** | 0.126 *** | −0.125 *** | −0.008 | −0.063 *** | 1 | ||||
| Indep | 0.044 *** | −0.002 | 0.034 *** | −0.048 *** | 0.023 *** | 0.005 | 0.011 | −0.000 | 0.027 *** | −0.543 *** | 1 | |||
| IShare | −0.062 *** | 0.098 *** | 0.120 *** | 0.064 *** | 0.468 *** | 0.226 *** | −0.172 *** | 0.038 *** | −0.124 *** | 0.243 *** | −0.043 *** | 1 | ||
| Big4 | −0.118 *** | 0.073 *** | 0.171 *** | −0.024 *** | 0.381 *** | 0.142 *** | −0.103 *** | −0.011 | −0.037 *** | 0.094 *** | 0.053 *** | 0.259 *** | 1 | |
| Opinion | −0.017 ** | 0.006 | 0.051 *** | 0.033 *** | 0.043 *** | −0.068 *** | 0.028 *** | 0.066 *** | −0.185 *** | 0.016 ** | 0.007 | 0.058 *** | 0.022 *** | 1 |
| Variables | VIF | 1/VIF |
|---|---|---|
| Size | 2.322 | 0.431 |
| Lev | 2.202 | 0.454 |
| Liquid | 1.775 | 0.563 |
| Board | 1.626 | 0.615 |
| Indep | 1.484 | 0.674 |
| IShare | 1.355 | 0.738 |
| GI | 1.26 | 0.794 |
| Big4 | 1.196 | 0.836 |
| CID | 1.181 | 0.847 |
| Loss | 1.144 | 0.874 |
| ER | 1.072 | 0.933 |
| Growth | 1.048 | 0.954 |
| Opinion | 1.046 | 0.956 |
| Mean VIF | 1.439 | |
| Test Type | Statistic | p-Value | Conclusion |
|---|---|---|---|
| F Test | 163.07 | 0.0000 | FE model better than OLS model |
| LM Test | 13,114.64 | 0.0000 | RE model better than OLS model |
| Hausman Test | 282.27 | 0.0000 | FE model better than RE model |
References
- UNFCCC. United Nations Framework Convention on Climate Change. October 2013. Available online: http://unfccc.int/2860.php (accessed on 1 November 2014).
- United Nations. Paris agreement. In Report of the Conference of the Parties to the United Nations Framework Convention on Climate Change (21st Session, 2015: Paris); HeinOnline: Buffalo, NY, USA, 2015; Volume 4, p. 2017. [Google Scholar]
- Protocol, K. Framework convention on climate change. Kyoto Protocol 2010, 7, 4–75. [Google Scholar]
- Tang, S.; Demeritt, D. Climate change and mandatory carbon reporting: Impacts on business process and performance. Bus. Strategy Environ. 2018, 27, 437–455. [Google Scholar] [CrossRef]
- Bertay, A.C.; Baştimur, H.; Ararat, M.; Dağdemir, İ.Z. CDP Climate Change and Water Report 2021: Turkey Edition; CDP: Istanbul, Türkiye, 2022. [Google Scholar]
- Ibhadode, P. Exploratory Study of CDP Sustainability Framework’s Effectiveness to Portray Companies Sustainability Strategiesvaamiseen. Master’s Thesis, 2023. Available online: https://oulurepo.oulu.fi/handle/10024/41476?show=full (accessed on 1 November 2024).
- Matisoff, D.C.; Noonan, D.S.; O’Brien, J.J. Convergence in environmental reporting: Assessing the carbon disclosure project. Bus. Strategy Environ. 2013, 22, 285–305. [Google Scholar] [CrossRef]
- Grove, H.; Clouse, M.; Xu, T. Climate change risk: Challenge for corporate governance. J. Gov. Regul. 2021, 10, 258–268. [Google Scholar] [CrossRef]
- Liu, F.; Wen, W. Stock index constituent adjustments and corporate social responsibility: Evidence from a quasi-natural experiment of CSI 300 index adjustments. China J. Account. Stud. 2023, 11, 300–331. [Google Scholar] [CrossRef]
- Buchholz, H.; Eberle, T.; Klevesath, M.; Jürgens, A.; Beal, D.; Baic, A.; Radeke, J. Forward thinking for sustainable business value: A new method for impact valuation. Sustainability 2020, 12, 8420. [Google Scholar] [CrossRef]
- Tsang, A.; Frost, T.; Cao, H. Environmental, social, and governance (ESG) disclosure: A literature review. Br. Account. Rev. 2023, 55, 101149. [Google Scholar] [CrossRef]
- Hardiyansah, M.; Agustini, A.T.; Purnamawati, I. The effect of carbon emission disclosure on firm value: Environmental performance and industrial type. J. Asian Financ. Econ. Bus. 2021, 8, 123–133. [Google Scholar]
- Jin, M.; Tian, H.; Kumbhakar, S.C. How to survive and compete: The impact of information asymmetry on productivity. J. Product. Anal. 2020, 53, 107–123. [Google Scholar] [CrossRef]
- Zhang, F.; Zhu, L. Enhancing corporate sustainable development: Stakeholder pressures, organizational learning, and green innovation. Bus. Strategy Environ. 2019, 28, 1012–1026. [Google Scholar] [CrossRef]
- Tang, Y.; Zhu, J.; Ma, W.; Zhao, M. A study on the impact of institutional pressure on carbon information disclosure: The mediating effect of enterprise peer influence. Int. J. Environ. Res. Public Health 2022, 19, 4174. [Google Scholar] [CrossRef] [PubMed]
- Takalo, S.K.; Tooranloo, H.S. Green innovation: A systematic literature review. J. Clean. Prod. 2021, 279, 122474. [Google Scholar] [CrossRef]
- Huang, W.; Chau, K.Y.; Kit, I.Y.; Nureen, N.; Irfan, M.; Dilanchiev, A. Relating sustainable business development practices and information management in promoting digital green innovation: Evidence from China. Front. Psychol. 2022, 13, 930138. [Google Scholar] [CrossRef] [PubMed]
- Ministry of Ecology and Environment of the People’s Republic of China (MEE). Environmental Protection Tax Law of the People’s Republic of China. 2018. Available online: https://www.mee.gov.cn/ywgz/fgbz/fl/201811/t20181114_673632.shtml (accessed on 14 November 2018).
- Zhang, Y.; Xia, F.; Zhang, B. Can raising environmental tax reduce industrial water pollution? Firm-level evidence from China. Environ. Impact Assess. Rev. 2023, 101, 107155. [Google Scholar] [CrossRef]
- Peng, Y.; Bai, X. Experimenting towards a low-carbon city: Policy evolution and nested structure of innovation. J. Clean. Prod. 2018, 174, 201–212. [Google Scholar] [CrossRef]
- Liu, G.; Yang, Z.; Zhang, F.; Zhang, N. Environmental tax reform and environmental investment: A quasi-natural experiment based on China’s Environmental Protection Tax Law. Energy Econ. 2022, 109, 106000. [Google Scholar] [CrossRef]
- Zhang, Y.J.; Liu, J.Y. Overview of research on carbon information disclosure. Front. Eng. Manag. 2020, 7, 47–62. [Google Scholar] [CrossRef]
- Rachmawati, S. Green strategy moderate the effect of carbon emission disclosure and environmental performance on firm value. Int. J. Contemp. Account. 2021, 3, 133–152. [Google Scholar] [CrossRef]
- Freeman, R.E. Strategic Management: A Stokcholder Approach; Pitman: London, UK, 1984. [Google Scholar]
- Harjoto, M.; Laksmana, I. The impact of corporate social responsibility on risk taking and firm value. J. Bus. Ethics 2018, 151, 353–373. [Google Scholar] [CrossRef]
- Saha, A.K.; Dunne, T.; Dixon, R. Carbon disclosure, performance and the green reputation of higher educational institutions in the UK. J. Account. Organ. Change 2021, 17, 604–632. [Google Scholar] [CrossRef]
- Sun, Z.Y.; Wang, S.N.; Li, D. The impacts of carbon emissions and voluntary carbon disclosure on firm value. Environ. Sci. Pollut. Res. 2022, 29, 60189–60197. [Google Scholar] [CrossRef]
- Lemma, T.T.; Feedman, M.; Mlilo, M.; Park, J.D. Corporate carbon risk, voluntary disclosure, and cost of capital: South African evidence. Bus. Strategy Environ. 2019, 28, 111–126. [Google Scholar] [CrossRef]
- Monica, M.; Daromes, F.E.; Ng, S. Women on Boards as a Mechanism to Improve Carbon Emission Disclosure and Firm Value. J. Ilm. Akunt. Dan Bisnis 2021, 16, 343–358. [Google Scholar] [CrossRef]
- Alsaifi, K.; Elnahass, M.; Salama, A. Carbon disclosure and financial performance: UK environmental policy. Bus. Strategy Environ. 2020, 29, 711–726. [Google Scholar] [CrossRef]
- Friske, W.; Hoelscher, S.A.; Nikolov, A.N. The impact of voluntary sustainability reporting on firm value: Insights from signaling theory. J. Acad. Mark. Sci. 2023, 51, 372–392. [Google Scholar] [CrossRef]
- Bolton, P.; Kacperczyk, M.T. Carbon Disclosure and the Cost of Capital. 2021. Available online: https://ssrn.com/abstract=3755613 (accessed on 14 November 2022).
- Kurnia, P. Carbon emission disclosure and firm value: A study of manufacturing firms in Indonesia and Australia. Int. J. Energy Econ. Policy 2021, 11, 83–87. [Google Scholar] [CrossRef]
- Lee, J.H.; Cho, J.H. Firm-value effects of carbon emissions and carbon disclosures—Evidence from korea. Int. J. Environ. Res. Public Health 2021, 18, 12166. [Google Scholar] [CrossRef]
- Xue, Y.; Jiang, C.; Guo, Y.; Liu, J.; Wu, H.; Hao, Y. Corporate social responsibility and high-quality development: Do green innovation, environmental investment and corporate governance matter? Emerg. Mark. Financ. Trade 2022, 58, 3191–3214. [Google Scholar] [CrossRef]
- Brooks, C.; Oikonomou, I. The effects of environmental, social and governance disclosures and performance on firm value: A review of the literature in accounting and finance. Br. Account. Rev. 2018, 50, 1–15. [Google Scholar] [CrossRef]
- Buallay, A.; Kukreja, G.; Aldhaen, E.; Al Mubarak, M.; Hamdan, A.M. Corporate social responsibility disclosure and firms’ performance in Mediterranean countries: A stakeholders’ perspective. EuroMed J. Bus. 2020, 15, 361–375. [Google Scholar] [CrossRef]
- Shi, F.; Wang, Y. Corporate Social Responsibility, Carbon Information Disclosure, and Enterprise Value: A Study of Listed Companies in China’s Highly Polluting Industries. Int. J. Financ. Stud. 2024, 12, 66. [Google Scholar] [CrossRef]
- Jaggi, B.; Allini, A.; Macchioni, R.; Zagaria, C. The factors motivating voluntary disclosure of carbon information: Evidence based on Italian listed companies. Organ. Environ. 2018, 31, 178–202. [Google Scholar] [CrossRef]
- Ma, X.; Che, T.; Sun, X. A carbon information disclosure perspective on carbon premium: Evidence from China. J. Bus. Res. 2024, 173, 114467. [Google Scholar] [CrossRef]
- Wernerfelt, B. A resource-based view of the firm. Strateg. Manag. J. 1984, 5, 171–180. [Google Scholar] [CrossRef]
- Lin, W.L.; Ho, J.A.; Sambasivan, M.; Yip, N.; Mohamed, A.B. Influence of green innovation strategy on brand value: The role of marketing capability and R&D intensity. Technol. Forecast. Soc. Change 2021, 171, 120946. [Google Scholar]
- Le, T.T.; Tran, P.Q.; Lam, N.P.; Tra, M.N.L.; Uyen, P.H.P. Corporate social responsibility, green innovation, environment strategy and corporate sustainable development. Oper. Manag. Res. 2024, 17, 114–134. [Google Scholar] [CrossRef]
- Hamdoun, M. The antecedents and outcomes of environmental management based on the resource-based view: A systematic literature review. Manag. Environ. Qual. Int. J. 2020, 31, 451–469. [Google Scholar] [CrossRef]
- Yang, L.; Zhang, J.; Zhang, Y. Environmental regulations and corporate green innovation in China: The role of city leaders’ promotion pressure. Int. J. Environ. Res. Public Health 2021, 18, 7774. [Google Scholar] [CrossRef]
- Hsu, C.C.; Quang-Thanh, N.; Chien, F.; Li, L.; Mohsin, M. Evaluating green innovation and performance of financial development: Mediating concerns of environmental regulation. Environ. Sci. Pollut. Res. 2021, 28, 57386–57397. [Google Scholar] [CrossRef]
- Hardiyansah, M.; Agustini, A.T. Carbon Emissions Disclosure and Firm Value: Does Environmental Performance Moderate This Relationship. J. Ekon. Dan Bisnis Islam 2021, 7, 51–71. [Google Scholar] [CrossRef]
- Hu, S.; Dong, W.; Huang, Y. Analysts’ green coverage and corporate green innovation in China: The moderating effect of corporate environmental information disclosure. Sustainability 2023, 15, 5637. [Google Scholar] [CrossRef]
- Khanra, S.; Kaur, P.; Joseph, R.P.; Malik, A.; Dhir, A. A resource-based view of green innovation as a strategic firm resource: Present status and future directions. Bus. Strategy Environ. 2022, 31, 1395–1413. [Google Scholar] [CrossRef]
- Paillé, P.; Halilem, N. Systematic review on environmental innovativeness: A knowledge-based resource view. J. Clean. Prod. 2019, 211, 1088–1099. [Google Scholar]
- Alkaraan, F.; Elmarzouky, M.; Hussainey, K.; Venkatesh, V.G.; Shi, Y.; Gulko, N. Reinforcing green business strategies with Industry 4.0 and governance towards sustainability: Natural-resource-based view and dynamic capability. Bus. Strategy Environ. 2024, 33, 3588–3606. [Google Scholar] [CrossRef]
- Mishra, P.; Yadav, M. Environmental capabilities, proactive environmental strategy and competitive advantage: A natural-resource-based view of firms operating in India. J. Clean. Prod. 2021, 291, 125249. [Google Scholar] [CrossRef]
- Begum, S.; Ashfaq, M.; Xia, E.; Awan, U. Does green transformational leadership lead to green innovation? The role of green thinking and creative process engagement. Bus. Strategy Environ. 2022, 31, 580–597. [Google Scholar] [CrossRef]
- Zhang, D.; Rong, Z.; Ji, Q. Green innovation and firm performance: Evidence from listed companies in China. Resour. Conserv. Recycl. 2019, 144, 48–55. [Google Scholar] [CrossRef]
- Bai, Y.; Song, S.; Jiao, J.; Yang, R. The impacts of government R&D subsidies on green innovation: Evidence from Chinese energy-intensive firms. J. Clean. Prod. 2019, 233, 819–829. [Google Scholar]
- Popp, D. Environmental policy and innovation: A decade of research. Int. Rev. Environ. Resour. Econ. 2019, 13, 265–337. [Google Scholar] [CrossRef]
- Cai, W.; Li, G. The drivers of eco-innovation and its impact on performance: Evidence from China. J. Clean. Prod. 2018, 176, 110–118. [Google Scholar] [CrossRef]
- Li, L.; Msaad, H.; Sun, H.; Tan, M.X.; Lu, Y.; Lau, A.K. Green innovation and business sustainability: New evidence from energy intensive industry in China. Int. J. Environ. Res. Public Health 2020, 17, 7826. [Google Scholar] [CrossRef]
- Chuang, S.P.; Huang, S.J. The effect of environmental corporate social responsibility on environmental performance and business competitiveness: The mediation of green information technology capital. J. Bus. Ethics 2018, 150, 991–1009. [Google Scholar] [CrossRef]
- Hu, D.; Huang, Y.; Zhong, C. Does environmental information disclosure affect the sustainable development of enterprises: The role of green innovation. Sustainability 2021, 13, 11064. [Google Scholar] [CrossRef]
- Qiu, L.; Jie, X.; Wang, Y.; Zhao, M. Green product innovation, green dynamic capability, and competitive advantage: Evidence from Chinese manufacturing enterprises. Corp. Soc. Responsib. Environ. Manag. 2020, 27, 146–165. [Google Scholar] [CrossRef]
- Liu, G.; Zhang, C. Economic policy uncertainty and firms’ investment and financing decisions in China. China Econ. Rev. 2020, 63, 101279. [Google Scholar] [CrossRef]
- Chen, X.; Yi, N.; Zhang, L.; Li, D. Does institutional pressure foster corporate green innovation? Evidence from China’s top 100 companies. J. Clean. Prod. 2018, 188, 304–311. [Google Scholar] [CrossRef]
- Guo, Y.; Xia, X.; Zhang, S.; Zhang, D. Environmental regulation, government R&D funding and green technology innovation: Evidence from China provincial data. Sustainability 2018, 10, 940. [Google Scholar] [CrossRef]
- Xu, X.; Jing, R.; Lu, F. Environmental Regulation, Corporate Social Responsibility (CSR) Disclosure and Enterprise Green Innovation: Evidence from Listed Companies in China. Int. J. Environ. Res. Public Health 2022, 19, 14771. [Google Scholar] [CrossRef]
- Luo, X.; Yu, M.; Jin, Y. The impact of economic policy uncertainty on enterprise green innovation: A study on the moderating effect of carbon information disclosure. Sustainability 2023, 15, 4915. [Google Scholar] [CrossRef]
- Lv, C.; Shao, C.; Lee, C.C. Green technology innovation and financial development: Do environmental regulation and innovation output matter? Energy Econ. 2021, 98, 105237. [Google Scholar] [CrossRef]
- Kobrossy, S.; Karaszewski, R.; AlChami, R. The Institutionalization of Implicit and Explicit CSR in a Developing Country Context: The Case of Lebanon. Adm. Sci. 2022, 12, 142. [Google Scholar] [CrossRef]
- Shao, S.; Hu, Z.; Cao, J.; Yang, L.; Guan, D. Environmental regulation and enterprise innovation: A review. Bus. Strategy Environ. 2020, 29, 1465–1478. [Google Scholar] [CrossRef]
- He, L.; Wang, M. Environmental regulation and green innovation of polluting firms in China. PLoS ONE 2023, 18, e0281303. [Google Scholar] [CrossRef]
- Ullah, S.; Ahmad, T.; Kukreti, M.; Sami, A.; Shaukat, M.R. How organizational readiness for green innovation, green innovation performance and knowledge integration affects sustainability performance of exporting firms. J. Asia Bus. Stud. 2024, 18, 519–537. [Google Scholar] [CrossRef]
- Zheng, S.; Yi, H.; Li, H. The impacts of provincial energy and environmental policies on air pollution control in China. Renew. Sustain. Energy Rev. 2015, 49, 386–394. [Google Scholar] [CrossRef]
- Baah, C.; Jin, Z.; Tang, L. Organizational and regulatory stakeholder pressures friends or foes to green logistics practices and financial performance: Investigating corporate reputation as a missing link. J. Clean. Prod. 2020, 247, 119125. [Google Scholar] [CrossRef]
- Huang, Y.C.; Huang, C.H. Exploring institutional pressure, the top management team’s response, green innovation adoption, and firm performance: Evidence from Taiwan’s electrical and electronics industry. Eur. J. Innov. Manag. 2024, 27, 800–824. [Google Scholar] [CrossRef]
- Waqas, M.; Honggang, X.; Ahmad, N.; Khan, S.A.R.; Iqbal, M. Big data analytics as a roadmap towards green innovation, competitive advantage and environmental performance. J. Clean. Prod. 2021, 323, 128998. [Google Scholar] [CrossRef]
- Chang, K.; Long, Y.; Yang, J.; Zhang, H.; Xue, C.; Liu, J. Effects of subsidy and tax rebate policies on green firm research and development efficiency in China. Energy 2022, 258, 124793. [Google Scholar] [CrossRef]
- Shao, Y.; Chen, Z. Can government subsidies promote the green technology innovation transformation? Evidence from Chinese listed companies. Econ. Anal. Policy 2022, 74, 716–727. [Google Scholar] [CrossRef]
- Elsayih, J.; Datt, R.; Hamid, A. CEO characteristics: Do they matter for carbon performance? An empirical investigation of Australian firms. Soc. Responsib. J. 2021, 17, 1279–1298. [Google Scholar] [CrossRef]
- Khan, S.J.; Kaur, P.; Jabeen, F.; Dhir, A. Green process innovation: Where we are and where we are going. Bus. Strategy Environ. 2021, 30, 3273–3296. [Google Scholar] [CrossRef]
- Lim, E.W. Concentrated ownership, state-owned enterprises and corporate governance. Oxf. J. Leg. Stud. 2021, 41, 663–691. [Google Scholar] [CrossRef]
- Wang, G.; Bai, J.; Xing, J.; Shen, J.; Dan, E.; Zheng, X.; Zhang, L.; Liu, P.; Feng, R. Operational efficiency and debt cost: The mediating effect of carbon information disclosure in Chinese listed companies. Sustainability 2023, 15, 1512. [Google Scholar] [CrossRef]
- Hussein MQ, S.; Saeed, N.A.; Ahmad, G.S. Financial ratios analysis and companies’ liquidity evaluation. J. Glob. Econ. Bus. 2023, 4, 60–75. [Google Scholar] [CrossRef]
- China Securities Regulatory Commission. Industry Classification Guidelines for Listed Companies. 2012. Available online: http://www.csrc.gov.cn/csrc/c101864/c1024632/content.shtml?eqid=e9be3930000071db00000004643e64b2&wd=&eqid=9bcb5f600005e93100000006651ea2e1 (accessed on 14 November 2018).
- Loughran, T.; McDonald, B. Textual analysis in accounting and finance: A survey. J. Account. Res. 2016, 54, 1187–1230. [Google Scholar] [CrossRef]
- Jona, J.; Soderstrom, N. Evolution of climate-related disclosure guidance and application of climate risk measurement in research. In Handbook of Accounting and Sustainability; Edward Elgar Publishing: Cheltenham, UK, 2022; pp. 397–420. [Google Scholar]
- Jiang, W.; Wang, K.; Zhou, K.Z. How political ties and green innovation co-evolve in China: Alignment with institutional development and environmental pollution. J. Bus. Ethics 2023, 186, 739–760. [Google Scholar] [CrossRef]
- Wang, Q. Financial effects of carbon risk and carbon disclosure: A review. Account. Financ. 2023, 63, 4175–4219. [Google Scholar] [CrossRef]
- Taques, F.H.; López, M.G.; Basso, L.F.; Areal, N. Indicators used to measure service innovation and manufacturing innovation. J. Innov. Knowl. 2021, 6, 11–26. [Google Scholar] [CrossRef]
- Tu, Z.; Hu, T.; Shen, R. Evaluating public participation impact on environmental protection and ecological efficiency in China: Evidence from PITI disclosure. China Econ. Rev. 2019, 55, 111–123. [Google Scholar] [CrossRef]
- Pien, C.P. Local environmental information disclosure and environmental non-governmental organizations in Chinese prefecture-level cities. J. Environ. Manag. 2020, 275, 111225. [Google Scholar] [CrossRef] [PubMed]
- Zhang, M.; Huang, M. Study on the impact of informal environmental regulation on substantive green innovation in China: Evidence from PITI disclosure. Environ. Sci. Pollut. Res. 2023, 30, 10444–10456. [Google Scholar] [CrossRef]
- Sedgwick, P. Pearson’s correlation coefficient. BMJ 2012, 345, e4483. [Google Scholar] [CrossRef]
| Variables | Symbol | Descriptions | |
|---|---|---|---|
| Dependent Variable | Firm value | FV | Tobin’s q, Market Value of Firm/ Total assets-Net intangible assets-Net goodwill |
| Independent Variable | Carbon information disclosure | CID | Python 3.10 is used to count keyword frequencies, and the normalization by maximum–minimum method is used to obtain the value |
| Moderator Variable | Green innovation | GI | The number of green inventions with independent applications and green utility models with independent applications in the current year plus 1, taken as the natural logarithm of the total number |
| Environmental regulation | ER | The ratio of investment in wastewater treatment and air pollution control in location and industrial added value | |
| Control Variable | Size | Size | Natural logarithm of the total assets |
| Solvency | Lev | Asset-liability ratio, Total Liabilities/Total Assets | |
| Liquidity | Liquid | Current Ratio, Current Assets/Current Liabilities | |
| Development ability | Growth | Growth Rate of Net Profit, (Current Period Net Profit–Last Period Net Profit)/Last Period Net Profit | |
| Profitability | Loss | The net profit of the year was less than 0, plus 1; otherwise, plus 0 | |
| Size of Board | Board | The natural logarithm of board size | |
| Governance Capability | Indep | The ratio of independent directors to the total number of directors | |
| External Monitoring Ability | IShare | Institutional Ownership Ratio, Total Institutional Shares/Total Shares Outstanding | |
| Financial Transparency | Big4 | If audited by one of the Big Four (PwC, Deloitte, KPMG, EY), plus 1; otherwise, plus 0 | |
| Reliability | Opinion | If an Unqualified audit opinion is issued for its financial report in that year, plus 1; otherwise, plus 0 |
| N | Mean | SD | 25% | 50% | 75% | Min | Max | |
|---|---|---|---|---|---|---|---|---|
| FV | 17,530 | 1.986 | 1.226 | 1.187 | 1.584 | 2.311 | 0.828 | 7.491 |
| CID | 17,530 | 0.023 | 0.035 | 0 | 0.011 | 0.027 | 0 | 0.202 |
| GI | 17,530 | 0.921 | 1.204 | 0 | 0 | 1.609 | 0 | 4.812 |
| ER | 17,530 | 0.002 | 0.002 | 0.001 | 0.001 | 0.002 | 0 | 0.008 |
| Size | 17,530 | 22.588 | 1.306 | 21.665 | 22.416 | 23.357 | 19.585 | 26.452 |
| Lev | 17,530 | 0.436 | 0.196 | 0.282 | 0.431 | 0.583 | 0.046 | 0.908 |
| Liquid | 17,530 | 2.176 | 1.927 | 1.135 | 1.588 | 2.45 | 0.366 | 12.422 |
| Growth | 17,530 | 0.14 | 0.336 | −0.033 | 0.09 | 0.236 | −0.508 | 1.818 |
| Loss | 17,530 | 0.106 | 0.308 | 0 | 0 | 0 | 0 | 1 |
| Board | 17,530 | 2.131 | 0.197 | 1.946 | 2.197 | 2.197 | 1.609 | 2.708 |
| Indep | 17,530 | 37.694 | 5.524 | 33.33 | 36.36 | 42.86 | 28.57 | 60 |
| IShare | 17,530 | 45.803 | 23.912 | 28.212 | 47.786 | 64.565 | 0.534 | 90.973 |
| Big4 | 17,530 | 0.072 | 0.258 | 0 | 0 | 0 | 0 | 1 |
| Opinion | 17,530 | 0.978 | 0.146 | 1 | 1 | 1 | 0 | 1 |
| (1) | (2) | (3) | (4) | (5) | (6) | |
|---|---|---|---|---|---|---|
| FV | FV | FV | FV | FV | FV | |
| CID | −6.2472 *** | 1.4286 *** | 2.0000 *** | 1.9041 *** | 1.7556 *** | 1.7546 *** |
| (0.3334) | (0.2790) | (0.2880) | (0.2859) | (0.2819) | (0.2827) | |
| Size | −0.4543 *** | −0.4828 *** | −0.5744 *** | −0.5748 *** | ||
| (0.0384) | (0.0389) | (0.0376) | (0.0375) | |||
| Lev | 0.0739 | 0.1851 | 0.3148 ** | 0.3172 ** | ||
| (0.1300) | (0.1319) | (0.1310) | (0.1314) | |||
| Liquid | −0.0130 | −0.0095 | −0.0144 | −0.0143 | ||
| (0.0099) | (0.0099) | (0,0099) | (0.0099) | |||
| Growth | 0.1103 *** | 0.0598 *** | 0.0595 *** | |||
| (0.0221) | (0.0219) | (0.0219) | ||||
| Loss | −0.1218 *** | −0.1067 *** | −0.1056 *** | |||
| (0.0212) | (0.0211) | (0.0212) | ||||
| Board | 0.0395 | 0.0394 | ||||
| (0.0916) | (0.0917) | |||||
| Indep | 0.0062 ** | 0.0062 ** | ||||
| (0.0025) | (0.0025) | |||||
| IShare | 0.0155 *** | 0.0155 *** | ||||
| (0.0012) | (0.0012) | |||||
| Big4 | 0.0092 | |||||
| (0.0811) | ||||||
| Opinion | 0.0208 | |||||
| (0.0517) | ||||||
| Constant | 2.1300 *** | 1.9535 *** | 12.1974 *** | 12.7862 *** | 13.7896*** | 13.7788 *** |
| (0.0257) | (0.0064) | (0.8416) | (0.8517) | (0.8454) | (0.8420) | |
| Year FE | NO | YES | YES | YES | YES | YES |
| Id FE | NO | YES | YES | YES | YES | YES |
| N | 17,530 | 17,530 | 17,530 | 17,530 | 17,530 | 17,530 |
| Adj. R2 | 0.0324 | 0.6461 | 0.6621 | 0.6639 | 0.6760 | 0.6760 |
| (1) | (2) | (3) | (4) | |
|---|---|---|---|---|
| FV | FV | FV | FV | |
| CID | 1.4286 *** | 1.7546 *** | 1.6670 *** | 1.3210 *** |
| (0.2790) | (0.2827) | (0.2815) | (0.3041) | |
| Size | −0.5748 *** | −0.5902 *** | −0.5911 *** | |
| (0.0375) | (0.0376) | (0,0375) | ||
| Lev | 0.3172 ** | 0.3187 ** | 0.3206 ** | |
| (0.1314) | (0.1309) | (0.1310) | ||
| Liquid | −0.0143 | −0.0144 | −0.0145 | |
| (0.0099) | (0.0099) | (0.0099) | ||
| Growth | 0.0595 *** | 0.0611 *** | 0.0609 *** | |
| (0.0219) | (0.0219) | (0.0219) | ||
| Loss | −0.1056 *** | −0.1056 *** | −0.1057 *** | |
| (0.0212) | (0.0211) | (0.0211) | ||
| Board | 0.0394 | 0.0373 | 0.0422 | |
| (0.0917) | (0.0919) | (0.0920) | ||
| Indep | 0.0062 ** | 0.0060 ** | 0.0061 ** | |
| (0.0025) | (0.0025) | (0.0025) | ||
| IShare | 0.0155 *** | 0.0154 *** | 0.0155 *** | |
| (0.0012) | (0.0012) | (0.0012) | ||
| Big4 | 0.0092 | 0.0047 | 0.0028 | |
| (0.0811) | (0.0802) | (0.0797) | ||
| Opinion | 0.0208 | 0.0157 | 0.0155 | |
| (0.0517) | (0.0514) | (0.0514) | ||
| GI | 0.0472 *** | 0.0443 *** | ||
| (0.0109) | (0.0111) | |||
| c_CIDGI | 0.3498 ** | |||
| (0.1437) | ||||
| Constant | 1.9535 *** | 13.7788 *** | 14.1011 *** | 14.1151 *** |
| (0.0064) | (0.8420) | (0.8436) | (0.8422) | |
| Year FE | YES | YES | YES | YES |
| Id FE | YES | YES | YES | YES |
| N | 17,530 | 17,530 | 17,530 | 17,530 |
| Adj. R2 | 0.6461 | 0.6760 | 0.6766 | 0.6767 |
| (1) | (2) | (3) | (4) | |
|---|---|---|---|---|
| FV | FV | FV | FV | |
| CID | 1.4286 *** | 1.7546 *** | 1.6618 *** | 1.1938 *** |
| (0.2790) | (0.2827) | (0.2814) | (0.3249) | |
| Size | −0.5748 *** | −0.5898 *** | −0.5949 *** | |
| (0.0375) | (0.0376) | (0.0376) | ||
| Lev | 0.3172 ** | 0.3207 ** | 0.3220 ** | |
| (0.1314) | (0.1312) | (0.1312) | ||
| Liquid | −0.0143 | −0.0144 | −0.0142 | |
| (0.0099) | (0.0099) | (0.0099) | ||
| Growth | 0.0595 *** | 0.0608 *** | 0.0627 *** | |
| (0.0219) | (0.0219) | (0.0218) | ||
| Loss | −0.1056 *** | −0.1056 *** | −0.1048 *** | |
| (0.0212) | (0.0211) | (0.0211) | ||
| Board | 0.0394 | 0.0376 | 0.0462 | |
| (0.0917) | (0.0919) | (0.0921) | ||
| Indep | 0.0062 ** | 0.0060 ** | 0.0060 ** | |
| (0.0025) | (0.0025) | (0.0025) | ||
| IShare | 0.0155 *** | 0.0154 *** | 0.0154 *** | |
| (0.0012) | (0.0012) | (0.0012) | ||
| Big4 | 0.0092 | 0.0044 | 0.0045 | |
| (0.0811) | (0.0802) | (0.0792) | ||
| Opinion | 0.0208 | 0.0157 | 0.0110 | |
| (0.0517) | (0.0514) | (0.0512) | ||
| GI | 0.0472 *** | 0.0415 *** | ||
| (0.0109) | (0.0111) | |||
| ER | −3.8808 | −12.8187 * | ||
| (7.4369) | (7.4811) | |||
| c_GIER | −16.8886 *** | |||
| (5.3548) | ||||
| c_CIDGI | 0.4512 *** | |||
| (0.1741) | ||||
| c_CIDER | −1.6 × 10² | |||
| (182.0698) | ||||
| c_CIDGIER | 290.6983 *** | |||
| (112.6143) | ||||
| Constant | 1.9535 *** | 13.7788 *** | 14.0984 *** | 14.2237 *** |
| (0.0064) | (0.8420) | (0.8435) | (0.8454) | |
| Year FE | YES | YES | YES | YES |
| Id FE | YES | YES | YES | YES |
| N | 17,530 | 17,530 | 17,530 | 17,530 |
| Adj. R2 | 0.6461 | 0.6760 | 0.6765 | 0.6771 |
| Group | Low ER Group (Below 25th Percentile) | Lower-Middle ER Group (25th–50th Percentile) | Middle ER Group (50th–75th Percentile) | High ER Group (Above 75th Percentile) | ||||
|---|---|---|---|---|---|---|---|---|
| (1) | (2) | (3) | (4) | (5) | (6) | (7) | (8) | |
| FV | FV | FV | FV | FV | FV | FV | FV | |
| CID | 0.3283 | 0.6198 | 2.2338 *** | 1.6210 * | 2.6165 *** | 1.8572 ** | 1.3322* | 0.7166 |
| (0.3385) | (0.4231) | (0.7609) | (0.8617) | (0.6881) | (0.7977) | (0.8032) | (0.8081) | |
| GI | 0.0283 * | 0.0333 * | 0.0656 *** | 0.0677 *** | 0.0372 * | 0.0370 * | 0.0134 | 0.0136 |
| (0.0167) | (0.0176) | (0.0199) | (0.0200) | (0.0211) | (0.0210) | (0.0247) | (0.0249) | |
| Size | −0.7952 *** | −0.7957 *** | −0.8219 *** | −0.8221 *** | −0.7974 *** | −0.7980 *** | −0.7658 *** | −0.7680 *** |
| (0.0886) | (0.0886) | (0.0847) | (0.0847) | (0.0731) | (0.0727) | (0.0666) | (0.0666) | |
| Lev | 0.3563 | 0.3554 | 0.3238 | 0.3276 | 0.8510 *** | 0.8481 *** | 0.8110 *** | 0.8247 *** |
| (0.2930) | (0.2927) | (0.3481) | (0.3480) | (0.2613) | (0.2593) | (0.2522) | (0.2528) | |
| Liquid | −0.0631 ** | −0.0630 ** | 0.0120 | 0.0121 | 0.0132 | 0.0126 | −0.0061 | −0.0060 |
| (0.0288) | (0.0288) | (0.0201) | (0.0200) | (0.0244) | (0.0244) | (0.0198) | (0.0197) | |
| Growth | 0.1257 *** | 0.1251 *** | 0.0033 | 0.0030 | 0.0624 | 0.0619 | 0.0859 ** | 0.0870 ** |
| (0.0423) | (0.0424) | (0.0517) | (0.0517) | (0.0466) | (0.0467) | (0.0388) | (0.0389) | |
| Loss | −0.0688 ** | −0.0698 ** | −0.0524 | −0.0534 | −0.1456 *** | −0.1457 *** | −0.1827 *** | −0.1820 *** |
| (0.0310) | (0.0310) | (0.0542) | (0.0541) | (0.0458) | (0.0458) | (0.0420) | (0.0419) | |
| Board | −0.1943 | −0.2006 | −0.3989 * | −0.3948 * | 0.2190 | 0.2130 | 0.4318 ** | 0.4424 ** |
| (0.2041) | (0.2049) | (0.2301) | (0.2301) | (0.1822) | (0.1814) | (0.2126) | (0.2134) | |
| Indep | 0.0016 | 0.0014 | −0.0005 | −0.0003 | 0.0051 | 0.0052 | 0.0106 * | 0.0108 ** |
| (0.0048) | (0.0049) | (0.0067) | (0.0067) | (0.0050) | (0.0049) | (0.0055) | (0.0055) | |
| IShare | 0.0153 *** | 0.0152 *** | 0.0205 *** | 0.0206 *** | 0.0168 *** | 0.0168 *** | 0.0112 *** | 0.0112 *** |
| (0.0035) | (0.0034) | (0.0027) | (0.0027) | (0.0022) | (0.0022) | (0.0022) | (0.0022) | |
| Big4 | −0.0651 | −0.0675 | −0.1792 | −0.1833 | −0.1772 | −0.1885 | −0.2143 * | −0.2013 * |
| (0.1536) | (0.1539) | (0.1570) | (0.1570) | (0.1233) | (0.1222) | (0.1107) | (0.1094) | |
| Opinion | 0.0302 | 0.0302 | 0.0678 | 0.0653 | −0.0184 | −0.0254 | −0.1985 | −0.1970 |
| (0.0666) | (0.0666) | (0.1204) | (0.1203) | (0.1036) | (0.1041) | (0.1427) | (0.1422) | |
| c_CIDGI | −0.2512 * | 0.7411 ** | 0.9181 ** | 1.1455 *** | ||||
| (0.1446) | (0.3525) | (0.3955) | (0.4139) | |||||
| Constant | 19.5898 *** | 19.6140 *** | 20.1826 *** | 20.1738 *** | 18.0751 *** | 18.1115 *** | 17.2414 *** | 17.2509 *** |
| (2.0658) | (2.0655) | (2.0345) | (2.0349) | (1.6182) | (1.6104) | (1.4876) | (1.4909) | |
| Year FE | YES | YES | YES | YES | YES | YES | YES | YES |
| Id FE | YES | YES | YES | YES | YES | YES | YES | YES |
| N | 4178 | 4178 | 4040 | 4040 | 4126 | 4126 | 4135 | 4135 |
| Adj. R2 | 0.7889 | 0.7889 | 0.7160 | 0.7161 | 0.7079 | 0.7083 | 0.7175 | 0.7180 |
Disclaimer/Publisher’s Note: The statements, opinions and data contained in all publications are solely those of the individual author(s) and contributor(s) and not of MDPI and/or the editor(s). MDPI and/or the editor(s) disclaim responsibility for any injury to people or property resulting from any ideas, methods, instructions or products referred to in the content. |
© 2025 by the authors. Licensee MDPI, Basel, Switzerland. This article is an open access article distributed under the terms and conditions of the Creative Commons Attribution (CC BY) license (https://creativecommons.org/licenses/by/4.0/).
Share and Cite
Liu, R.; Rahman, M.R.C.A.; Jamil, A.H. Leveraging Environmental Regulation: How Green Innovation Moderates the Relationship Between Carbon Information Disclosure and Firm Value. Sustainability 2025, 17, 2597. https://doi.org/10.3390/su17062597
Liu R, Rahman MRCA, Jamil AH. Leveraging Environmental Regulation: How Green Innovation Moderates the Relationship Between Carbon Information Disclosure and Firm Value. Sustainability. 2025; 17(6):2597. https://doi.org/10.3390/su17062597
Chicago/Turabian StyleLiu, Runyu, Mara Ridhuan Che Abdul Rahman, and Ainul Huda Jamil. 2025. "Leveraging Environmental Regulation: How Green Innovation Moderates the Relationship Between Carbon Information Disclosure and Firm Value" Sustainability 17, no. 6: 2597. https://doi.org/10.3390/su17062597
APA StyleLiu, R., Rahman, M. R. C. A., & Jamil, A. H. (2025). Leveraging Environmental Regulation: How Green Innovation Moderates the Relationship Between Carbon Information Disclosure and Firm Value. Sustainability, 17(6), 2597. https://doi.org/10.3390/su17062597