Article

From the Mountains to the Beach: Water Purification Ecosystem Services and Recreational Beach Use in Puerto Rico

by
Maya Corridore
1,
Rebeca de Jesús Crespo
2,*,
Mariam Valladares-Castellanos
2 and
Thomas Douthat
2
1
Department of Biology, Union College, Schenectady, NY 12308, USA
2
Department of Environmental Sciences, Louisiana State University, Baton Rouge, LA 70803, USA
*
Author to whom correspondence should be addressed.
Sustainability 2025, 17(6), 2556; https://doi.org/10.3390/su17062556
Submission received: 13 January 2025 / Revised: 4 March 2025 / Accepted: 7 March 2025 / Published: 14 March 2025

Abstract

:
Recreational beach use is important for coastal economies and is influenced by water clarity, a trait that may be maintained by water purification ecosystem services (ESs). However, few studies have addressed these linkages. In this study, we ask the following questions: (1) Do watershed-scale water purification ecosystem services influence coastal water quality? (2) Does coastal water quality help explain beach visitation rates? To address these questions, we focused on Puerto Rico (PR), where coastal tourism has economic and cultural importance. We estimated water purification ESs using the Integrated Valuation of Ecosystem Services and Tradeoffs (InVEST), coastal water quality using long-term monitoring data, and beach visitation rates using the InVEST Recreation model. We used Analysis of Variance (ANOVA) and regression analysis to evaluate these linkages accounting for influential anthropogenic factors (amenities, population density, and impervious surfaces). Water purification ESs strongly predicted coastal water quality, which, in turn, significantly explained beach water clarity. However, amenities and impervious surfaces best explained beach visitation. Our study suggests a disconnect between water quality and recreational beach use in PR, which should be explored further.

1. Introduction

Recreation opportunities are valued ecosystem services (ESs) for coastal communities [1,2]. In the USA, coastal recreation amounts to $143 billion annually in gross domestic product (GDP) [3], and in the Caribbean, 84% of the ocean economy is reliant on tourism [4]. The characteristics of coastal water environments, such as clear and clean water, can affect their recreational use [5,6,7,8]. A contributor to coastal water clarity degradation is the influx of non-point source pollutants from inland freshwater bodies [9,10]. Non-point source pollutants from agricultural and urban runoff enter waterways connected with coastal waters and lead to sedimentation and an increased availability of reactive nutrients in aquatic ecosystems [11]. These nutrients may lead to cultural eutrophication, an excess in primary production and primary producer biomass [12]. Among many other impacts, sedimentation and eutrophication can limit light penetration and water clarity, a feature needed for healthy coral reefs [13] and valued by beach visitors looking for snorkeling, swimming, and other recreational opportunities, according to survey-based studies [6,7].
Conversely, vegetated landscapes have the capacity to mitigate non-point source pollution, providing water purification Ecosystem Services (ESs). Vegetation reduces the rate of surface erosion and consequently, water sedimentation [14,15], while helping assimilate nutrients (e.g., Nitrogen (N), and Phosphorus (P)) [16,17] to limit their input into coastal waterways. In theory, the preservation of water purification ESs would be important for the management of coastal recreational ESs, while also maintaining coastal freshwater quality for consumption and fishing. Despite this theoretical connection, there are limited studies empirically addressing the linkages between landscape level water purification ESs and coastal recreational ESs.
In the Puget Sound Region (Washington, USA), beach visitation rates were associated with indicators of beach water quality [18]. However, this study focused on water quality in terms of fecal coliform bacteria data, reflecting public health concerns, rather than revealed preferences associated with esthetic features such as water clarity. A study by Smith et al. [19] in Guánica Bay, Puerto Rico, looked at the linkages between watershed-scale water purification services and coastal economic opportunities. However, their study focused on indicators of coastal habitat quality (e.g., recreational beach length) and did not include indicators of beach use driven by human decisions (i.e., visitation rates). Furthermore, the impacts of environmental quality on human behavior are often poorly quantified, despite their importance to coastal ESs studies. Accordingly, only 23% of studies modeling cultural ESs include a map, since they are difficult to spatialize [20]. To our knowledge, there are no studies linking watershed-scale sediment and nutrient export reduction models to indicators of actual beach visitation rates. By bridging the gap between the watershed-scale supply of water purification ESs and coastal recreational demand, landscape management can receive stakeholder support and investment in ecosystem service management.
This study uses a spatially explicit approach to characterize water purification ESs at the watershed scale and links those services to the empirical estimates of coastal water quality and the revealed preference indicators for beach recreational activity. We do so on the Island of Puerto Rico, which benefits from coastal tourism for its economy [4]. In 2018 alone, recreational beach use contributed $2.0 billion and 30,000 jobs on the Island [8]. Our study aims to describe the connections between water purification ESs in the mountainous regions of PR, where most of its watersheds originate, and economically and culturally important coastal zones. We hypothesized that watersheds with greater sediment and nutrient retention would be associated with higher coastal freshwater quality and beach water clarity. We also hypothesized that water purification services and coastal water quality indicators would be related to the most highly visited beaches. Our study provides insights into the relevance of inland to coastal hydrological connections for managing coastal tourism.

2. Materials and Methods
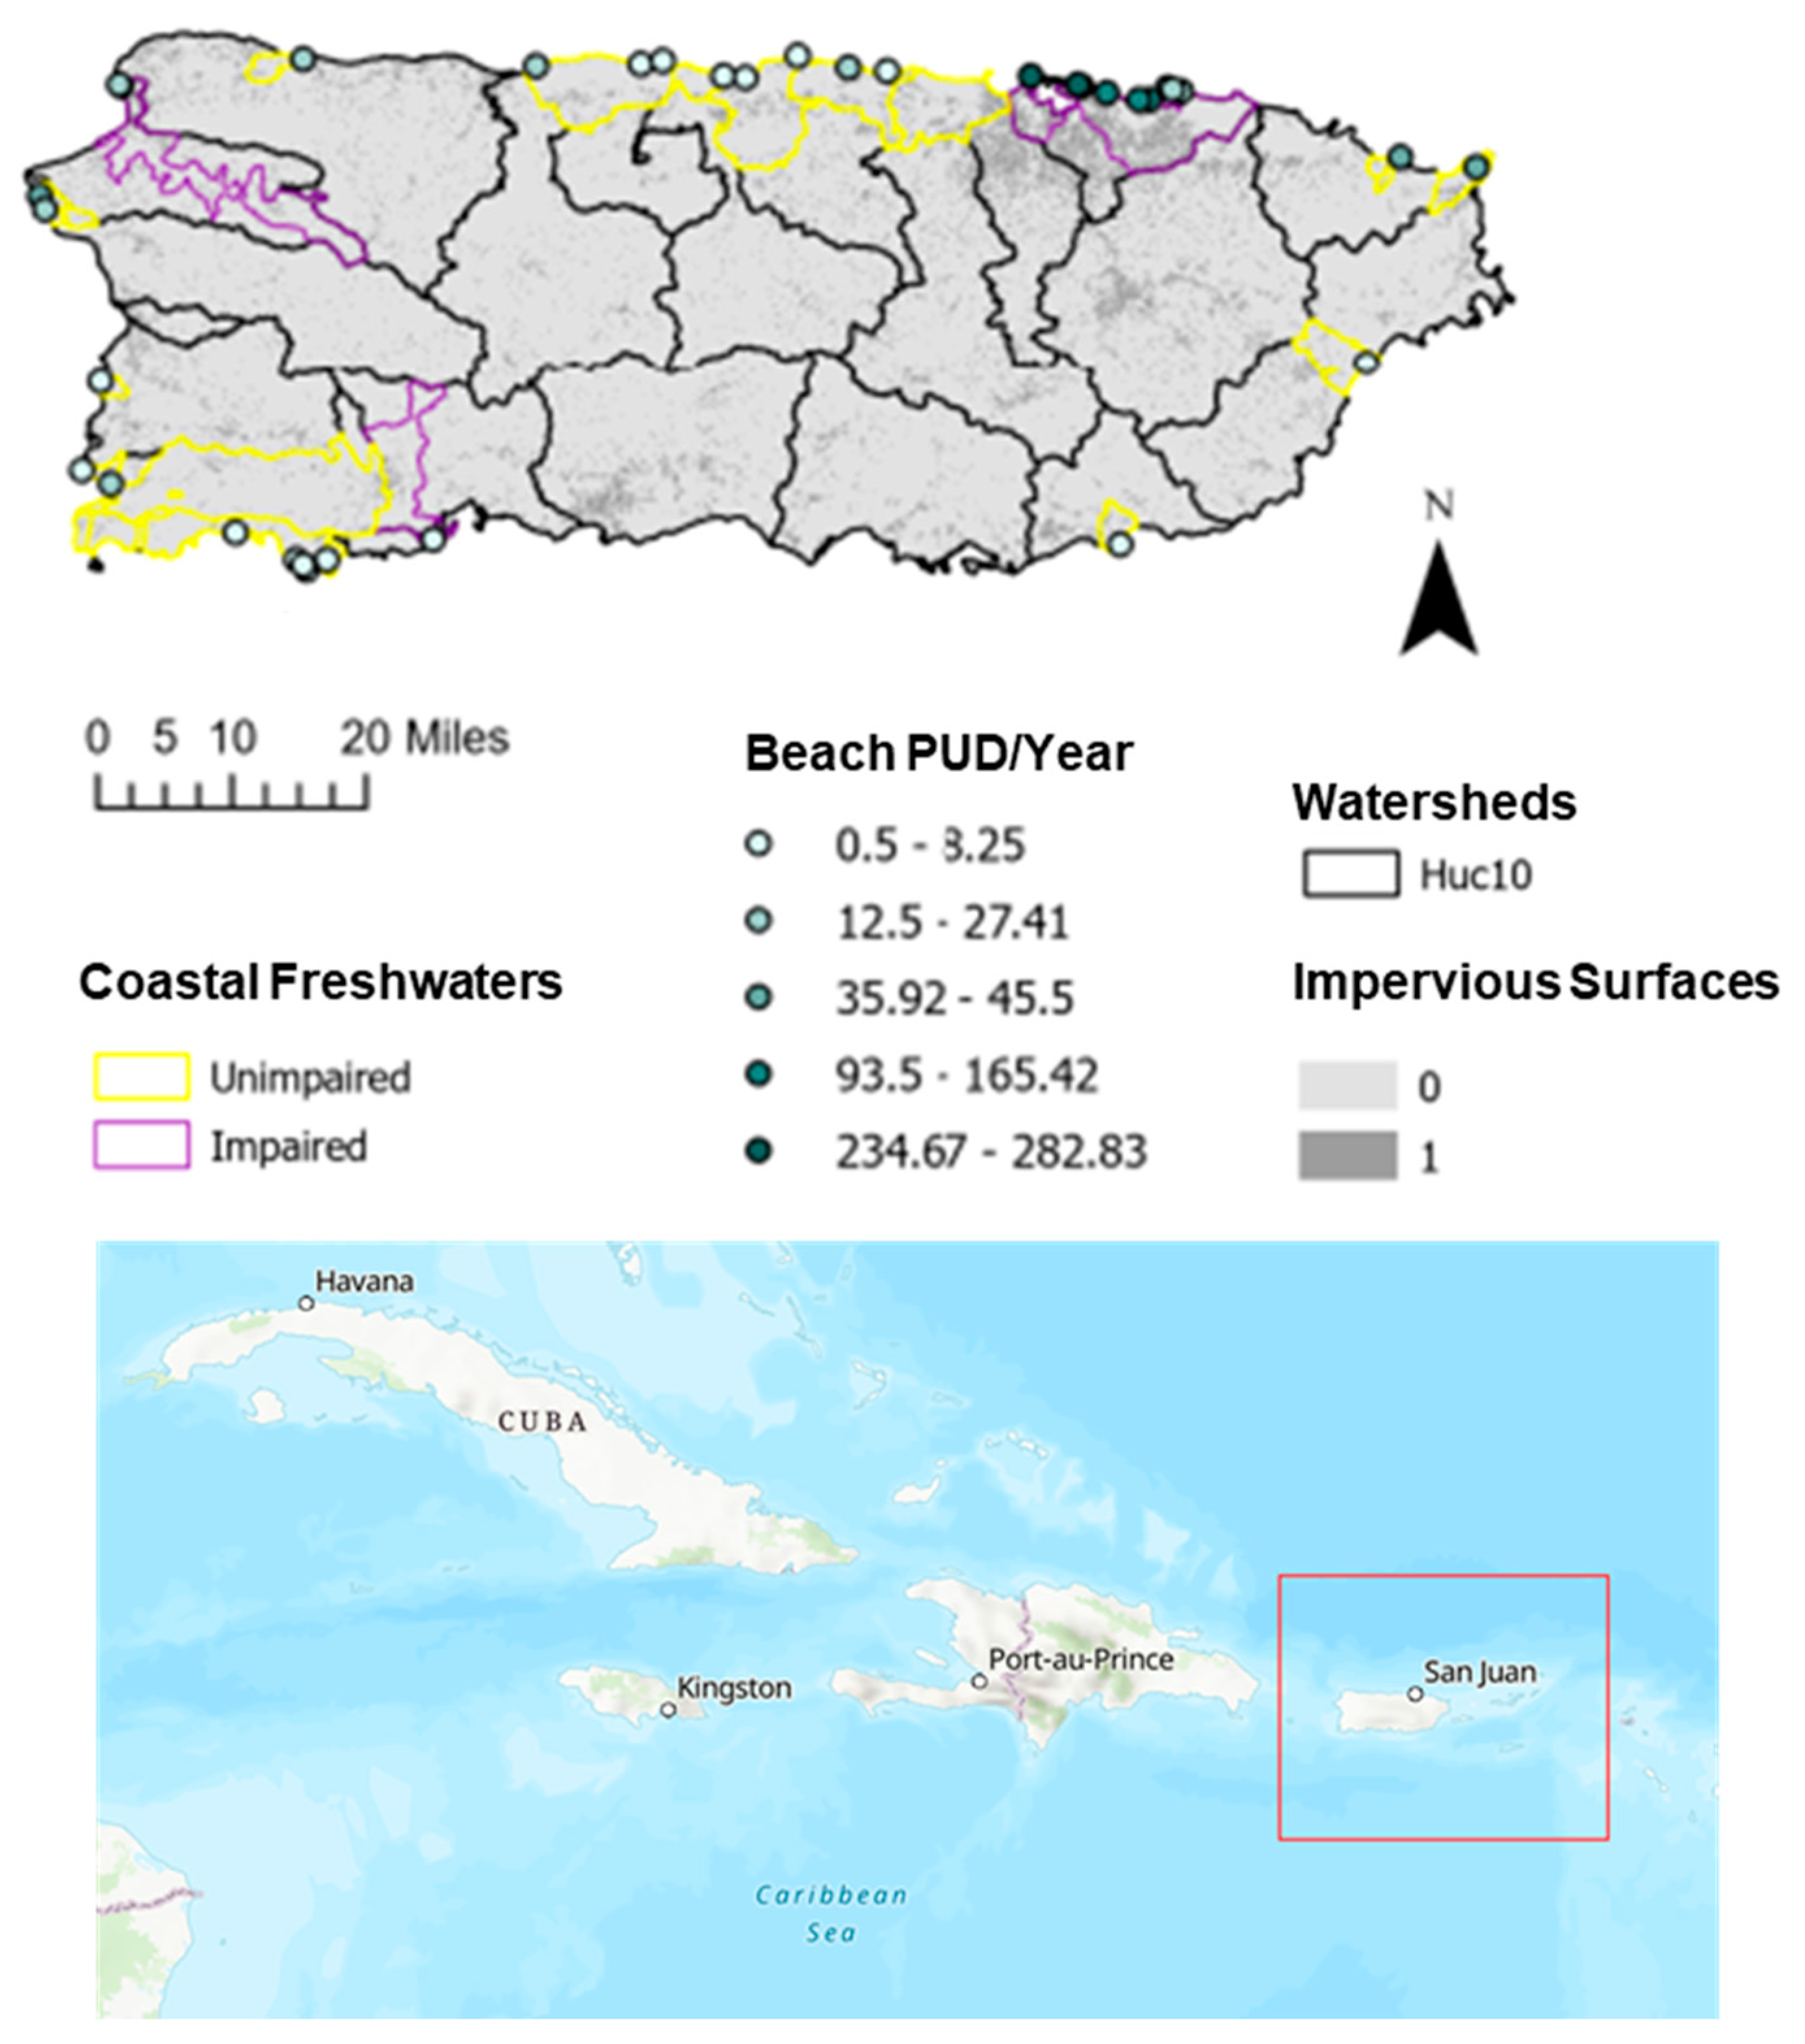
2.1. Study Site

Puerto Rico is a tropical archipelago in the Caribbean with an estimated population of 3,205,691 and a density of 960 residents per square mile [21] (data as of June 2023). The main Island measures 3424.32 square miles and boasts nearly 300 miles of coastline, speckled with just as many natural beaches [22]. The Cordillera Central and Sierra de Cayey mountains divide the Island to create a humid climate in the north that receives as much as 169 in/yr in rainfall from trade winds, whereas the semi-arid south averages 30 in/yr due to the rain-shadow effect [23]. There are minor variations in annual average temperature between coastal and mountainous areas, ranging from 24 to 27 °C and 22 to 25 °C, respectively [23]. Tourism comprises ~5% t of the Island’s economy [24], with recreational beach use being a main attraction for local communities and foreign visitors alike [25]. Our study focuses on 35 beaches in Puerto Rico [26], selected based on data availability and their geographical extent, covering the perimeter of the main Island and connecting directly to inland water bodies (Figure 1). While there are many other recreational beach areas across PR, the beaches selected were directly influenced by a freshwater body that had existing monitoring data available.
We characterized the traits of each beach on multiple spatial scales. The smaller scale of analysis was a 1-mile buffer around the beach, which describes its immediate vicinity. The largest scale of analysis was the watershed area draining to each beach of interest (NHD Plus Hydrologic Unit Code 10 (HUC 10 [27]). We also identified the nearest inland water bodies based on the USEPA state water quality assessment units [28] that connected to a beach. The US EPA under the Clean Water Act requires states and US jurisdictions to monitor and report (i.e., assess) the status of selected water bodies [28]. These assessment units (AUs) are used to inform state water quality assessment decisions reported to the USEPA under the Integrated Report (IR), and Clean Water Act Sections 303(d) and 305(b) [28]. For this study, the AU scale represented the connection point from inland to the coast. Figure 1 provides the spatial representation of these multiple scales. Our Supplementary Material (S1) provides details on the beaches that we studied and their respective multi-scale identifiers.

2.2. Water Purification Ecosystem Services

We used the Integrated Valuation of Ecosystem Services and Tradeoffs (InVEST ver.3.12.0, Natural Capital Project, ref. [29]) modeling platform to estimate water purification ecosystem services. The InVEST® water purification estimates are based on a Nutrient Delivery Model (NDR), which aims to match the sources of nutrients and their delivery to freshwater streams. The NDR model is based on a simple mass balance approach, where nutrient loads (i.e., Nitrogen (N) and Phosphorus (P)) are estimated based on land use/land cover, their related retention and loading rates, topography, and runoff. We also utilized the InVEST sediment delivery ratio (SDR) model to estimate sediment exports. The SDR model maps the generation and delivery of sediments derived from overland erosion to streams. It models annual soil loss (using the Revised Universal Soil Loss Equation, RUSLE1, ref. [30]) and the sediment delivery ratio (i.e., the proportion of the soil loss that was not retained by vegetation and topographic features). The product of these values is used to estimate sediment export in tons⋅ha−1yr−1. Water purification and sediment retention were calculated at the coastal freshwater assessment unit scale and the Huc-10 watershed scale and attributed to each beach connected to these respective units. Details of these estimates are provided in Supplementary Material S1.
We have calibrated and validated the InVEST NDR and SDR models using observations from water bodies across PR for multiple years. For the SDR models, we used observations on annual reservoir capacity loss due to sedimentation [31]. For the NDR models, we used nutrient data from [32]. Details of the calibration and validation for these models are provided elsewhere [33,34]. One of the underlying premises for the InVEST models is that land use land cover features will influence the landscape’s capacity to retain nutrients and prevent erosion. We included in our analysis the more direct measures of percent vegetation and percent impervious surface cover [35] to evaluate if they represented better predictors of our response variables in comparison to the modeled ES values. We used ArcMap 10.4.1 [36] to visualize the results of our ES models and conduct land cover estimates.

2.3. Coastal Water Quality

We collected water quality summary information for the identified coastal freshwater assessment units (CFW-AU) connected to the beach sites [29]. We focused on data on the following parameters: (1) ammonia, (2) nutrients, (3) dissolved oxygen, and (4) turbidity. Each AU was classified as either impaired or unimpaired for these parameters. Ammonia impairment refers to total ammonia nitrogen (TAN, NH3 + NH4+) surpassing the regulatory benchmark for aquatic toxicity [36]. Additionally, high ammonia levels can lead to eutrophication and dissolved oxygen depletion [37,38]. Nutrient impairment refers to N or P levels above regulatory benchmarks [38], above which eutrophication may also occur, impairing aquatic life and anthropogenic uses. We hypothesize that coastal freshwater ammonia and nutrient impairment would be well predicted by modeled N and P exports. Dissolved oxygen (DO) is required to sustain aquatic life, and its impairment criteria are listed here [39]. While DO levels fluctuate for a variety of reasons, low DO is often associated with eutrophication, as excessive algae growth and decomposition lead to higher oxygen consumption [40]. Therefore, we hypothesize that DO impairment would also be predicted by modeled N and P exports. Lastly, turbidity is a measure of the amount of light transmission within water, and it is affected by suspended sediments [41]. Therefore, we hypothesize that turbidity impairment [42] would be well predicted by modeled sediment exports.
To determine beach water clarity, we used Chlorophyll A estimates. Chlorophyll A is the primary pigment used by algae and cyanobacteria for primary production in aquatic systems [43]. In excess, primary producer biomass reduces light penetration, and as such, Chlorophyll has been used as an indicator of water clarity levels in previous studies [44,45]. There are tools available for the detection of Chlorophyll A using remote sensing, making it ideal for an Island-based assessment using spatial analysis. For this study, we used Chlorophyll A long-term (2000–2019) mean, developed by the Plymouth Marine Lab, and distributed by ESRI Oceans [46]. The base data used for estimating long-term mean values derive from the European Space Agency’s Ocean Colour project (v.5), which uses remote sensing to estimate Chlorophyll A levels at a 4 km × 4 km resolution [47]. We summarized Chlorophyll A estimates for each beach by calculating the maximum values within the 1-mile buffer vicinity of the beach. We hypothesized that beaches associated with impaired coastal freshwater for ammonia and nutrients would have higher Chlorophyll A estimates in the connected beach.

2.4. Recreational Beach Use

Recreational beach use was estimated using the InVEST Recreation model. This model maps visitation rates by computing photo user days per year (PUDs/yr), the annual average of unique users who uploaded at least one photo to the website Flickr (years 2005–2017) for each cell.
The area of interest for this analysis was the one-mile buffer around each beach’s vicinity. To evaluate the results of the InVEST Recreation model, we compared the PUDs/yr values per beach to survey data from one year of visitors to Puerto Rico’s beaches [8]. The comparison suggests alignment with observed data (Supplementary Material S2) and supports our use of these data to estimate beach visitation.

2.5. Infrastructure Factors

Recreational ESs are also influenced by human-made infrastructure that affect accessibility and provide amenities [48,49]. To estimate amenities, we quantified the number of hotels and tour companies [50] and combined these values within the 1-mile buffer of each beach (Supplementary Material S1). To estimate accessibility, we estimated population density [51] within the 1-mile buffer (Supplementary Material S1). Our estimate of the percent impervious cover within the Huc-10 watershed (Section 2.2) also provides an indicator of accessibility.

2.6. Statistical Analysis

To examine the relationship between coastal freshwater (CFW-AU) impairment, water purification ESs, beach clarity, and beach visitation, we used an Analysis of Variance (ANOVA) approach. We evaluated whether N exports helped explain ammonia impairment, nutrient impairment, and oxygen depletion. We also evaluated whether P export was associated with nutrient impairment and oxygen depletion. Lastly, we assessed whether CFW-AU impairment was associated with Chlorophyll A levels in the beach site (i.e., our indicator of beach clarity) and with beach visitation rates (PUDs/yr).
We used a linear mixed-effect model [52] to further explore the drivers of beach visitation rates. Since we had several beaches belonging to the same watersheds (Table 1), we included the Huc-10 name as a random effect in the model. We applied a model averaging approach to test all possible variable combinations, limiting our predictors to one per ~10 sample unit replicates (i.e., models of 3 variables or less). The best models were identified via Akaike’s information criterion corrected for a small sample size (delta AICc < 2) and combined to obtain the averaged model coefficients. Prior to analysis, explanatory variables were mean-centered and standardized, and the response variable (average beach PUDs/yr) was transformed (log + 1) to ensure a normal distribution. We tested for collinearity among predictors using the Pearson correlation coefficient (Supplementary Material S3). Highly correlated variables (i.e., Pearson correlation ≥ 0.60) were not allowed to be used simultaneously in the regression models. Details of the model averaging approach can be found in [53]. All analyses were performed in R 4.4.1 [54].

3. Results

3.1. Coastal Freshwater Quality Impairment

Water purification ecosystem services were associated with coastal freshwater quality indicators. Nitrogen exports were positively associated with ammonia impairment of the coastal freshwater (p < 0.001 for both the Huc 10 and CFW-AU drainage scales). Nitrogen exports were also positively associated with CFW-AU nutrient impairment (p < 0.001 for both the Huc 10 and CFW-AU drainage scales) and with dissolved oxygen impairment (p < 0.001 for the Huc 10 scale and p = 0.005 for the CFW-AU drainage scale). Phosphorus exports were positively associated with nutrient impairment (p < 0.001 for both the Huc 10 and CFW-AU drainage scales) and with dissolved oxygen impairment (p < 0.001 for the Huc 10 scale, p = 0.002 for the CFW-AU drainage scale). Collectively, these results indicate that watershed nutrient (N and P) exports are associated with coastal freshwater impairment and coastal eutrophication indicators, highlighting the need for landscape level non-point source pollution management. Contrary to predictions, modeled sediment exports were not significantly associated with coastal water turbidity impairment.
Chlorophyll A levels were higher for beaches with coastal freshwaters impaired for ammonia (p = 0.002), nutrients (p = 0.039), dissolved oxygen (p = 0.011), and turbidity (p = 0.038). Beach visitation rates were also associated with coastal freshwater quality, but the direction of the associations was opposite to our prediction. A higher number of photo unit days per year (PUDs/yr) were recorded on beaches with CFW-AU impaired for ammonia (p < 0.001), nutrients (p < 0.001), dissolved oxygen (p = 0.08), and turbidity (p < 0.001). We show our ANOVA results for nutrient impairment, in association with N exports, beach water clarity, and beach visitation (Figure 2), which exemplifies all other significant associations. Our ANOVA results are summarized in Table 1.

3.2. Beach Visitation Rates

The model that best explained beach visitation rates included the number of amenities in the beaches’ vicinity (Pr(>|z|) < 0.001), and the % impervious surface cover in the beach’s drainage area (Pr(>|z|) = 0.01). Both variables were positively associated with the number of photo user days per year (Table 2). Other models that were within our criteria for acceptance (delta AICc < 2) substituted % impervious cover with parameters highly correlated to this variable (Table 2, Supplementary Material S3), including Huc-10 Nitrogen and Phosphorus exports (Pr(>|z|) = 0.04, Huc-10 sediment exports, and % vegetation (this last one with negative association). The association between recreational opportunities with anthropogenic indicators despite lower indicators of natural esthetics is opposite to our prediction but coincides with previous studies, as we discuss in the next section.

4. Discussion

This study evaluated the linkages between inland water purification ecosystem services, water quality, and beach visitation rates on the coast of Puerto Rico (PR). To our knowledge, this is the first study attempting to quantify the associations between inland processes influencing coastal water quality and indicators of actual beach recreational activity in the Island. Given that beach visitation and tourism are important components of coastal economies, especially in the Caribbean, the management of these ecosystem services is of relevance for sustainable community planning. Our study provides information to help address this need.
Our findings support the linkage between watershed-scale nutrient retention services and coastal water quality. Coastal freshwater sites associated with higher nutrient exports were impaired for ammonia, nutrients, and dissolved oxygen. The beaches associated with these impaired sites also had higher chlorophyll levels, an indicator of phytoplankton growth and lower water clarity. Our findings correspond to previous studies that have found non-point nutrient exports with reductions in coastal water quality [9,55], including a study in the Seine Bay which found that nutrient inputs from rivers corresponded to indicators of coastal eutrophication [56].
While watershed inputs of nutrients were linked to coastal water quality, we did not find support for our hypothesis of higher beach visitation rates in sites with higher water clarity and/or quality. The variables that were most closely associated with beach visitation were impervious cover and the number of amenities (hotels, tours) in the beach’s vicinity. This coincides with a previous study using the InVEST Recreation model on the northwestern coast of Portugal, where visitors preferred nearby, easily accessed areas for recreation [49]. Hotels may be especially important in determining visitation rates, as tourists strongly prefer lodging near the beach [53]. In the Italian Adriatic Sea, there was also a mismatch between the beach’s natural quality and visitation rates, as urban and accessible beaches were the most regularly visited, as opposed to those with better indicators of naturalness [48]. Similarly, in the Three Gorges Reservoir area, China, recreational activity was most strongly associated with accessibility and urban infrastructure features, and less with indicators of natural landscape features [57]. Surveys conducted on the coasts of Colombia and Florida suggest that beach visitors look for proximity and the presence of amenities [58], which corresponds to our findings as well. Overall, these studies reiterate the important role of accessibility, amenities, and destinations as key drivers of the recreational use of natural areas.
While beach visitors may initially select sites by proximity and convenience, water quality is an important factor for beach visitation enjoyment [58], and it may influence their satisfaction and willingness to return in the future. In Puerto Rico, a recent survey of coral reef visitors showed that beach water clarity was lower than the visitor’s expectations [8]. While the authors clarify that the difference was minimal, it does suggest that there is room for improving visitor’s experience, as changes in behavior may follow dissatisfaction, potentially leading beach visitors to consider other destinations in the future if their expectations are not met [8]. It is possible that beachgoers would exhibit a willingness to pay for the preservation of water purification ESs if they had a better understanding of the potential linkages to water clarity improvements. In previous studies [59,60], surveyed beach users expressed a willingness to pay to enter a beach with greater environmental quality and for improvements in water clarity. While our study shows that the most visited beaches are those that are most accessible, they are also the most impacted by watershed nutrient and sediment exports. Watershed management for these highly visited beaches (Figure 1) may be possible with education and payment for ecosystem service programs that include beach visitors as the target audience [6,61]. On the other hand, our study’s findings regarding a lack of association between beach visitation and water quality indicators may suggest that the level of impairment is not yet perceptible to visitors. It is possible that water quality degradation after a given threshold could be perceived by tourists affecting their visitation rates. Exploring these potential water quality perception thresholds through comparative case studies could be the focus of future research on this topic.
Our study had several limitations. First, the InVEST water purification and sediment retention models only aim at estimating overland transport and do not account for within-stream retention processes. Therefore, our estimates should be interpreted with this consideration in mind. These models, however, have been validated elsewhere for PR [33,34], and we are confident that they represent relative differences among the watersheds under analysis. The InVEST Recreation model is based on images uploaded to the website Flickr, and therefore, the estimated visitation rates reflect trends from visitors who also use this website. In addition, while app use tracking is considered a suitable indicator of recreational and cultural ESs [62], the use of these type of data may be biased towards certain demographic groups and a combination of methods (app tracking, surveys, park entrance data, etc.) may provide a better characterization of beach visitation rates in the future. Despite these limitations, the visitation rates that we report here correspond to those observed by survey-based studies based on the Island (Supplementary Material S2), providing justification for our findings as a basis for designing future studies and making preliminary management decisions across PR. Our analysis was limited to the beaches with existing connections to monitored coastal freshwater bodies. Therefore, future analyses may focus on regions that were underrepresented in this study, such as the South and Southeast coast of PR.
Aside from our modeling limitations, the assumptions that we made for this analysis should be noted. We assumed that people uploading pictures at the selected beaches were also interacting with the water in some capacity (swimming, wading, etc.) and that therefore, their preference for one beach over another may be influenced by water quality. We also assumed that coastal freshwater impairment and relatively higher beach Chlorophyll levels would correspond to perceptible changes in the appearance of beach water and therefore affect visitors’ perceptions. The veracity of these assumptions needs to be evaluated in the future with field-based studies or by using more extensive modeling approaches. Our study did not fully account for potential differences in water quality or beach visitation due to local geomorphological differences among the beaches studied (i.e., sandy vs. rocky beaches, beaches with dunes, mangroves, or lagoons) [25]. These differences may be important to consider in future studies.

5. Conclusions

In Puerto Rico, urbanized beaches with more amenities receive higher visitation rates than those with greater inland water purification ecosystem services. These results suggest that visitors may prioritize accessibility and convenience over the natural esthetics of the visited beaches. The implications of this mismatch may include visitors having unmet expectations of water clarity, which should be explored further. The InVEST modeling platform provides a tool for the rapid assessment of recreational behavior, coupled with watershed management prioritization. For example, our study identifies the beaches most impacted by sediment and nutrient exports, as well as those that are economically important destinations. This information can be used to develop educational opportunities and payment for ecosystem service programs in Puerto Rico. Our study can also be used as a model to replicate the process of linking watershed management with recreational opportunities in other locations. Managing watershed-scale water purification is important for coastal water clarity conservation. Advancing these goals requires the availability of maps and datasets that can communicate land–coastal linkages to relevant stakeholders (i.e., beach visitors). Our study provides information that can be used towards this purpose.

Supplementary Materials

The following supporting information can be downloaded at: https://www.mdpi.com/article/10.3390/su17062556/s1, Supplementary Material S1: Raw Data. Supplementary Material S2: Comparison of Recreation Model with Observations. Supplementary Material S3: Pearson Correlation Coefficients of Predictor Variables.

Author Contributions

Conceptualization, R.d.J.C. and T.D.; methodology, R.d.J.C., M.V.-C., and M.C.; software, M.V.-C. and M.C.; validation, M.V.-C., M.C., and R.d.J.C.; formal analysis, R.d.J.C., M.C., and M.V.-C.; investigation, M.C., M.V.-C., and R.d.J.C.; resources, T.D. and M.C.; data curation, M.C. and M.V.-C.; writing—original draft preparation, M.C.; writing—review and editing, R.d.J.C.; visualization, R.d.J.C.; supervision, R.d.J.C.; project administration, T.D. and R.d.J.C.; funding acquisition, T.D. All authors have read and agreed to the published version of the manuscript.

Funding

This research was funded by the Puerto Rico Sea Grant (NA22OAR4170097) and the REU Site program at El Verde Field Station, North Carolina State University (NSF-grant number DBI-2050805).

Institutional Review Board Statement

Not applicable.

Informed Consent Statement

Not applicable.

Data Availability Statement

Our data are available in Supplementary Material S1.

Conflicts of Interest

The authors declare no conflicts of interest.

References

  1. Mehvar, S.; Filatova, T.; Dastgheib, A.; De Ruyter van Steveninck, E.; Ranasinghe, R. Quantifying economic value of coastal ecosystem services: A review. J. Mar. Sci. Eng. 2018, 6, 5. [Google Scholar] [CrossRef]
  2. Wood, S.A.; Guerry, A.D.; Silver, J.M.; Lacayo, M. Using social media to quantify nature-based tourism and recreation. Sci. Rep. 2013, 3, 2976. [Google Scholar] [CrossRef]
  3. National Oceanic and Atmospheric Administration (NOAA). Tourism and Recreation. 2024. Available online: https://coast.noaa.gov/states/fast-facts/tourism-and-recreation.html (accessed on 10 January 2025).
  4. National Oceanic and Atmospheric Administration (NOAA). Marine Economy Report. Caribbean Territories. 2024. Available online: https://coast.noaa.gov/data/digitalcoast/pdf/marine-economy-caribbean-territories.pdf (accessed on 10 January 2025).
  5. Lankia, T.; Lintunen, J.; Neuvonen, M.; Pouta, E.; Store, R. Piloting accounts for recreational ecosystem services: Quality, use, and monetary value of freshwaters in Finland. Water Resour. Econ. 2023, 41, 100215. [Google Scholar] [CrossRef]
  6. Peng, M.; Oleson, K.L. Beach recreationalists’ willingness to pay and economic implications of coastal water quality problems in Hawaii. Ecol. Econ. 2017, 136, 41–52. [Google Scholar] [CrossRef]
  7. Pouso, S.; Uyarra, M.C.; Borja, Á. The recovery of estuarine quality and the perceived increase of cultural ecosystem services by beach users: A case study from northern Spain. J. Environ. Manag. 2018, 212, 450–461. [Google Scholar] [CrossRef]
  8. Leeworthy, V.R.; Schwarzmann, D.; Hughes, S.; Vaughn, J.; Harris, D.; Padilla, G. Visitor Profiles: Reef Users, Puerto Rico Coral Reef Valuation; Office of National Marine Sanctuaries, National Oceanic and Atmospheric Administration: Silver Spring, MD, USA, 2018. Available online: https://www.coris.noaa.gov/activities/projects/pr_reef_ecosystem_valuation/tl_data.html (accessed on 10 January 2025).
  9. Howarth, R.W.; Sharpley, A.; Walker, D. Sources of nutrient pollution to coastal waters in the United States: Implications for achieving coastal water quality goals. Estuaries 2002, 25, 656–676. [Google Scholar] [CrossRef]
  10. Oelsner, G.P.; Stets, E.G. Recent trends in nutrient and sediment loading to coastal areas of the conterminous US: Insights and global context. Sci. Total Environ. 2019, 654, 1225–1240. [Google Scholar] [CrossRef]
  11. Nie, J.; Feng, H.; Witherell, B.B.; Alebus, M.; Mahajan, M.D.; Zhang, W.; Yu, L. Causes, assessment, and treatment of nutrient (N and P) pollution in rivers, estuaries, and coastal waters. Curr. Pollut. Rep. 2018, 4, 154–161. [Google Scholar] [CrossRef]
  12. Gilbert, M. The role of eutrophication in the global proliferation of harmful algal blooms. Oceanogry 2005, 18, 198–209. [Google Scholar] [CrossRef]
  13. Canto, M.M.; Fabricius, K.E.; Logan, M.; Lewis, S.; McKinna, L.I.; Robson, B.J. A benthic light index of water quality in the Great Barrier Reef, Australia. Mar. Pollut. Bull. 2021, 169, 112539. [Google Scholar] [CrossRef]
  14. Guerra, C.A.; Maes, J.; Geijzendorffer, I.; Metzger, M.J. An assessment of soil erosion prevention by vegetation in Mediterranean Europe: Current trends of ecosystem service provision. Ecol. Indic. 2016, 60, 213–222. [Google Scholar] [CrossRef]
  15. Hamel, P.; Chaplin-Kramer, R.; Sim, S.; Mueller, C. A new approach to modeling the sediment retention service (InVEST 3.0): Case study of the Cape Fear catchment, North Carolina, USA. Sci. Total Environ. 2015, 524, 166–177. [Google Scholar] [CrossRef]
  16. Berg, C.E.; Mineau, M.M.; Rogers, S.H. Examining the ecosystem service of nutrient removal in a coastal watershed. Ecosyst. Serv. 2016, 20, 104–112. [Google Scholar] [CrossRef]
  17. Mancuso, G.; Bencresciuto, G.F.; Lavrnić, S.; Toscano, A. Diffuse water pollution from agriculture: A review of nature-based solutions for nitrogen removal and recovery. Water 2021, 13, 1893. [Google Scholar] [CrossRef]
  18. Kreitler, J.; Papenfus, M.; Byrd, K.; Labiosa, W. Interacting coastal based ecosystem services: Recreation and water quality in Puget Sound, WA. PLoS ONE 2013, 8, e56670. [Google Scholar] [CrossRef]
  19. Smith, A.; Yee, S.H.; Russell, M.; Awkerman, J.; Fisher, W.S. Linking ecosystem service supply to stakeholder concerns on both land and sea: An example from Guánica Bay watershed, Puerto Rico. Ecol. Indic. 2017, 74, 371–383. [Google Scholar] [CrossRef]
  20. Byczek, C.; Longaretti, P.-Y.; Renaud, J.; Lavorel, S. Benefits of crowd-sourced GPS information for modelling the recreation ecosystem service. PLoS ONE 2018, 13, e0202645. [Google Scholar] [CrossRef] [PubMed]
  21. US Census. Quick Facts Puerto Rico. 2023. Available online: https://www.census.gov/quickfacts/PR (accessed on 11 January 2025).
  22. Discover Puerto Rico. Facts About Puerto Rico. 2024. Available online: https://www.discoverpuertorico.com/info/facts-about-puerto-rico (accessed on 11 January 2025).
  23. USGS. Climate of Puerto Rico. 2016. Available online: https://www.usgs.gov/centers/cfwsc/science/climate-puerto-rico (accessed on 11 January 2025).
  24. DRNA. Valoracion de Playas en Puerto Rico. 2022. Available online: https://www.drna.pr.gov/wp-content/uploads/2022/10/Informe-Final-Valorizacion-de-Playas-30-SEPT-2022.pdf (accessed on 11 January 2025).
  25. Chaparro, R.N.D. Desinversión y Desinterés: La Situación en el Manejo de las Playas en Puerto Rico. Available online: https://issuu.com/seagrantpr/docs/prsg-public-policy-position-papers (accessed on 11 January 2025).
  26. Puerto Rico GIS. Balnearios 2016. 2016. Available online: https://gis.pr.gov/descargaGeodatos/Dotaciones/Pages/Recreaci%C3%B3n.aspx (accessed on 11 January 2025).
  27. USGS. N.D. National Hydrography Dataset (NHD). Available online: https://www.usgs.gov/national-hydrography/access-national-hydrography-products (accessed on 11 January 2025).
  28. USEPA. ATTAINS Water Quality Assessment GIS Dataset. 2024. Available online: https://www.epa.gov/waterdata/waters-geospatial-data-downloads#ATTAINSWaterQualityAssessmentGISDataset (accessed on 11 January 2025).
  29. Natural Capital Project. Integrated Valuation of Ecosystem Services. 2024. Available online: https://naturalcapitalproject.stanford.edu/software/invest (accessed on 11 January 2025).
  30. Renard, K.; Foster, G.; Weesies, G.; McCool, D.; Yoder, D. Predicting Soil Erosion by Water: A Guide to Conservation Planning with the Revised Soil Loss Equation; U.S. Department of Agriculture, Agricultural Research Service: Maryland, MA, USA, 1997.
  31. Quinones, F. Recursos de Agua de Puerto Rico: Embalses Principales de Puerto Rico. 2022. Available online: https://www.recursosaguapuertorico.com/Embalses-Principales.html (accessed on 11 January 2025).
  32. National Water Quality Monitoring Council. Water Quality Portal. 2023. Available online: https://www.epa.gov/awma/national-water-quality-monitoring-council (accessed on 11 January 2025).
  33. Valladares-Castellanos, M.; de Jesús Crespo, R.; Xu, Y.J.; Douthat, T.H. A framework for validating watershed ecosystem service models in the United States using long-term water quality data: Applications with the InVEST Nutrient Delivery (NDR) model in Puerto Rico. Sci. Total Environ. 2024, 949, 175111. [Google Scholar] [CrossRef]
  34. Crespo, R.D.J.; Valladares-Castellanos, M.; Mihunov, V.V.; Douthat, T.H. Going with the flow: The supply and demand of sediment retention ecosystem services for the reservoirs in Puerto Rico. Front. Environ. Sci. 2023, 11, 1214037. [Google Scholar] [CrossRef]
  35. NOAA C-CAP. High Resolution Land Cover. 2023. Available online: https://coastalimagery.blob.core.windows.net/ccap-landcover/CCAP_bulk_download/High_Resolution_Land_Cover/Phase_1_Initial_Layers/index.html (accessed on 11 January 2025).
  36. ESRI. ArcGIS (Version 10.4.1). 2016. Available online: https://www.esri.com/en-us/arcgis/products/arcgis-pro/overview (accessed on 11 January 2025).
  37. US EPA. Ammonia. 2024. Available online: https://www.epa.gov/caddis/ammonia#:~:text=The%20resulting%20dissolved%20oxygen%20reductions (accessed on 11 January 2025).
  38. USEPA. Aquatic Life Ambient Water Quality Criteria for Ammonia Freshwater. 2015. Available online: https://www.epa.gov/sites/default/files/2015-08/documents/aquatic-life-ambient-water-quality-criteria-for-ammonia-freshwater-2013.pdf (accessed on 11 January 2025).
  39. USEPA. Protocol for Developing TMDL. 1999. Available online: https://nepis.epa.gov/Exe/ZyPDF.cgi/20004PB2.PDF?Dockey=20004PB2.PDF (accessed on 11 January 2025).
  40. USEPA. Dissolved Oxygen Factsheet. 2021. Available online: https://www.epa.gov/system/files/documents/2021-07/parameter-factsheet_do.pdf (accessed on 11 January 2025).
  41. USEPA. Sediments. 2024. Available online: https://www.epa.gov/caddis/sediments (accessed on 11 January 2025).
  42. USEPA. List of State-Specific Water Quality Standards for Turbidity. 2022. Available online: https://www.epa.gov/system/files/documents/2022-01/list-of-state-specific-water-quality-standards.pdf (accessed on 11 January 2025).
  43. USEPA. Indicators: Chlorophyll a. 2025. Available online: https://www.epa.gov/national-aquatic-resource-surveys/indicators-chlorophyll (accessed on 19 February 2015).
  44. Angradi, T.R.; Ringold, P.L.; Hall, K. Water clarity measures as indicators of recreational benefits provided by US lakes: Swimming and aesthetics. Ecol. Indic. 2018, 93, 1005–1019. [Google Scholar] [CrossRef]
  45. Hoyer, M.V.; Frazer, T.K.; Notestein, S.K.; Canfield, D.E., Jr. Nutrient, chlorophyll, and water clarity relationships in Florida’s nearshore coastal waters with comparisons to freshwater lakes. Can. J. Fish. Aquat. Sci. 2002, 59, 1024–1031. [Google Scholar] [CrossRef]
  46. ESRI Oceans. Chlorophyll-a 20-Year Long-Term Mean (2000–2019). 2023. Available online: https://www.arcgis.com/home/item.html?id=0a1dc1490321474d924d9cf241466bf6 (accessed on 11 January 2025).
  47. Sathyendranath, S.; Jackson, T.; Brockmann, C.; Brotas, V.; Calton, B.; Chuprin, A.; Clements, O.; Cipollini, P.; Danne, O.; Dingle, J.; et al. (2021): ESA Ocean Colour Climate Change Initiative (Ocean_Colour_cci): Version 5.0 Data. NERC EDS Centre for Environmental Data Analysis, 19 May 2021. Available online: https://catalogue.ceda.ac.uk/uuid/1dbe7a109c0244aaad713e078fd3059a/ (accessed on 11 January 2025).
  48. Depellegrin, D.; Llambrich, C.M.; Roy, S.; Anbleyth-Evans, J.; Bongiorni, L.; Menegon, S. Risk-based analysis of recreational ecosystem services supply and demand in beach areas of the Adriatic Sea. Ocean. Coast. Manag. 2023, 243, 106725. [Google Scholar] [CrossRef]
  49. Cunha, J.; Elliott, M.; Ramos, S. Linking modelling and empirical data to assess recreation services provided by coastal habitats: The case of NW Portugal. Ocean. Coast. Manag. 2018, 162, 60–70. [Google Scholar] [CrossRef]
  50. Puerto Rico GIS. Hoteles, Paradores. 2021. Available online: https://gis.pr.gov/descargaGeodatos/Desarrollo_Economico/Pages/Turismo.aspx (accessed on 11 January 2025).
  51. US Census. 2020. Available online: https://www.census.gov/geographies/reference-maps/2020/geo/2020-census-block-maps.html (accessed on 11 January 2025).
  52. Bates, D.; Mächler, M.; Bolker, B.; Walker, S. Fitting Linear Mixed-Effects Models Using lme4. J. Stat. Softw. 2015, 67, 1–48. [Google Scholar] [CrossRef]
  53. Grueber, C.E.; Nakagawa, S.; Laws, R.J.; Jamieson, I.G. Multimodel inference in ecology and evolution: Challenges and solutions. J. Evol. Biol. 2011, 24, 699–711. [Google Scholar] [CrossRef]
  54. R Core Development Team. R: A Language and Environment for Statistical Computing. (Version 4.4.1). 2024. Available online: http://www.r-project.org (accessed on 11 January 2025).
  55. Arhonditsis, G.; Tsirtsis, G.; Angelidis, M.O.; Karydis, M. Quantification of the effects of nonpoint nutrient sources to coastal marine eutrophication: Applications to a semi-enclosed gulf in the Mediterranean Sea. Ecol. Model. 2000, 129, 209–227. [Google Scholar] [CrossRef]
  56. Romero, E.; Garnier, J.; Lassaletta, L.; Billen, G.; Le Gendre, R.; Riou, P.; Cugier, P. Large-scale patterns of river inputs in southwestern Europe: Seasonal and interannual variations and potential eutrophication effects at the coastal zone. Biogeochemistry 2013, 113, 481–505. [Google Scholar] [CrossRef]
  57. Zhao, D.; Xiao, M.; Huang, C.; Liang, Y.; An, Z. Landscape dynamics improved recreation service of the Three Gorges Reservoir Area, China. Int. J. Environ. Res. Public Health 2021, 18, 8356. [Google Scholar] [CrossRef] [PubMed]
  58. Botero, C.; Anfuso, A.; Williams, A.T.; Zielinski, S.; Silva, C.P.; Cervantes, O.; Silva, L.; Cabrera, J.A. Reasons for beach choice: European and Caribbean perspectives. J. Coast. Res. 2013, 65, 880–885. [Google Scholar] [CrossRef]
  59. Beharry-Borg, N.; Scarpa, R. Valuing quality changes in Caribbean coastal waters for heterogeneous beach visitors. Ecol. Econ. 2010, 69, 1124–1139. [Google Scholar] [CrossRef]
  60. Loomis, J.; Santiago, L. Economic valuation of beach quality improvements: Comparing incremental attribute values estimated from two stated preference valuation methods. Coast. Manag. 2013, 41, 75–86. [Google Scholar] [CrossRef]
  61. Leotaud, N. Linking Tourism to Watersheds and People: A Preliminary Analysis of the Potential of the Tourism Sector to Contribute to Payments for Watershed Services in Dunns River, Ocho Rios, Jamaica and Speyside, Tobago; Who Pays for Water Project Document No 3; Tobago and International Institute for Environment and Development: London, UK, 2006. [Google Scholar]
  62. Richards, D.R.; Friess, D.A. A rapid indicator of cultural ecosystem service usage at a fine spatial scale: Content analysis of social media photographs. Ecol. Indic. 2015, 53, 187–195. [Google Scholar] [CrossRef]
Figure 1. Map depicting the location of study beaches with the average number of picture days per year (PUD/YR) and their respective watersheds (Huc-10) and coastal freshwater assessment units (impairment shown in terms of nutrients). The map background depicts impervious cover across the Island.
Sustainability 17 02556 g001
Figure 2. Box-plots illustrating the associations found between nutrient impairment in coastal freshwater assessment units (CFW-AU) and the following response variables: (A) Huc-10 watershed Nitrogen exports, (B) beach Chlorophyll-A levels, and (C) beach visitation rates. The response variable units and transformations are described in Section 2.4.
Sustainability 17 02556 g002
Table 1. Analysis of Variance (ANOVA) results linking water purification ES, CFW-AU impairment, and beach visitation. * CFW-AU stands for the coastal freshwater assessment unit. All models have degrees of freedom equal to 1.
Water Purification ES and CFW-AU * ImpairmentMeanSqFvaluePr(>F)
N export ~Ammonia Impairment
CFW-AU drainage31.171363.5<0.001
Huc-1026.691120.5<0.001
N export~Nutrient Impairment
CFW-AU drainage24.63986.86<0.001
Huc-1020.851.98<0.001
N export~Dissolved Oxygen Impairment
CFW-AU drainage7.3639.1210.00485
Huc-1010.0813.91<0.001
P export~Nutrient Impairment
CFW-AU drainage22.9168.14<0.001
Huc-1021.3855.87<0.001
P export~Dissolved Oxygen Impairment
CFW-AU drainage8.45810.930.00229
Huc-1010.5414.820.000514
Sediment export~Turbidity Impairment
CFW-AU drainage2.46232.570.118
Huc-103.0453.2460.0808
Beach Water Clarity and CFW-AU * ImpairmentMeanSqFvaluePr(>F)
Beach Chlorophyll A~Ammonia Impairment8.79611.520.00181
Beach Chlorophyll A~Nutrient Impairment4.1814.6270.0389
Beach Chlorophyll A~Dissolved Oxygen Impairment6.1557.2950.0108
Beach Chlorophyll A~Turbidity Impairment4.2274.6850.0378
Beach Visitation and CFW-AU * ImpairmentMeanSqFvaluePr(>F)
PUD/yr~Ammonia Impairment32.7520.27<0.001
PUD/yr~Nutrient Impairment29.2717.01<0.001
PUD/yr~Dissolved Oxygen Impairment16.928.0750.00764
PUD/yr~Turbidity Impairment34.2421.8<0.001
Table 2. Model averaging results. Variable definitions: N (Nitrogen), P (Phosphorus), Sed (Sediment), H10 (Hydrologic Unit Code 10 watershed). Additional details of this analysis are provided in Section 2.4 of the text.
Averages for Selected Variables
VariablesEstimateS.E.z valuePr(>|z|)
Intercept2.590.299.08< 0.001
Amenities0.50.183.58<0.001
% Impervious0.850.342.520.01
P Export (H10)0.730.352.070.04
N Export (H10)0.700.342.070.04
% Vegetation−0.200.410.480.63
Sed Export (H10)0.120.240.500.62
Model Rankings
Selected ModelsdflogLikdAICcweight
Amenities + %Impervious5−47.9300.23
Amenities + P Export (H10)5−48.30.760.16
Amenities + N Export (H10)5−48.350.850.15
Amenities + %Vegetation+ Sed Export (H10)6−46.981.030.14
Amenities + %Impervious+ Sed Export (H10)6−47.141.370.12
Amenities4−50.121.650.1
Amenities + %Vegetation5−48.851.850.09
Disclaimer/Publisher’s Note: The statements, opinions and data contained in all publications are solely those of the individual author(s) and contributor(s) and not of MDPI and/or the editor(s). MDPI and/or the editor(s) disclaim responsibility for any injury to people or property resulting from any ideas, methods, instructions or products referred to in the content.

