Article

Sustainable Reservoir Management: Simulating Water Flooding to Optimize Oil Recovery in Heterogeneous Reservoirs Through the Evaluation of Relative Permeability Models

1
Energy Systems Engineering, Faculty of Engineering and Applied Science, University of Regina, Regina, SK S4S 0A2, Canada
2
National Key Laboratory of Continental Shale Oil, Northeast Petroleum University, Daqing 163318, China
3
DWA Energy Limited, Lincoln LN6, UK
*
Author to whom correspondence should be addressed.
Sustainability 2025, 17(6), 2526; https://doi.org/10.3390/su17062526
Submission received: 16 February 2025 / Revised: 6 March 2025 / Accepted: 10 March 2025 / Published: 13 March 2025
(This article belongs to the Section Resources and Sustainable Utilization)

Abstract

:
The relative permeability of a fluid plays a vital role in numerical simulation studies of multiphase flow. Several empirical models are used to estimate relative permeability, but these models are often inaccurate due to differences in the assumptions under which it is formulated. A specific model of relative permeability can significantly impact the results of a simulation, so it is essential to select the most appropriate model. This study incorporates the numerical simulation of water flooding into several well-known classical and non-linear predictive models of relative permeability. Based on the comparison of classical predictive models, the results reveal that the predictions from the classical models were more closely aligned with experimental data during the pre-water injection phase. However, after the water injection, the models overestimated the average reservoir pressure. Due to this limitation, all classical models were unable to match water-cut data accurately. In contrast, the proposed non-linear model demonstrated superior performance in matching the water-cut data. Compared to classical models, it accurately predicted water cut and reservoir performance. The proposed model developed for sandstone reservoirs was able to predict krw (the relative permeability of water) and kro (the relative permeability of oil) with low errors (RMSE = 0.028 and 0.01, respectively). The R2 values of the proposed model for kro and krw were 0.97 and 0.98, indicating excellent agreement with the experimental results. The proposed model also demonstrated a significant improvement in the accuracy of simulation data matching after water injection. Additionally, this model provides flexibility in parameter tuning and a solid foundation for relative permeability model development. By improving relative permeability modeling, this study enhances water flooding simulations for more efficient resource utilization and reduced environmental impact. This new approach improves the selection and development of appropriate models for numerical simulations of water flooding in sandstone reservoirs thereby enhancing predictions of reservoir performance.

1. Introduction

The relative permeability of reservoirs plays an important role in understanding multiphase flow behavior [1,2,3]. Multiphase flow is a very complex process that is highly dependent on the properties of the rock and the fluid in the reservoir. Reservoir injection, production, and recovery methods require an understanding of multiphase flow behavior. Reservoir simulation is the most widely used technique for predicting a reservoir’s response to various production strategies. The accuracy of numerical simulations is highly dependent upon the accuracy of the rock-fluid properties entered into the simulator [4]. Core samples are usually analyzed using multiphase analysis to determine relative permeability. Flow rate and pressure conditions can be evaluated based on experimentation [5] and available historical field performance data. However, experimental testing is time-consuming and is typically only available for certain wells in an oil field reservoir, limiting the ability to simulate multiphase flow numerically. This limitation necessitates developing and using predictive models for estimating relative permeability. Based on accurate relative permeability inputs, numerical simulations of multiphase flows can be carried out more effectively.
Although for effective reservoir simulation, relative permeability prediction models are essential, and such data are typically estimated from numerical simulations in the absence of experimental data [2]. Linear and non-linear regression models are commonly used to calculate the relative permeability of a simulated reservoir based on its petrophysical properties [6]. An appropriate relative permeability model is selected based on similarities in lithological and petrophysical characteristics. The model coefficients are modified using the best fit and least root mean square error algorithms to achieve accurate predictions for varying conditions. These predictive models are used in a variety of reservoir simulations related to enhanced recovery processes. The accuracy of these models is, therefore, crucial, particularly when it comes to applications such as water flooding, which is a widely applied technique for maximizing oil recovery after the initial phase of recovery and is typically the secondary oil recovery method of choice [7,8,9,10].
Classic relative permeability models have limited accuracy depending on the assumptions considered. The classical methods do not account for the effects of disconnected seepage channels on the permeability of the reservoir. The consideration of the wetting phase in small pores and the non-wetting phase in larger pores limits the Purcell [11] model to simulating the displacement of the wetting phase by the non-wetting phase in unconventional reservoirs. Adding the tortuosity to the base model improves the results but increases the need for experimentation for the tortuosity factor [12].
The predictive ability of the Brooks and Corey [13] model is limited due to its sole dependence on saturation and variable residual saturation in storage and production operations in the reservoir. The resulting discontinuities in saturation are due to the mishandling of hysteresis by the model, which may affect the accuracy of the numerical simulation [14]. The predictions of the Pirson [15] model also do not fit the experimental data, requiring the application of correction coefficients to achieve acceptable accuracy [16].
The relative permeability model approach based on the capillary tube model led Chai et al. [17] to develop a theoretical relative permeability model for tight reservoirs. Guo, Chen [17] developed a similar relative permeability model for hydrate sediments. The inclusion of the capillary bundle model for seepage channels was further tested by the Li [18] approach for shale reservoirs. The generalization of these models was improved by the introduction of the fractal theory. Wang, Dong [19], Zhang, Wu [20], and Liu, Dai [21] developed relative permeability models by integrating relative permeability concepts with fractal theory. Despite introducing new ideas to conventional relative permeability models, such models were not able to consider the transient interfacial dynamics during multiphase displacement processes or the exclusion of residual non-wetting phase trapping [18,22]. These limitations show that potential exists to develop new relative permeability methods that overcome these issues.
Since numerical simulation is capable of incorporating a wide range of field variables, it is the preferred method for studying water flooding mechanisms at the field scale [23]. To enhance efficiency and reduce costs, predictive models that incorporate empirical, statistical, and machine-learning principles are frequently used to estimate relative permeability. Incorporating relative permeability incorrectly into numerical simulations can result in inaccurate estimates of reservoir pressure, oil production rate, recovery factor, and other parameters [24]. A carefully selected relative permeability model is essential for obtaining accurate numerical simulations, particularly for reservoirs characterized by spatial heterogeneity and anisotropy [25].
This study illustrates the potential to improve the accuracy of water flooding simulations with a new relative permeability prediction model, thereby providing motivation and optimism for its future applications. Capillary data were used to predict relative permeability using classical empirical models. This study develops an improved generalized relative permeability prediction method involving a non-linear predictive model (NLPM). The accuracy of the developed model can be controlled by minimizing the root mean square error (RMSE) between predicted and experimental data. An analysis of the well logs, the mud logs, and the core data were conducted to develop a static model of the studied reservoir. The effects of all classical and experimentally developed relative permeability models on reservoir performance during water flooding were examined using a numerical simulation method. The results emphasize the benefits of understanding the impacts of relative permeability models on reservoir performance during water flooding, and that estimates based on classical relative permeability models do not provide sufficient accuracy.

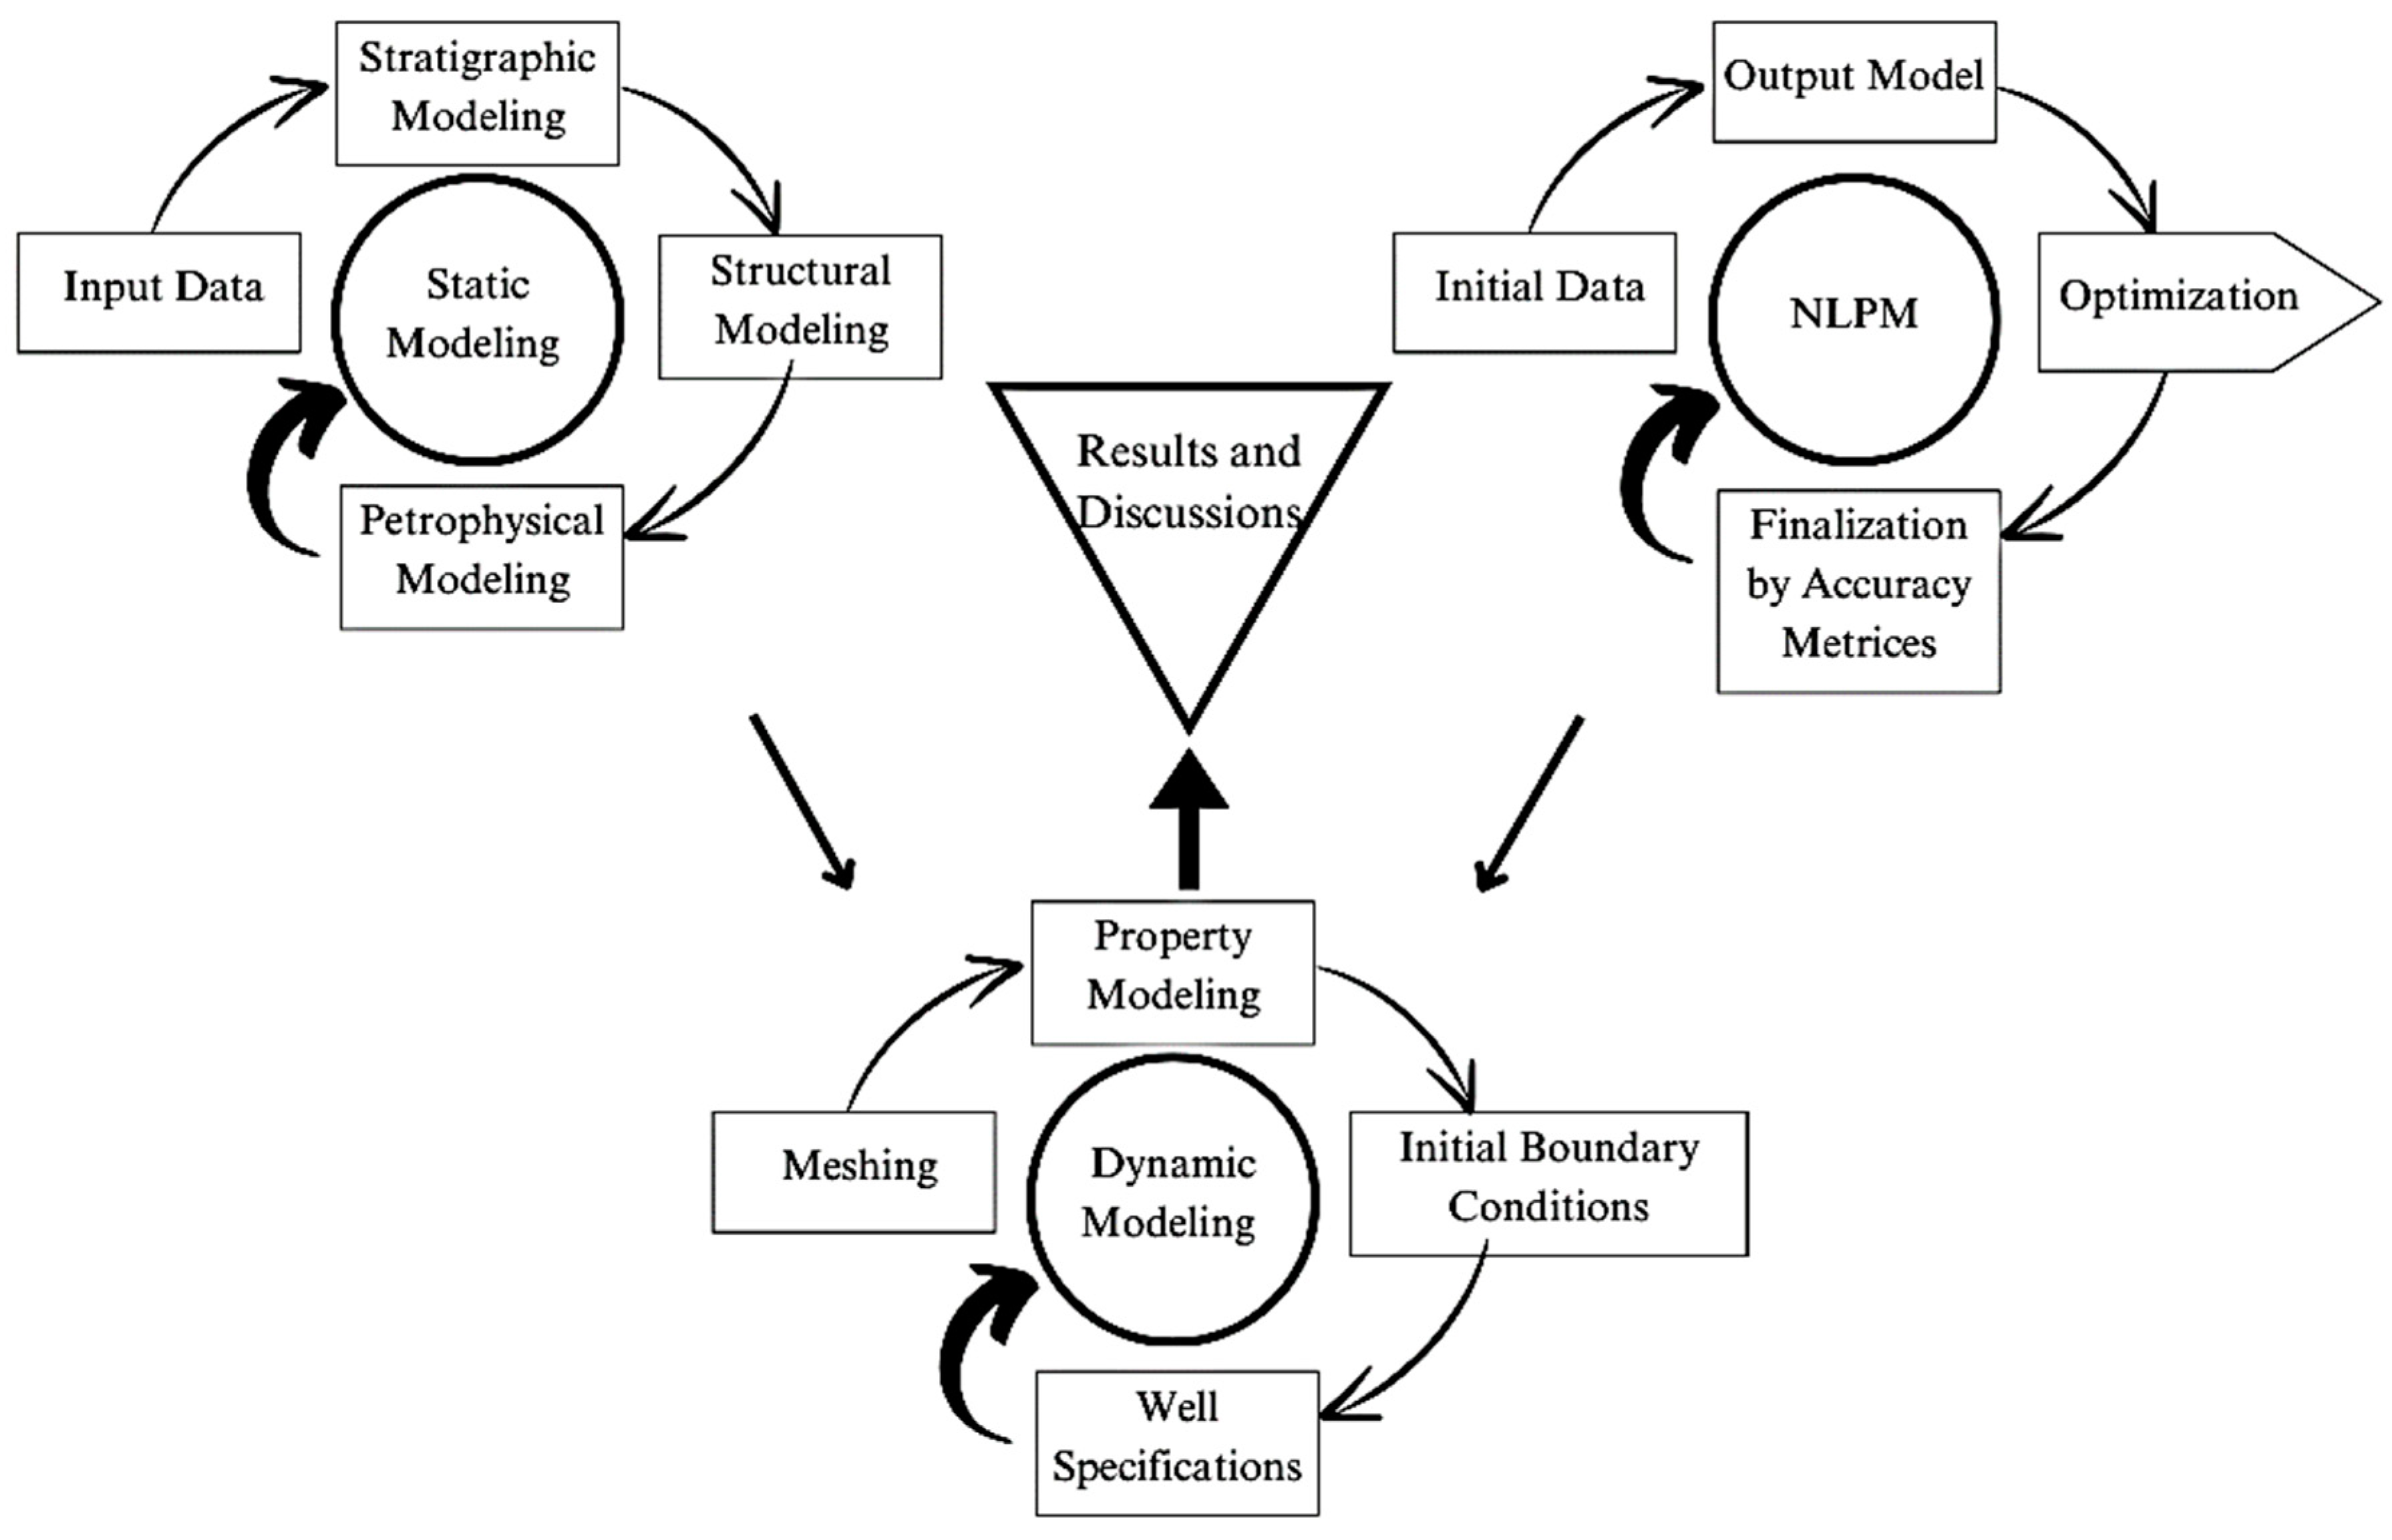
2. Method and Materials

2.1. Relative Permeability Models

The relative permeability of a two-phase flow in a reservoir can be predicted using various classical models. These models predict the wetting phase using statistical, numerical, and machine-learning methods. In analytical models, capillary tubes are commonly used to constitute the porous media [11,12,26]. Li and Horne [27] determined that relative permeability depends on capillary pressure and reservoir heterogeneity. Corey [28] used a linear regression relationship to correlate wetting phase saturation with capillary pressure, as defined by Equations (1) and (2). This model assumes that the saturation of wetting and non-wetting phases is independent of other phases.
1 P c 2 = C S w D
S w D = S w S w r 1 S n w i S w r
where C is a constant, SwD is normalized saturation, Sw is the wetting phase saturation, Snwi is the initial saturation of the non-wetting phase, Swr is the residual saturation of the wetting phase, and Pc is capillary pressure. The krw and kro can be related to S w D (Equations (3) and (4)) as shown by Corey [28].
k r w = ( S w D ) 4
k r o = 1 S w D 2 1 S w D 2
Brooks and Corey [13] modified the Corey [28] model by introducing the pore size distribution (λ), as shown in Equations (5) and (6).
k r w = ( S w D ) ( 2 + 3 λ ) / λ
k r o = 1 S w D 2 ( 1 S w D 2 + λ λ )
Purcell [11] also related the capillary pressure with the wetting phase saturation (Sw) by incorporating the expression relating Pc with entry capillary pressure (Pe) andSwD with consideration of λ (Equations (7)–(9)) into the relationships defined by Brooks and Corey [13].
P c = P e   ( S w D ) 1 λ
k r w = 0 S w d S w ( P c ) 2 0 1 d S w ( P c ) 2
k r o = S w 1 d S w ( P c ) 2 0 1 d S w ( P c ) 2
Some of the main limitations of the Purcell [11] model include the omission of the phase trapping phenomenon, the Jamin effect, and the positive curvature of gas relative permeability. Such limitations reduced the accuracy of non-wetting phase relative permeability predictions. Equations (10) and (11) show that the Purcell [11] model can be reduced to form the following relative permeability model.
k r w = ( S w D ) 2 + λ λ
k r o = ( 1 S w D ) 2 + λ λ
Purcell [11] also related the normalized saturation with relative permeability (Equations (12) and (13)), relationships which can be usefully applied in water flooding simulations [29,30].
k r w = S w D × S w   3
k r o = 1 S w D [ 1 S w D 0.25 ( S w ) ] 0.5

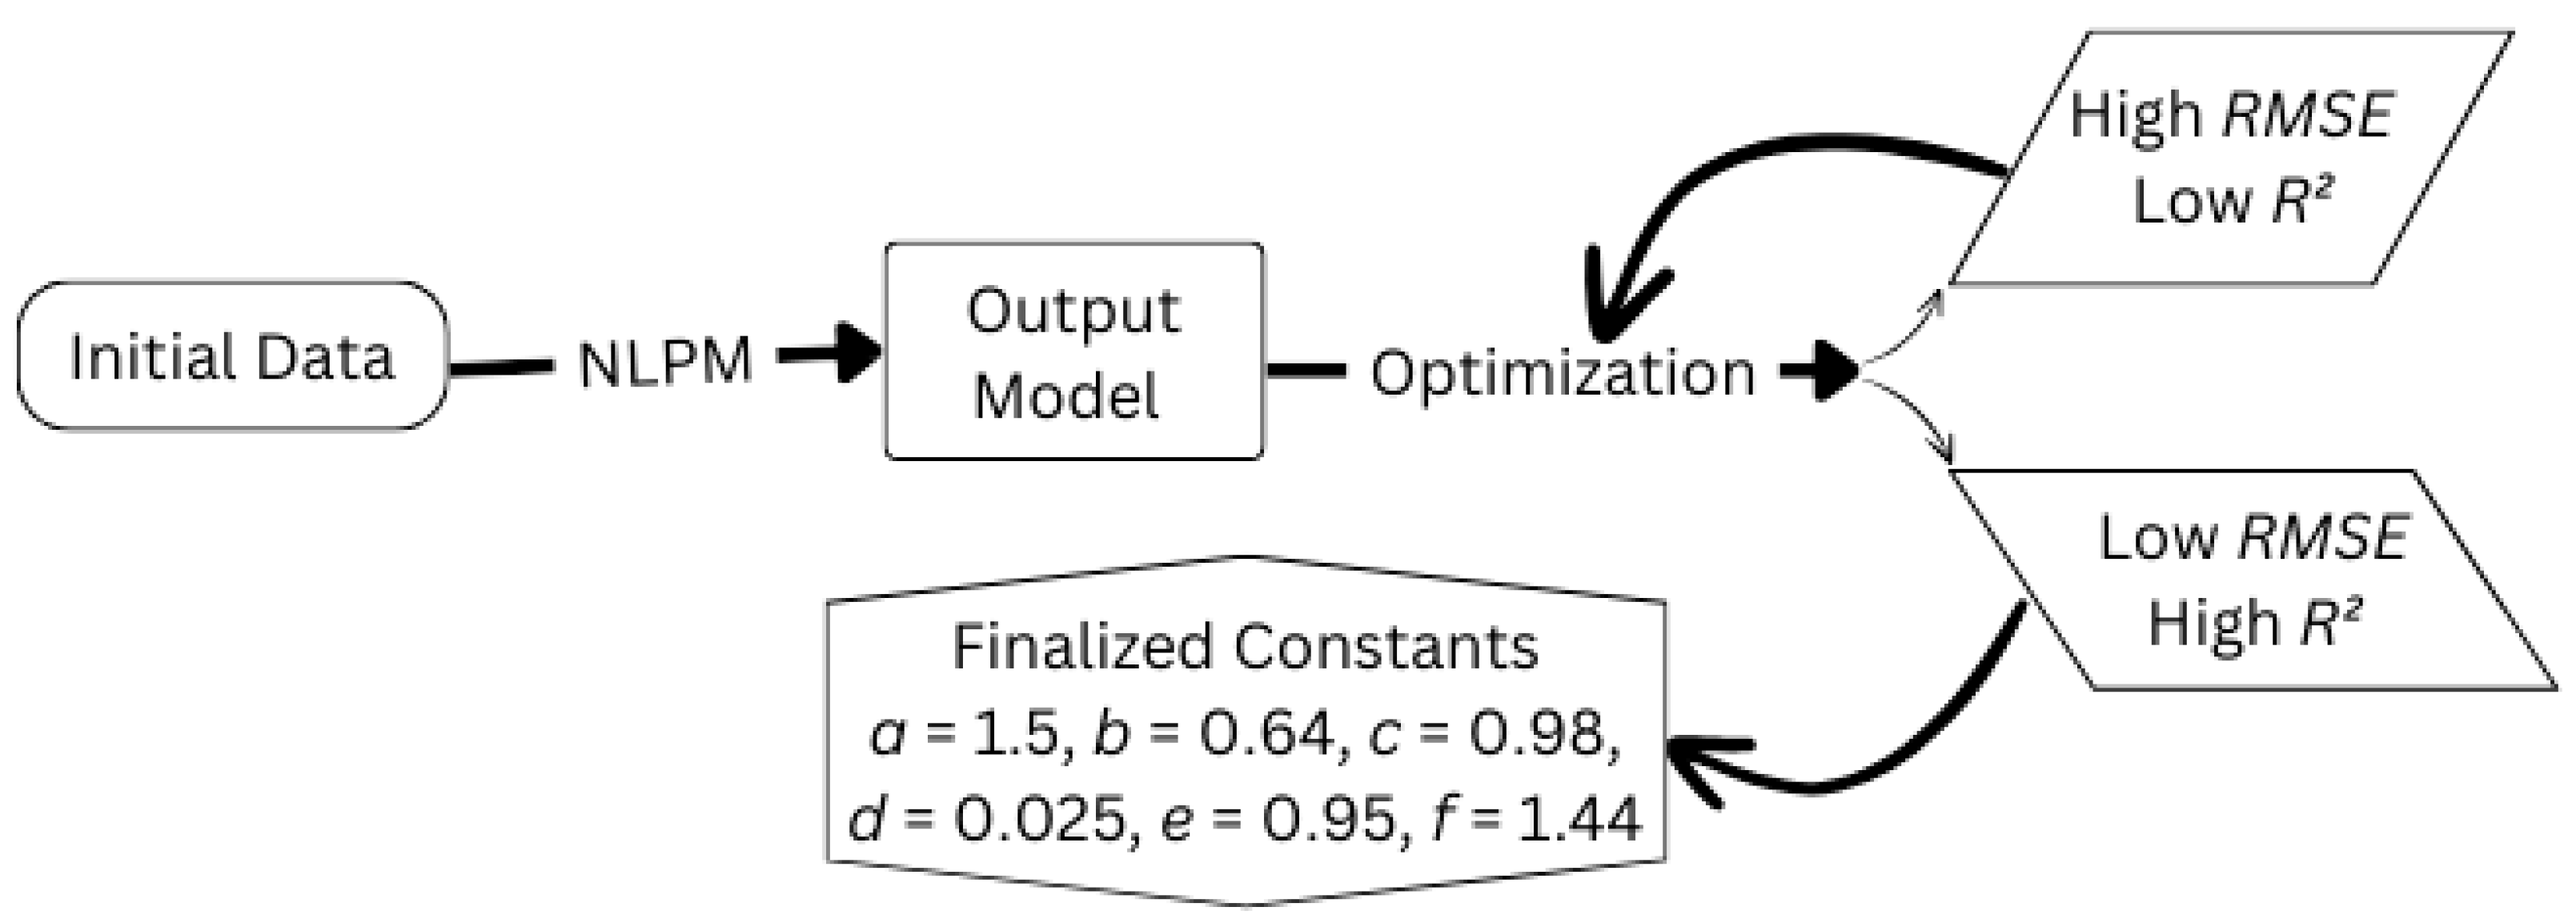
2.2. Non-Linear Predictive Modeling

A non-linear predictive model (NLPM) is a mathematical model that relates the independent variables to the dependent variable capturing non-linear relationships. The prediction performance of multivariate non-linear regression predictions is measured utilizing model indices such as RMSE, coefficient of determination (R2), and mean absolute error (MAE) [31]. The solution of a non-linear model is typically optimized by iteratively minimizing the square errors of the predictions, by adjusting the coefficients of the independent variables. NLPM methods are typically more effective at handling multicollinearity and nonlinearity than linear regression models [32].
In NLPM, the dependent variable can be expressed as a non-linear function (func) that relates the independent variables (x1, x2, x3, … xn) to the dependent variable (y) for the parameters to be predicted (β1, β2, β3, …… βm). A vector of p predictors (X), k parameters (β), plus an error term, describe this function (Equation (14)). The error term (ϵ) accounts for the deviations between observed and predicted dependent variable values.
y = f u n c x 1 , x 2 , x 3 , x n ,   β 1 , β 2 , β 3 , . . β m + ϵ
Linear and non-linear mathematical models have been fitted to training datasets developed to predict rheological, geomechanical, and petrophysical properties of the reservoir [31,33,34,35,36,37,38,39,40]. Non-linear mathematical models have previously been applied to predict relative permeability and fluid saturation used to define fluid flow capabilities of reservoirs in the presence of more than one fluid [41]. In this study, an NLPM is developed to assess and evaluate relationships between relative permeability and saturation of the reservoir fluids (Figure 1).
The NLPM was developed in Python 3.11.7 programming code to determine the values of relationship constants a, b, c, d, e, and f (Figure 1, Equations (15) and (16)). The model results were compared with those of an experimental study in terms of RMSE and R2. In the loop, the values of coefficients a to f generating the lowest RMSE and highest R2 were iteratively selected for the relationships expressed by Equations (15) and (16) in non-linear regression terms. The mentioned variables of the coefficients can be taken as an initial guess of the variables, which can be improved by varying the values in the fractured and intercalated lithology. Additional information from special core analysis can be used to refine the NLPM results by varying the values of these coefficients in the model.
k r w = ( S w D a × S w b ) c + ( d × 2 a × e S w D )
k r o = ( 1 S w D 2 ( 1 S w D f ) )
The model is configured to apply the constraint that k r w * = m a x ( min k r w : 1 , 0 ) , thereby ensuring that the solution for krw remains between 0 and 1.

2.3. Model Prediction Performance Indices

The prediction errors generated by the developed NLPM of relative permeability were evaluated using RMSE (Equation (17)) and R2 (Equation (18)). RMSE is a widely used statistical measure used to evaluate predictive performance [42]. On the other hand, the R2 measures the variance in the dependent and independent variables [43].
R M S E = 1 m i = 1 m ( X i Y i ) 2
R 2 = [ X i X m × ( Y i Y m ) ] [ ( X i X m ) 2 × ( Y i Y m ) 2 ]
Xi is the ith value of the independent variable, Yi is the ith value of the dependent variable, m is the number of data records (samples) evaluated, and Xm and Ym are the means of variable distributions.

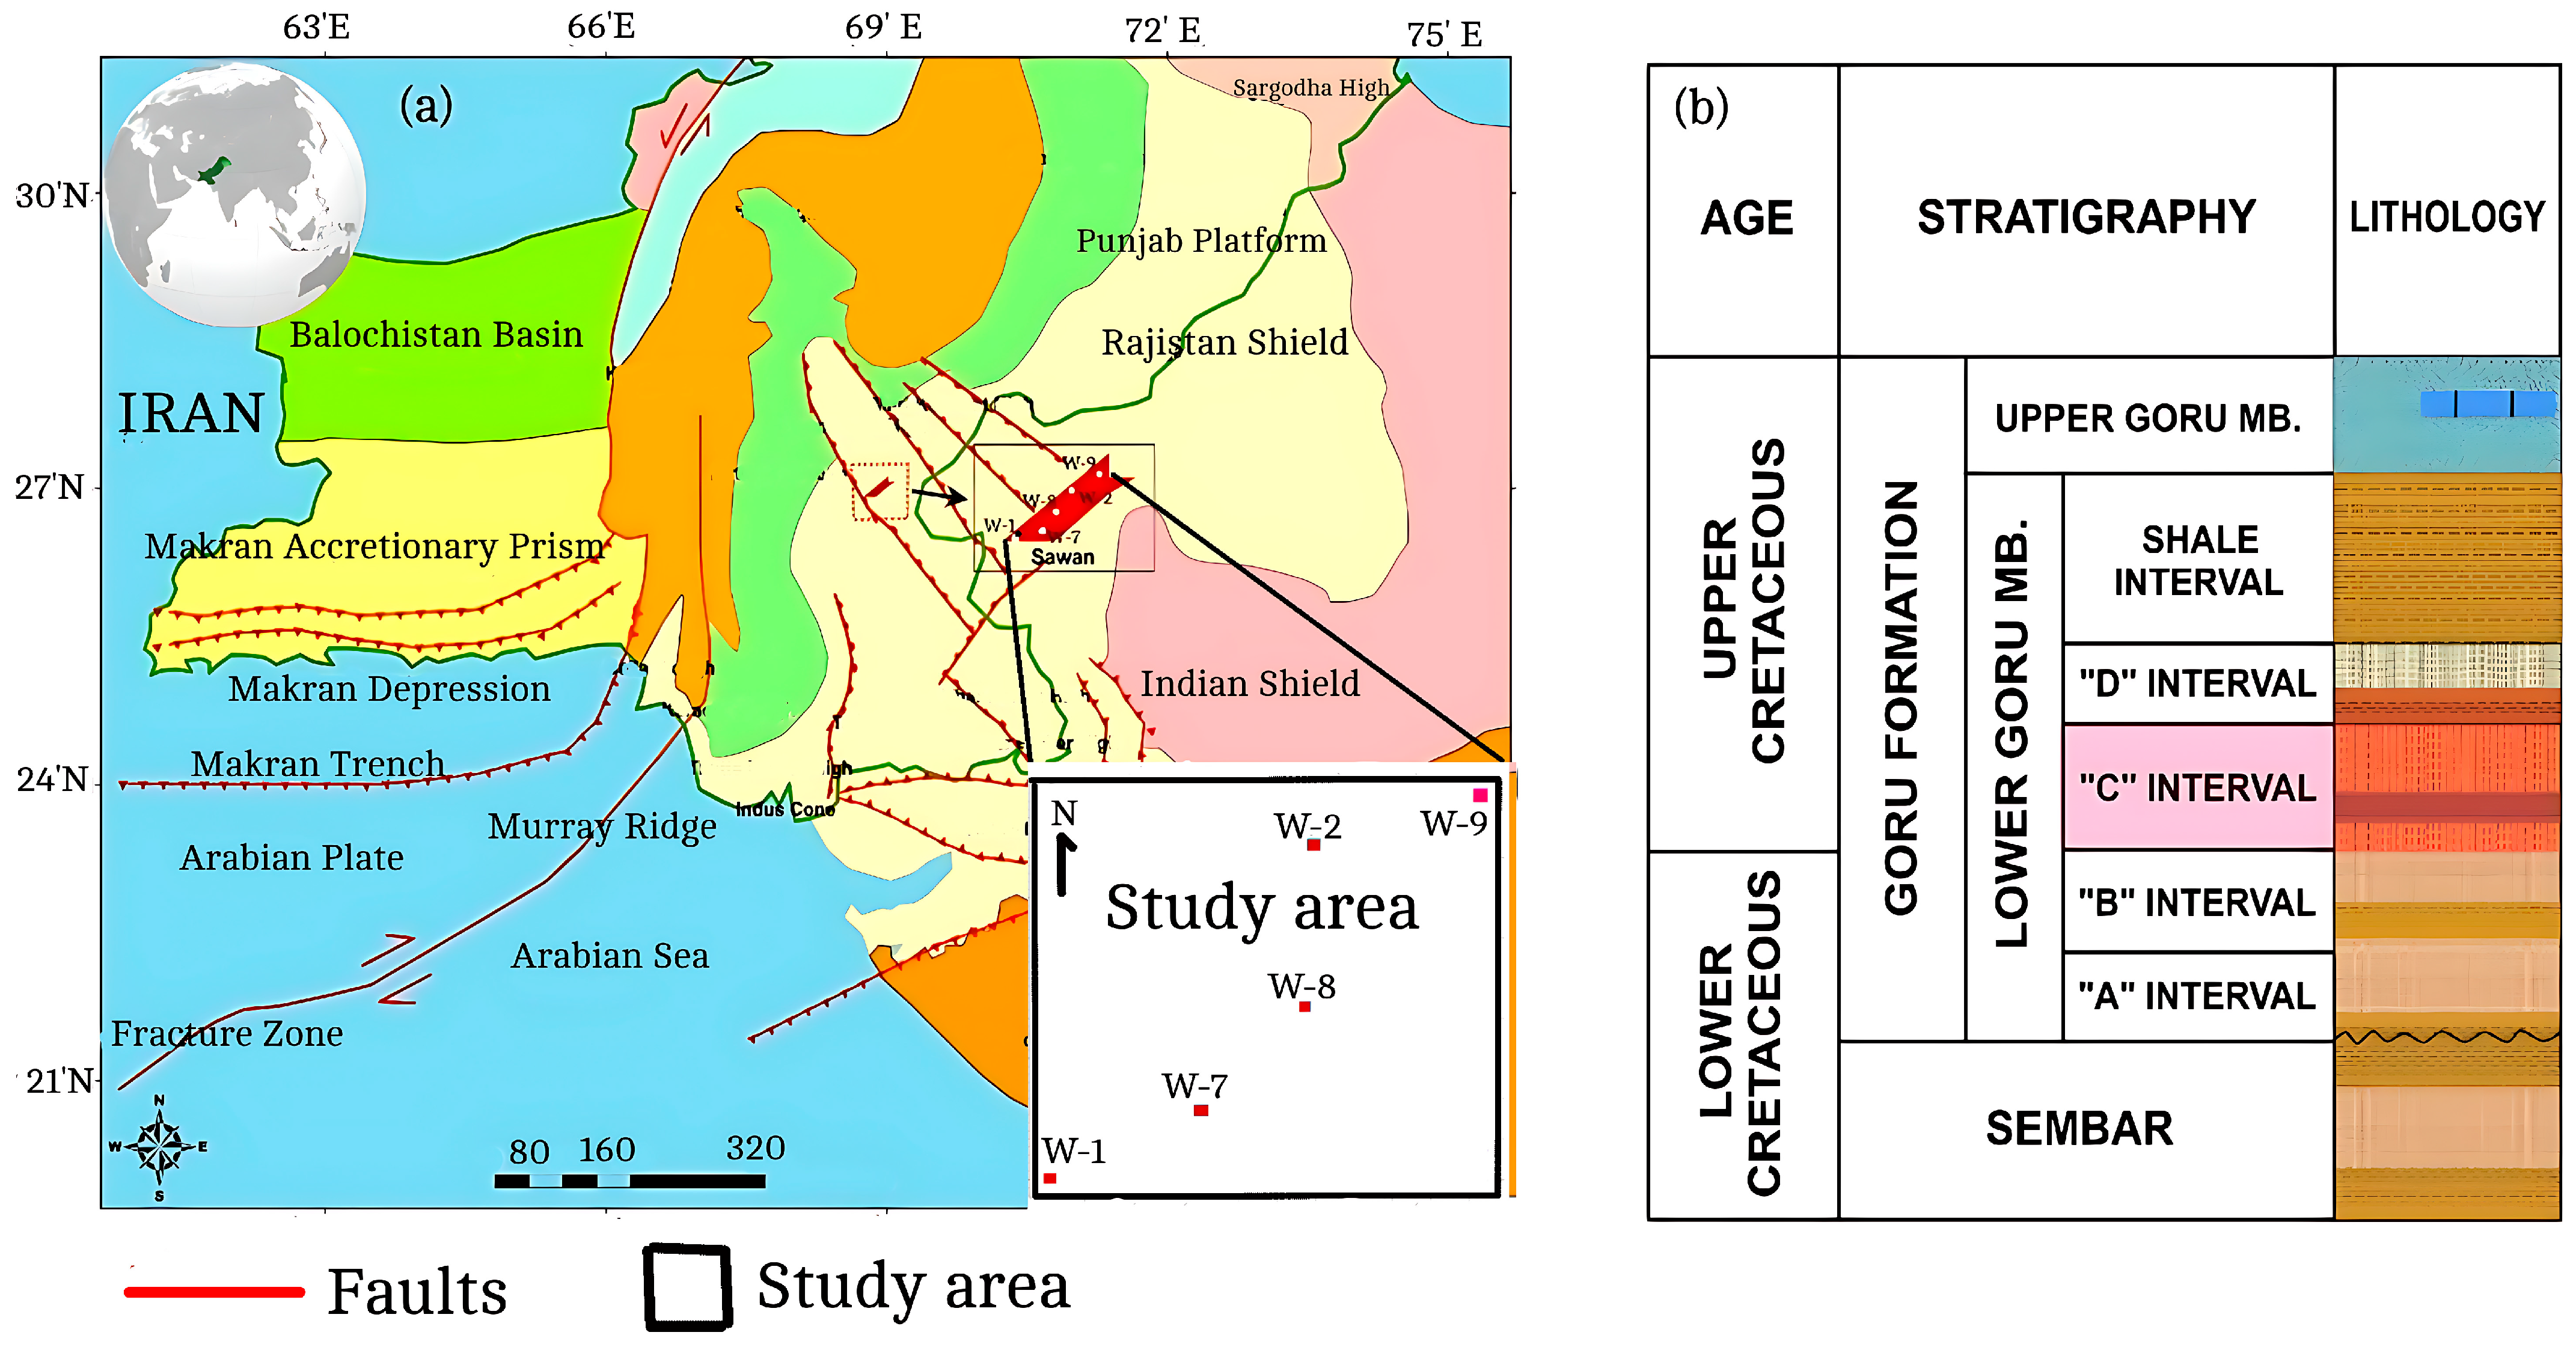
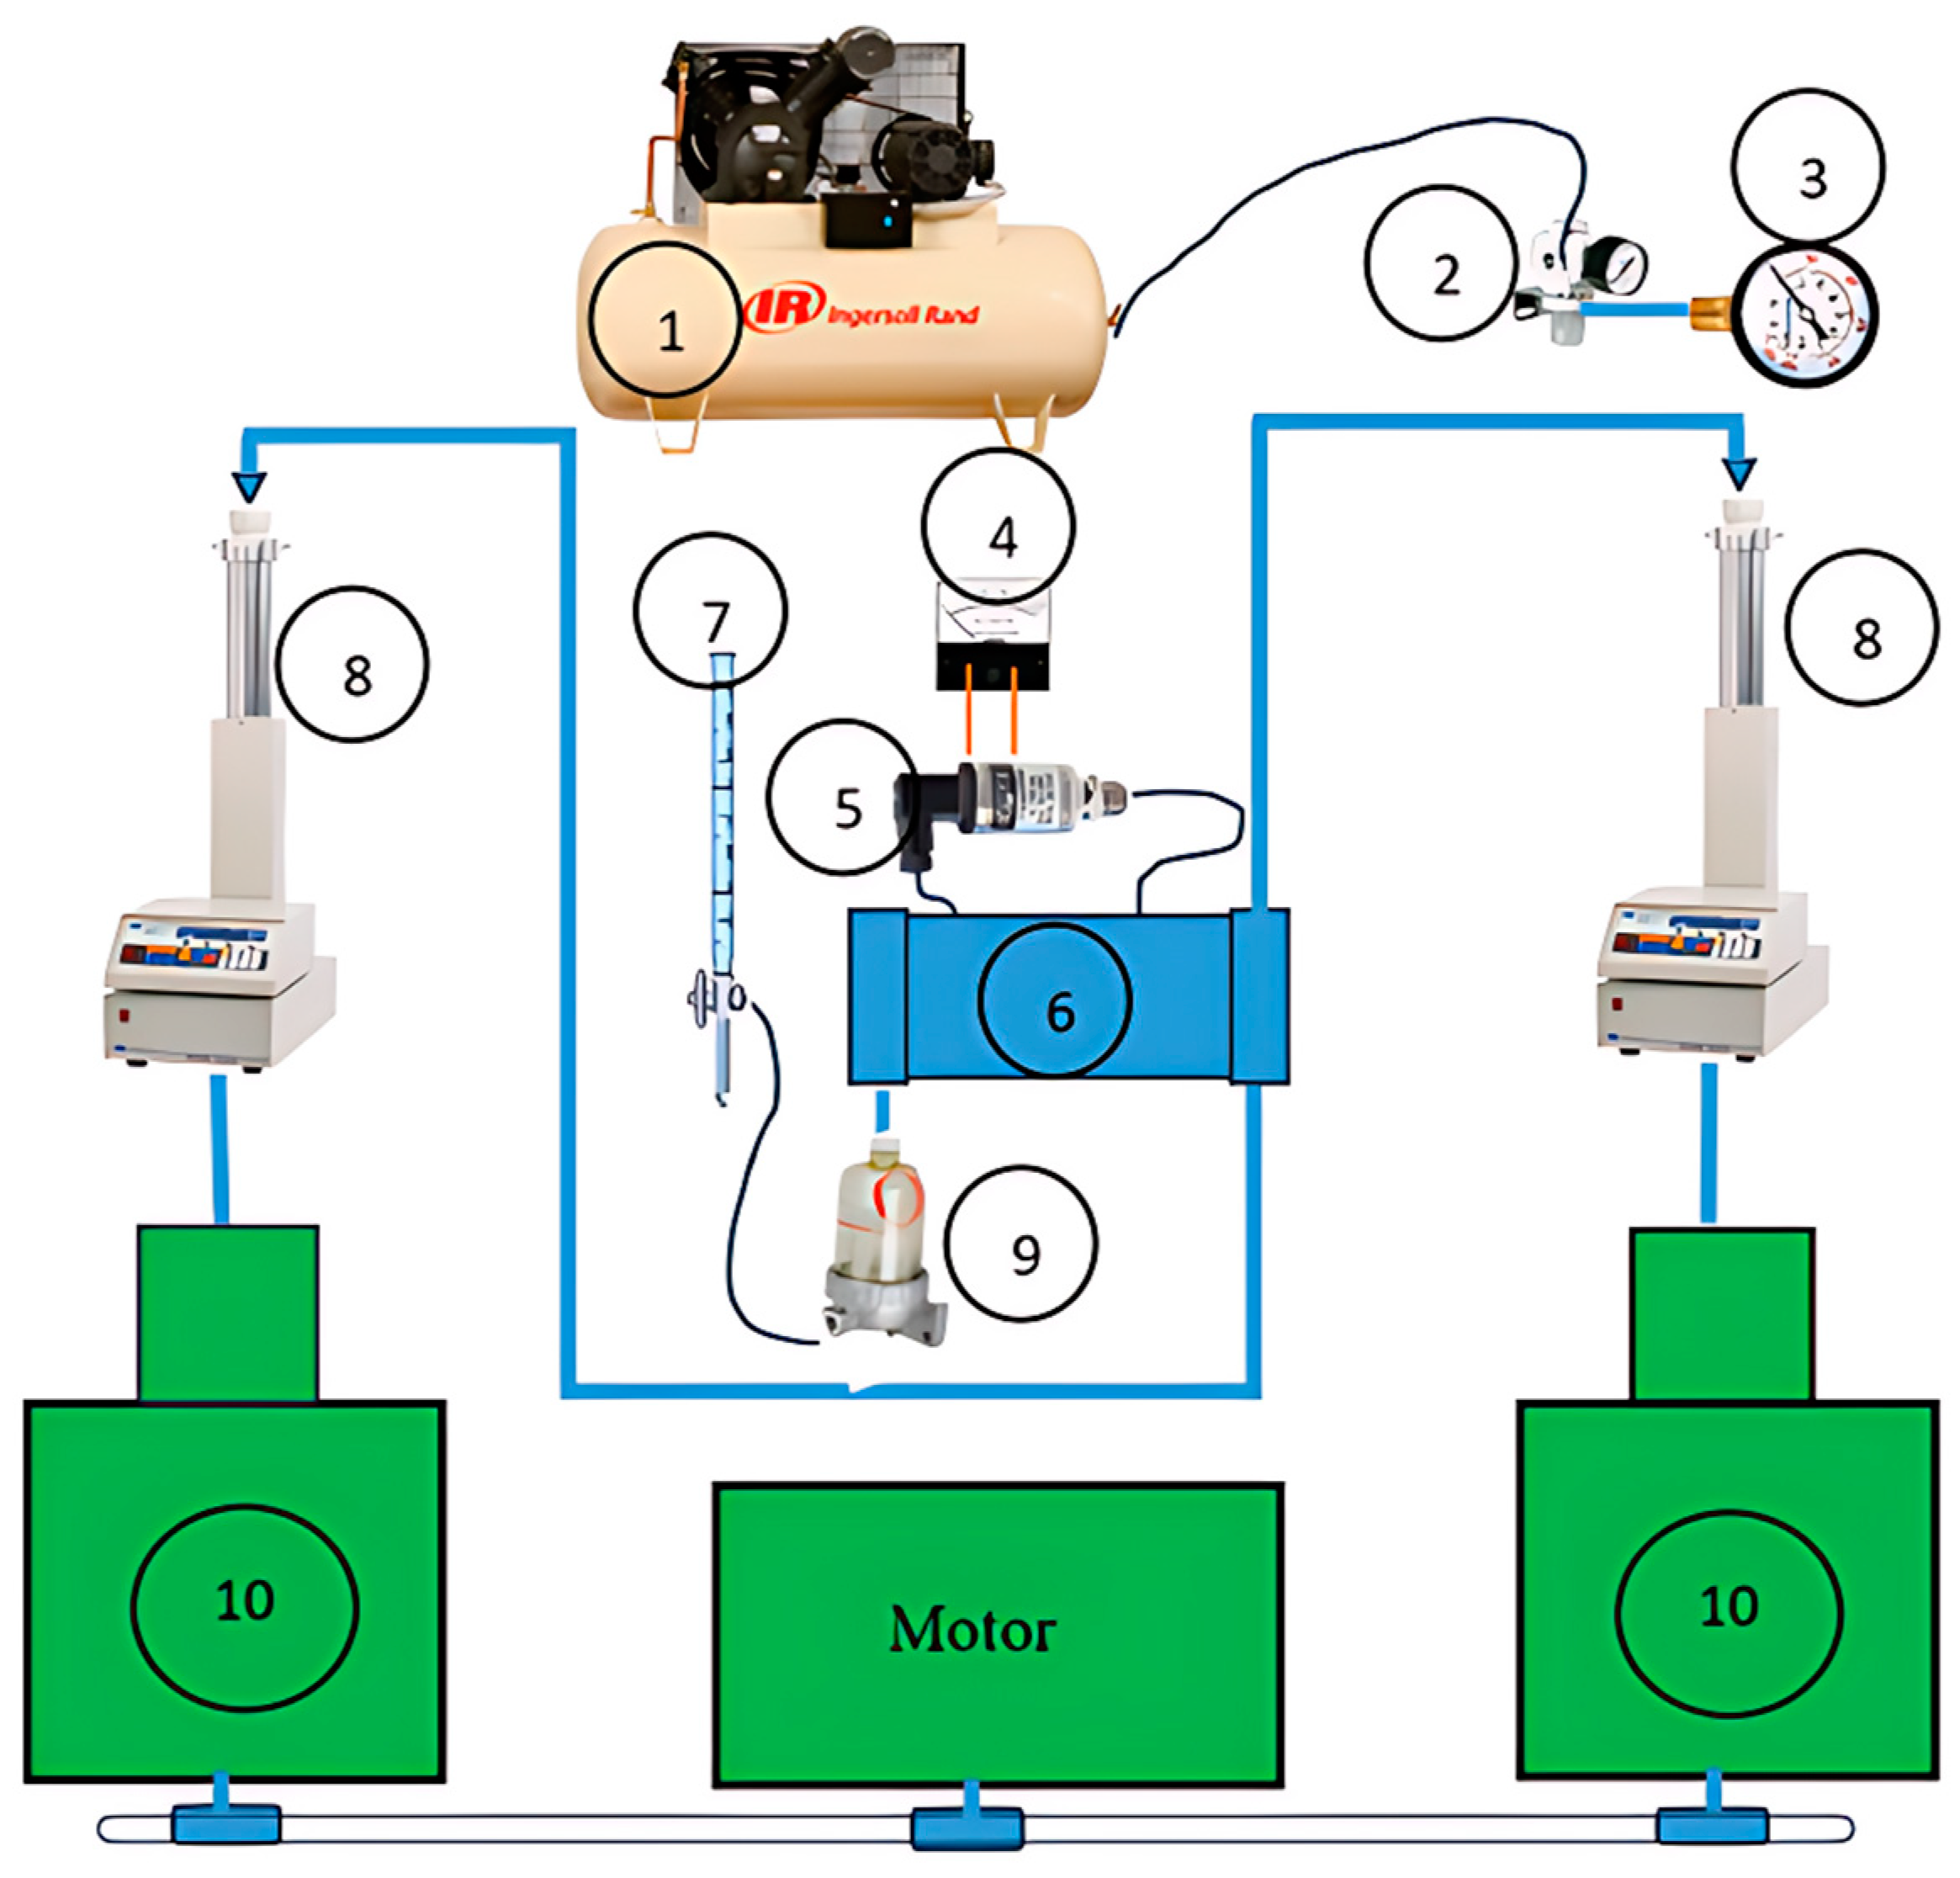
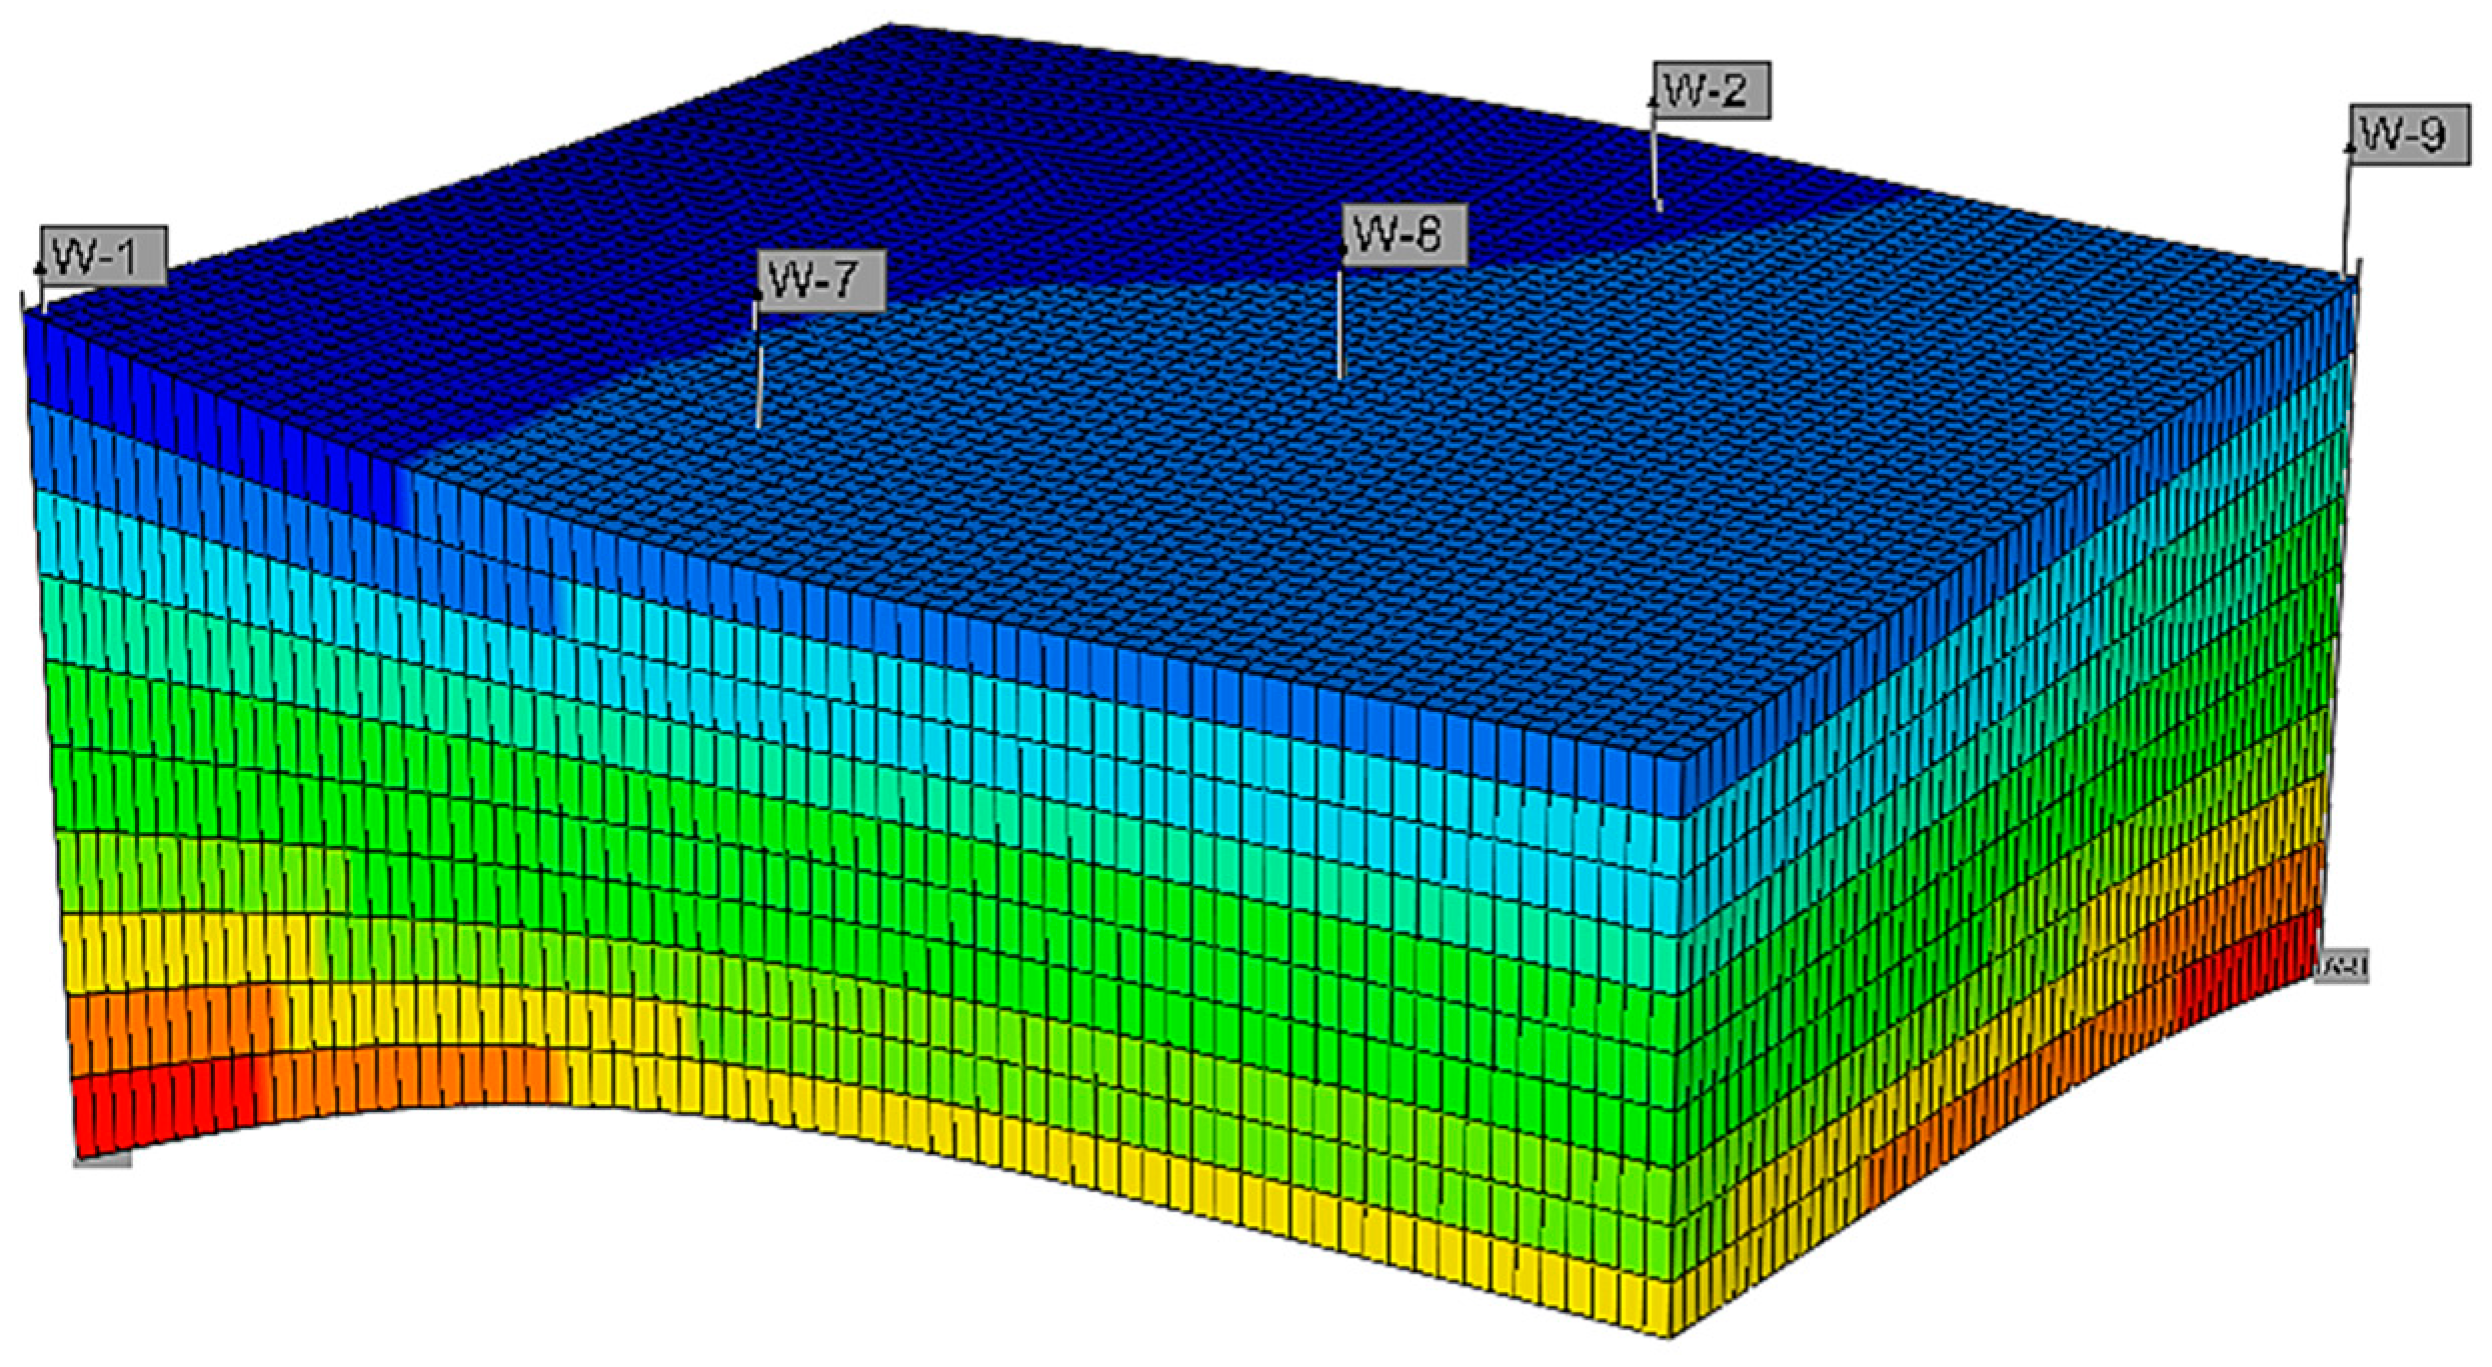
2.4. Description of the Reservoir and Numerical Model

The effect of relative permeability models on reservoir performance was examined using numerical simulations of water flooding on an unsaturated sandstone reservoir. This study evaluated the performance of different relative permeability models in numerical simulations of water flooding in the Goru Formation of the Sawan Gas Field, Pakistan. This study selected the C-sand of the Goru Formation (Figure 2b) for detailed reservoir simulation analysis. The C-sand is the major hydrocarbon-producing reservoir for the middle Indus Basin in Lower Goru Formation [44,45,46]. The reservoir is located on the border of the Indian plate (Figure 2a), surrounded by various geological features, such as the Kirther range, Jacobabad–Khairpur High, Mari–Khandkot High, and Murray Ridge-oven fracture plate boundary. These geological features play an important role in influencing the fluid flow characteristics within reservoirs. In this study, oil saturation was considered the dominant saturation in the reservoir. For the simulation, a sandstone section of the Cretaceous Goru Formation of Pakistan was utilized as the reservoir model. Due to its geological characteristics and potential hydrocarbon production, this reservoir section is of particular interest for numerical simulation studies.
The Goru Formation is divided into the Upper Goru and Lower Goru Members based on its lithological distribution. The Lower Goru is further classified into A, B, C, and D sands [47,48]. The C-sand was initially evaluated using a static reservoir model, which was subsequently developed into a dynamic water-flooding reservoir model. Lithologically, the reservoir interval has a sublitharenite–feldspar litharenite and lithic arkoses section that is coarse-grained and moderately well-sorted, as well as volcanic rock fragments and feldspars. The compositions of the Fe chlorite cements have influenced the reservoir quality of the C-sand [49]. There are multiple shale layers intercalated between the sandstone layers, resulting in a high degree of vertical heterogeneity (Figure 2) [45,50].
The reservoir top is at 10,673 ft having an initial reservoir pressure of 5000 psi at a temperature of 170 °C. With the available computation resources, the best-performing simulation result was achieved with 42,000 grid cells. That solution managed to capture the heterogeneity of the reservoir at an appropriate level during the upscaling process. A geostatistical model of the reservoir was used to import the petrophysical properties (porosity, hydrocarbon saturation, permeability) for numerical simulation. Vertical permeability was assumed to be 0.1 times horizontal permeability [51]. The grid thickness of each reservoir layer simulated differs depending on the overall geometry of the reservoir. The model considered five wells, of which four (4) were designated as producers, while one well was designated as a water injector (W-8) in the numerical simulation. The perforation lengths in the reservoir section of each well ranged from 30 to 45 ft. The base parameters applied in all the cases simulated are listed in Table 1.
Conventional experimentation methodology was used to measure the relative permeability of the sandstone core samples, as shown in Figure 3 [52]. The oil and water were injected into the core sample using two micropumps. The pumps have O-rings going through the cylinders. Hydraulic transmission is used for pumping the fluid inside the sample. The input flow rates are calculated based on the speed of the pump drives. The pressure drops from the inlet to the outlet are measured by the strain gauge pressure transducer. The conductivity circuit was used to measure the fluid saturation distributions during the flow.
The proposed methodology requires initial input of formation-specific experimental data, particularly capillary pressure versus water saturation (Figure 4a) and relative permeability versus water saturation (Figure 4b). The experimentally derived capillary pressure data (see Appendix A) for the studied reservoir indicates that the capillary pressure at connate water saturation was 2.75 psi (Figure 4).
A static reservoir model was developed using the well log and core data obtained from the studied reservoir. The Morris and Biggs [53] approach supported by the findings of Ismail, Yasin [40], Ismail, Raza [54] was applied for predicting the permeability of sandstone reservoirs. The Archie equation was used to estimate the reservoir’s hydrocarbon saturation. Geostatistical modeling with a sequential Gaussian algorithm was used to statistically analyze the important reservoir properties and to develop a numerical simulation of water flooding. Figure 5 illustrates the workflow of the methodology applied.
A numerical simulation was conducted for the years 2023 to 2075 to determine the reservoir’s primary production performance. The simulation was initially configured with all wells being treated as production wells. A commencement-of-injection year was determined based on the overall pressure drop of the reservoir. An assessment of the impact of relative permeability models on numerical simulations of water flooding was carried out using two-phase water–oil flows. The production well (W-8) was repurposed as an injection well for all subsequent simulations. The wells were positioned diagonally across the reservoir from one edge to the other, as shown in Figure 6.
The numerical simulation was designed to accurately capture the behavior of water–oil two-phase flow within the reservoir. The study evaluated the influence of different relative permeability models on the simulation results and predicted the performance of water flooding operations. The simulation results provide valuable insights into the optimization of water flooding strategies and contribute to a better understanding of reservoir behavior during water flooding operations.

3. Results

The relative permeability of a reservoir plays a crucial role in numerical simulations of fluid recovery processes. The relative permeability of the studied reservoir was predicted using several classical models, and the results were compared with experimental data. According to Figure 7, the krw predicted by Brooks and Corey [13] deviates most from the experimental data. In this case, the deviation is between 45 and 85% of normalized water saturation. This correlation is limited by heterogeneous reservoirs in imbibition cases, such as water-wet reservoirs [18]. In addition, Li and Home [55] reported similar higher krw predictions when applying the Brooks and Corey [13] model at saturation levels between 45 and 90%. However, that model made relatively accurate predictions of kro compared to krw. A 20–40% SwD deviation was observed between the predicted and experimental kro values. Since Brooks and Corey [13] have only described a fluid saturation function, higher variations in capillary pressure and reservoir wettability may limit the application of the model. That model attempts to capture the effects of wettability and capillary effects by using the Corey’s exponent, but it lacks physical justification [56].
Based on a comparison of predicted kr with experimental data, the following models are considered as the most accurate for predicting krw: model proposed and developed in this study (best at regional scale) > Purcell [11] > [15] > Corey [28] > Brooks and Corey [13]. The Corey [28] model performed better than the Brooks and Corey [13] model due to the difference in the coefficient values for specific reservoirs. The Purcell [11] model accurately predicts the non-wetting phase but fails to predict the wetting phase accurately. According to the results of this study, that model generated unrealistic results due to the assumption that krw + kro = 1, which is an invalid assumption for most reservoirs [57].
In water-wet reservoirs, the Pirson [15] model shows a greater sensitivity to kro than to krw [30]. That model predicted lower kro values than experimental data for water saturations less than 17% but higher krw values than reference data. A combination of empirical models may produce better results than each model used in isolation. It is possible to overcome the limitations of a particular relative permeability model by replacing it with a hybrid approach using more than one of the models mentioned. For instance, more accurate results were obtained by combining the Corey [28] model for kro and the Purcell [11] model for krw, both of which can be used to predict relative permeability. That combination of classical models generates relative permeability predictions that are closest to experimental measurements (Figure 7). A statistical NLPM is proposed and developed to improve upon the predictions of relative permeability for the studied reservoir as compared to the classical models mentioned.
According to the proposed model, the two relative permeabilities (krw and kro) were predicted with lower error levels. The proposed model predicted lower krw values at SwD (>80%). By involving the non-linear component, SwDa, and exponent functions, the model was able to capture rapid changes in input variables, especially near the boundaries of the input domain. In water flooding simulations, performance in the numerical simulation is measured as pressure, oil production rate, and water cut. The proposed model requires the scaling and tuning of the variable coefficients a, b, c, d, e, and f to determine the relative permeability of the reservoir. The proposed model predicted lower relative permeability near the saturation end points. The prediction performance of the proposed model was higher for kro than krw. The proposed model outperforms the classical/empirical models for predicting the studied reservoir’s relative permeability. The experimental data were normalized for comparison with the classic predictive models of relative permeability as recommended by Li [18].
The assumption that the sum of the relative permeabilities of water and oil equals 1 led to incorrect predictions of kro by Purcell [11]. Despite the R2 of the kro predictions being 0.79, the RMSE of 0.654 indicates unacceptable values for any numerical simulation. The limitations of this model would likely result in erroneous predictions in numerical simulation studies. Corey [28] demonstrated relatively good prediction performance for relative permeability with an RMSE of 0.126 as compared to poorer performance with the Brooks and Corey [13] model. Both models predicted the relative permeability of the non-wetting phase with fewer errors than the wetting phase. It is important to note that a high R2 is not always a good indicator of a model’s high prediction performance, as that metric essentially measures correlation and not accuracy. RMSE plays a crucial role in cross-checking models with high R2 to verify the degree of prediction error [58]. Brooks and Corey [13] showed a similar R2 to Corey [28] for kro but had comparatively lower prediction performance, as indicated by a nearly 50% increase in RMSE.
Among all the models evaluated, the proposed NLPM showed the best relative permeability prediction performance for both kro and krw, with RMSE of 0.028 and 0.010, respectively (Figure 8). The proposed model predicts reservoir performance that is consistent with the experimentally derived relative permeability data for the studied reservoir.
A static reservoir model was developed for the studied field combining well log information, core data, and mud log data. The information obtained from the mud log data were used to develop well horizon maps. The structural model incorporated horizon mapping, surface generation, zonation, and vertical layering.
The most widely distributed porosity value is approximately 10%, with peaks reaching up to 20% near well locations W-1, W-7, and W-8 wells (Figure 9). Within the simulated reservoir, the most widely distributed permeability value is approximately 2293 mD observed in 12,308 grid cells (Figure 9). A section of low permeability was also identified, extending diagonally across the field from W-1 to W-9. The higher permeability reservoir zones may result in poor water flooding performance due to the early breakthrough of injected water [59].
A numerical simulation based on well constraints was developed to investigate the impact of predicted relative permeability on reservoir fluid flow during water flooding. A primary production scenario was initially developed to determine the overall pressure drop over the simulation period [60]. The starting date for water injection was set for the year 2065 based on the oil production decline curve (Figure 10). The simulation results reveal that relative permeability is a critical parameter in determining the flow characteristics of phase movements. Specifically, the mobility ratio is affected by the viscosity and relative permeability of the displacing and displaced fluids [61].
To study the primary production case, the wells were constrained to operate at a minimum borehole pressure of 500 psi and a maximum surface oil rate of 5000 bbl/day. The wells were constrained to shut in if the maximum water cut reached 95%. The overall field analysis showed a steep decrease in reservoir pressure up to the year 2043 (Figure 10). The oil production rate declined at a slow rate until the year 2065, accompanied by a relatively slow increase in water cut from the year 2043, reaching a maximum of about 30%. As primary oil recovery was limited to about 25% in the year 2075, a water injection well was introduced in the year 2065 to conduct water flooding and maintain the oil production rate.
The water flooding case was configured to analyze the effects of relative permeability prediction on fluid flow in the studied reservoir during the simulated secondary recovery phase of production. For water flooding, the well constraints of the production wells were kept the same as those of primary production, and well W-8 was reconfigured to become the only water injection well. The reservoir performance of the simulated water flooding case was evaluated with the classical and proposed relative permeability prediction models. The injection well was constrained to inject at a minimum of 7000 psi. The average reservoir pressure, oil production rate, water cut, and oil recovery factor values were recorded for all the relative permeability prediction models considered (Figure 11).
Average reservoir pressure: In the water injection case, the average reservoir pressure was the same for the Corey [28] and Brooks and Corey [13] models up to the point of water injection (Figure 11A). Both approaches predicted the average reservoir pressure as higher than the experimental data. The Pirson [15] model prediction was closer to experimental data than other classical models. After water injection, the pressure suddenly increased from 1500 to 6800 psi between the years 2065 and 2068 and then stabilized at a constant pressure of about 7000 psi.
All the classical models show consistent time-dependent pressure behavior after injection, indicating higher pressure than the proposed model and experimental data. The proposed model exhibits a trend similar to the experimental data with a better match after water injection. Moodie, Ampomah [62] have also reported a similar time-dependent impact of relative permeability on field pressure. During the period of rapid pressure increase starting in 2065, all models, including the proposed NLPM, show a similar pressure rise.
The reservoir pressure from the proposed model matches the experimental data more closely by displaying a lower magnitude range compared to all the other models. The Corey [28] and Brooks and Corey [13] models generated similar results throughout the reservoir simulation. In 2065, the lower right zone of the reservoir area modeled experienced pressure front movement priority compared to the other reservoir zones. After water injection commenced, the reservoir regained its pressure, and pressure values fully recovered within the following 10 years. The average pressure was determined experimentally, and the proposed model recovered more slowly than the other models because it correctly predicted lower reservoir pressure in the year 2065 (Figure 11a and Figure 12).
Oil production rate: Relative permeability shows the ability of a specific reservoir to produce oil more accurately than absolute permeability. The decline in oil production rate was higher in the early production years than those immediately preceding water injection. The oil production decline rate predicted by the Pirson [15] model was lower than that of other relative permeability models considered. The proposed model showed the same behavior as experimental data before water injection in the reservoir. After water injection, the Pirson [15] model showed a higher production rate than the Corey [28] and Brooks and Corey [13] models. In the year 2070 of the simulation, the proposed model could not exactly match the oil production rate predicted experimentally. However, after the year 2070, the proposed model predicted an oil production of 11,600 bbl/day, which is in close agreement with the experimental data (Figure 11B).
Water Cut: Water cut is a fundamental parameter for reservoir performance evaluation [63]. Relative permeability is a function of the reservoir and fluid properties and is considered one of the main factors affecting water cuts [64]. The relative permeability models involving higher water–oil mobility ratios produce higher water cut ranges. Figure 11C reveals that relative permeability models are more sensitive to water production than other reservoir variables in the numerical water flooding simulation. As was the case with reservoir pressure and oil production rate, the classical empirical relative permeability predictive models were less efficient after water injection commenced. The Corey [28] and Brooks and Corey [13] models showed almost the same trend for water cuts before water injection commenced. However, the water cut predicted by all of the classical relative permeability models was lower than the experimental data by the end of the water flooding simulation phase (Figure 11C). On the other hand, the water cut predictions of the proposed model were the closest to the experimental data.
Oil recovery factor: The oil recovery factor depends upon the oil production rate during the production phase. Oil saturation of the reservoir (Figure 11D) controls the overall oil production and the effective reservoir permeability to flow oil. Relative permeability is a fundamental parameter that impacts reservoir oil production and recovery performance [65]. The oil recovery factor was almost identical for all relative permeability models from the start of the simulation up to the year 2032. However, predictions diverged from that point until the end of the simulation. Of the classical models, the Pirson [15] model generated better predictions for the oil recovery factor than the Corey [28] and Brooks and Corey [13] models. However, the oil recovery factors predicted by the proposed model provided the closest match with the experimental data (Figure 11D).
A relatively small reduction in oil saturation occurred across the reservoir before water injection commenced. However, a significant change in the distribution of oil saturation materialized in the reservoir following the commencement of water injection in 2065 (Figure 13). The majority of oil produced during the first 20 years of the simulation was derived from Well-7. Compared with the experimental data and proposed model simulation, the Corey (1954) [28] and Brooks and Corey (1966) [13] models resulted in higher oil saturation predictions over the simulation period. On the other hand, the experimental and proposed model exhibited similar oil saturation patterns throughout the simulation period with oil saturation matching almost exactly at the end of the simulation period. Of the classical models, the oil saturation predicted by the Pirson (1958) [15] model was closer to both experimental and proposed model values than all other classical models considered (Figure 13).

4. Discussion

Figure 14 summarizes and compares the results of the key reservoir performance predictions of the relative permeability models considered and applied to the numerical water flooding simulation model of the studied reservoir. This comparison confirms that the Corey [28] model generated a higher average reservoir pressure than the other models (Figure 14a). The Pirson [15] model and the proposed NLPM generated a similar range of oil production rates to the experimental data (Figure 14b). From RMSE analysis of the relative permeability predictions of the models, it is apparent that the classical models all faced difficulty in predicting krw versus kro trends, which affected their water cut predictions when applied to the numerical water flood simulation (Figure 14c). Both the Corey [28] model and the Brooks and Corey [13] model predicted that the water cut was almost 10% lower than the original water cut derived from experimental data. On the other hand, the proposed NLPM predicted an approximately 2% lower water cut than the experimental data (Figure 14c). The better predictions of kro, as evident by lower RMSE and higher R2 of the classical models, enabled them to achieve a better prediction of oil recovery factor in the numerical simulation (Figure 14d). However, the proposed model predictions of average oil recovery factor were closer to those of the experimental data. Overall, the proposed NLPM predicted the reservoir performance in the water flooding simulation of the studied reservoir with the least prediction errors. Of the classical models, the Pirson [15] model generated the next best predictions for the studied reservoir.
Despite excellent prediction performance when applied to the studied reservoir, it is recognized that the proposed model could be less flexible than the classical relative permeability models when applied to other reservoirs and reservoir conditions. Classical models may perform poorly under certain reservoir conditions, but they may generate more consistency across a broader range of reservoirs and reservoir conditions due to their more general assumptions. Although the proposed model generates lower relative permeability errors for the studied reservoir conditions, its rigid formulation involving five coefficients derived from NLPM analysis of experimental data and applied to Equation (15) limits its application to the specific reservoir studied. To apply the model to other reservoirs, experimental data would be required for each reservoir so that the values of NLPM’s coefficients a to f (Equation (15)) could be appropriately customized. Hence, further work is required to apply the proposed model to multiple distinct reservoirs to confirm its generalizability. Further work is also planned to assess alternative non-linear fitting techniques, such as cubic spline functions, to model relative permeability relationships. It is considered possible that such alternatives might generate smoother, more flexible, and generalizable alternatives to the proposed NLPM.

5. Conclusions

This study evaluates the performance of existing relative permeability models for predicting the relative permeability of sandstone reservoirs. The classical models assessed in this study are the Purcell, Corey, Brook, and Corey, and Pirson’s predictive models for relative permeability. The predictions generated by these models were compared to experimental relative permeability data. Additionally, a geostatistical model of a sandstone reservoir was developed using well-log and core data. The predicted relative permeabilities from the four classical models considered and the proposed non-linear prediction model (NLPM) were used to simulate waterflooding and their prediction performances compared.
From the results the following conclusions can be drawn:
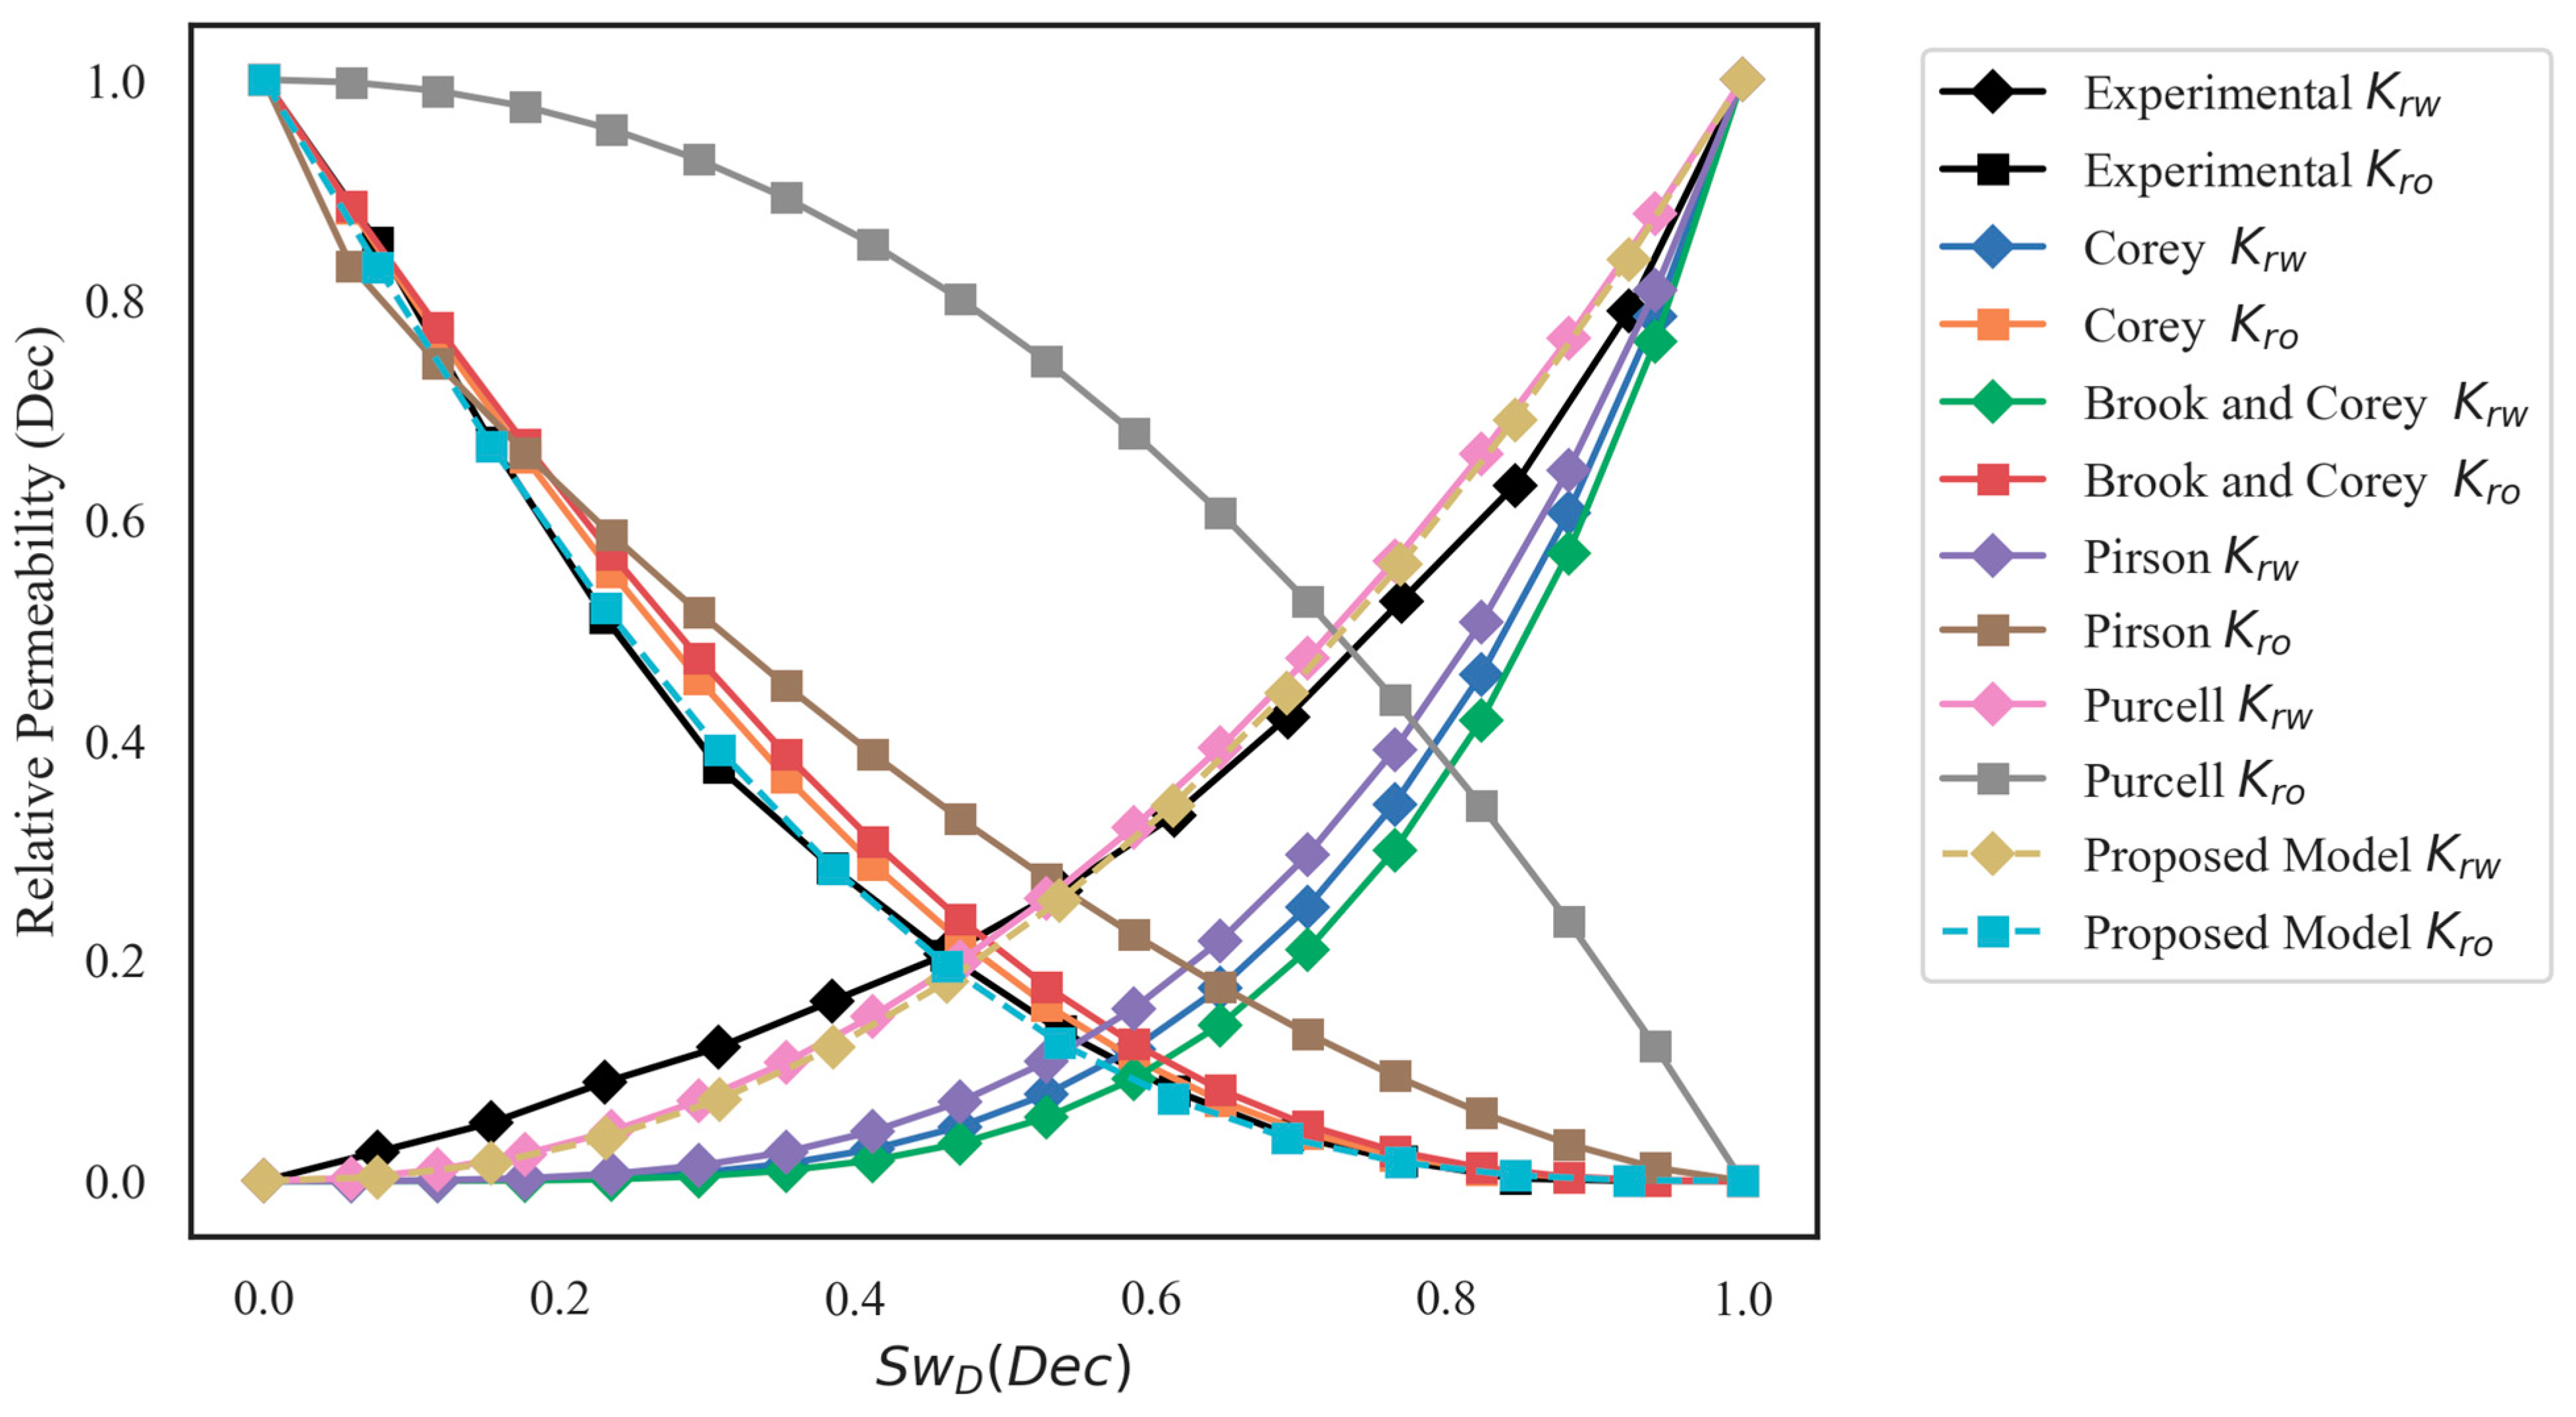
  • The proposed NLPM predicted relative permeability with the highest accuracy compared to existing relative permeability models with significantly lower RMSE values of 0.028 and 0.010 for krw and kro, respectively. The Purcell model cannot predict kro due to its assumption that krw + kro = 1. However, the Corey kro model and the Purcell krw model can be utilized together to reliably predict relative permeability since they are the models that most closely match experimental data.
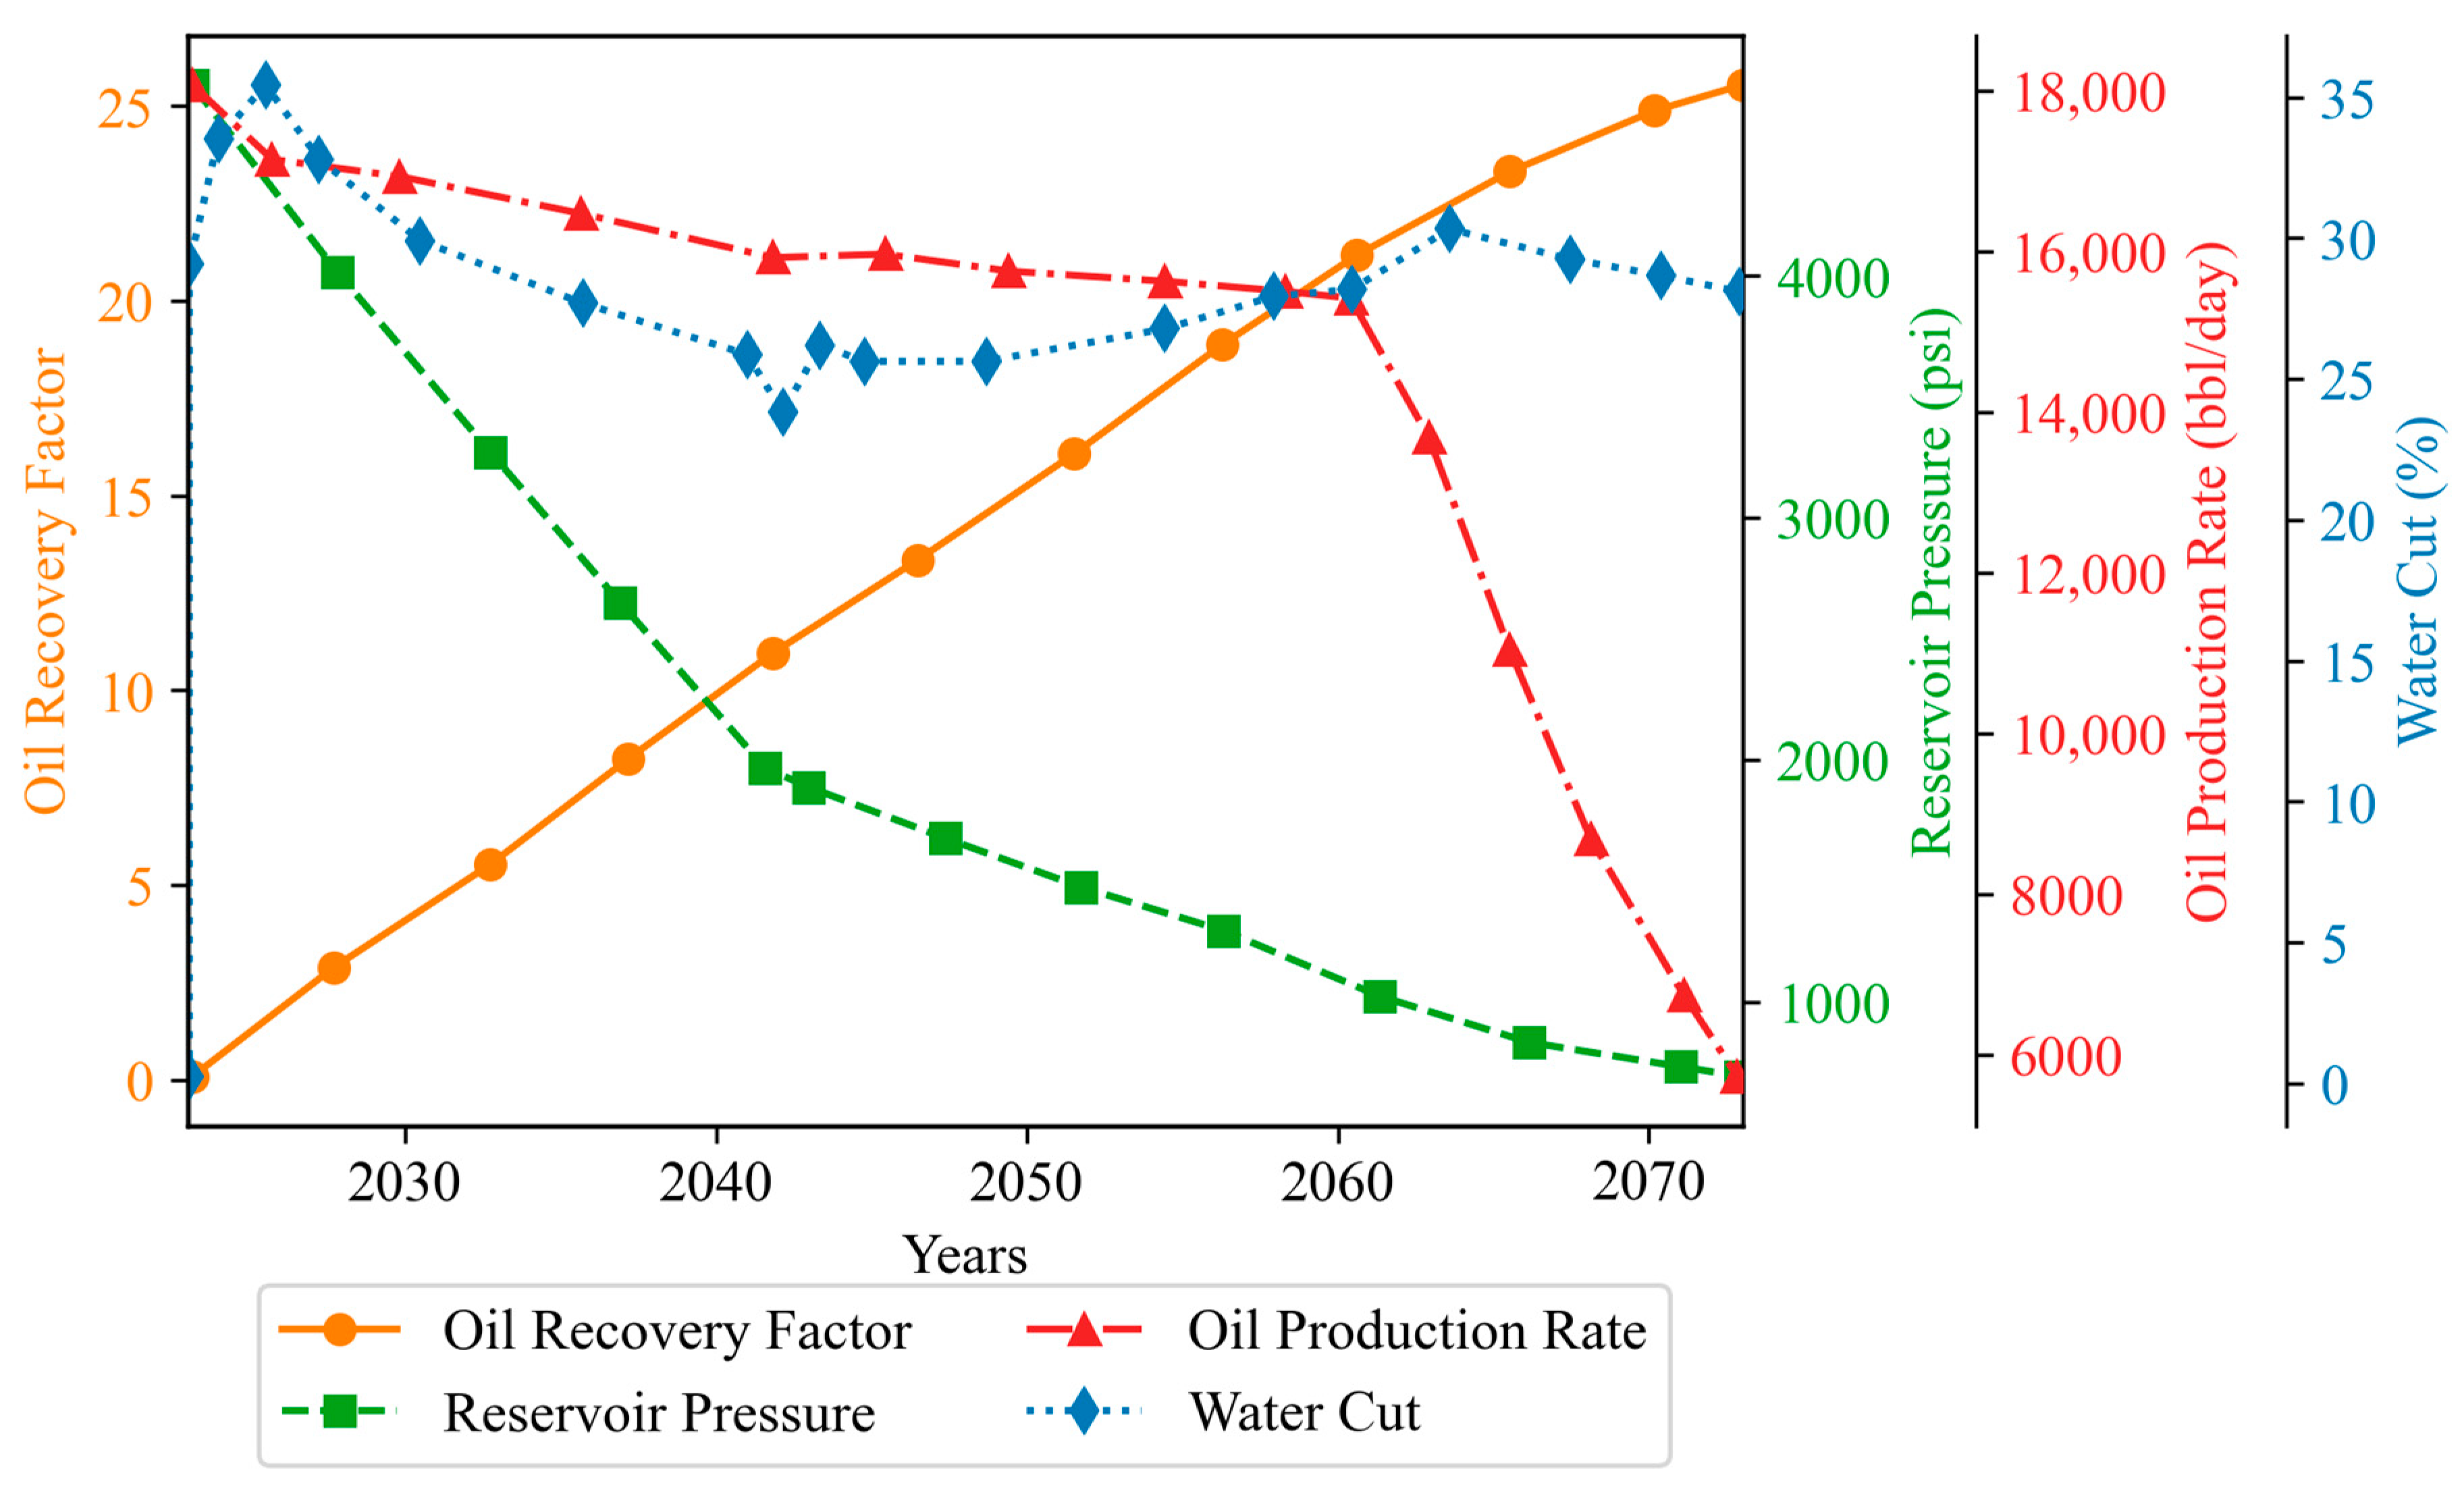
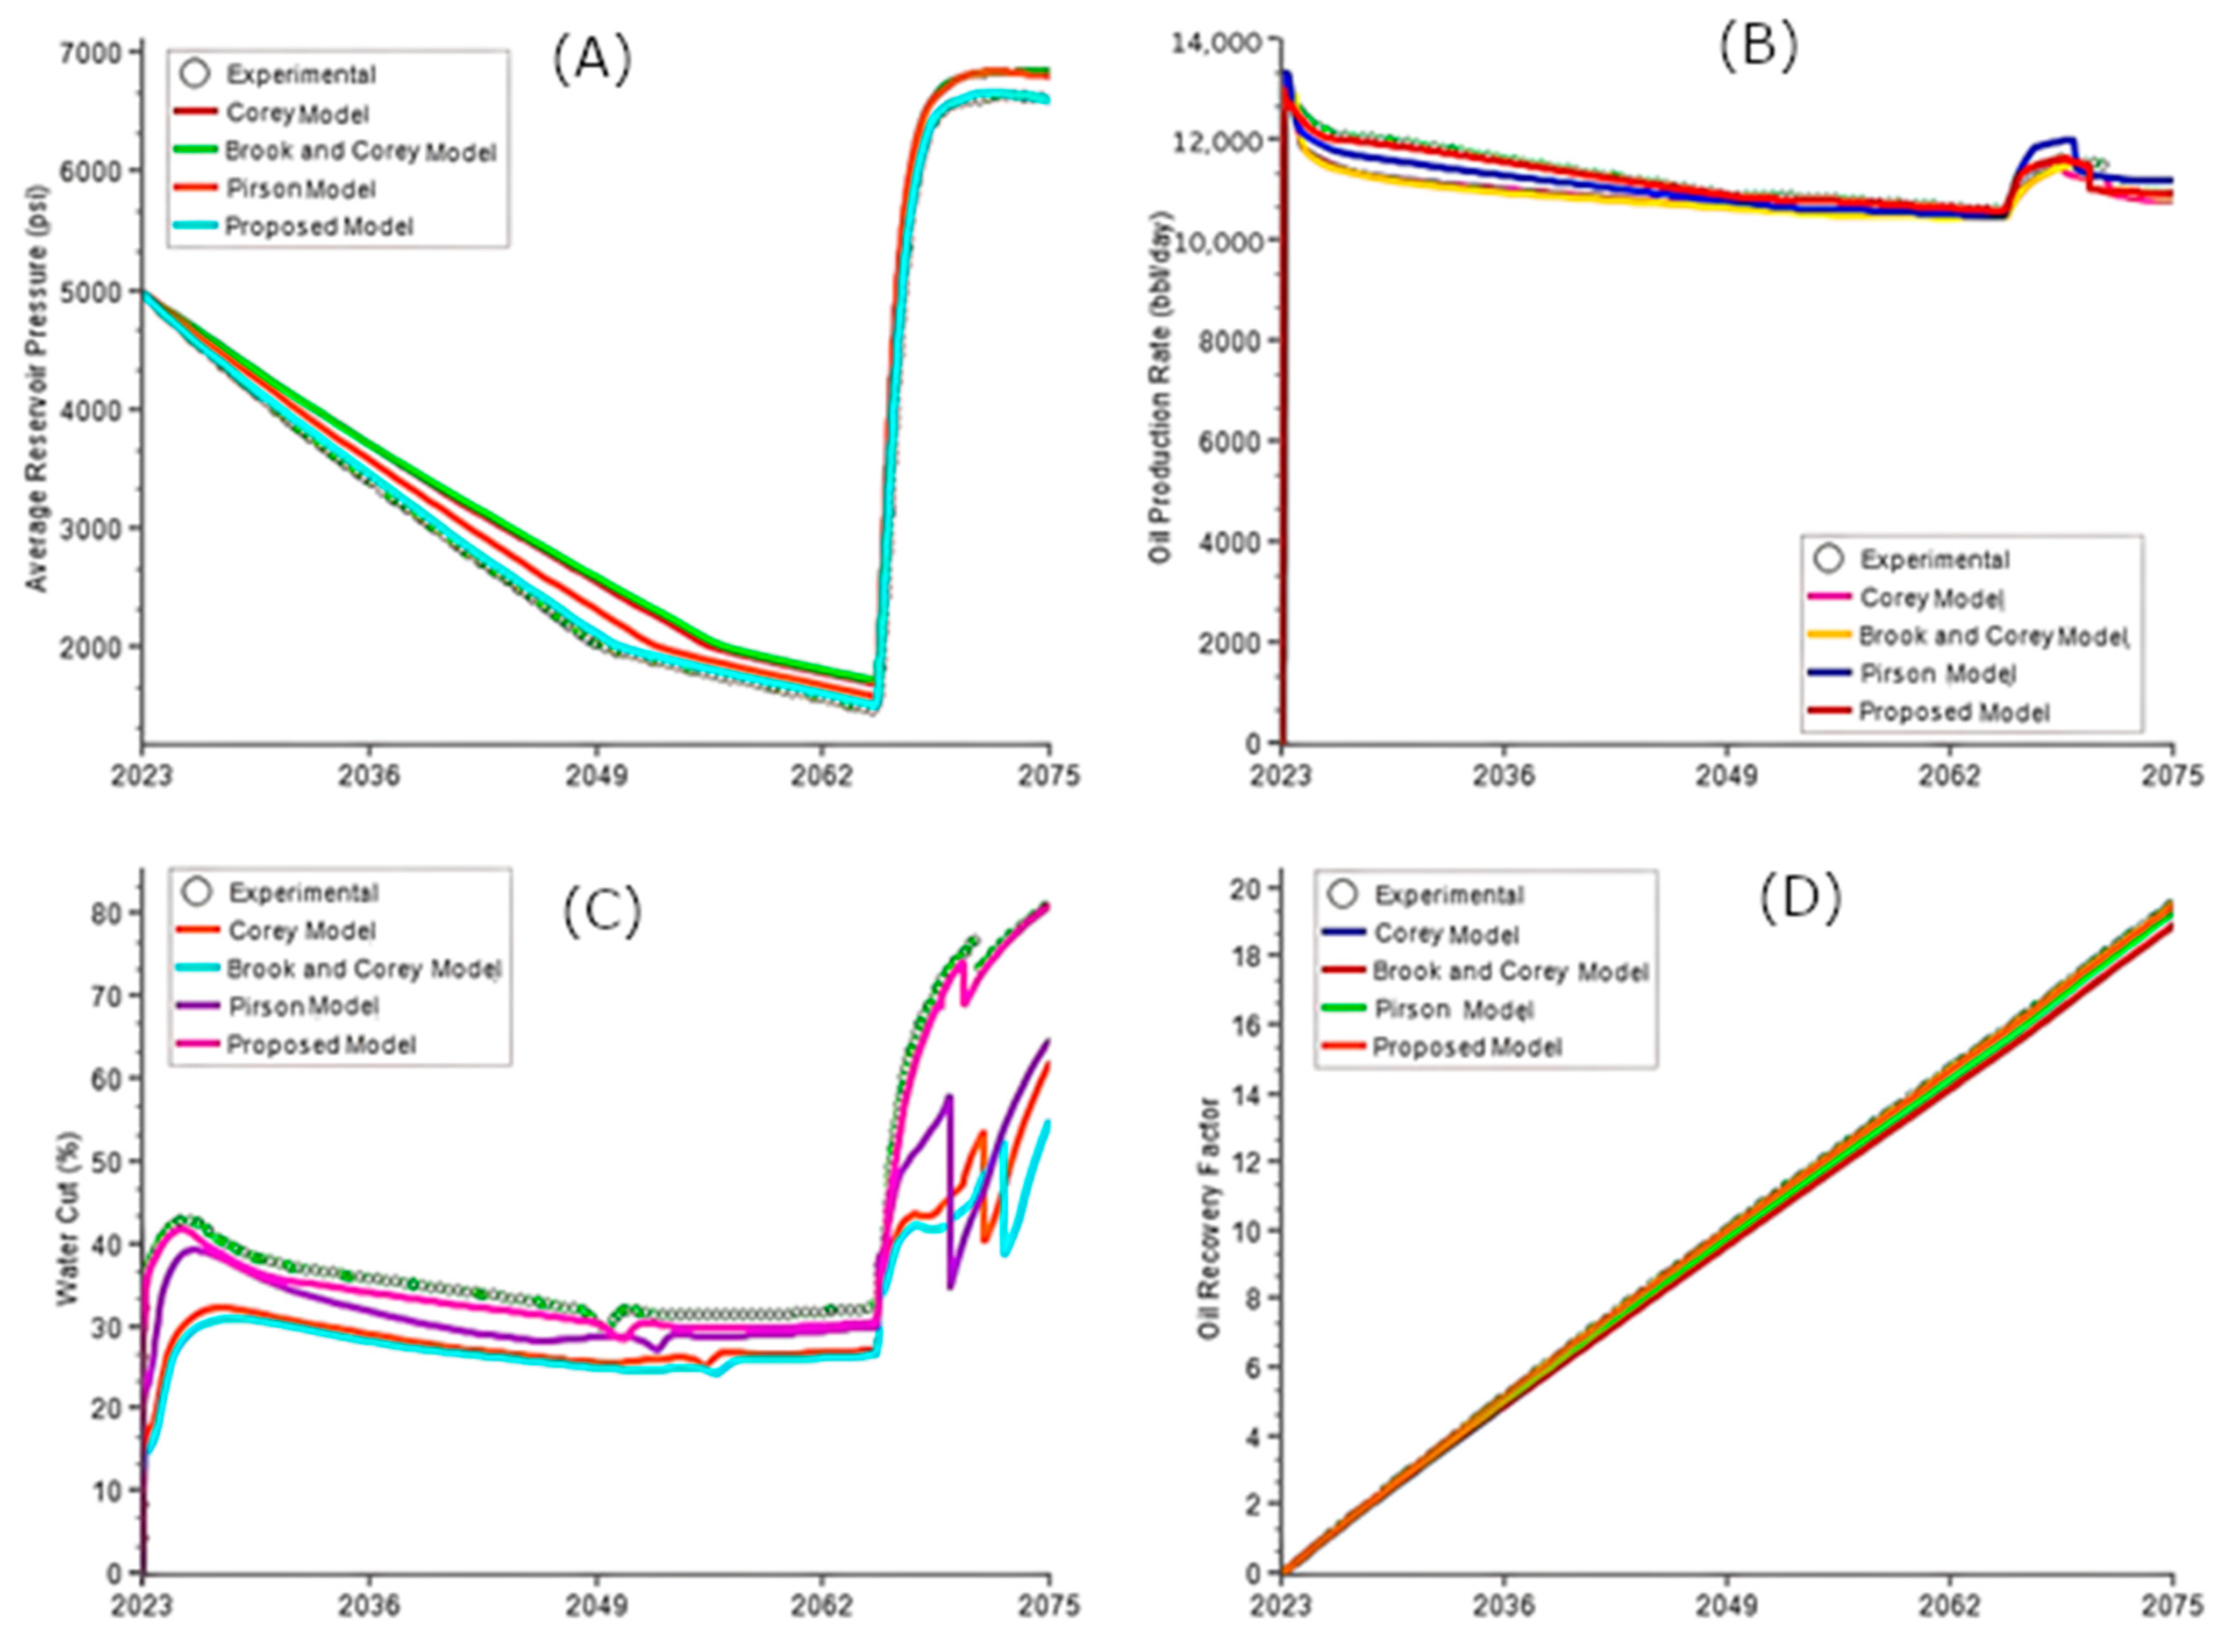
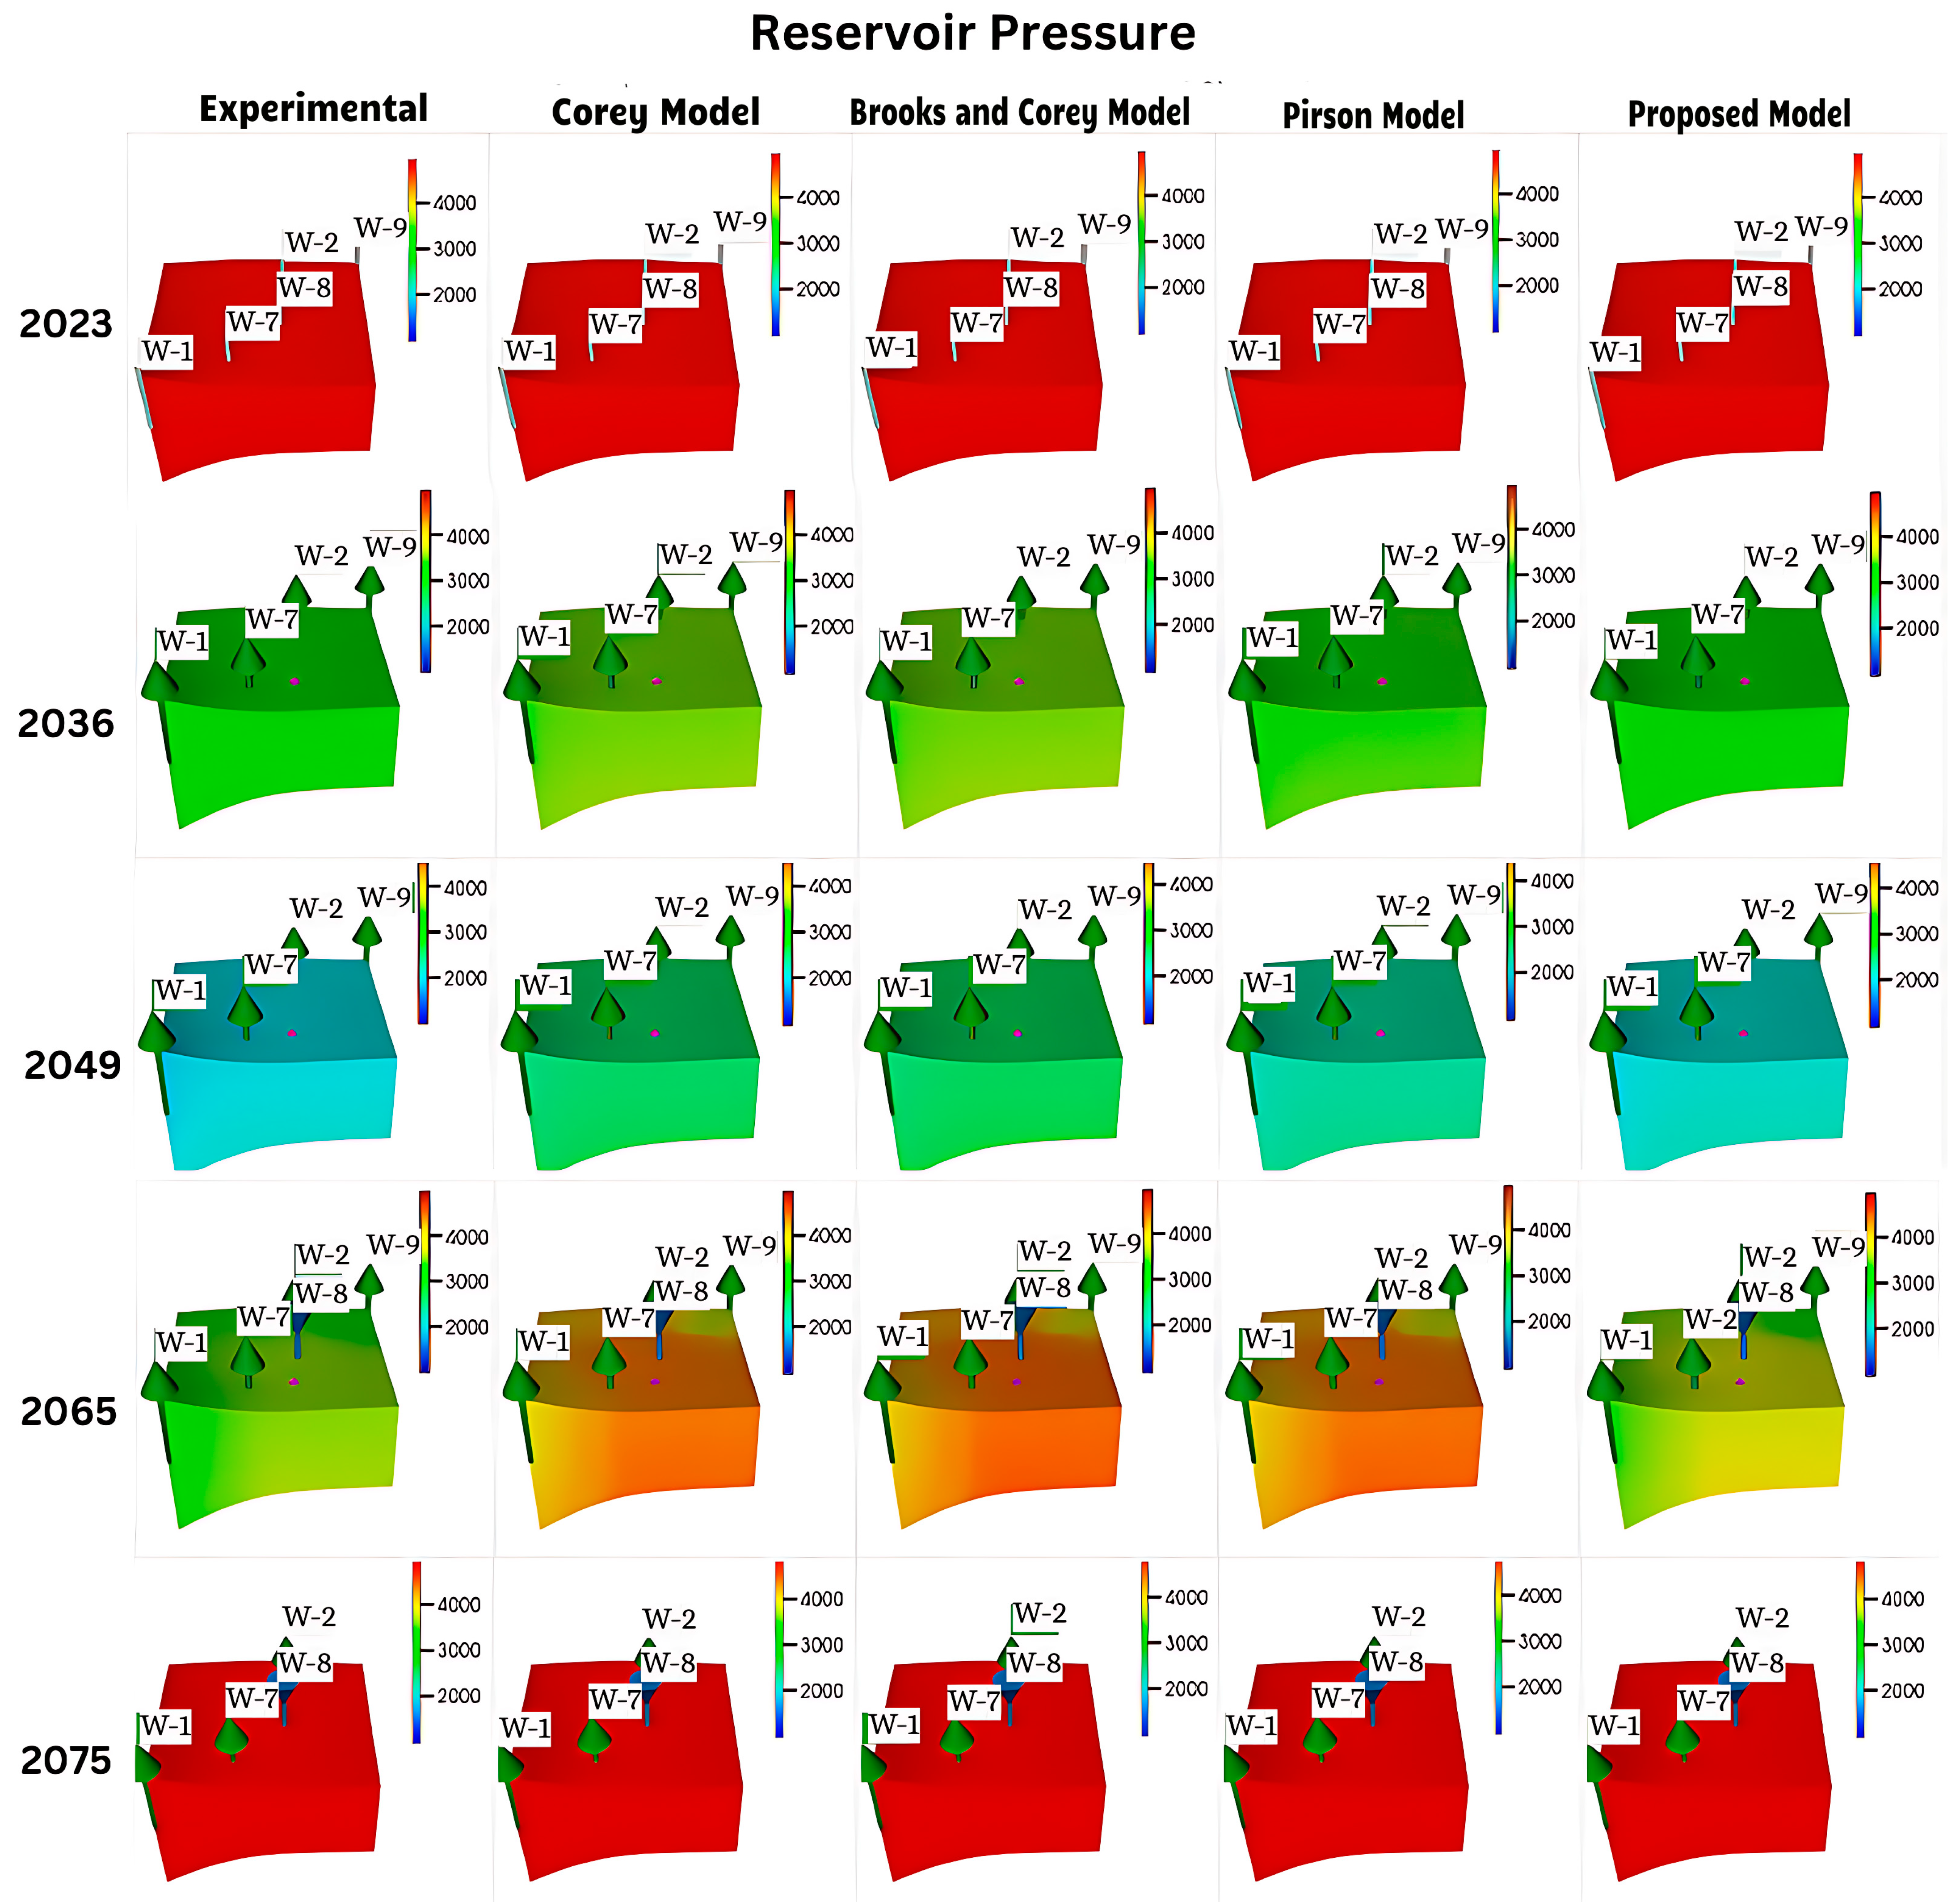
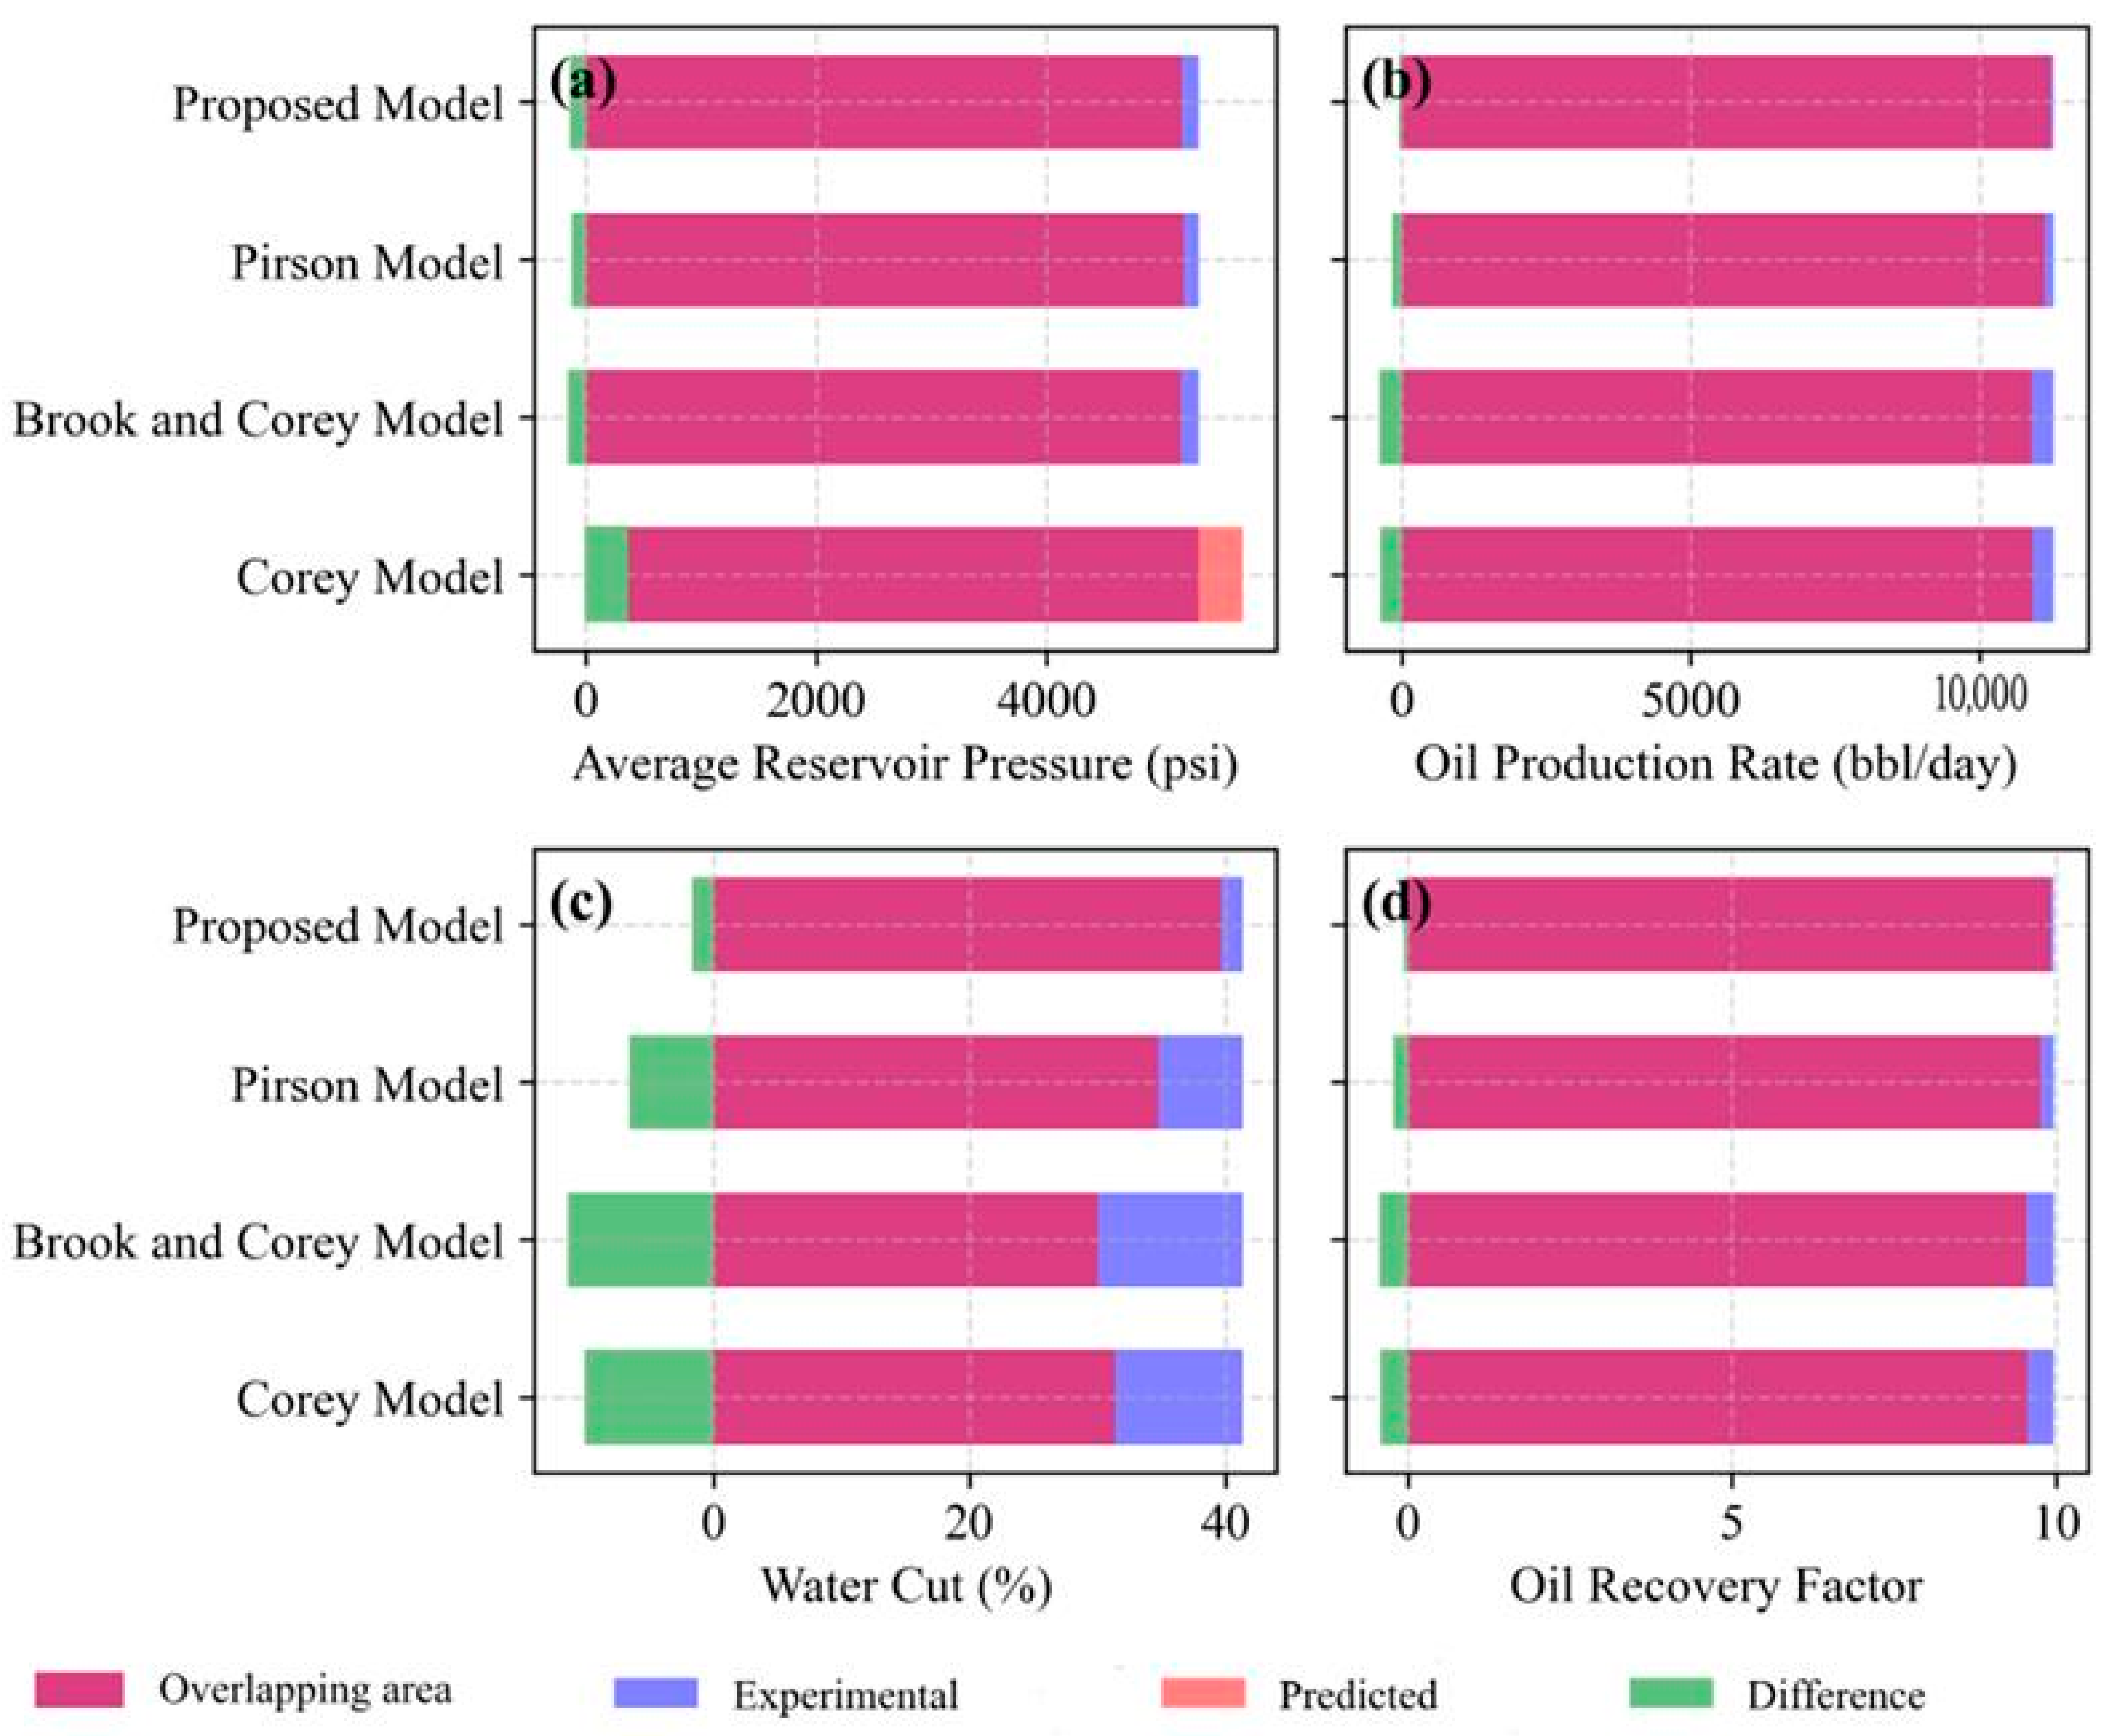
  • The pre-injection Corey and Brooks and Corey models overestimated average reservoir pressures, while the Pirson model was comparatively closer to experimental data. Due to water injection, pressures surged from 1500 psi to 6800 psi between the years 2065 and 2068. The proposed NLPM’s results were closest to the experimental data in the reservoir pressure simulation.
  • The oil production rate of the proposed NLPM followed almost the same trend as that of experimental data numerical simulation, except for the sudden increase in oil production rate after the water injection commenced, between the years 2065 to 2070. The Corey, and Brooks and Corey models achieved higher accuracy in predicting oil production rate after the water injection.
  • Relative permeability models with higher water–oil mobility yield higher water cuts, indicating greater sensitivity to water production in simulations. These models become less effective post-water injection in predicting reservoir pressure and oil production rates. Before water injection, the Corey, and Brooks and Corey models displayed similar water cut trends, while the proposed model closely matched experimental results.
  • Relative permeability models initially showed similar oil recovery factors up to the year 2032; divergences increased as the simulation progressed. The proposed model most closely matched the experimental data, followed by the Pirson, Corey, and Brooks and Corey models, in that order.
  • The results confirm that it is essential to select the most appropriate relative permeability models based on the specific reservoir characteristics when constructing water-injection simulation models. The prediction accuracy of these models plays a crucial role in optimizing oil production and recovery processes. Hence, applying the proposed NLPM to the studied field would improve field development performance, decision-making and sustainability.

Author Contributions

Conceptualization, A.I. and F.T.; methodology, A.I.; software, A.I. and F.A.; validation, A.I., F.T. and F.A.; formal analysis, A.I.; investigation, A.I.; resources, A.I. and Q.Y.; writing—original draft preparation, A.I., Q.Y, D.A.W. and E.M.; writing—review and editing, S.A., D.A.W. and Q.Y.; visualization, A.I., Q.Y., D.A.W. and E.M.; supervision, S.A., Q.Y., F.T., D.A.W. and E.M.; project administration, S.A., F.T. and Q.Y.; All authors have read and agreed to the published version of the manuscript.

Funding

This research received no external funding.

Institutional Review Board Statement

Not applicable.

Informed Consent Statement

Not applicable.

Data Availability Statement

The raw data supporting the conclusions of this article will be made available by the authors on request.

Conflicts of Interest

The authors declare no conflict of interest.

Appendix A

Table A1. Tabulation of Experimental Results for the Studied Reservoir.
SwkrwkroPc
0.15000.882.750
0.2000.0050.750.660
0.2500.010.590.540
0.3000.0170.450.480
0.3500.0230.330.420
0.4000.0310.250.380
0.4500.0390.180.340
0.5000.050.120.300
0.5500.0630.0720.270
0.6000.080.0370.240
0.6500.10.0160.210
0.7000.120.0020.170
0.7500.150.00010.120
0.8000.1900.050

References

  1. Krause, M.H.; Benson, S.M. Accurate determination of characteristic relative permeability curves. Adv. Water Resour. 2015, 83, 376–388. [Google Scholar] [CrossRef]
  2. Xu, J.; Guo, C.; Jiang, R.; Wei, M. Study on relative permeability characteristics affected by displacement pressure gradient: Experimental study and numerical simulation. Fuel 2016, 163, 314–323. [Google Scholar] [CrossRef]
  3. Zhou, Y.; Yin, D.; Cao, R.; Zhang, C. The mechanism for pore-throat scale emulsion displacing residual oil after water flooding. J. Pet. Sci. Eng. 2018, 163, 519–525. [Google Scholar] [CrossRef]
  4. Sakhaei, Z.; Azin, R.; Osfouri, S. Assessment of empirical/theoretical relative permeability correlations for gas-oil/condensate systems. In Proceedings of the 1st Biennial Persian Gulf Oil, Gas and Petrochemical Energy and Environment Conference, Bushehr, Iran, 20 April 2016. [Google Scholar]
  5. Sorop, T.G.; Masalmeh, S.K.; Suijkerbuijk, B.M.; van der Linde, H.A.; Mahani, H.; Brussee, N.J.; Marcelis, F.A.; Coorn, A. Relative permeability measurements to quantify the low salinity flooding effect at field scale. In Proceedings of the Abu Dhabi International Petroleum Exhibition and Conference, Abu Dhabi, United Arab Emirates, 9–12 November 2015; SPE: Richardson, TX, USA, 2015. [Google Scholar]
  6. Fan, H. Performance evaluation of waterflood reservoirs in high water cut period based on new relative permeability model. Petrol. Sci. Eng. 2020, 4, 64–69. [Google Scholar] [CrossRef]
  7. Loahardjo, N.; Xie, X.; Winoto, W.; Buckley, J.; Morrow, N.R. Oil recovery by sequential waterflooding: The effects of aging at residual oil and initial water saturation. In Proceedings of the SPE Improved Oil Recovery Conference, Tulsa, OK, USA, 14–18 April 2012; SPE: Richardson, TX, USA, 2012. [Google Scholar]
  8. Niu, Q.; Hu, M.; Chang, J.; Wang, W.; Yuan, W.; Wang, Q.; Zheng, Y.; Shang, S. Explosive fracturing mechanism in low-permeability sandstone-type uranium deposits considering different acidification reactions. Energy 2024, 312, 133676. [Google Scholar] [CrossRef]
  9. Yu, X.; Wang, Y.; Yang, Y.; Wang, K.; Yao, J.; Zhang, K.; Sun, H.; Zhang, L.; Song, W.; Lisitsa, V. Effect of particle content on relative permeabilities in water flooding. J. Pet. Sci. Eng. 2021, 205, 108856. [Google Scholar] [CrossRef]
  10. Meng, L.; Zhang, X.; Jin, Y.; Yan, K.; Li, Z.; Fu, H.; Li, S. Prediction model and real-time diagnostics of hydraulic fracturing pressure for highly deviated wells in deep oil and gas reservoirs. Sci. Rep. 2025, 15, 3559. [Google Scholar] [CrossRef]
  11. Purcell, W. Capillary pressures-their measurement using mercury and the calculation of permeability therefrom. J. Pet. Technol. 1949, 1, 39–48. [Google Scholar] [CrossRef]
  12. Burdine, N. Relative permeability calculations from pore size distribution data. J. Pet. Technol. 1953, 5, 71–78. [Google Scholar] [CrossRef]
  13. Brooks, R.H.; Corey, A.T. Properties of porous media affecting fluid flow. J. Irrig. Drain. Div. 1966, 92, 61–88. [Google Scholar] [CrossRef]
  14. Mukherjee, S.; Johns, R.T. Relative Permeability Modeling for CO2 Storage Using Physically Constrained Artificial Neural Networks. In Proceedings of the SPE Improved Oil Recovery Conference, Tulsa, OK, USA, 22–25 April 2024; SPE: Richardson, TX, USA, 2024. [Google Scholar]
  15. Pirson, S.J. Oil Reservoir Engineering; McGraw Hill: New York, NY, USA, 1958. [Google Scholar]
  16. Li, K.; Shapiro, M.; Horne, R.N.; Ma, S.; Hajari, A.; Mudhhi, M. In situ estimation of relative permeability from resistivity measurements. Pet. Geosci. 2014, 20, 143–151. [Google Scholar] [CrossRef]
  17. Chai, X.; Tian, L.; Wang, J.; Chen, S.; Mo, S.; Zhang, K. A novel prediction model of oil-water relative permeability based on fractal theory in porous media. Fuel 2024, 372, 131840. [Google Scholar] [CrossRef]
  18. Guo, Z.; Chen, X.; Wang, B.; Ren, X. Two-phase relative permeability of hydrate-bearing sediments: A theoretical model. Energy 2023, 275, 127441. [Google Scholar] [CrossRef]
  19. Zhang, L.; Yuan, X.; Luo, L.; Tian, Y.; Zeng, S. Seepage Characteristics of Broken Carbonaceous Shale under Cyclic Loading and Unloading Conditions. Energy Fuels 2024, 38, 1192–1203. [Google Scholar] [CrossRef]
  20. Dong, Z.; Tian, S.; Xue, H.; Lu, S.; Liu, B.; Erastova, V.; Wu, M.; Wu, R. Analysis of Pore Types in Lower Cretaceous Qingshankou Shale Influenced by Electric Heating. Energy Fuels 2024, 38, 20577–20590. [Google Scholar] [CrossRef]
  21. Zhang, X.; Wu, C.; Liu, S. Characteristic analysis and fractal model of the gas-water relative permeability of coal under different confining pressures. J. Pet. Sci. Eng. 2017, 159, 488–496. [Google Scholar] [CrossRef]
  22. Gan, B.; Li, Z.; Huo, W.; Zhang, Y.; Li, Z.; Fan, R.; Zhang, H.; Xu, Y.; He, Y. Phase transitions of CH4 hydrates in mud-bearing sediments with oceanic laminar distribution: Mechanical response and stabilization-type evolution. Fuel 2025, 380, 133185. [Google Scholar] [CrossRef]
  23. Liu, T.; Zhao, G.; Qu, B.; Gong, C. Characterization of a fly ash-based hybrid well cement under different temperature curing conditions for natural gas hydrate drilling. Constr. Build. Mater. 2024, 445, 137874. [Google Scholar] [CrossRef]
  24. Druetta, P.; Tesi, P.; De Persis, C.; Picchioni, F. Methods in oil recovery processes and reservoir simulation. Adv. Chem. Eng. Sci. 2016, 6, 399–435. [Google Scholar] [CrossRef]
  25. Cao, R.; Jia, Z.; Cheng, L.; Wang, Z.; Ye, T.; Rui, Z. Using high-intensity water flooding relative permeability curve for predicting mature oilfield performance after long-term water flooding in order to realize sustainable development. J. Pet. Sci. Eng. 2022, 215, 110629. [Google Scholar] [CrossRef]
  26. Zhou, Z.; Jia, H.; Zhang, R.; Ding, B.; Geng, X. Three dimensional time-variation simulator for water flooding reservoir based on “effective water flux”. Phys. Fluids 2024, 36, 103101. [Google Scholar] [CrossRef]
  27. Al-Fattah, S.M. Empirical equations for water/oil relative permeability in Saudi sandstone reservoirs. In Proceedings of the SPE Nigeria Annual International Conference and Exhibition, Abuja, Nigeria, 4–6 August 2003; SPE: Richardson, TX, USA, 2003. [Google Scholar]
  28. Li, K.; Horne, R.N. Numerical simulation without using experimental data of relative permeability. J. Pet. Sci. Eng. 2008, 61, 67–74. [Google Scholar] [CrossRef]
  29. Corey, A.T. The interrelation between gas and oil relative permeabilities. Prod. Mon. 1954, 19, 38–41. [Google Scholar]
  30. Al-Mossawy, M.I. A simple approach to identify the proper relative permeability model. In Proceedings of the IOP Conference Series: Materials Science and Engineering; IOP Publishing: Bristol, UK, 2019. [Google Scholar]
  31. Zahoor, M.K. In-house developed Kr estimator: Implemented to analyze the sensitivity of relative permeability data to variations in wetting phase saturation. Energy Explor. Exploit. 2011, 29, 817–825. [Google Scholar] [CrossRef]
  32. Waqas, U.; Ahmed, M.F. Prediction modeling for the estimation of dynamic elastic Young’s modulus of thermally treated sedimentary rocks using linear–nonlinear regression analysis, regularization, and ANFIS. Rock Mech. Rock Eng. 2020, 53, 5411–5428. [Google Scholar] [CrossRef]
  33. Seber, G.; Wild, C. NonLinear Regression; Wiley: New York, NY, USA, 2003. [Google Scholar]
  34. Cheng, H.; Wang, F.; Yang, G.; Guan, X.; Cheng, Z.; Li, H.; Yu, C.; Feng, G.; Yuan, Y. Prediction of relative permeability from capillary pressure based on the fractal capillary bundle model. Appl. Therm. Eng. 2024, 239, 122093. [Google Scholar] [CrossRef]
  35. Ismail, A.; Torabi, F.; Azadbakht, S.; Yasin, Q. Identification of natural fractures in shale gas reservoirs using fracture signature function and machine learning models. Unconv. Resour. 2024, 4, 100069. [Google Scholar] [CrossRef]
  36. Ismail, A.; Azadbakht, S.; Rashid, H.M.A.; Yasin, Q.; Liu, B.; Ijaz, W. Statistical and machine learning hybridization for predicting shear wave velocity in tight sand reservoirs: A case study. Geoenergy Sci. Eng. 2023, 231, 212420. [Google Scholar] [CrossRef]
  37. Qin, X.; Cai, J.; Wang, G. Pore-scale modeling of pore structure properties and wettability effect on permeability of low-rank coal. Int. J. Min. Sci. Technol. 2023, 33, 573–584. [Google Scholar] [CrossRef]
  38. Taghavi, B.; Hajizadeh, F.; Moomivand, H. Comparison of artificial intelligence and multivariate regression methods in predicting the uniaxial compressive strength of rock during the specific resistivity monitoring. Bull. Eng. Geol. Environ. 2023, 82, 409. [Google Scholar] [CrossRef]
  39. Alizadeh, S.M.; Iraji, A.; Tabasi, S.; Ahmed, A.A.A.; Motahari, M.R. Estimation of dynamic properties of sandstones based on index properties using artificial neural network and multivariate linear regression methods. Acta Geophys. 2022, 70, 225–242. [Google Scholar] [CrossRef]
  40. Du, Q.; Yasin, Q.; Ismail, A.; Sohail, G.M. Combining classification and regression for improving shear wave velocity estimation from well logs data. J. Pet. Sci. Eng. 2019, 182, 106260. [Google Scholar] [CrossRef]
  41. Ismail, A.; Yasin, Q.; Du, Q.; Bhatti, A.A. A comparative study of empirical, statistical and virtual analysis for the estimation of pore network permeability. J. Nat. Gas Sci. Eng. 2017, 45, 825–839. [Google Scholar] [CrossRef]
  42. Zhou, Y.; Guan, W.; Sun, Q.; Zou, X.; He, Z. Effect of multi-scale rough surfaces on oil-phase trapping in fractures: Pore-scale modeling accelerated by wavelet decomposition. Comput. Geotech. 2025, 179, 106951. [Google Scholar] [CrossRef]
  43. Hodson, T.O. Root mean square error (RMSE) or mean absolute error (MAE): When to use them or not. Geosci. Model Dev. Discuss. 2022, 2022, 5481–5487. [Google Scholar] [CrossRef]
  44. Chicco, D.; Warrens, M.J.; Jurman, G. The coefficient of determination R-squared is more informative than SMAPE, MAE, MAPE, MSE and RMSE in regression analysis evaluation. Peerj Comput. Sci. 2021, 7, e623. [Google Scholar] [CrossRef] [PubMed]
  45. Bhatti, A.A.; Ismail, A.; Raza, A.; Gholami, R.; Rezaee, R.; Nagarajan, R.; Saffou, E. Permeability prediction using hydraulic flow units and electrofacies analysis. Energy Geosci. 2020, 1, 81–91. [Google Scholar] [CrossRef]
  46. Ismail, A.; Yasin, Q.; Du, Q. Application of hydraulic flow unit for pore size distribution analysis in highly heterogeneous sandstone reservoir: A case study. J. Jpn. Pet. Inst. 2018, 61, 246–255. [Google Scholar] [CrossRef]
  47. Dar, Q.U.Z.; Renhai, P.; Ghazi, S.; Ahmed, S.; Ali, R.I.; Mehmood, M. Depositional facies and reservoir characteristics of the Early Cretaceous Lower Goru Formation, Lower Indus Basin Pakistan: Integration of petrographic and gamma-ray log analysis. Petroleum 2023, 9, 331–341. [Google Scholar] [CrossRef]
  48. Munir, K.; Iqbal, M.A.; Farid, A.; Shabih, S.M. Mapping the productive sands of Lower Goru Formation by using seismic stratigraphy and rock physical studies in Sawan area, southern Pakistan: A case study. J. Pet. Explor. Prod. Technol. 2011, 1, 33–42. [Google Scholar] [CrossRef]
  49. Yasin, Q.; Du, Q.; Ismail, A.; Shaikh, A. A new integrated workflow for improving permeability estimation in a highly heterogeneous reservoir of Sawan Gas Field from well logs data. Geomech. Geophys. Geo-Energy Geo-Resour. 2019, 5, 121–142. [Google Scholar] [CrossRef]
  50. Berger, A.; Gier, S.; Krois, P. Porosity-preserving chlorite cements in shallow-marine volcaniclastic sandstones: Evidence from Cretaceous sandstones of the Sawan gas field, Pakistan. AAPG Bull. 2009, 93, 595–615. [Google Scholar] [CrossRef]
  51. Li, Z.; Huang, X.; Xu, X.; Bai, Y.; Zou, C. Unstable Coalescence Mechanism and Influencing Factors of Heterogeneous Oil Droplets. Molecules 2024, 29, 1582. [Google Scholar] [CrossRef] [PubMed]
  52. Xiao, D.; Chen, L.; Xu, X.; Tang, G.; Hu, Y.; Guo, B.; Liu, M.; Yuan, C.; Li, G. Coupling model of wellbore heat transfer and cuttings bed height during horizontal well drilling. Phys. Fluids 2024, 36, 097163. [Google Scholar] [CrossRef]
  53. Niu, Q.; Wang, J.; He, J.; Yuan, W.; Chang, J.; Wang, W.; Yuan, J.; Wang, Q.; Zheng, Y.; Shang, S. Evolution of pore structure, fracture morphology and permeability during CO2+O2 in-situ leaching process of fractured sandstone. Energy 2025, 315, 134348. [Google Scholar] [CrossRef]
  54. Morris, R.; Biggs, W. Using log-derived values of water saturation and porosity. In Proceedings of the SPWLA Annual Logging Symposium, Denver, CO, USA, 12–14 June 1967; SPWLA: Houston, TX, USA, 1967. [Google Scholar]
  55. Ismail, A.; Raza, A.; Gholami, R.; Rezaee, R. Reservoir characterization for sweet spot detection using color transformation overlay scheme. J. Pet. Explor. Prod. Technol. 2020, 10, 2313–2334. [Google Scholar] [CrossRef]
  56. Li, K.; Home, R. Calculation of steam-water relative permeability using capillary pressure data. In Proceedings of the 27th Workshop on Geothermal Reservoir Engineering, Stanford, CA, USA, 28–30 January 2002; Citeseer: University Park, PA, USA, 2025. [Google Scholar]
  57. Purswani, P.; Johns, R.T.; Karpyn, Z.T.; Blunt, M. Predictive modeling of relative permeability using a generalized equation of state. SPE J. 2021, 26, 191–205. [Google Scholar] [CrossRef]
  58. Wang, F.; Jiao, L.; Zhao, J.; Cai, J. A more generalized model for relative permeability prediction in unsaturated fractal porous media. J. Nat. Gas Sci. Eng. 2019, 67, 82–92. [Google Scholar] [CrossRef]
  59. Avdeef, A. Do you know your r2? ADMET DMPK 2021, 9, 69–74. [Google Scholar] [CrossRef]
  60. Meng, W.; Zhang, Y.; Pei, H.; Yu, J.; Hu, Y.; Gu, Z.; Su, J. Pore-scale investigation on the effect of capillary barrier on two-phase displacement in dual-structure porous media. Phys. Fluids 2024, 36, 012003. [Google Scholar] [CrossRef]
  61. Ogbeiwi, P.; Aladeitan, Y.; Udebhulu, D. An approach to waterflood optimization: Case study of the reservoir X. J. Pet. Explor. Prod. Technol. 2018, 8, 271–289. [Google Scholar] [CrossRef]
  62. Deng, R.; Dong, J.; Dang, L. Numerical simulation and evaluation of residual oil saturation in waterflooded reservoirs. Fuel 2025, 384, 134018. [Google Scholar] [CrossRef]
  63. Moodie, N.; Ampomah, W.; Jia, W.; McPherson, B. Relative permeability: A critical parameter in numerical simulations of multiphase flow in porous media. Energies 2021, 14, 2370. [Google Scholar] [CrossRef]
  64. Li, Y.; Jia, D.; Wang, S.; Qu, R.; Qiao, M.; Liu, H. Surrogate model for reservoir performance prediction with time-varying well control based on depth generative network. Pet. Explor. Dev. 2024, 51, 1287–1300. [Google Scholar] [CrossRef]
  65. Alpak, F.O.; Lake, L.W.; Embid, S.M. Validation of a modified Carman-Kozeny equation to model two-phase relative permeabilities. In Proceedings of the SPE Annual Technical Conference and Exhibition, Houston, TX, USA, 3–6 October 1999; SPE: Richardson, TX, USA, 1999. [Google Scholar]
Figure 1. A workflow for implementing selected constants from the proposed model.
Sustainability 17 02526 g001
Figure 2. (a) Location of the Lower Indus Basin and Sawan Gas Field, (b) stratigraphic division of the Goru Formation. The red color in (b) shows the zone of interest.
Sustainability 17 02526 g002
Figure 3. Testing apparatus used to determine relative permeability: 1. Air compressor, 2. pressure regulator, 3. gauge, 4. voltmeter, 5. pressure transducer, 6. core holder, 7. burette, 8. injection pumps, 9. separator, 10. transmission source.
Sustainability 17 02526 g003
Figure 4. Experimental data, (a) capillary pressure, (b) relative permeability data of the reservoir.
Sustainability 17 02526 g004
Figure 5. Methodology of reservoir simulation workflow applied.
Sustainability 17 02526 g005
Figure 6. Sandstone reservoir simulation model for numerical simulation of water flooding. The vertical lines and labels represent the locations and names of the modeled wells. The different colors in the simulation model show variations in the reservoir attributes within the considered meshing.
Sustainability 17 02526 g006
Figure 7. Prediction of relative permeability of studied reservoir comparing experimental results for kro and krw with the predictions of classical empirical models and the proposed NLPM. The black line with square markers depicts the experimental kro versus SwD relationship, whereas the colored lines depict the predicted relationships of the other models. The aqua-colored line with square data points shows the kro versus SwD of the proposed NLPM.
Sustainability 17 02526 g007
Figure 8. Predictive model evaluation. The purple and orange bars show the prediction errors of the models evaluated for krw and kro, respectively. The blue and red dashed lines are RMSE and R2, respectively.
Sustainability 17 02526 g008
Figure 9. Porosity and permeability distributions in the studied reservoir with the locations of wells W-1. W-7, W-8, W-2, and W-9 identified. The specific range of the petrophysical properties is distinguished by color coding in the bar graph. The total cell counts associated with specific ranges of petrophysical properties are shown by numbers at the top of each bar.
Sustainability 17 02526 g009
Figure 10. Numerical simulation results for primary production of the studied reservoir (i.e., without any water injection).
Sustainability 17 02526 g010
Figure 11. Reservoir performance for the simulated water flooding case applied to the studied reservoir, (A) average reservoir pressure, (B) oil production rate, (C) water cut, and (D) oil recovery factor.
Sustainability 17 02526 g011
Figure 12. Time-lapse behavior of reservoir pressure in the simulated water flooding case of the studied reservoir. The y-axis represents different years, while the x-axis shows various predictive models to assess their respective influences on reservoir performance. These charts compare the reservoir response for each year against the performance predicted by each model. Color coding indicates the range of reservoir pressure for each model and time point. Green arrows represent production wells, while blue arrows indicate the injection well (W-8) in the studied reservoir from the year 2065.
Sustainability 17 02526 g012
Figure 13. Time-lapse behavior of oil saturation in the simulated water flooding case of the studied reservoir. The y-axis represents different years, while the x-axis shows various predictive models used to assess the reservoir performance. The figure compares the reservoir response for each year against the performance predicted by each model. Color coding indicates the range of reservoir oil saturation for each model and time point. Green arrows represent production wells, while the blue arrow indicates the injection well (W-8) in the studied reservoir from the year 2065.
Sustainability 17 02526 g013
Figure 14. Comparative analysis of the relative permeability model predictions of key reservoir performance characteristics derived from the numerical water flooding simulation model of the studied reservoir. Each subplot illustrates a specific reservoir performance indicator: (a) average reservoir pressure, (b) oil production rate, (c) water cut, and (d) oil recovery factor. The y-axis represents different predictive models, while the x-axis shows various reservoir performance indicator values. Since, we have considered the condition for bar length according to predicted value—experimental value, the positive length shows the higher predicted value while negative value is for higher experimental value than predicted value.
Sustainability 17 02526 g014
Table 1. Reservoir base parameters in cases considered in the numerical simulation. The permeability distribution is expressed in terms of three directions (i, j, and k) corresponding to the x, y, and z axis of the developed reservoir model.
Base Parameters in All Cases
Porosity0.06–0.22
Permeability (i, j = i, k = i × 0.1)Geostatistical model
Thickness of reservoir456 ft
Grid size 70 × 60 × 10 = 42,000
No of layers 10
Grid thickness26–46 ft
Reservoir pressure5000 psi
Water oil contact10,935 ft
LithologySandstone
Perforation length 30–45 ft
Disclaimer/Publisher’s Note: The statements, opinions and data contained in all publications are solely those of the individual author(s) and contributor(s) and not of MDPI and/or the editor(s). MDPI and/or the editor(s) disclaim responsibility for any injury to people or property resulting from any ideas, methods, instructions or products referred to in the content.

