Article

Dynamic Load Flow in Modern Power Systems: Renewables, Crypto Mining, and Electric Vehicles

Electrical-Electronics Engineering, Engineering Faculty, Bingol University, 12000 Bingol, Turkey
Sustainability 2025, 17(6), 2515; https://doi.org/10.3390/su17062515
Submission received: 6 February 2025 / Revised: 23 February 2025 / Accepted: 7 March 2025 / Published: 13 March 2025

Abstract

The modern electric power-distribution grid is increasingly integrating various components, including distributed sources of renewable energy, electric vehicles (EVs), and Bitcoin-mining operations. This shift signals a transformation in energy management and consumption. The growing presence of solar and wind energy contributes to a more diversified and sustainable energy mix, while the incorporation of EVs advances the pursuit of sustainable transportation. However, the addition of Bitcoin-mining operations introduces new complexities, raising concerns over energy consumption and grid stability. To address these challenges, this study conducted 24-h load-flow analyses on a power system that integrates intermittent renewable sources, Bitcoin-mining farms, and EVs, considering the variability in power demand. The analysis examined changes in bus voltage and power factor throughout the day using a Matlab/Simulink 2016b program. Simulation results indicate that bus voltages remained relatively stable despite the fluctuations in the generation of renewable energy and load variations. However, as the penetration of distributed generation of renewable energy increased, power factors exhibited a significant decline, dropping as low as 0.59 at certain buses due to increased injection of reactive power. At 13:00, during the period of peak generation of solar energy and high EV demand, voltage levels increased by up to 1.1 p.u., while power factors deteriorated significantly. This study highlights the importance of limiting the production of reactive power from local renewable sources under high-production conditions to sustain power factor stability. The findings emphasize the importance of detecting unfavorable system conditions and implementing safeguards to ensure reliable resource management in the evolving landscape of electric power-distribution grids.

1. Introduction

The growing intersection of renewable energy systems, Bitcoin mining, and electric vehicles (EVs) has led to a complex and multifaceted discussion concerning the sustainability and efficiency of modern energy systems [1,2,3,4]. As the global transition toward renewable energy sources gains momentum and the demand for emerging technologies such as cryptocurrencies and electric vehicles increases, it is crucial to understand the combined impacts of these forces on energy consumption and grid stability. This convergence not only presents challenges but also opens up new opportunities for the energy sector, particularly in balancing the demands of these technologies with environmental sustainability and grid reliability [4].
Renewable energy systems—such as solar, wind, and hydroelectric power—are pivotal in the ongoing global effort to reduce greenhouse gas emissions and mitigate climate change [5]. These sources of energy, unlike fossil fuels, do not emit harmful pollutants, making them essential in achieving sustainable energy goals. However, the intermittent nature of renewable energy production, where energy generation fluctuates based on environmental factors like sunlight and wind speed, can create instability in the power grid [5]. This variability, when not effectively managed, poses significant challenges to grid operators, who must ensure a continuous, reliable energy supply. As a result, the integration of renewable energy into existing power grids requires advanced technologies and strategies to handle these fluctuations and to maximize energy storage and utilization [5].
In recent years, the growth of Bitcoin and other cryptocurrencies has led to a surge in energy consumption due to the energy-intensive nature of cryptocurrency mining. Bitcoin mining, which involves the use of specialized hardware to solve complex mathematical problems and validate transactions on the blockchain, requires a substantial amount of electricity [6]. This growing energy demand has raised concerns, particularly as Bitcoin mining is often powered by electricity generated from non-renewable sources, exacerbating environmental degradation. However, integrating renewable energy into Bitcoin-mining operations offers a potential way to reduce the carbon footprint of the cryptocurrency industry. By harnessing excess renewable energy during off-peak periods, Bitcoin mining can leverage an additional demand-response mechanism that helps balance energy production with consumption [7].
Parallel to the rise in cryptocurrency mining, the electrification of the transportation sector is accelerating as a critical strategy to reduce carbon emissions from conventional vehicles powered by fossil fuels. Electric vehicles (EVs) are seen as a cleaner alternative, offering the potential to decrease air pollution and dependence on oil. However, the widespread adoption of EVs also raises important considerations related to their energy consumption and the impact on the power grid [8]. EVs, when charged at home or at public charging stations, draw significant amounts of electricity, which can put additional strain on local grids, particularly during peak hours [9,10]. Furthermore, as the number of EVs increases, it is essential to consider how their charging patterns will affect grid stability. Smart charging solutions, which dynamically adjust the charging rate based on grid demand, can help alleviate some of these challenges and maximize the integration of renewable energy into the transportation sector [11].
The intersection of renewable energy, Bitcoin mining, and electric vehicles presents a promising opportunity to address both environmental and energy-grid challenges. EVs, for example, can serve as mobile energy-storage systems, storing excess renewable energy when it is abundant and feeding it back to the grid during periods of high demand. This bidirectional energy flow not only enhances grid stability but also helps to mitigate the variability of renewable energy sources. Similarly, Bitcoin-mining operations can benefit from the integration of renewable energy by utilizing surplus energy during off-peak hours, thus reducing the overall environmental impact of the industry. However, the integration of these technologies into a single, cohesive energy system also introduces several complexities. For example, the decentralized nature of Bitcoin mining makes it difficult to direct energy sourcing efficiently, while the infrastructure required to support widespread EV adoption and integration of renewable energy is still in development [5]. Grid stability and dynamic load-flow grid stability are critical concerns when integrating renewable energy, Bitcoin mining, and electric vehicles (EVs) into the power system. The variability of renewable energy production, coupled with the fluctuating energy demands of Bitcoin mining and EV charging, can lead to significant challenges for grid operators. To address these challenges, load-flow analysis is employed to evaluate the power distribution and stability of the grid under varying conditions. Various mathematical techniques are used in load-flow analysis, including well-known algorithms such as the Newton−Raphson method [12,13], the fast-decoupled method [14,15], and the Gauss−Seidel method [16]. These traditional approaches are complemented by contemporary heuristic methods like particle swarm optimization [17], a fuzzy logic algorithm [18], a differential evolution algorithm [19], a tabu search algorithm [20], and bacterial colony optimization [21], which offer alternative solutions for more complex and nonlinear systems.
In the 1960s, with the advent and widespread use of digital computers, numerous methods were developed to address load-flow problems [13]. Numerical methods, particularly the Newton−Raphson method, became the dominant approach due to their convergence speed and accuracy. The Newton−Raphson method, which iteratively refines the solution to multivariate nonlinear equations, is commonly used for load-flow analysis. Initially, random values for the variables are selected, and new values are generated based on these. The process continues iteratively until the difference between the newly generated values becomes acceptably small. In load-flow studies, the goal of the Newton−Raphson method is to determine the voltage amplitude values for all load buses and the angle values for all buses except the swing bus [13].
For instance, in 1988, D. Shirmohammadi, H.W. Hong, A. Semlyen, and G.X. Luo [22] described a load-flow method for weakly meshed distribution and transmission networks, utilizing the multi-input compensation technique and Kirchoff’s law. This method yielded excellent convergence and was applied successfully to several weak radial distribution and transmission networks. Furthermore, this method has been extended to handle both three-phase (unbalanced) and single-phase (balanced) networks, making it versatile for various applications.
Additionally, several studies have focused on enhancing the power quality of grid-integrated renewable hybrid systems. Mohammad, Md Fokhul, and Ashik [23] investigated the use of a Static VAR Compensator (SVC) to improve power quality in renewable-energy systems. By analyzing critical system parameters such as bus voltage, power-transfer capacity, and power losses during periods of low generation of renewable energy, they demonstrated that SVC can improve the voltage profile, reduce branch losses, and enhance power-transfer capabilities. This compensation technique helps eliminate voltage mismatches, a crucial factor when dealing with the discontinuities in energy production and uncertainty associated with renewable energy sources, such as solar and wind, as well as variable loads, such as those imposed by EV charging and Bitcoin mining.
To improve frequency stability and dynamic response in power systems with renewable energy sources (RESs), electric vehicles (EVs), and energy-storage systems (ESSs), Virtual synchronous generator (VSG) techniques have been widely studied. A multi-VSG-based frequency-regulation method has been proposed for AC microgrids with distributed EVs, enhancing grid frequency stability and load-sharing efficiency [24]. Similarly, an enhanced VSG-based control strategy with angular frequency deviation feedforward and energy-recovery mechanisms improves the dynamic response of energy-storage systems [25].
As the energy landscape evolves, it is crucial to develop methods that ensure the grid operates within acceptable limits despite the fluctuations caused by these sources of uncertainty. The integration of renewable energy, Bitcoin-mining operations, and electric vehicles into the grid introduces complex interactions that can strain the system’s stability. This study, therefore, aims to perform a load-flow analysis using the Newton−Raphson method to explore these impacts in detail. Renewable resources characterized by uncertainty and discontinuity in power production were incorporated into the IEEE 14-bus power system based on their 24-h-average production profiles.
Hourly and daily load-flow analyses were performed to capture the dynamic behavior of the system. The loads connected to the buses were dynamically modeled using 24-h-average power-demand profiles, which accurately represent the variable power demands that the grid might encounter throughout the day as a result of electric vehicles and Bitcoin-mining operations. By using the Newton−Raphson method, this research provides fast and accurate load-flow solutions with low convergence errors, enabling the examination of power factor and voltage stability in different operational scenarios [26].
Statistical analyses were then conducted on the results, including examinations of intra-day changes in bus voltage levels and power factor variations. A variability factor (σ/µ) was derived based on the standard deviation and average of these values and was used to assess the fluctuations in system performance. These analyses offer valuable insights into how renewable energy, Bitcoin mining, and EVs interact in the context of a real-world power system, and they can be used to inform strategies to manage grid stability while accommodating these emerging technologies. By evaluating the combined effects of these technologies on grid stability and incorporating dynamic load-flow analysis, this study provides a comprehensive understanding of how to optimize grid management in an evolving energy ecosystem.
While considerable research has been conducted on the integration of renewable energy, Bitcoin mining, and EVs individually [27,28,29,30], few studies have explored the combined impact of these technologies on grid stability. Most load-flow analyses have focused on static models that do not account for the variability in energy production and consumption that occurs throughout the day. Additionally, the literature on dynamic load-flow analysis, particularly over a 24-h periods, remains limited. Most studies analyze renewable energy, Bitcoin mining, and EV loads separately. However, the combined impact of these elements on dynamic load flow remains unexplored. This research seeks to address these gaps by thoroughly examining how renewable energy, Bitcoin mining, and EVs interact within the power grid. In particular, it will focus on understanding how these technologies affect grid stability, especially during periods of high and low demand, and how they influence each other’s energy consumption and distribution.
This research aims to address the following objectives:
Investigating the daily fluctuations in load flow: This study will analyze the daily fluctuations in load flow caused by Bitcoin mining and EV charging, focusing on how these activities change throughout the day and their impacts on grid stability.
Evaluating scenarios for the integration of renewable energy: The study will assess the impact of various scenarios for the integration of renewable energy on power factor and voltage stability within the power system.
Conducting 24-h load-flow analysis: Using the IEEE 14-Bus test system, this study will conduct a comprehensive 24-h load-flow analysis to evaluate the combined impacts of renewable energy, Bitcoin mining, and EV integration on grid stability.
By addressing these research gaps, this study provides critical insights into the dynamic interactions among renewable energy, Bitcoin mining, and electric vehicles, offering a comprehensive load-flow analysis that examines their joint effects on grid stability. The findings contribute to the development of adaptive grid-management strategies, infrastructure enhancements, and policies that foster a more sustainable, resilient, and efficient energy ecosystem.
The remainder of this paper is organized as follows. The next section presents the numerical methods employed for solving the load-flow equations, focusing on the Newton−Raphson method. Following that, dynamic load-flow analysis is presented, considering various scenarios for renewable energy integration and fluctuating power demand from EVs and Bitcoin mining. Finally, the results are analyzed and conclusions are drawn regarding their implications for grid stability and future energy-management practices.

2. Materials and Methods

2.1. Numerical Analysis Method

Nonlinear equations were used to solve problems encountered in the analysis of power systems. Numerical methods were used to solve these equations. The main purpose of load-flow analysis is to determine the complex voltage on the buses and the complex power flow on the lines for production and consumption values in a given power system.
The load-flow solution helped to identify the voltage magnitude, phase angle, and the active and reactive power flow through each transmission line in every bus. During solving of the load-flow problem, it was presumed that the system operated under normal, well-balanced conditions and could be represented by a single-line diagram. The essential variables at each bus were voltage magnitude (|V|), voltage phase angle (δ), active power (P), and reactive power (Q). Certain buses were supplied by generators and were known as “production buses”; for these buses, the voltage magnitude and active power were considered constant. Other buses that were not linked to the generator were termed “load buses”. It was assumed that the complex load power was known for all the buses. In summary, buses in a power system were classified into three groups:
i.
The oscillation bus, also referred to as the reference bus, was where the voltage magnitude (|V|) and phase angle = v(δ) were known and the active (P) and reactive FDV power (Q) were determined. This bus was used to assess the difference between the generated power and the planned load caused by losses in the power system.
ii.
Load buses, also known as P−Q buses, were where the active (P) and reactive power (Q) were known and the voltage magnitude (|V|) and phase angle (δ) of the bus were determined. As power was consumed in these buses, the values of the active and reactive power became negative.
iii.
Generation buses, also known as P−V buses or voltage-controlled buses, were where the active power (P) and voltage magnitude (|V|) were known and the voltage phase angle (δ) and reactive power (Q) were determined.

Newton−Raphson Method

Unlike iterative methods (e.g., Gauss and Gauss−Seidel), Newton methods demonstrate quadratic convergence when they are used to solve load-flow equations [31,32]. Particularly in the context of large-scale power systems, the Newton−Raphson method is notably more efficient and practical [33]. One of its primary advantages is that the number of steps required to reach a solution remains independent of system size. However, the computational workload per step is high during solution processing.
In addition to the Newton−Raphson method, other iterative approaches, such as the Gauss−Seidel and fast-decoupled methods, are commonly used for solving load-flow problems. Each method has distinct characteristics in terms of convergence speed, computational burden, and suitability for different system sizes. Table 1 presents a comparison of these methods, highlighting their advantages and disadvantages.
Gauss−Seidel Method: This method solves the power-flow equations sequentially for each bus using an iterative approach. It is simple and requires minimal computational resources. However, it has a slow convergence rate, particularly in large-scale systems, and may fail to converge if the system is ill-conditioned.
Fast-Decoupled Method: This method is a simplification of Newton−Raphson that assumes weak coupling between active and reactive power equations. It significantly reduces computational requirements and improves efficiency, especially in large systems. However, its accuracy decreases in cases where voltage magnitudes deviate significantly.
Power-flow analysis is fundamental in assessing grid stability under dynamic conditions. In this study, the Newton−Raphson (NR) method was chosen due to its higher accuracy and faster convergence for nonlinear power systems. However, alternative iterative methods, such as Gauss−Seidel (GS) and fast-decoupled load flow (FDLF), also offer certain advantages [33].
The Newton−Raphson method was selected because of the following advantages:
  • It offers faster convergence in dynamic systems.
  • It handles nonlinearities in RES and Bitcoin-mining loads more effectively.
  • It provides higher accuracy compared to Gauss−Seidel and FDLF under varying load conditions.
To assess the accuracy of the numerical analysis, the following evaluation metrics were considered:
  • Maximum voltage error: The deviation between calculated and actual voltages, which remained below 1% across all scenarios.
  • Power factor-estimation accuracy: The estimated power factor varied within ±0.02 of the actual values under different load conditions.
  • Comparison of computational time: The Newton−Raphson method achieved convergence within 4–6 iterations, while Gauss−Seidel required 20+ iterations for similar accuracy.
These results confirm the robustness of the numerical approach in dynamic load-flow simulations.
In load-flow analysis using the Newton−Raphson method, when dealing with voltage-controlled buses, the load-flow equations are represented in a polar form, with the active power and voltage magnitude being already known. Considering a bus and the lines connected to it, expression (1) from Kirchhoff’s current law is polar, as follows:
I i = J = 1 n Y i j   V j   = J = 1 n | Y i j | | V j   | Ɵ i j + δ j
The complex power in bus i is expressed in Equation (2), as follows:
P i j Q i = A = V i   I i
Using Equations (1)–(3), the following result was derived:
P i j Q i = ( | V i | δ i ) J = 1 n | Y i j | | V j   | Ɵ i j + δ j
Here, Yij represents the admittance value between buses i and j. The admittance values between buses are defined in the bus admittance matrix (YBUS), which was established for the power system load-flow analysis. The complex power expression in Equation (3) can be separated into its real and imaginary components, as shown in Equations (4) and (5), below:
P i = J = 1 n | Y i j | | V i   | V j   cos ( Ɵ i j δ İ + δ j )
Q i = J = 1 n | Y i j | | V i   | V j   sin ( Ɵ i j δ İ + δ j )
Equations (4) and (5) are the components of the nonlinear equation system that needs to be resolved, encompassing independent variables, namely, the voltage magnitude and voltage phase angle. Equations Pi and Qi are applied to each load bus, whereas equation Pi is utilized for each generator bus. These equations are then converted into a linear equation system given by Equation (6) through an expansion around the initial value, with higher-order terms being neglected.
P 2 ( k ) P n ( k ) Q 2 ( k ) Q n ( k ) = P 2 ( k ) δ 2 ( k ) P n ( k ) δ 2 ( k ) P 2 ( k ) δ n ( k ) P n ( k ) δ n ( k ) P 2 ( k ) | V 2 | P n ( k ) | V 2 | P 2 ( k ) | V n | P n ( k ) | V n | Q 2 ( k ) δ 2 ( k ) Q 2 ( k ) δ n ( k ) Q 2 ( k ) | V 2 | Q 2 ( k ) | V n | Q n ( k ) δ 2 ( k ) Q 2 ( k ) δ n ( k ) Q n ( k ) | V 2 | Q n ( k ) | V n | δ 2 ( k ) δ n ( k ) | V 2 ( k ) | | V n ( k ) |
In Equation (7) below, J is referred to as the Jacobian matrix. The Jacobian matrix determines the relationship between the rate of change in the voltage phase angle and voltage magnitude and the rate of change in the active and reactive power. The Jacobian matrix consists of partial derivatives with respect to the angle and magnitude changes of the active and reactive power equations above.
J = J 1 J 2 J 3 J 4 = P δ P V Q δ Q V
Δ P Δ Q = J 1 J 2 J 3 J 4 Δ δ Δ | V |
The system of linear equations expressed in Equation (8) is calculated iteratively using the following solution steps:
δ m + 1 = δ m + Δ δ
| V | m + 1 = | V | m + Δ | V |
Calculations are continued within one iteration step until the changes in voltage and phase angle (ΔV and Δδ) are smaller than a predefined error threshold.

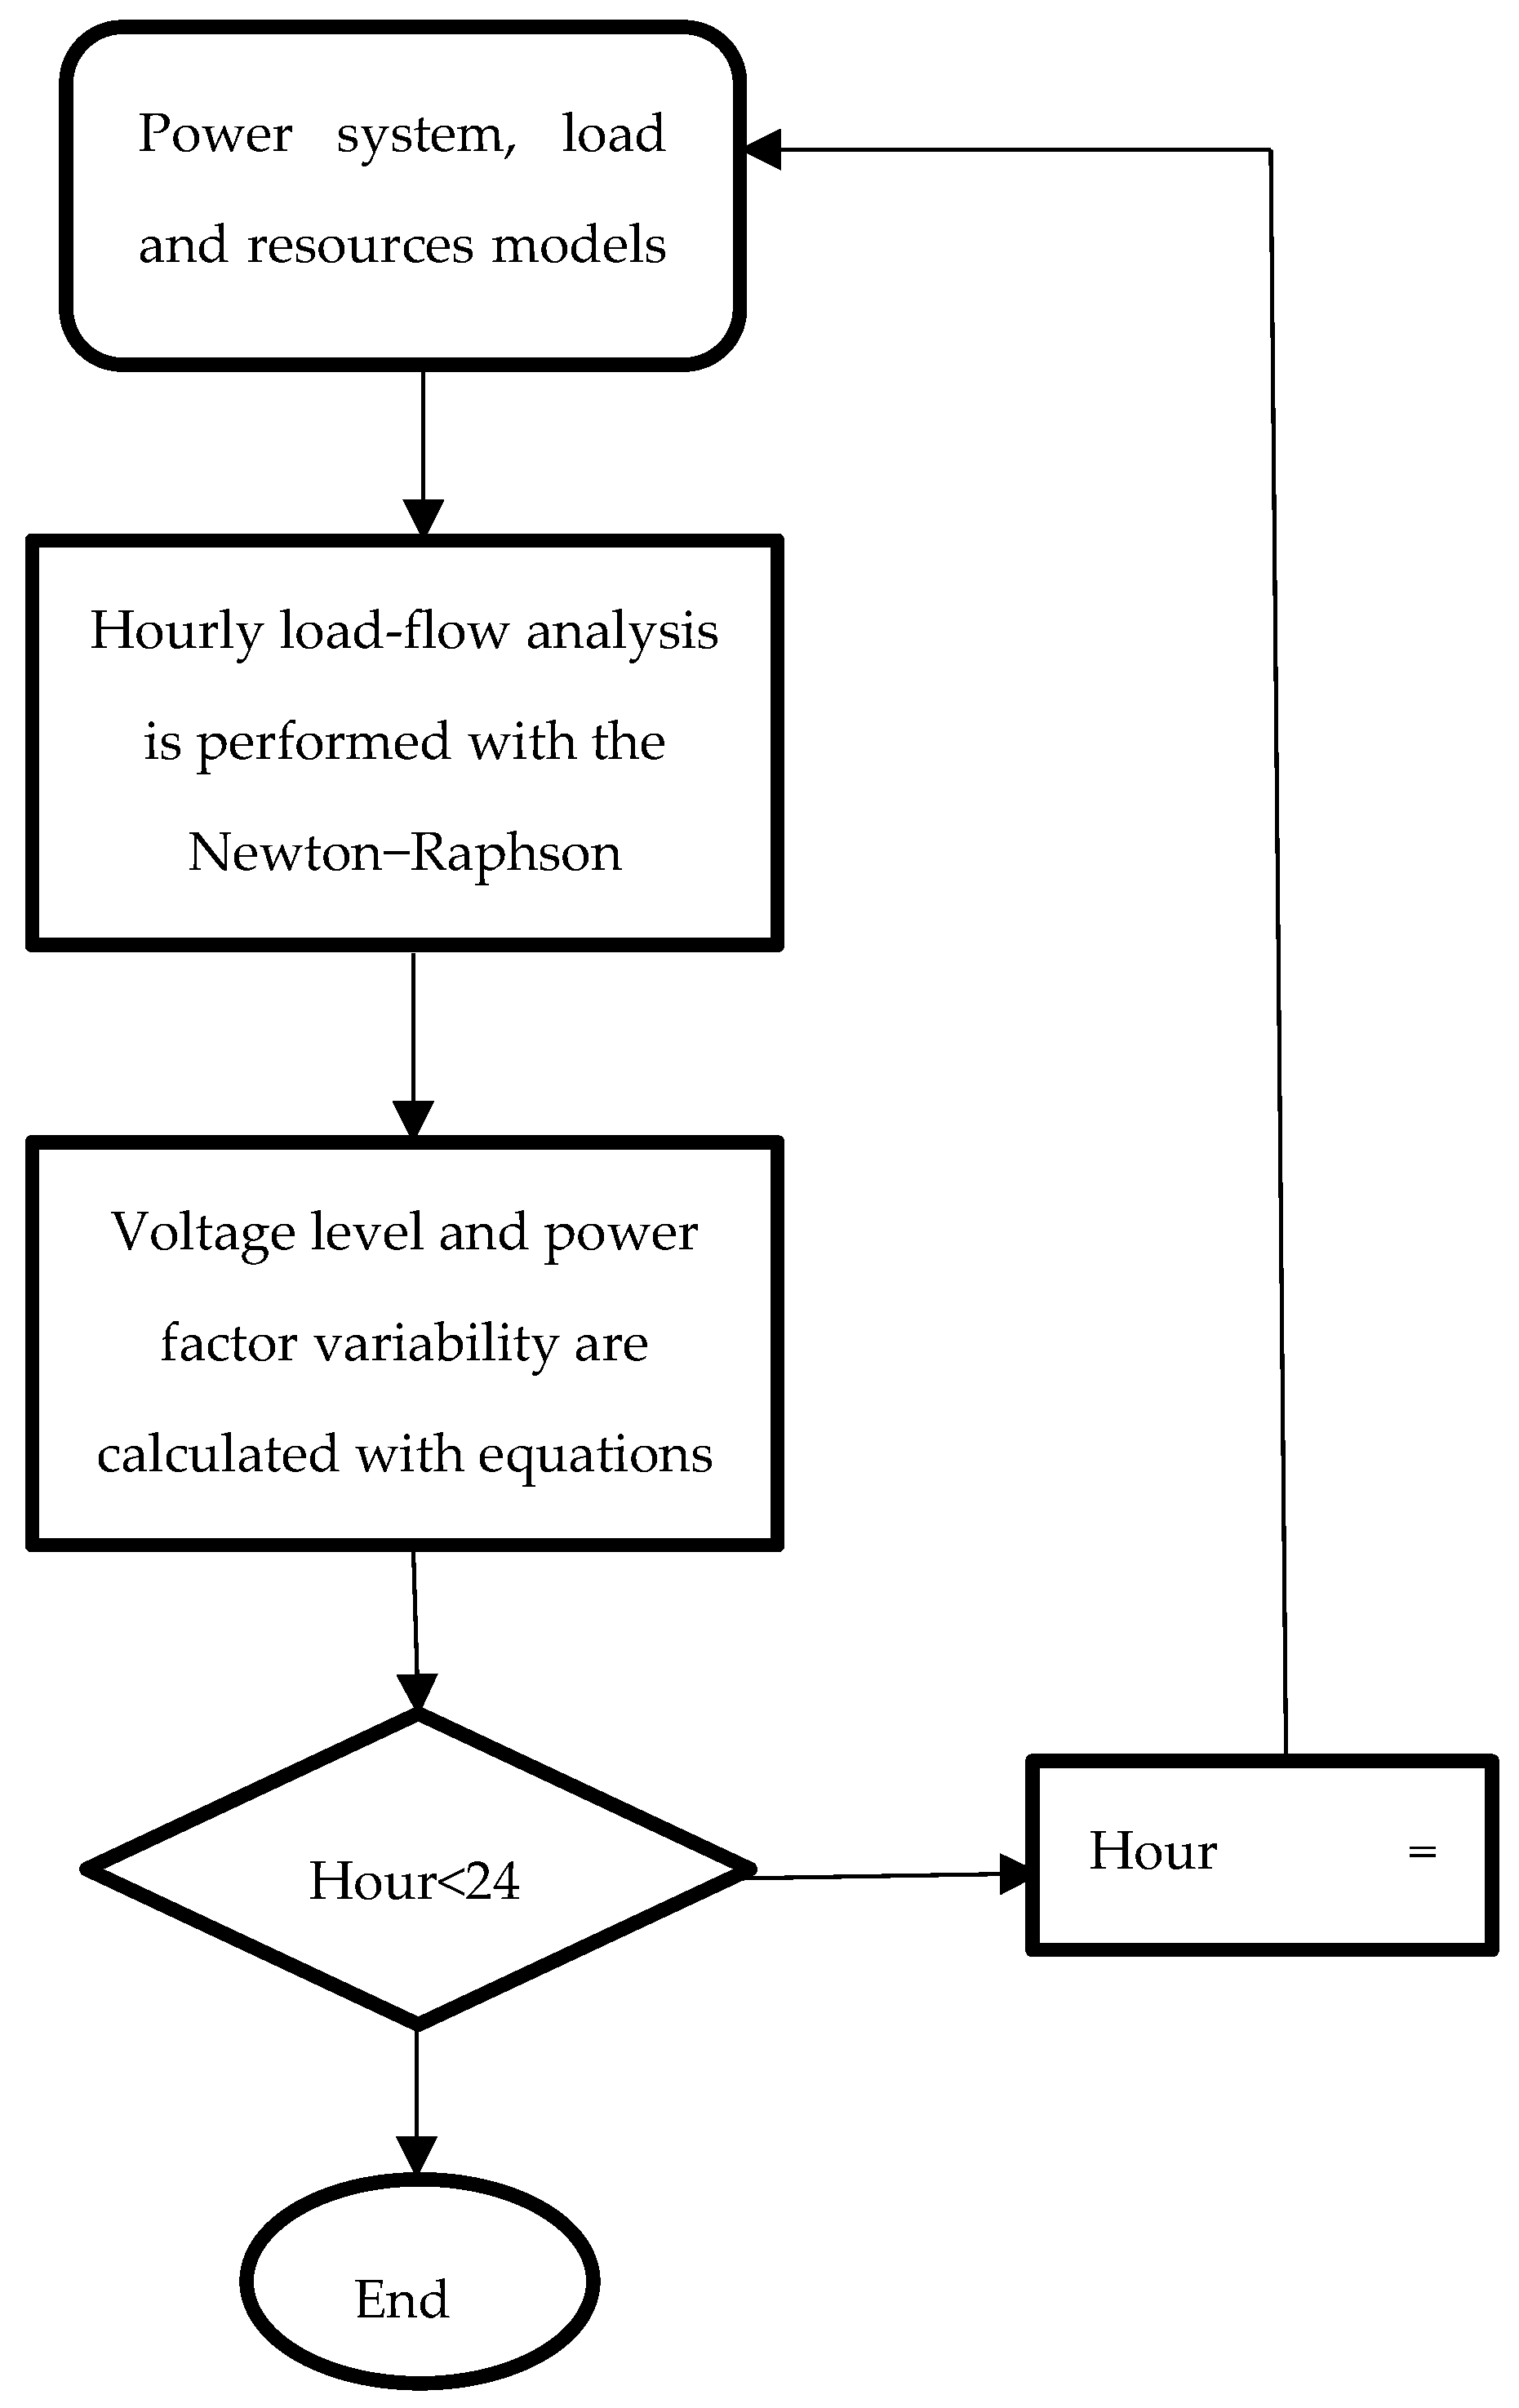
2.2. 24-h Dynamic Load-Flow Analysis Based on the Newton−Raphson Method

The Newton−Raphson load-flow analysis method briefly summarized in the previous section was employed to conduct 24-h dynamic load-flow analyses. The calculation steps for the 24-h load-flow analysis are illustrated in Figure 1.
For this purpose, distributed resources were modeled as two different types of resource: continuous and intermittent. Continuous resources were assumed to have active and reactive power values that remained approximately constant at an average value over the course of 24 h. For instance, hydroelectric and thermal power plants have constant output power. Intermittent resources, on the other hand, were represented by 24-component GP and GQ vectors, which represent the active and reactive power-generation profiles for different resource types (e.g., wind and solar) over 24 h. It was assumed that the active and reactive power values of these resources varied throughout the 24-h period.
Similarly, load profiles at buses were modeled as two different types of load to match their power-demand characteristics: low-variability power demand and variable power demand. Low-variability loads, such as Bitcoin-mining farms and industrial areas with night shifts, were used for load models that exhibited minimal fluctuations over 24 h. Variable power-demand profiles, on the other hand, were employed for load models that experienced significant fluctuations over a 24-h period, such as residential consumers and electric vehicles. Variable loads were defined using 24-component PL and QL vectors. Daily hourly load-flow analyses were conducted by retrieving the relevant source and load values for each hour of the day (from 1 to 24) from pre-defined GP, GQ, PL, and QL vectors, and the Newton−Raphson method was applied.
Following the dynamic load-flow analyses for the assessment of voltage and power factor variations at each load bus, the voltage values (Vd) and power factor (cos θd) for each load bus were obtained on an hourly basis. The voltage and power factor variations occurring throughout the day at the load buses were used to calculate the statistical coefficient variation, as shown in Equation (11) below:
V σ = σ ( V d ) / μ ( V d )
In this context, σ(.) and µ(.) represent the daily standard deviation and daily mean of the bar’s voltage. The variability factor V σ provides statistical data comparable to the daily voltage fluctuations in the bars. Similarly, the variability in the power factor of the bars is expressed in Equation (12) below:
c o s θ σ = σ ( c o s θ d ) / μ ( c o s θ d )
By calculating these formulas, we can analyze the changes in power factor and voltage values at each bus over a 24-h period. This is important for examining the impact of changes in the load structure within the grid system, as well as variations in the power generation within a grid system that includes renewable energy sources.

3. Results and Discussion

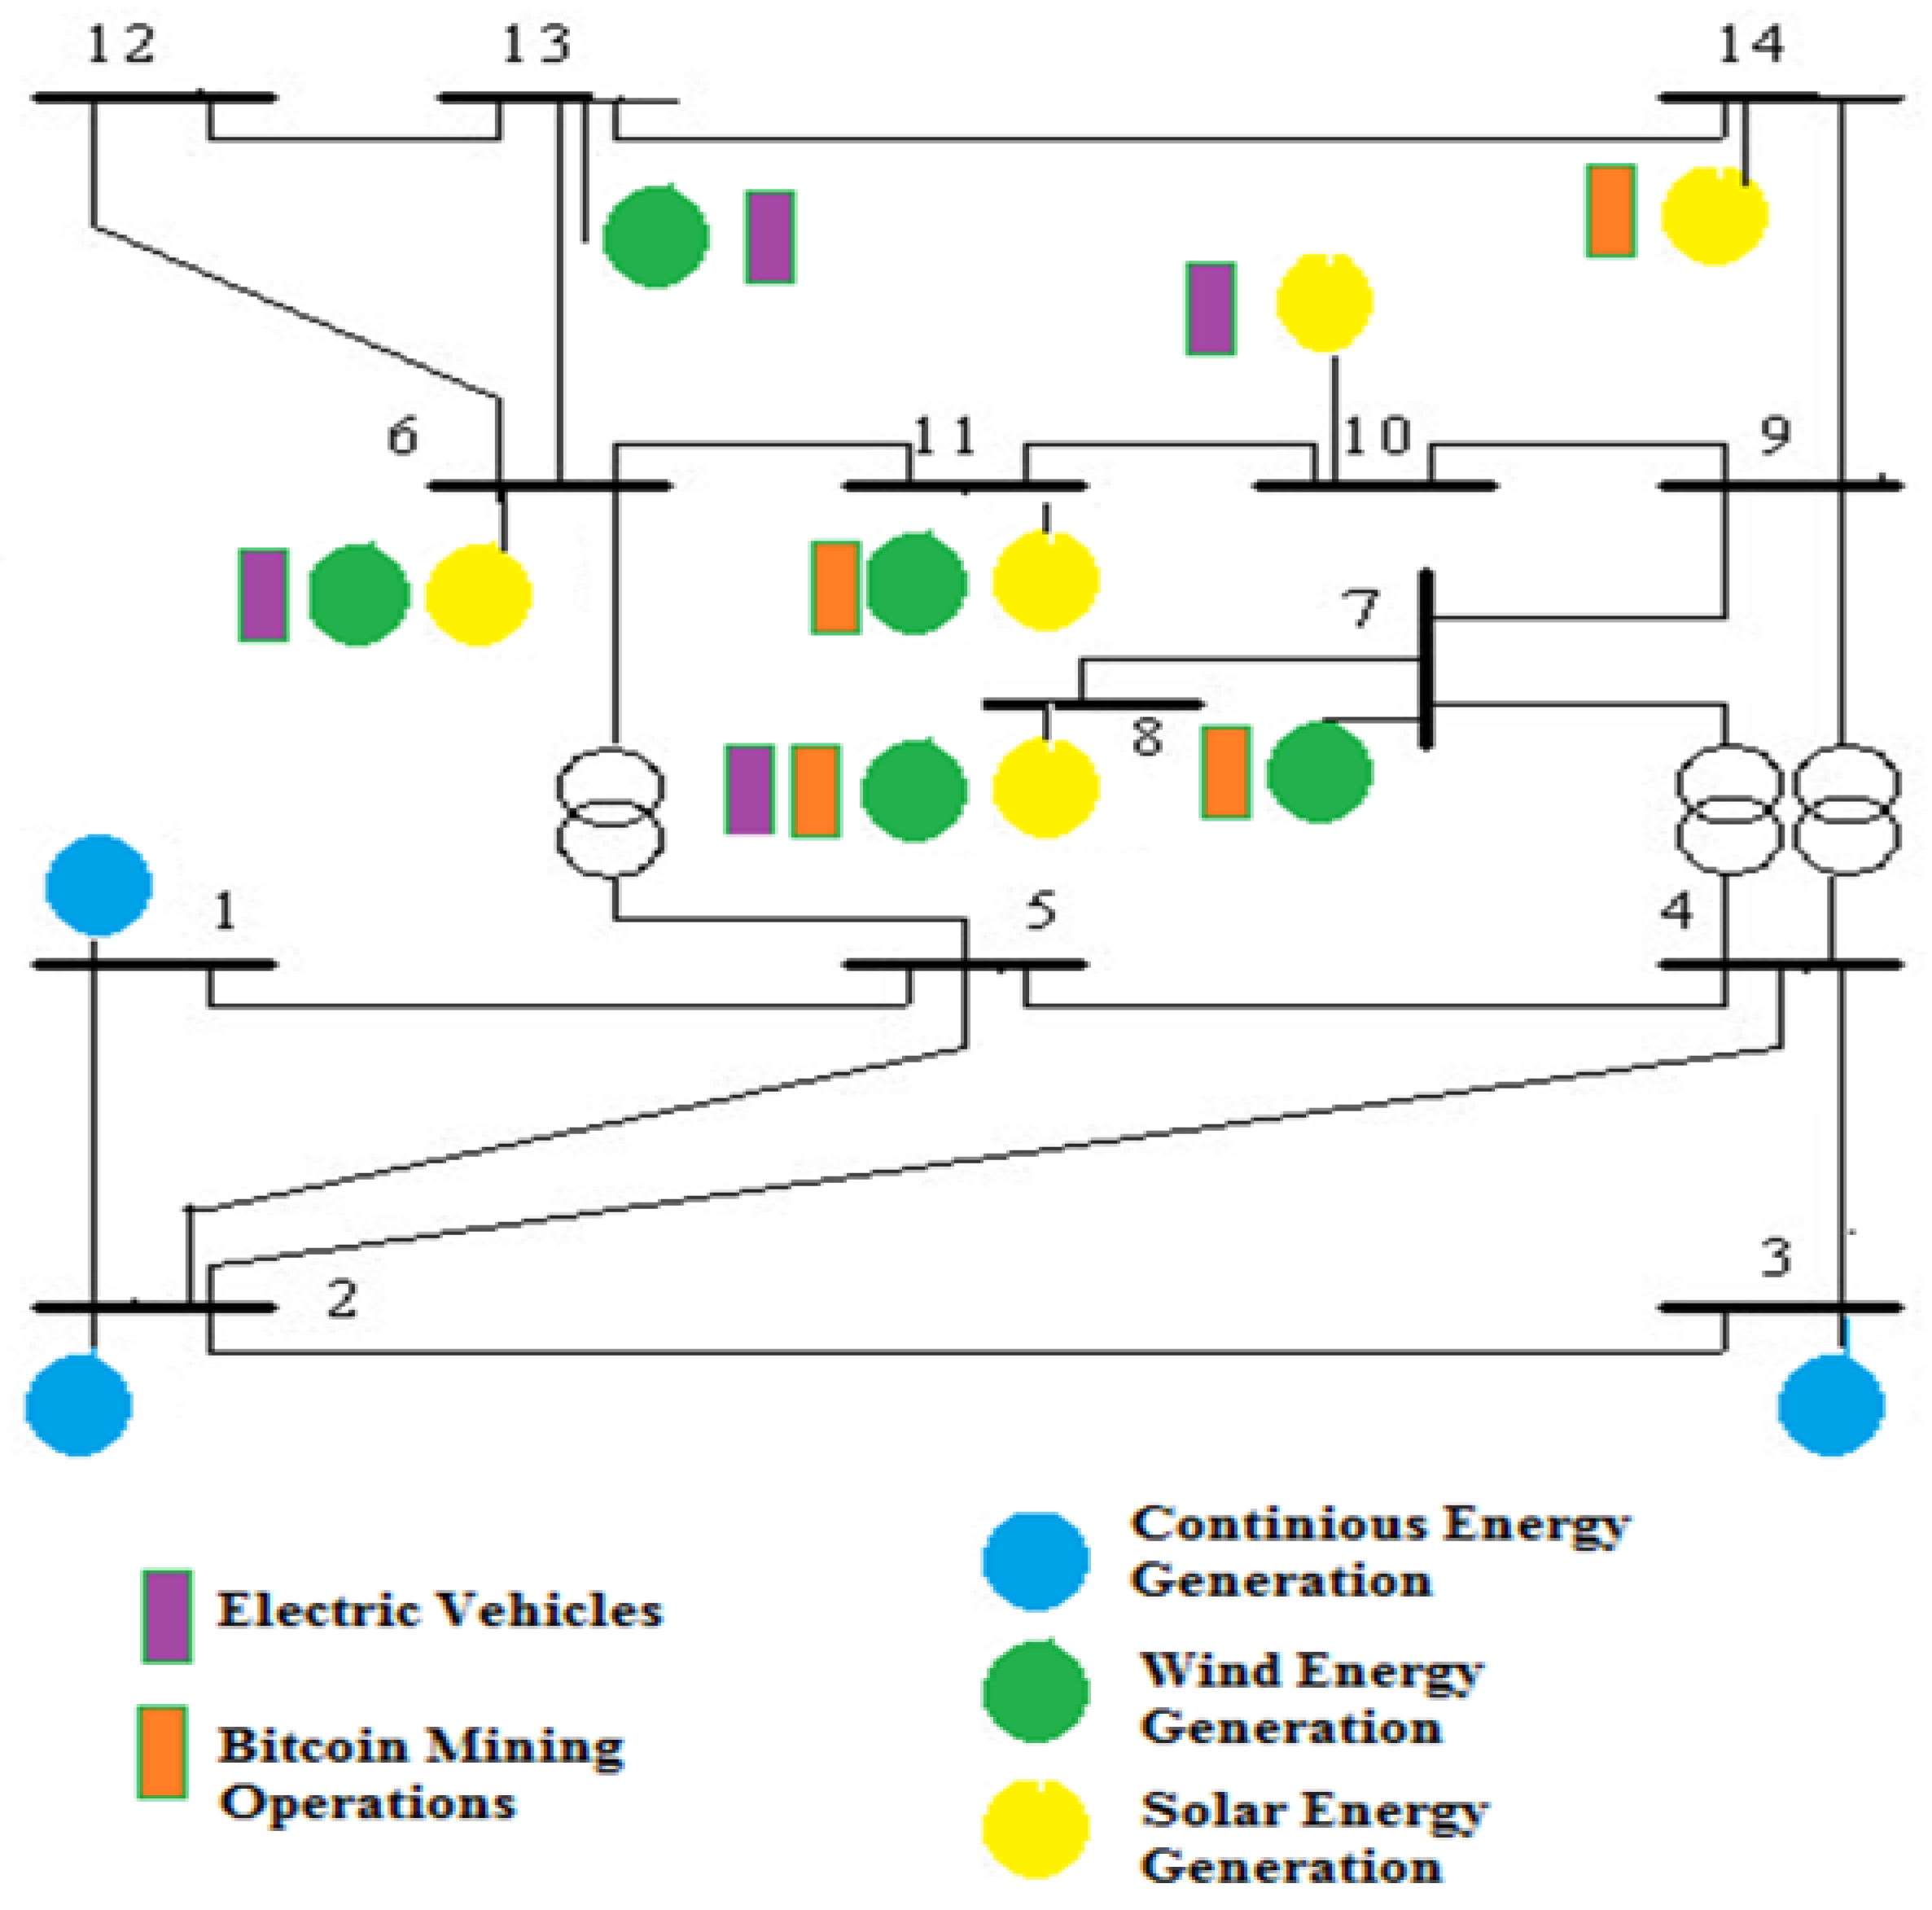
3.1. Analyses of 24-h Dynamic Load Flow on the IEEE 14-Bus Test System

Hourly load-flow analysis tests were conducted on the widely used IEEE 14-bus system, a test system for energy-market problems, in an example application [34]. The IEEE 14-bus test system is a widely recognized and standardized benchmark system in the field of power systems. The 14-bus system strikes a good balance between simplicity and complexity. It is complex enough to capture important aspects of a real power system but simple enough to facilitate analysis and understanding. Load structures and power systems are attached to the IEEE 14-Bus test system as shown in Figure 2.
Different test scenarios were constructed by adding electric cars, Bitcoin-mining facilities, and renewable distributed resources to this test system. To this end, two types of dynamic load profiles were defined. The first, representing load-demand profiles with relatively low variability in power consumption, such as Bitcoin-mining operations, was represented by vectors PL1 and QL1, as shown in Figure 3a. The other load model, which exhibits high variability in power consumption, such as that caused by charging of electric cars, is represented by vectors PL2 and QL2, as shown in Figure 3b. Bitcoin-mining loads are typically considered constant in terms of active and reactive power consumption. However, factors such as cooling systems, UPS backup, and fluctuations in mining difficulty can introduce variations in power demand. In this study, we adopted a model wherein Bitcoin-mining operations maintain constant active and reactive power consumption, as supported by previous research. This assumption allows for a more precise evaluation of their impact on the power grid [28]. Similarly, EV-charging profiles were derived from the existing literature, taking into account typical charging patterns. Studies indicate that overall EV charging demand is highest between 17:00 and 22:00, reflecting the period when most vehicles are plugged in after daily use [35].
In the load-analysis test simulation, three source profiles supplying energy to the power system were defined. The production-profile vectors GP1, GQ1 were defined for continuous energy sources (hydro, thermal, nuclear, etc.). The production-profile vectors GP2, GQ2 were defined for intermittent and highly uncertain renewable sources of wind energy, and the solar energy-production profile was defined by vectors GP3 and GQ3. Figure 4 shows the production profiles used in the analysis of the three types of energy production. These profiles are designed hypothetically to align with the power-consumption profiles of these power sources.
In the load-analysis test simulation, three different energy-source profiles supplying power to the system were defined to assess their impact on grid stability and load balancing. These sources include continuous-generation sources, intermittent renewable energy sources, and solar power generation, each modeled with distinct production profiles.
The continuous-energy sources, such as hydro, thermal, and nuclear power plants, were represented by the GP1 and GQ1 vectors, assuming a stable and predictable power output throughout the simulation period. The intermittent renewable energy sources, particularly wind energy, were modeled using the GP2 and GQ2 vectors, considering fluctuations in generation due to varying wind speeds. The solar energy-generation profile was defined separately by the GP3 and GQ3 vectors, taking into account its daily production cycle, which peaks around midday and drops to zero at night.
Figure 4 illustrates the power-generation profiles for these three energy sources, showing how their variations align with system demand and influence power distribution. These profiles were hypothetically designed based on realistic energy-generation patterns to ensure a balanced integration with power-consumption profiles in the simulation. Since wind and solar power generation fluctuate significantly, their effects on voltage stability, power factor variations, and overall grid reliability were carefully analyzed under different operating conditions.

3.2. Model Validation and Limitations of Study

This study employs a MATLAB 2016b-based Newton−Raphson load-flow model to analyze the impact of variable generation of renewable energy and dynamic demand patterns over a 24-h period. The model evaluates voltage stability, power factor variations, and grid performance under fluctuating conditions.
The MATLAB-based load-flow simulation calculates the voltage (V), active power (P), reactive power (Q), and apparent power (S) at each bus over a 24-h period. Additionally, the model performs the following analyses:
  • Statistical evaluation of voltage stability and power factor variations,
  • Identification of buses exceeding nominal voltage and power factor limits,
  • Assessment of the impact of intermittent distributed generation and variable load demand on grid stability.
The key simulation parameters are defined as follows in Table 2:
This enhanced Newton−Raphson approach enables a detailed and dynamic evaluation of how variable energy sources and fluctuating demand profiles affect power-system voltage stability and power factor performance.
Although this study provides a comprehensive dynamic analysis, certain limitations should be noted:
  • Weather conditions: The impact of seasonal variations on renewable energy production was not fully considered, meaning solar and wind fluctuations were modeled based on general trends rather than location-specific data.
  • Control strategies: The study does not include advanced inverter-control mechanisms or demand-side management strategies, which could further optimize grid stability.
  • Real-world validation: The results are based on simulations rather than real-world grid measurements. Future research should incorporate experimental testing with real-time grid data to validate the simulation outcomes.

3.3. Simulation-Based Analysis and Discussion of Results

The effects of renewable distributed energy resources (DERs) on bus voltage stability and power factor regulation were analyzed on an hourly basis under two different test scenarios. These scenarios were designed to evaluate how centralized and distributed generation influence the performance of the power system, especially in the presence of high-power-consumption loads such as Bitcoin-mining operations and electric vehicles (EVs).
In the first test scenario, the power system operates under a centralized generation model, where no renewable distributed resources are integrated into the grid. This scenario, called the Current State (CS), represents a conventional power system in which loads are dispersed across the network without local renewable generation support. Figure 2 illustrates this configuration. To analyze the impact of Bitcoin-mining operations and EV charging loads, two different load-demand scenarios were introduced. In the LDx3 scenario, the total power demand is increased three times, while in the LDx7 scenario, the demand is increased seven times. These conditions help evaluate how large-scale energy consumption affects voltage levels and power factor stability in the absence of local renewable generation.
The second test scenario examines the system behavior when renewable distributed resources are integrated into the grid. This scenario is referred to as the Distributed Generation (DG) case. The impact of renewable energy is analyzed by comparing two additional cases. In the DGx5 scenario, the penetration level of distributed renewable resources is increased five times, while in the DGx8 scenario, it is increased eight times. These cases allow for a detailed assessment of how renewable generation affects voltage stability and power factor variations.
A comparison of the CS and DG test cases provides insights into the influence of the integration of renewable energy on power-system performance. Figure 5 presents the 24-h load-flow analysis results for the CS scenario, showing how the power system operates under centralized-generation conditions.
In Figure 5b, the voltage variability remains at zero for buses 1 to 3, as these buses are exclusively dedicated to power generation. Since no load is connected to these buses, their voltage levels remain stable throughout the day. However, for buses with higher numbers, which include both load buses and transition buses, voltage fluctuations are more pronounced due to dynamic variations in power demand and network interactions. Among them, Bus 13 exhibits the highest daily voltage variability, with this value reaching approximately 0.8%. This is because Bus 13 hosts both wind-energy generation and residential loads, making it the most dynamic bus in terms of changes in power flow. The combination of fluctuating renewable generation and highly variable household consumption leads to more significant voltage variations compared to other buses.
Figure 5c presents the daily variations in the busbar power factor. The maximum observed power factor variability is 12%, which suggests significant reactive power fluctuations at certain buses. Notably, power factor values were not computed for transition buses, as they do not have direct load or generation connections. This is clearly reflected in Figure 5c, where certain buses, such as buses 4, 5, 9, and 12, exhibit no power factor variations. The observed variations in power factor across different buses highlight the influence of load dynamics and reactive power-compensation mechanisms within the network.
In Table 3, a comparison is shown between the current situation (CS), where the load value connected to the network is at a minimum level (LD), and the LDx3 and LDx7 scenarios, which represent test conditions in which the load demand increases to three times and seven times the current value, respectively.
As seen in Table 3, increase in load demand significantly affects the daily variability of bus voltage levels (Vσ). The highest intra-day voltage changes in all buses were observed in the LDx7 scenario. Voltage deviations varied across buses and scenarios. Buses 4, 5, 6, 8, 9, 11, and 12 seem to have had some voltage deviation in certain load scenarios. In addition, the highest Vσ value, 51%, was measured at bus number 7. Power factors also exhibited variations. Buses 1, 2, and 3 experienced significant power factor changes in LDx7, indicating a considerable impact on the balance between real and reactive power. The cosθσ value in the production buses varied between 30% and 98% in the LDx7 scenario. On the other hand, an increase of around 1–3% in the daily average variability (cosθσ) in load buses is noteworthy. Based on the results given in Table 3, increasing the load on the system by three and seven times has no effect on the daily change in power factor in the load buses.
As shown in Table 4, the integration of distributed renewable power-generation systems with the grid was investigated in three different scenarios (DG, DGx5, and DGx8). Here, the DGx5 and DGx8 scenarios represent test conditions where the energy levels of the renewable distributed sources reach five times and eight times the level in DG, respectively. Accordingly, DG represents low-power renewable energy-production conditions; DGx5 represents moderate-level renewable energy-production conditions, and DGx8 represents high-level renewable energy-production conditions, with the renewable energy capable of meeting almost all local demand. In all three scenarios, the power loads added to the grid, as shown in Figure 2, were at a minimum level (LD).
According to an analysis of the data in Table 4, most buses (1–14) do not experience significant voltage deviation in the DGx5 and DGx8 scenarios. Power factor variations are observed across buses and scenarios. Bus 6 stands out as having a relatively high power factor under the DG scenario; this value increases significantly under DGx5 and decreases under DGx8. This suggests a notable impact on the balance between real and reactive power at this bus. Bus 11 experiences a substantial increase in power factor under DGx5 and a further increase under DGx8, indicating an improvement in power-consumption efficiency. Bus 13 shows a decrease in power factor under DGx8, suggesting a change in the balance of real and reactive power consumption. As shown in Table 3 and Table 4, power factor values were not computed for transition buses, as they do not have direct load or generation connections.
The intricate dynamics of contemporary power systems, which are shaped by the integration of renewable energy sources, Bitcoin-mining operations, and electric vehicles (EVs), necessitate a meticulous analysis to comprehend their influence on different nodes within the network. Among these, Bus 7, which is predominantly affected by the Bitcoin-mining operation’s energy consumption (PL1, QL1), becomes a critical focal point for evaluation. In particular, scenarios DGx5 and DGx8, wherein distributed wind-energy generation is significantly increased at Bus 7, demonstrate a notable impact on the system’s power profile. Specifically, the integration of wind power at fivefold and eightfold levels leads to substantial fluctuations in the active and reactive power distribution, reshaping the voltage stability at this node. The increased availability of wind energy at Bus 7 creates a more dynamic energy profile, creating potential challenges in maintaining power quality and system balance.
Simultaneously, a more complex interaction emerges at Bus 8, which accommodates both Bitcoin-mining operations and EV charging loads (PL2, QL2). Unlike Bus 7, Bus 8 hosts a multi-source energy structure, where both wind generation (GP3, GQ3) and generation of solar energy (GP2, GQ2) contribute to the local power supply. This diversified energy portfolio enhances grid sustainability but also introduces additional challenges in voltage regulation and power factor stability. A crucial finding from the analysis is that high levels of renewable energy production trigger significant voltage variations, with fluctuations reaching nearly 10%; the size of these variations is a critical metric for assessing grid reliability. As the production of wind and solar energy surges, the corresponding increase in reactive power generation results in a decline in the power factor, as illustrated in Figure 6a,b, Figure 7a,b and Figure 8a,b. This effect becomes particularly pronounced during periods of peak production of renewable energy, such as 4:00–7:00 AM for wind power under the DUx5 and DUx8 scenarios.
A deeper analysis of Bus 7 and Bus 8 during these peak hours reveals sharp declines in the power factor, further emphasizing the impact of high penetration of renewable energy. Notably, in the DUx8 scenario, the exceptionally high production of wind energy enables self-sustaining operation at these nodes, leading to what can be classified as “Islanded Operation”. This state signifies that the local demand at Bus 7 and Bus 8 can be met entirely by the renewable energy produced at these nodes, eliminating the need for power imports from central generation buses. In some instances, these buses even transition into power exporters, as indicated by the positive power flow values observed in the DUx8 scenario. These findings suggest the potential for achieving localized energy autonomy under certain grid conditions. Examining Bus 10, which hosts a generation of solar energy unit alongside a consumption model with EV charging, reveals a distinct trend. During hours of high solar-power production, from 9:00 AM to 4:00 PM, significant variations in the power factor are observed. This effect is most pronounced at 1:00 PM and 2:00 PM, as depicted in Figure 8b, where a steep decline in the power factor highlights the challenges associated with excessive penetration of solar power. However, under conditions of low solar production (DG scenario), the impact on the power factor remains relatively minor. These findings underscore the need for proactive grid-management strategies, such as reactive power compensation and intelligent charging coordination, to mitigate the destabilizing effects of high solar penetration at Bus 10.
A key observation arises from the analysis of Bitcoin-mining loads in the CS scenario, wherein no production of renewable energy occurs. Under these conditions, the system exhibits high stability in both power factor and active/reactive power values, demonstrating the predictable nature of Bitcoin-mining loads. Unlike renewable-dependent nodes, which experience volatility due to production intermittency, Bitcoin-mining loads operate with a consistent daily pattern of energy consumption. This characteristic provides an anchor of stability within the grid, reducing the need for real-time power adjustments.
To provide a more detailed perspective on the dynamic nature of the power system, load-flow analysis was conducted at specific time intervals characterized by significant variations in renewable energy production and power consumption for Bitcoin mining in the DG scenario. A load-flow analysis was conducted at two critical times—13:00 (high generation of solar energy and high EV-charging load) and 02:00 (zero solar production, minimum EV consumption, and peak Bitcoin-mining demand)—to capture significant variations in renewable energy production and power consumption for Bitcoin mining, impacting voltage stability and power factor.
The simulation results are shown in Table 5 and Table 6.
The power factor values for Buses 4, 5, 9, and 12 were not calculated because there are no Bitcoin mining or EV charging loads connected to these buses. Since power factor is determined by the balance of active and reactive power, and these buses have no connected loads or generation, no active or reactive power consumption occurs. Therefore, power factor calculations are not applicable to these buses.
During this period, solar energy production significantly increases voltage levels, particularly at buses with high renewable energy penetration (e.g., Bus 10 and Bus 6). However, the presence of large amounts of reactive power causes a notable drop in the power factor, especially at Bus 3, which reaches a low of 0.59944. The high demand from EV charging further exacerbates these fluctuations, necessitating voltage regulation mechanisms such as reactive power compensation and dynamic inverter controls.
At 02:00, generation of solar energy is completely absent (P_solar = 0 MW) and EV consumption is at its lowest. However, Bitcoin-mining demand peaks, leading to increased power consumption and reactive power injection at multiple buses. The voltage levels remain stable across most buses, but Bus 3 experiences a significant power factor drop (0.78259), indicating potential voltage instability due to mining activity.
The analysis identifies several critical challenges concerning voltage stability, power factor variability, and grid resilience under varying operational conditions, particularly in systems integrating renewable energy, electric vehicles (EVs), and Bitcoin mining. At 13:00, during periods of high production of solar energy, the penetration of renewable energy significantly increases voltage levels, which could lead to overvoltage issues in certain buses. These fluctuations require the application of advanced voltage-regulation techniques and reactive power compensation to prevent potential damage to the grid infrastructure and maintain system stability. Conversely, at 02:00, when generation of solar energy is completely absent and EV-charging demand is minimal, the high power consumption of Bitcoin-mining operations contributes to localized voltage dips, putting the grid under stress and potentially compromising reliability. The dynamics of power demand and supply variations make it critical to carefully monitor and adjust grid operations to ensure stability during periods of low solar-energy generation.
Another significant concern identified is the variability of the power factor, particularly during periods of high renewable energy production. The lowest power factor values occur when generation of solar and wind power is at its peak, highlighting the challenge of balancing active and reactive power. This requires the implementation of sophisticated reactive power-management strategies such as the use of voltage-controlled devices or grid-forming inverters to ensure stable voltage levels and prevent the grid from becoming susceptible to instability. On the other hand, at 02:00, power factor values remained more stable, yet the absence of renewable energy production and the dominance of Bitcoin mining consumption would still necessitate continuous monitoring and precise management of reactive power demand to avoid long-term instability.
To enhance grid resilience, stability, and efficiency, a well-coordinated and flexible approach is necessary to balance the integration of renewable energy, EV-charging demand, and power consumption for Bitcoin mining. This approach should include adaptive demand-side management strategies, such as dynamic charging scheduling for both EVs and Bitcoin-mining operations. By aligning consumption with periods of high generation of renewable energy, grid strain during peak demand times can be reduced, helping to ensure the grid remains stable and efficient.
In addition, energy-storage systems, particularly systems with large-scale battery storage, play a crucial role in stabilizing the grid. These systems can absorb excess energy during periods of high production of renewable energy and release it during demand peaks, helping to mitigate voltage fluctuations and overvoltage issues. This buffering effect not only supports voltage stability but also balances supply and demand, ensuring continuous service even during periods of high demand or low generation of renewable energy.
Furthermore, implementing dynamic pricing models can help regulate power usage by offering incentives for off-peak consumption and penalizing consumption during high-demand periods. This will encourage users, including individuals with EVs and Bitcoin-mining operations, to adjust their consumption patterns, which will reduce overall grid load during critical times and contribute to smoother integration of renewables.
Together, these strategies will improve grid efficiency, mitigate instability, and promote a sustainable energy ecosystem. The development of policies encouraging smart grid solutions, energy-storage integration, and flexible consumption patterns is vital to ensuring the long-term resilience and reliability of power grids as energy demands evolve and the transition to renewable energy continues.

4. Conclusions

In this study, a dynamic load-flow analysis was performed throughout the day under conditions of intermittent distributed generation and fluctuating electricity demand. By evaluating the hourly variations in voltage levels and power factor at different buses, the impact of variable production of renewable energy on grid stability was analyzed.
One of the key findings of this study is that renewable distributed energy sources do not significantly affect voltage stability. This is because the overall energy balance in the system is maintained, meaning that the total power demand (including losses) is equal to the power supplied by generation sources. When renewable energy is integrated at a bus, it primarily reduces power flow from other generators rather than causing voltage instability. However, when a local renewable source meets a substantial portion of demand, it can alter the active and reactive power balance, leading to instantaneous fluctuations in power factor. To mitigate these fluctuations, reactive power production from renewable sources should be limited under high-production conditions to maintain power factor stability.
Additionally, the study reveals that as grid power demand increases, the rate of voltage variation also rises, particularly at load and transition buses. However, while higher grid power demand significantly increases intra-day power factor variations at generation buses, it does not affect the power factor variation rate at other buses. Notably, buses that host Bitcoin-mining operations exhibit the lowest intra-day power factor fluctuations due to their relatively stable patterns of power consumption. This suggests that Bitcoin-mining loads, despite their high energy demand, can serve as a stabilizing factor for grid operations by reducing reactive power fluctuations.
The results provide valuable insights into the impact of the integration of renewable energy on grid stability. Key findings are summarized below:
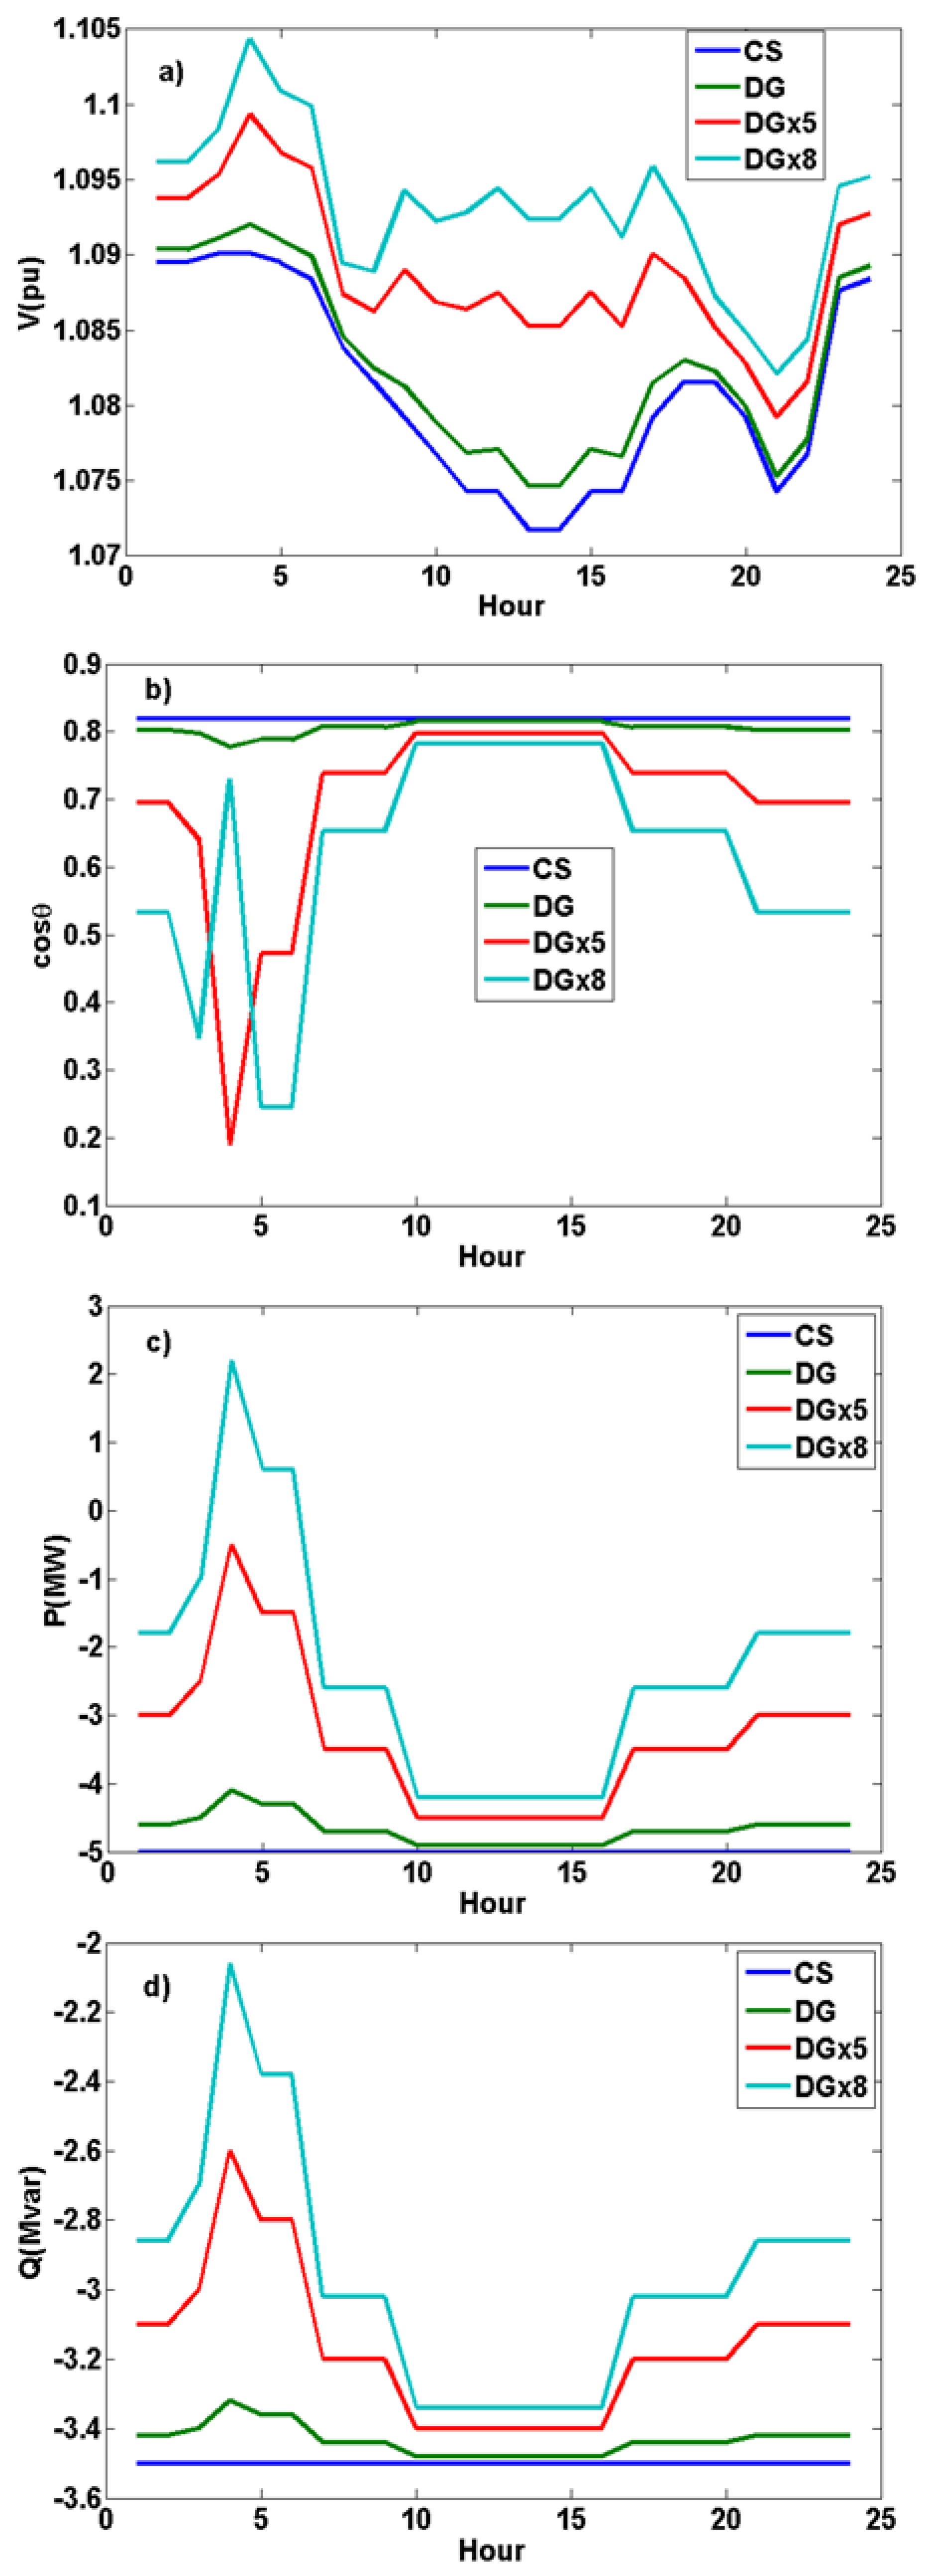
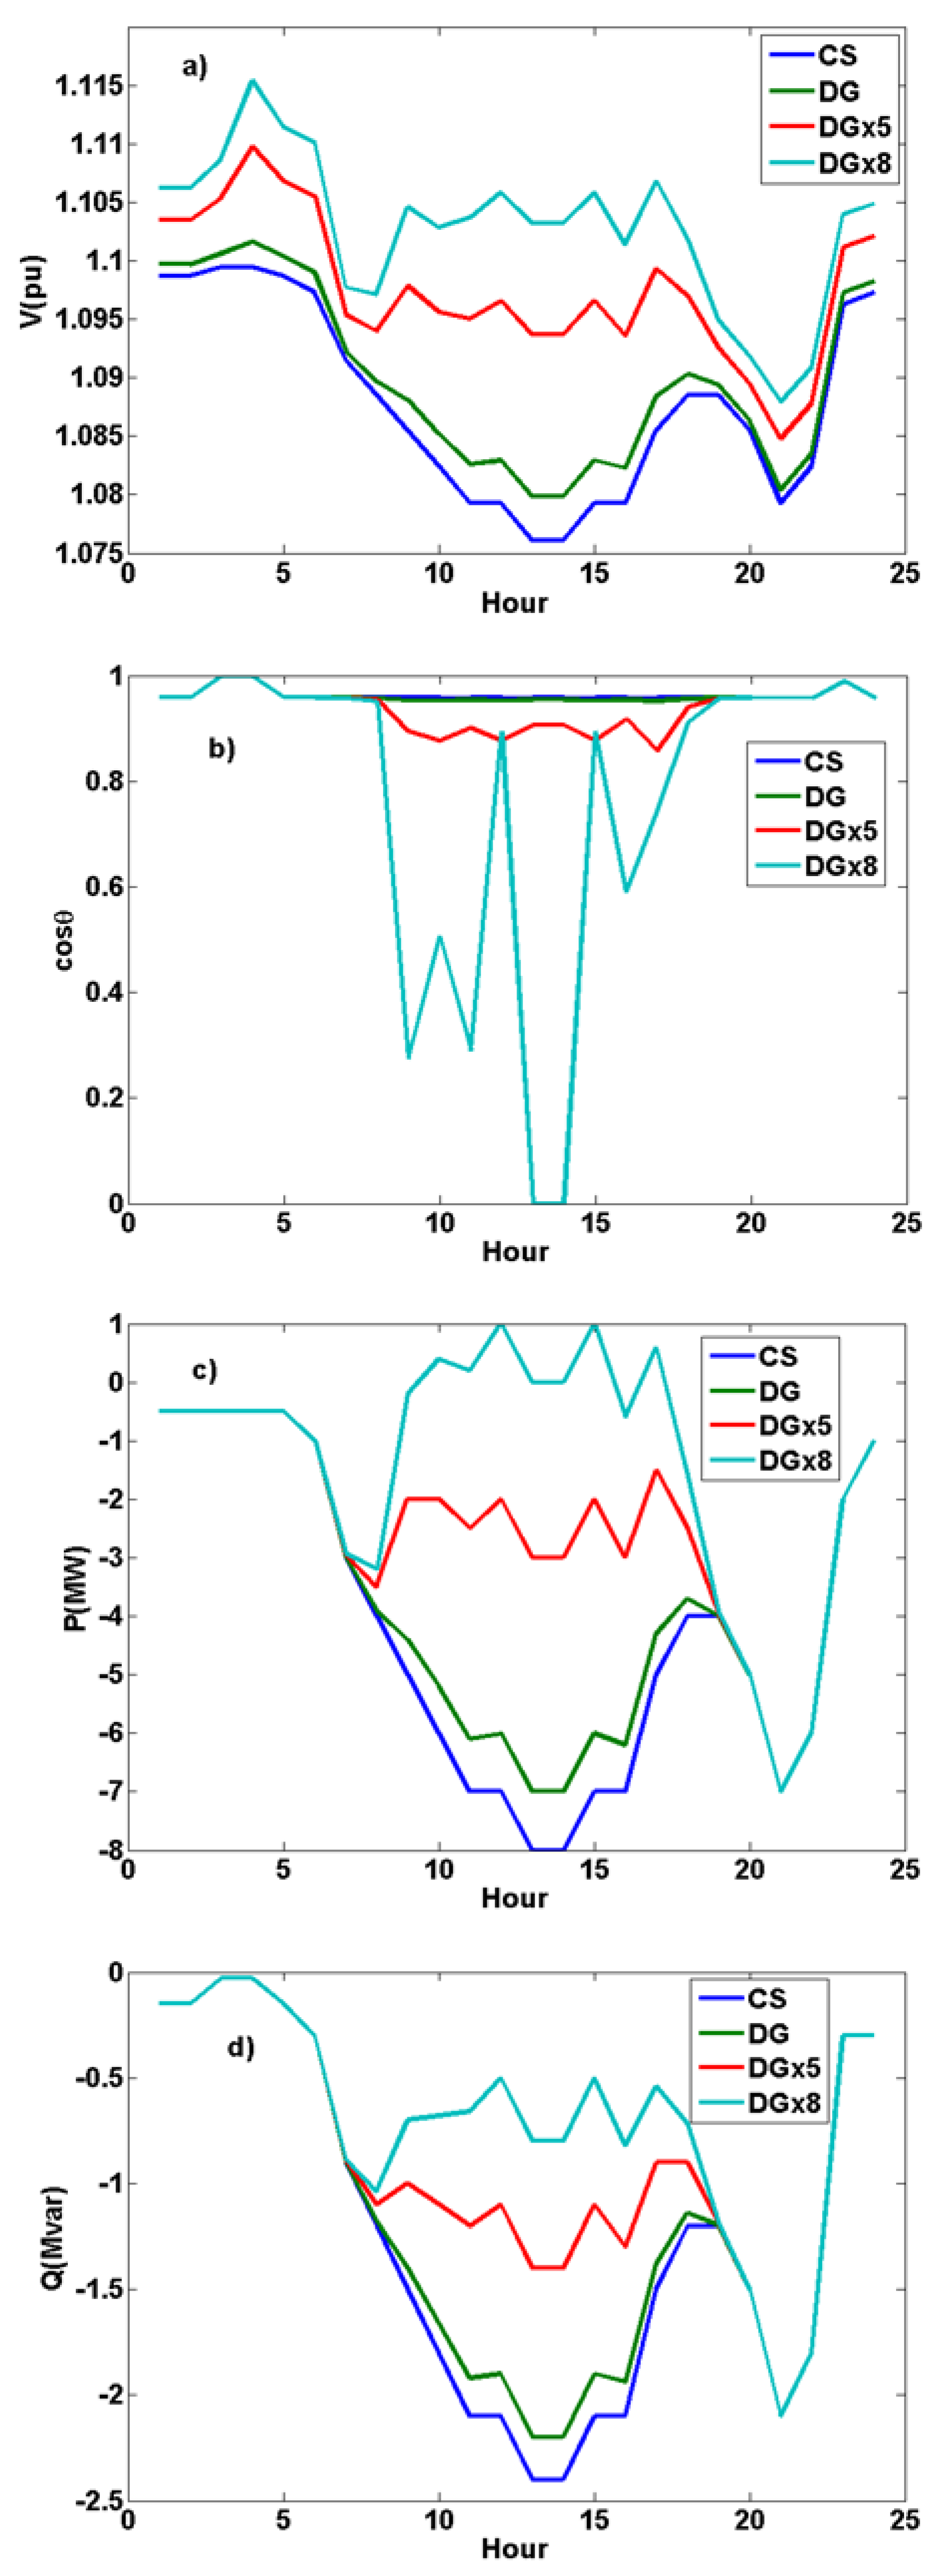
  • Voltage stability: The integration of renewable distributed energy sources does not significantly impact voltage stability, as the total energy balance in the system is maintained. However, buses with a high share of local renewable generation exhibit slight voltage fluctuations due to variations in active and reactive power balance.
  • Maximum daily voltage fluctuation: 0.8% at Bus 13.
  • Voltage levels remained stable (zero variability) at generation buses (Buses 1–3).
  • Power factor variability: The integration of renewable energy influences power factor stability, particularly in buses where local generation meets a substantial portion of demand.
  • Lowest power factor observed: 0.599 at Bus 3, due to the imbalance between active and reactive power.
  • Power factor remained stable in transition buses (Buses 4, 5, 9, and 12), as they were not subject to a direct load and did not directly generate power.
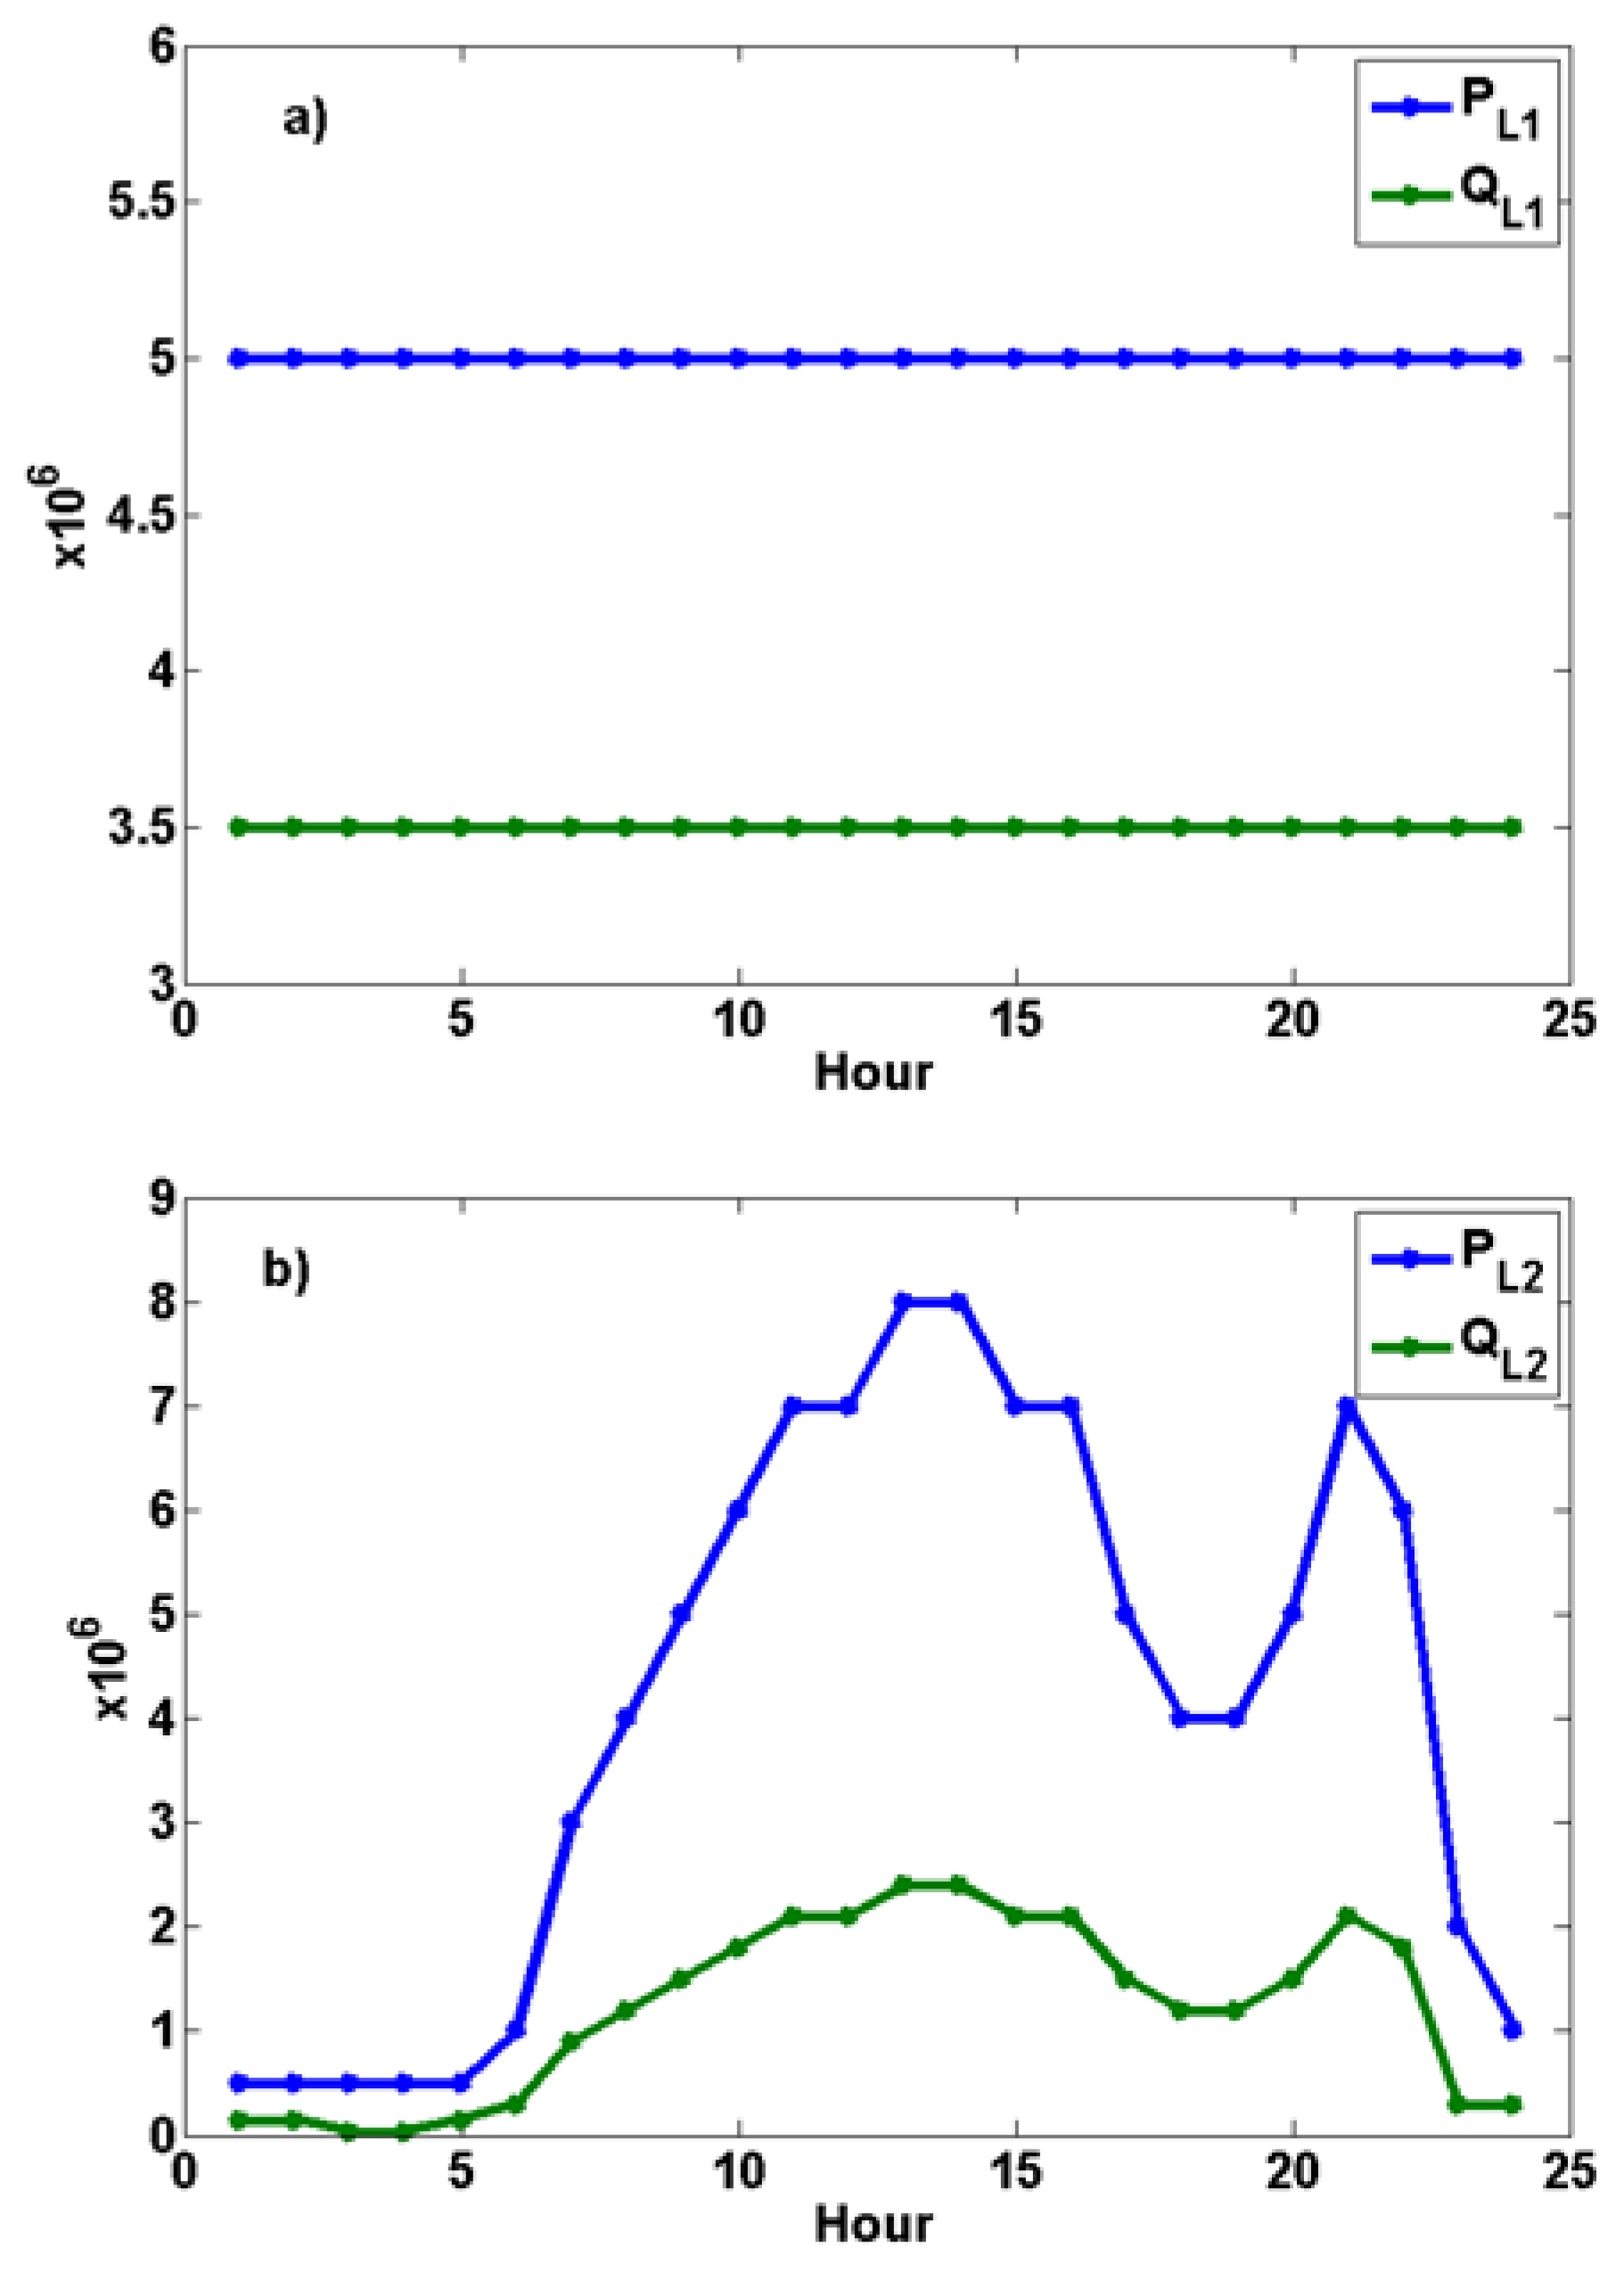
  • Impact of load demand: As power demand on the grid increases, voltage variations become more pronounced, particularly at load and transition buses.
  • Peak Bitcoin-mining consumption at 02:00 caused localized voltage dips.
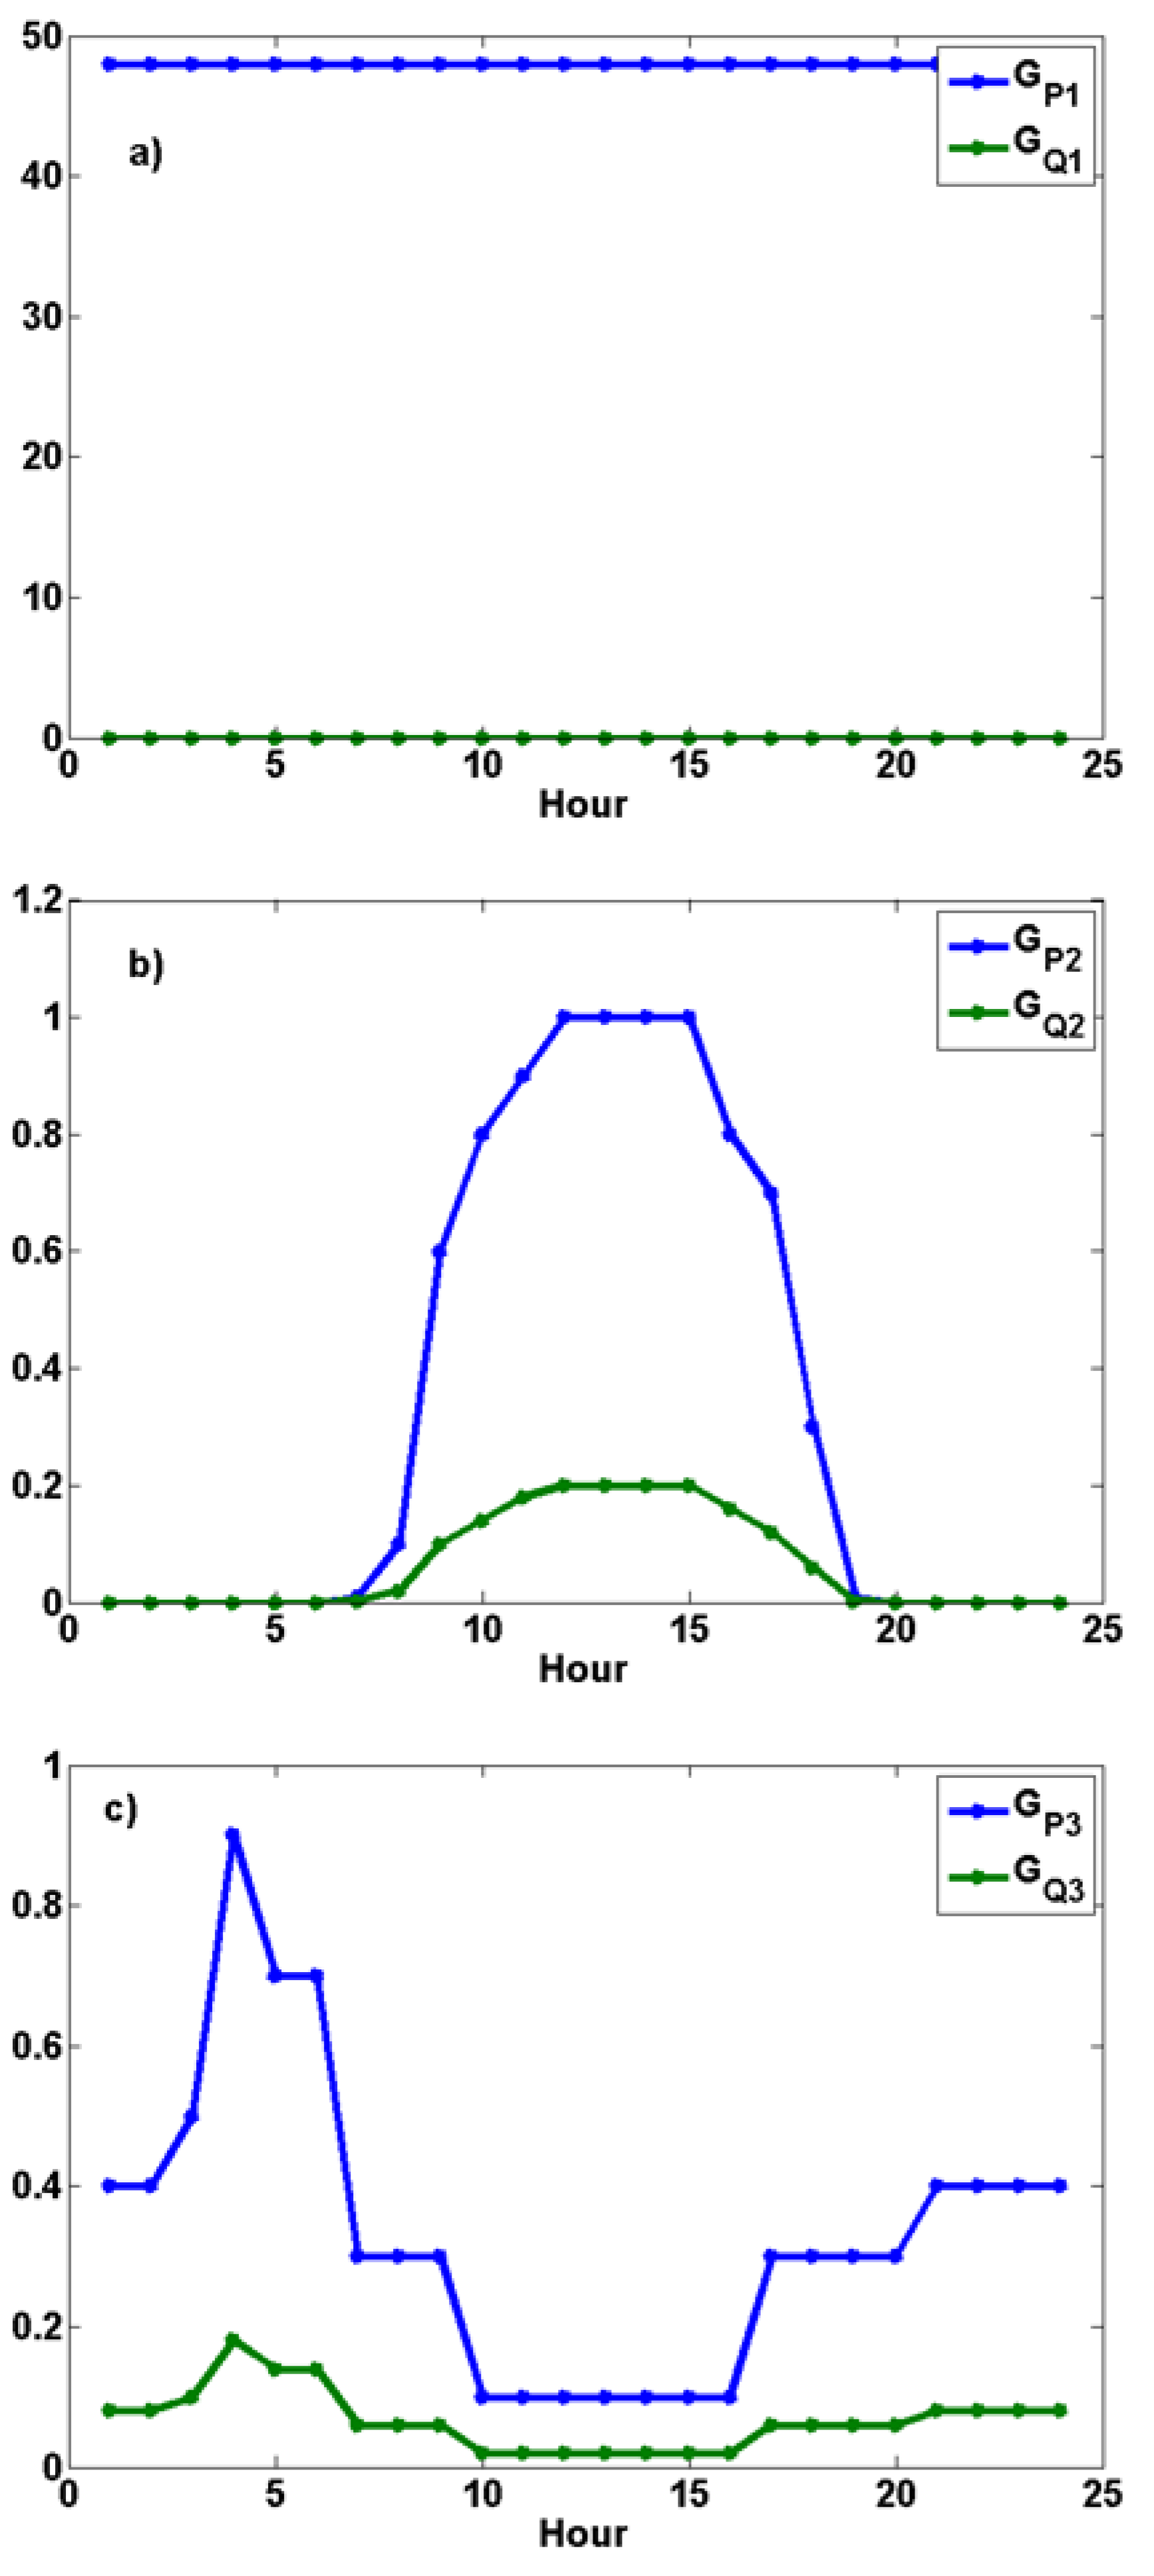
  • High generation of solar energy at 13:00 led to voltage increases, with potential overvoltage risks.
  • Role of Bitcoin-mining loads: Unlike other high-demand applications, Bitcoin-mining operations contribute to grid stability due to their relatively steady consumption patterns.
  • Bitcoin-mining loads exhibited minimal intra-day power factor fluctuations compared to other loads.
  • Their stable consumption can help mitigate reactive power fluctuations, reducing overall grid instability.
  • Need for dynamic grid management: Static power system models are insufficient to capture real-time imbalances. Instead, a dynamic approach is essential for effective grid operation.
  • Adaptive inverter control, smart demand response, and energy-storage integration can help mitigate power quality disturbances.
  • Real-time monitoring and forecasting techniques should be prioritized to enhance grid resilience and reliability.
Future Recommendations:
  • Implement real-time optimization strategies for integrating renewable energy into networks that support Bitcoin mining and EV charging.
  • Develop more advanced forecasting and adaptive control mechanisms to maintain power factor stability.
  • Investigate the impact of varying levels of penetration of renewable energy on long-term grid reliability and efficiency.
By adopting proactive grid-management strategies, power-system operators can ensure the seamless integration of renewable energy, electric-vehicle charging, and Bitcoin-mining operations while maintaining grid stability and efficiency.

Funding

This research was supported by TÜBİTAK (The Scientific and Technological Research Council of Turkey) under the international postdoctoral fellowship program.

Institutional Review Board Statement

Not applicable.

Informed Consent Statement

Not applicable.

Data Availability Statement

Data are available upon reasonable request.

Conflicts of Interest

The author declares no conflicts of interest.

References

  1. Treiblmaier, H. A comprehensive research framework for Bitcoin’s energy use: Fundamentals, economic rationale, and a pinch of thermodynamics. Blockchain Res. Appl. 2023, 4, 100149. [Google Scholar] [CrossRef]
  2. Lotfi, R.; Zare, S.G.; Gharehbaghi, A.; Nazari, S.; Weber, G.-W. Robust optimization for energy-aware cryptocurrency farm location with renewable energy. Comput. Ind. Eng. 2023, 177, 109009. [Google Scholar] [CrossRef]
  3. Yin, W.; Ji, J.; Qin, X. Study on optimal configuration of EV charging stations based on second-order cone. Energy 2023, 284, 128494. [Google Scholar] [CrossRef]
  4. Tabar, V.S.; Ghassemzadeh, S.; Tohidi, S. Risk-based day-ahead planning of a renewable multi-carrier system integrated with multi-level electric vehicle charging station, cryptocurrency mining farm and flexible loads. J. Clean. Prod. 2022, 380, 134898. [Google Scholar] [CrossRef]
  5. Peças Lopes, J.A.; Hatziargyriou, N.; Mutale, J.; Djapic, P.; Jenkins, N. Integrating distributed generation into electric power systems: A review of drivers, challenges and opportunities. Electr. Power Syst. Res. 2006, 7, 1189–1203. [Google Scholar] [CrossRef]
  6. Wang, K.; Zhang, Z.; Kim, H.S. ReviewChain: Smart Contract Based Review System with Multi-Blockchain Gateway. In Proceedings of the 2018 IEEE International Conference on Internet of Things (iThings) and IEEE Green Computing and Communications (GreenCom) and IEEE Cyber, Physical and Social Computing (CPSCom) and IEEE Smart Data (SmartData), Halifax, NS, Canada, 30 July–3 August 2018. [Google Scholar]
  7. Wang, X.; Yang, W.; Noor, S.; Chen, C.; Guo, M.; Dam, K.h.v. Blockchain-based smart contract for energy demand management. Energy Procedia 2019, 168, 2719–2724. [Google Scholar] [CrossRef]
  8. Shafiei, M.; Ghasemi-Marzbali, A. Fast-charging station for electric vehicles, challenges and issues: A comprehensive review. J. Energy Storage 2022, 49, 104136. [Google Scholar] [CrossRef]
  9. García-Villalobos, J.; Zamora, I.; San Martín, J.L.; Asensio, F.J.; Aperribay, V. Plug-in electric vehicles in electric distribution networks: A review of smart charging approaches. Renew. Sustain. Energy Rev. 2014, 38, 717–731. [Google Scholar] [CrossRef]
  10. Rodriguez-Calvo, A.; Cossent, R.; Frías, P. Integration of PV and EVs in unbalanced residential LV networks and implications for the smart grid and advanced metering infrastructure deployment. Int. J. Electr. Power Energy Syst. 2017, 91, 121–134. [Google Scholar] [CrossRef]
  11. Li, J.; Li, N.; Peng, J.; Cui, H.; Wu, Z. Energy consumption of cryptocurrency mining: A study of electricity consumption in mining cryptocurrencies. Enegry 2019, 168, 1189–1203. [Google Scholar] [CrossRef]
  12. Kaygusuz, A.; Gül, O.; Alagöz, B.B. An analysis for impacts of renewable distributed generation conditions on the load flow stability of electrical power system. EMO Bilimsel Dergi Elektr. Elektron. Bilgi. Biyomedikal Mühendisliği Bilimsel Dergi 2012, 2, 77–85. [Google Scholar]
  13. Tinney, W.F.; Hart, C.E. Power Flow Solution by Newton’s Method. IEEE Trans. Power App. Syst. 1967, 86, 1449–1460. [Google Scholar] [CrossRef]
  14. Zimmerman, R.D.; Chiang, H.D. Fast Decoupled Power Flow for Unbalanced Radial Distribution Systems. IEEE Trans. Power Syst. 1995, 10, 2045–2052. [Google Scholar] [CrossRef]
  15. Stott, B.; Alsaq, O. Fast Decoupled Load Flow. IEEE Trans. Power Appar. Syst. 1974, 3, 859–869. [Google Scholar] [CrossRef]
  16. Moorthy, S.; Al-Dabbagh, M.; Vawser, M. Improved Phase–Cordinate Gauss-Seidel Load Flow Algorithm. Electr. Power Syst. Res. 1995, 34, 91–95. [Google Scholar] [CrossRef]
  17. Zang, W.; Liu, Y. Reactive Power Optimization Based on PSO in a Partical Power System. In Proceedings of the Power Engineering Society General Meeting, 2004 IEEE, Denver, CO, USA, 6–10 June 2004; Volume 1, pp. 239–243. [Google Scholar]
  18. Vlachogiannis, J.Q. Fuzzy Logic Application in Load Flow Studies. IEE Proc. Gener. Transm. Distrib. 2001, 148, 34–40. [Google Scholar] [CrossRef]
  19. Storn, R.; Price, K. Differential Evolution-a Simple and Efficient Heuristic for Global Optimization over Continuous Spaces. J. Glob. Optim. 1997, 11, 341–359. [Google Scholar] [CrossRef]
  20. Li, Z.; Shi, J.; Liu, Y. Distributed Reactive Power Optimization and Programming for Area Power System. In Proceedings of the International Conference on Power System Technology, POWERCOM 2004, Singapore, 21–24 November 2004; Volume 2, pp. 1447–1450. [Google Scholar]
  21. Wei, H.; Cong, Z.; Jingyan, Y.; Jianhua, Z.; Zifa, L.; Zhilian, W.; Dongli, P. Using Bacterial Chemotaxis Method for Reactive Power Optimization. In Proceedings of the 2008 IEEE/PES Transmission and Distribution Conference and Exposition, Chicago, IL, USA, 21–24 April 2008; pp. 1–7. [Google Scholar]
  22. Shirmohammadi, D.; Hong, H.W.; Semlyen, A.; Luo, G.X. Compensation-Based Power Flow Method for Weakly Meshed Distribution and Transmission Networks. IEEE Trans. Power Syst. 1988, 3, 753–762. [Google Scholar] [CrossRef]
  23. Absar, M.N.; Islam, M.F.; Ahmed, A. Power quality improvement of a proposed grid-connected hybrid system by load flow analysis using static var compensator. Heliyon 2023, 9, e17915. [Google Scholar] [CrossRef]
  24. Dai, Y.; Zhang, L.; Chen, Q.; Zhou, K.; Hua, T. Multi-VSG-Based Frequency Regulation for Uninterruptible Power AC Micro-Grid with Distributed Electric Vehicles. Int. J. Electr. Power Energy Syst. 2022, 137, 107785. [Google Scholar] [CrossRef]
  25. Askarov, A.; Rudnik, V.; Ruban, N.; Radko, P.; Ilyushin, P.; Suvorov, A. Enhanced Virtual Synchronous Generator with Angular Frequency Deviation Feedforward and Energy Recovery Control for Energy Storage System. Mathematics 2024, 12, 2691. [Google Scholar] [CrossRef]
  26. Saadat, H. Power Systems Analysis; McGraw Hill: Boston, MA, USA, 1999. [Google Scholar]
  27. Huang, S.; Xiong, L.; Zhou, Y.; Gao, F.; Jia, Q.; Li, X.; Li, X.; Wang, Z.; Khan, M.W. Robust Distributed Fixed-Time Fault-Tolerant Control for Shipboard Microgrids With Actuator Fault. IEEE Trans. Transp. Electrif. 2025, 11, 1791–1804. [Google Scholar] [CrossRef]
  28. Hajiaghapour-Moghimi, M.; Heydari Tafreshi, O.; Hajipour, E.; Vakilian, M.; Lehtonen, M. Investigating the Cryptocurrency Mining Loads’ High Penetration Impact on Electric Power Grid. IEEE Access 2024, 12, 153643–153663. [Google Scholar] [CrossRef]
  29. Akhter, A.F.M.S.; Arnob, T.Z.; Noor, E.B.; Hizal, S.; Pathan, A.-S.K. An Edge-Supported Blockchain-Based Secure Authentication Method and a Cryptocurrency-Based Billing System for P2P Charging of Electric Vehicles. Entropy 2022, 24, 1644. [Google Scholar] [CrossRef]
  30. Malik, A.W.; Anwar, Z. Do Charging Stations Benefit from Cryptojacking? A Novel Framework for Its Financial Impact Analysis on Electric Vehicles. Energies 2022, 15, 5773. [Google Scholar] [CrossRef]
  31. Basu, S.; Mahapatra, G.S. Numerical solution of fuzzy non-linear equations under generalized trapezoidal fuzziness by Newton–Raphson method. Frankl. Open 2024, 9, 100168. [Google Scholar] [CrossRef]
  32. Bayat, M.; Koushki, M.M.; Ghadimi, A.A.; Véliz, M.T.; Jurado, F. Comprehensive enhanced Newton Raphson approach for power flow analysis in droop-controlled islanded AC microgrids. Int. J. Electr. Power Energy Syst. 2022, 143, 108493. [Google Scholar] [CrossRef]
  33. Pandya, K.; Joshi, S.K. A survey of optimal power flow methods. J. Theor. Appl. Inf. Technol. 2008, 4, 450–458. [Google Scholar]
  34. Zhong, X.; Xin Li, G.; Zhng, C. False data injection in power smart grid and identification of the most vulnerable bus; a case study 14 IEEE bus network. Energy Rep. 2021, 7, 8476–8484. [Google Scholar] [CrossRef]
  35. Yip, A.; Hoehne, C.; Jadun, P.; Ledna, C.; Hale, E.; Muratori, M. Highly Resolved Projections of Passenger Electric Vehicle Charging Loads for the Contiguous United States: Results From and Methods Behind Bottom-Up Simulations of County-Specific Household Electric Vehicle Charging Load (Hourly 8760) Profiles Projected Through 2050 for Differentiated Household and Vehicle Types; National Renewable Energy Laboratory: Golden, CO, USA, 2023. [Google Scholar]
Figure 1. Flow diagram of calculation steps for 24-h load-flow analysis.
Sustainability 17 02515 g001
Figure 2. IEEE 14-bus test system used in the example application.
Sustainability 17 02515 g002
Figure 3. (a) Low-variation load-demand profile (PL1, QL1) that models the power consumption of a Bitcoin-mining operation. (b) High-variability load-demand profile (PL2, QL2) modeling EV power consumption.
Sustainability 17 02515 g003
Figure 4. (a) Continuous energy-production profile (GP1, GQ1) (b) Solar energy-production profile (GP2, GQ2) (c) Wind energy-production profile (GP3, GQ3).
Sustainability 17 02515 g004
Figure 5. (a) 24-h profiles of bus voltage levels obtained in the CS scenario analysis of the IEEE-14 bus test system. (b) Daily voltage variations of the buses. (c) Daily power factor variations of the buses.
Sustainability 17 02515 g005
Figure 6. (a) 24-h voltage levels, (b) power factors (c,d) active and reactive power profiles calculated for Bus 7.
Sustainability 17 02515 g006
Figure 7. (a) 24-h voltage levels, (b) power factors (c,d) active and reactive power profiles calculated for Bus 8.
Sustainability 17 02515 g007
Figure 8. (a) 24-h voltage levels, (b) power factors (c,d) active and reactive power profiles calculated for Bus 10.
Sustainability 17 02515 g008
Table 1. Comparison of iterative methods.
MethodAdvantagesDisadvantages
Newton−RaphsonQuadratic convergence; efficient for large systems; solution steps independent of system size.High computational cost per iteration; requires Jacobian matrix computation.
Gauss−SeidelSimple implementation; low memory and computational requirements.Slow convergence; not suitable for large-scale systems.
Fast-DecoupledFaster than Newton−Raphson; computationally efficient; well-suited for large power systems.Lower accuracy in weakly meshed or low-voltage networks.
Table 2. The key simulation parameters.
ParameterValueDescription
Base Power (MVA)100Power system base power
Accuracy Threshold0.001Convergence accuracy for Newton−Raphson
Maximum Iterations10Maximum allowable iterations for convergence
Table 3. Comparison of daily voltage variations and power factor variations obtained in the 24-h load-flow analysis for CS, LDx3 and LDx7 energy-status scenarios in the IEEE 14-bus power system.
Bus
No
Vσ(CS–LDx3–LDx7)cosθσ(CS–LDx3–LDx7)
10%–0%–0%1.6%–13%–68%
20%–0%–0%36%–16%–98%
30%–0%–0%12%–50%–30%
40.35%–2%–10.6%–%–%–
50.32%–2.5%–11.2%%–%–%–
60.7%–4.6%–8.3%1.3%–1.3%–1.3%
70.6%–4.3%–51.7%0.01%–0.01%–0.01%
80.7%–5.2%–22.05%3.2%–3.2%–3.2%
90.6%–4.4%–32.57%%–%–%–
100.7%–5%–7.89%1.3%–1.3%–1.3%
110.68%–5%–6.89%0.01%–0.01%–0.01%
120.77%–4.9%–8.8%%–%–%–
130.87%–5.36%–31.3%1.3%–1.3%–1.3%
140.75%–5.16%–31.4%0.01%–0.01%–0.01%
Table 4. Comparison of daily voltage variations and power factor variations obtained in the 24-h load-flow analysis for DG, DGx5 and DGx7 energy-status scenarios in the IEEE 14-bus power system.
Bus
No
Vδ(DG–DGx5–DGx8)cosθδ(DG–DGx5–DGx8)
10%–0%–0%1.5%–1.3%–1.3%
20%–0%–0%3.3%–2.5%–2.5%
30%–0%–0%9.8%–6.0%–5.8%
40.31%–0.26%–0.27%–%–%–
50.30%–0.25%–0.26%–%–%–
60.66%–0.56%–0.56%21.85–32.5%–16.4%
70.56%–0.46%–0.48%1.2%–20%–26.3%
80.69%–0.58%–059%3.9%–15.4%–31.2%
90.58%–0.48%–0.49%–%–%–
100.70%–0.56%–0.59%1.4%–4.3%–41.2%
110.68%–0.57%–0.63%2%–59.5%–36.6%
120.73%–0.62%–0.62%–%–%–
130.82%–0.72%–0.71%21.3%–21.3%–3.8%
140.67%–0.54%–0.63%2.5%–55.5%–27.5%
Table 5. Results for Load Flow at 13:00 (High Production of Solar Energy and High EV Load).
Bus NoVoltage
(p.u)
Power
Factor
Active Power (MW)Reactive Power (MVar)
11.1000.8468248.00030.148
21.0950.7953348.00036.583
31.0100.59944−46.646−62.284
41.059NaN0.0000.000
51.067NaN0.0000.000
61.1060.953541.1000.200
71.0750.815300.1000.020
81.0650.902461.1000.220
91.080NaN0.0000.000
101.0800.953991.0000.200
111.0880.765311.1000.220
121.101NaN0.0000.000
131.0950.957490.1000.020
141.0790.7713731.0000.200
Table 6. Results for Load Flow at 02:00 (Zero Production of Solar Energy, Minimum EV Load, Peak Bitcoin-Mining Load).
Bus NoVoltage
(p.u)
Power
Factor
Active Power (MW)Reactive Power (MVar)
11.1100.8818448.00025.667
21.0950.8685348.00027.391
31.0100.78259−72.778−57.893
41.068NaN0.0000.000
51.075NaN0.0000.000
61.1250.819230.4000.080
71.0900.802500.4000.080
81.0850.819230.4000.080
91.097NaN0.0000.000
101.1000.957820.0000.000
111.1070.802500.4000.080
121.122NaN0.0000.000
131.1190.8192320.4000.080
141.0980.8192320.0000.000
Disclaimer/Publisher’s Note: The statements, opinions and data contained in all publications are solely those of the individual author(s) and contributor(s) and not of MDPI and/or the editor(s). MDPI and/or the editor(s) disclaim responsibility for any injury to people or property resulting from any ideas, methods, instructions or products referred to in the content.

