Article

Evaluation of and Reconnection to Open Space: The Chicago Strip

by
Wenchang Lu
1,2 and
Martine De Maeseneer
2,*
1
School of Urban Construction, Jiaxing Vocational & Technical College, Jiaxing 314036, China
2
Faculty of Architecture Campus Sint-Lucas Ghent, Katholieke Universiteit Leuven, 9000 Gent, Belgium
*
Author to whom correspondence should be addressed.
Sustainability 2025, 17(6), 2457; https://doi.org/10.3390/su17062457
Submission received: 6 February 2025 / Revised: 4 March 2025 / Accepted: 6 March 2025 / Published: 11 March 2025

Abstract

:
Urban open space evaluation is crucial for enhancing human well-being and ecological sustainability, yet existing frameworks often overlook visual connectivity. This study integrates vision as a primary factor in accessibility assessment, combining the Analytic Hierarchy Process (AHP), user experience, and sustainable development frameworks. Focusing on the Chicago River corridor, we employed open data, spatial syntax, and Visibility Graph Analysis (VGA) using DepthmapX software to quantify visual parameters such as clustering coefficient, control, entropy, and integration. Results revealed fragmented visual connectivity, with obstructed zones and highly integrated nodes. Inspired by the Las Vegas Strip’s linear connectivity, design interventions prioritized vision-led strategies: removing visual barriers, establishing viewing platforms, and enhancing waterborne transportation hubs. These interventions demonstrated that visual optimization significantly improves spatial continuity and user engagement. The findings underscore the necessity of incorporating visual metrics into open space evaluation systems, offering planners a replicable methodology to address fragmentation and foster cohesive urban environments.

1. Introduction

Under the rapid pace of park city construction, there is an urgent need for the evaluation of the quality of open public space. In recent years, studies on this topic have been carried out with the use of open data sources and techniques. Thus, it is necessary to have an overview of these attempts and studies to promote urban area management and enhance the quality of open space.
Sociologists, architects, and urban planners have long held the view that open public spaces have a very important role to play. Urban public spaces have an extremely important function in improving the quality of the urban environment and the well-being of residents [1]. Public spaces are integral to urban life, serving multiple critical functions. They are the nexus for social interaction, enabling the formation of community cohesion [2]. Economically, they drive local prosperity by attracting users and enhancing commercial activity. Culturally and educationally, they provide platforms for enrichment and heritage preservation [3]. From a health perspective, they enhance well–being both physically and mentally [4,5]. Moreover, they are essential for urban sustainability, maintaining ecological balance and safeguarding resources for current and future urban dwellers [6]. Additionally, the wind environment significantly impacts urban open spaces, affecting pedestrian flow, thermal comfort, and structural safety [7,8].
The evaluation of public spaces can offer significant references and implications for the subsequent endeavors of conducting quality assessment on public spaces and implementing refined spatial governance. It thereby contributes to promoting the modernization of urban spatial governance and facilitating the high-quality development of cities.
Currently, the mainstream open space evaluation frameworks (Table 1) are as follows:
The Analytic Hierarchy Process (AHP) framework was put forward by Thomas L. Saaty [9]. This framework undertakes the hierarchical decomposition of open space evaluation. It formulates a structured modus operandi that facilitates a meticulous and methodical exploration of diverse factors. The hierarchical breakdown guarantees the integration of all pertinent aspects, which augments the comprehensiveness of the evaluation [10]. Recently AHP has been widely applied in research on open spaces. Bakri, Muhammad et al. combined AHP with Map Overlay to identify the locations of green spaces [11]. Shi, J. R. et al. utilized AHP to evaluate people’s preference for public spaces [12]. Nugraha, Arief Laila et al. integrated AHP with GIS to assess environmental vulnerability [13]. Researchers have manifested the extensive application of AHP in the spatial field and, to a certain extent, attested to its value in spatial evaluation. Nevertheless, some scholars believe that in the construction of judgment matrices, AHP is associated with a degree of subjectivity. Since it depends on the professional judgments of experts or decision-makers, which are unavoidably influenced by their personal knowledge and experience, some degree of fluctuation may occur in the determination of relationships and weights among factors [14,15].
The user experience-based framework has emerged and advanced under the collective impetus of scholars from various fields, such as environmental psychology [16,17] and behavioral science [18]. In this method, data collection is generally accomplished via methods such as questionnaires, on-site observations, and user interviews. Starting from users’ perceptions, needs, and behaviors, this framework analyzes the experiences that public spaces bring to users in various dimensions such as visual, auditory, tactile, and psychological, and then assesses the quality of public spaces. However, this approach necessitates a more meticulous examination of the evaluation results due to the fact that individual differences among respondents can impact the outcomes [19].
The sustainable development framework was proposed by Gro Harlem Brundtland and others [20]. Based on the three dimensions of sustainable development, namely the economy, society, and the environment [21], this framework delves into the performance of public spaces in aspects such as ecological protection, resource utilization, social fairness, and community participation, and puts forward corresponding evaluation indicators and methods. This framework’s integration of these three dimensions helps circumvent the partiality inherent in single-dimension assessment. This framework has displayed practical value in multiple aspects, yet there are still some areas that could be improved further. Refining quantification and measurement techniques helps enhance the precision of specific indicators, while optimizing the data collection process contributes to augmenting the overall accuracy and reliability of the framework.
In summary, the aim of this study is to assimilate and combine the merits of the aforementioned three evaluation systems. The AHP framework can prioritize visual elements in vision-guided design, providing a basis for design decisions. The user experience-based framework helps understand users’ visual preferences, which can be translated into specific design requirements to guide the design. The sustainable development framework intersects with vision-guided design. These frameworks’ interconnections support the construction of an open-space evaluation system. By quantifying evaluation indicators, suggestions are put forward for building such a system. In the context of this research, accessibility will be expounded as an example. Specifically, relevant exploration and demonstration will be carried out through the evaluation of public spaces along the Chicago River and the exploration of vision-guided design.

1.1. Chicago River

The Chicago River and its surrounding area (Figure 1) is a major part of the city’s infrastructure and has significantly contributed to its development and industrial history. It has been a key transportation artery, enabling the movement of goods and resources, and has been closely associated with the establishment and growth of numerous industrial sectors [22]. The historical imprints left by industrial activities along the riverbanks, such as the presence of former factory sites and transportation-related structures, now coexist with the contemporary demand for enhanced public space [23]. The abundant riverfront open area holds considerable potential to address the notable scarcity of leisure space in the adjacent neighborhoods. The study of these public spaces is essential for the construction and refinement of a public space evaluation system. With accessibility as an example, understanding how well these riverfront public spaces connect with each other and with the surrounding neighborhoods is a key aspect. By analyzing the connectivity, we can determine the effectiveness of the public space layout and identify areas for improvement. This research on the Chicago River area’s public spaces can, thus, provide valuable insights and a practical model for the assessment and enhancement of public spaces in other similar urban settings.

1.1.1. History of the Chicago River

The Chicago River, stretching for an extensive 156-mile-long (251 km) span, courses its way through the vibrant city of Chicago, Illinois, as well as its adjacent suburbs. This significant waterway represents a fundamental and indispensable constituent of the city’s infrastructure framework. Throughout history, it has been actively involved in and has exerted a profound and far-reaching impact on the city’s historical evolution and comprehensive development. It has functioned as a critical conduit for a diverse range of activities, including but not limited to transportation and trade, thereby molding and defining the economic and social contours of the region.
The Chicago River system comprises three branches: the North Branch, South Branch, and Main Stem. The North Branch and South Branch each commence in the northern region of Illinois and progress southward. The Main Stem, on the other hand, links the two branches and extends eastward to discharge into Lake Michigan.
In the mid-19th century, the river was modified into a shipping conduit. To preclude the inflow of wastewater into Lake Michigan, the flow direction was inverted. The river, thenceforth, became a vital transportation artery for freight and commodities. Nevertheless, its pollution levels steadily escalated, engendering apprehensions regarding the environment and public health.

1.1.2. Accessibility: The River as a Link

Chicago’s proximity to natural resources such as timber and fertile farmland also contributed to its growth as an industrial hub. The city became a major producer of goods such as steel, meatpacking, and agricultural products, attracting waves of immigrants seeking work in the factories and mills. This industrial boom transformed the city’s landscape, with vast warehouses and factories dominating the skyline and the working-class neighborhoods that surrounded them. However, the decline of industry in the late 20th century led to economic challenges and a shift towards a more service-based economy [24].
In the early 20th century, the banks of the Chicago River served as the locus for a multitude of industrial enterprises. With its strategic location and abundant water resources, it became a prime area for various industries to thrive. Meatpacking plants, steel mills, and chemical factories, among others, were reliant upon the river not only for the facilitation of transportation but also as a water supply for their industrial processes. These industries, in turn, contributed significantly to the economic growth and urban expansion of Chicago. During the late 19th and early 20th centuries, the Chicago River occupied a pivotal position in the conveyance of goods, individuals, and livestock [25]. It functioned as a shipping route for commodities such as lumber, grain, and coal and constituted a vital transportation nexus between Lake Michigan and the remaining portions of the city. The river’s role in transporting livestock was particularly crucial, as it enabled the efficient movement of cattle and other animals to slaughterhouses and markets, further fueling the city’s position as a major economic hub.

1.1.3. Inaccessibility: The River as a Hindrance

While the Chicago River has been explored in terms of its connective function and beneficial effects on urban development, it is essential to recognize that it also operated as a hindrance. Historically, given its geographical location and functional characteristics, it constituted an impediment. Prior to the extensive establishment of bridges and transportation infrastructure, it hindered travel and transportation, particularly for those on foot. It further curtailed access to specific urban zones, especially in the southern part where the paucity of bridges was more conspicuous [26]. The river’s dual aspect of connection and hindrance necessitates an in-depth comprehension within the realm of urban history and planning research.

1.1.4. The Current Situation of the Riverbanks

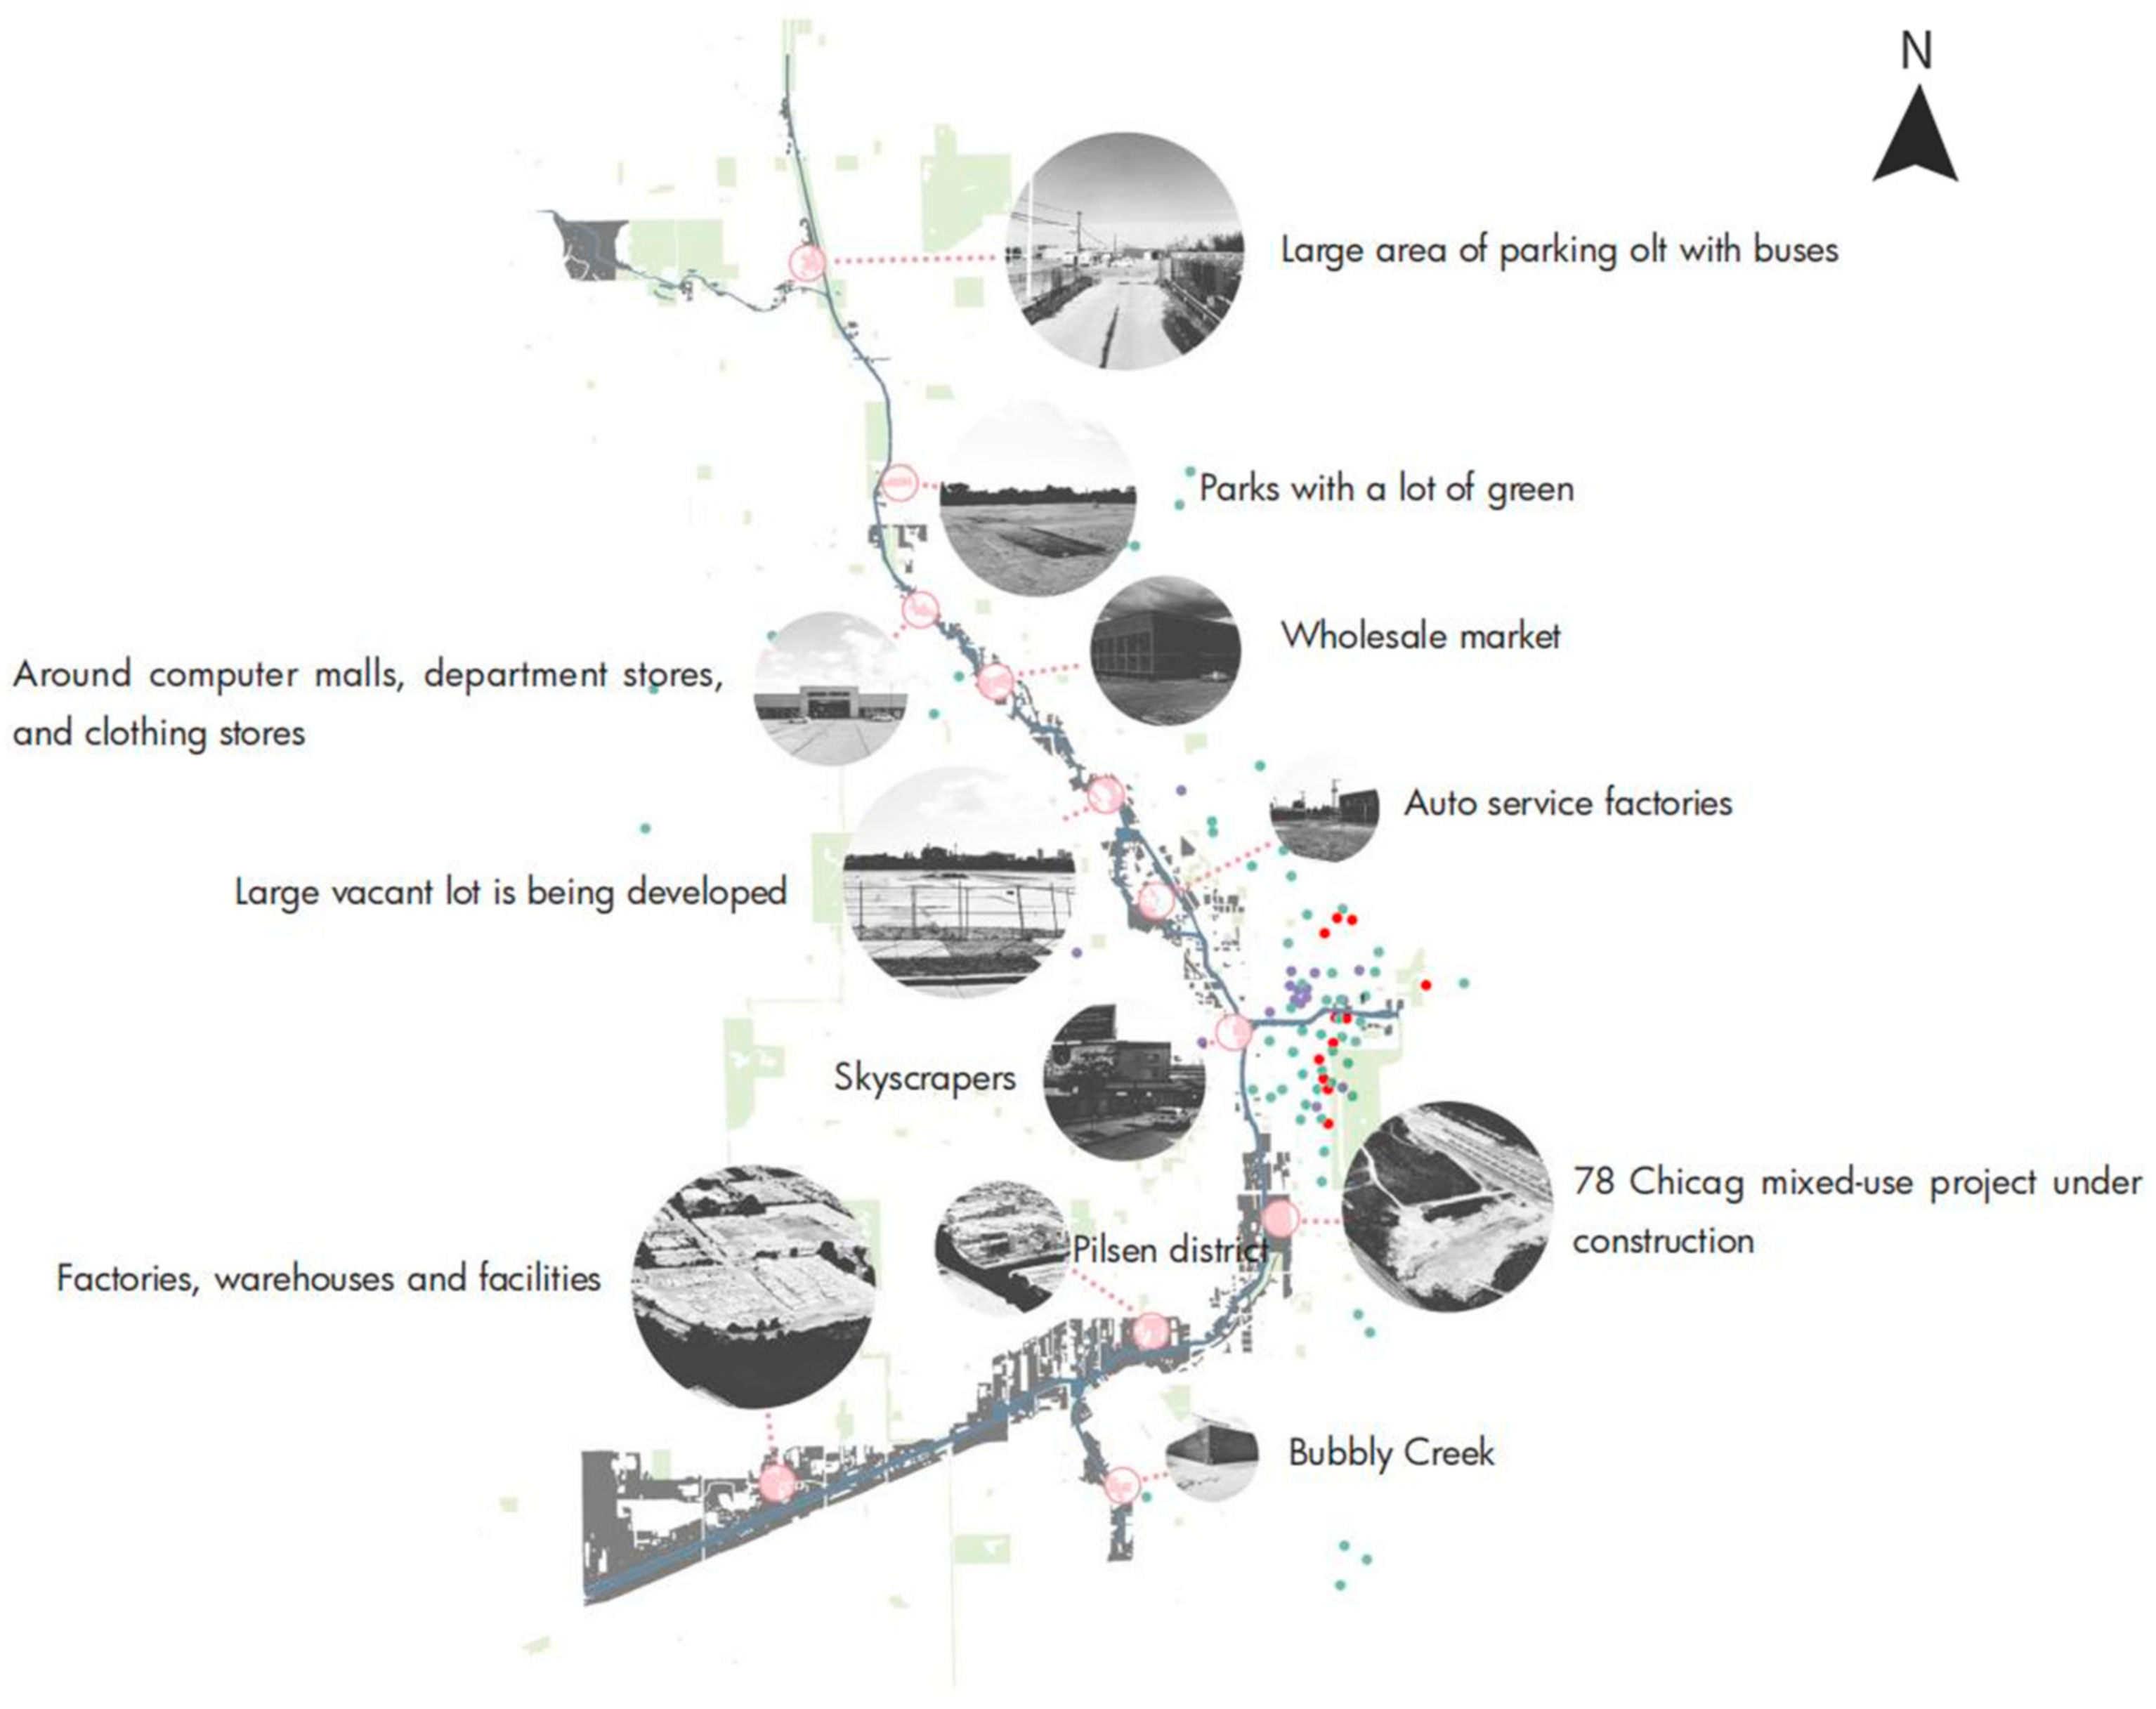
The banks of the Chicago River still accommodate some factories and possess open spaces that are under development. The open spaces along the river (Figure 2) have the potential to contribute to the adjacent neighborhoods and the city at large. As Patrick noted, among the 18 city neighborhoods bordering the waterway, only 6 have what experts consider an adequate amount of parkland: 3 acres for every 1000 residents. Of the 12 without sufficient parks, 5—Albany Park, Avondale, Logan Square, Pilsen, and Bridgeport—are severely underserved, with less than 1 acre for every 1000 people [27]. This situation clearly reflects the inaccessibility problem and emphasizes the importance of exploring strategies to make better use of these spaces to improve the overall urban environment and the quality of life of residents.
Take the South Chicago Branch River as an example. With the passage of time, it has evolved from a bustling transportation and industrial center into a resource of great significance for recreation and culture [28]. At present, it has become a prominent tourist destination. Boat tours and water taxis afford tourists exceptional vistas of the city’s skyline and architecture from the water, thereby augmenting the allure of the area.
The riverfront has undergone a remarkable revitalization. New parks, restaurants, and shops have been erected, not only attracting tourists but also enhancing the quality of life for local inhabitants. In addition to being a tourist hotspot, the river now accommodates a variety of recreational activities such as kayaking, canoeing, and fishing [29]. The existence of multiple public parks and trails along the riverfront enables convenient access to the water, which promotes a healthy and active lifestyle for both residents and visitors. This evolution of the river from an industrial waterway to a vibrant community asset attests to the potential for urban renewal and environmental sustainability.
Nevertheless, notwithstanding the multitude of policies and proposals in the past two decades that aimed to transform the Chicago River from a divisive factor into a unifying one, the open spaces along the river predominantly remain fragmented. Mapping of the Chicago River and its surrounding open spaces reveals that they are either discontinuous or individually enclosed. As shown in Figure 2, some factories along the river are still in operation, and the closed area makes it difficult to reach the river. Even now some factories have disappeared, the legacy of this land use has left little room for public access. This situation implies that, notwithstanding the existing policies and measures, the transformation of the Chicago River into a well-connected entity requires additional efforts and greater commitment.
The partial success in the transformation of certain public spaces along the river indicates that there is a solid foundation for further development. However, the overall insufficient connectivity of the river system as a whole justifies the necessity and significance of this research. These aspects of the Chicago River are crucial for the open-space theme. Its history influences open-space distribution, accessibility affects usability, and the current fragmented state shows the need for open-space improvement. By delving deeper into the existing challenges such as inaccessible frontages, fragmented planning, limited funding, land use constraints, and property ownership complications, this study can contribute to the realization of a more integrated and sustainable Chicago River corridor.

2. Materials and Methods

Evaluation of Accessibility

Accessibility is a prerequisite for the functioning of public space services and one of the important indicators in the public space assessment framework. To a certain extent, accessibility reflects the degree of connection between public spaces and surrounding areas [30], the activity level of public spaces, and social fairness. Accessibility plays a key role in ensuring social fairness, promoting social integration, enhancing economic benefits, constructing a reasonable urban spatial structure, and improving the overall image and quality of the city [31].
In the analysis of spatial accessibility, the following methods in Table 2 are relatively common: the ratio method [32], the minimum neighbor distance method [33], the method based on cumulative opportunities [34], and the method based on spatial interaction [35,36].
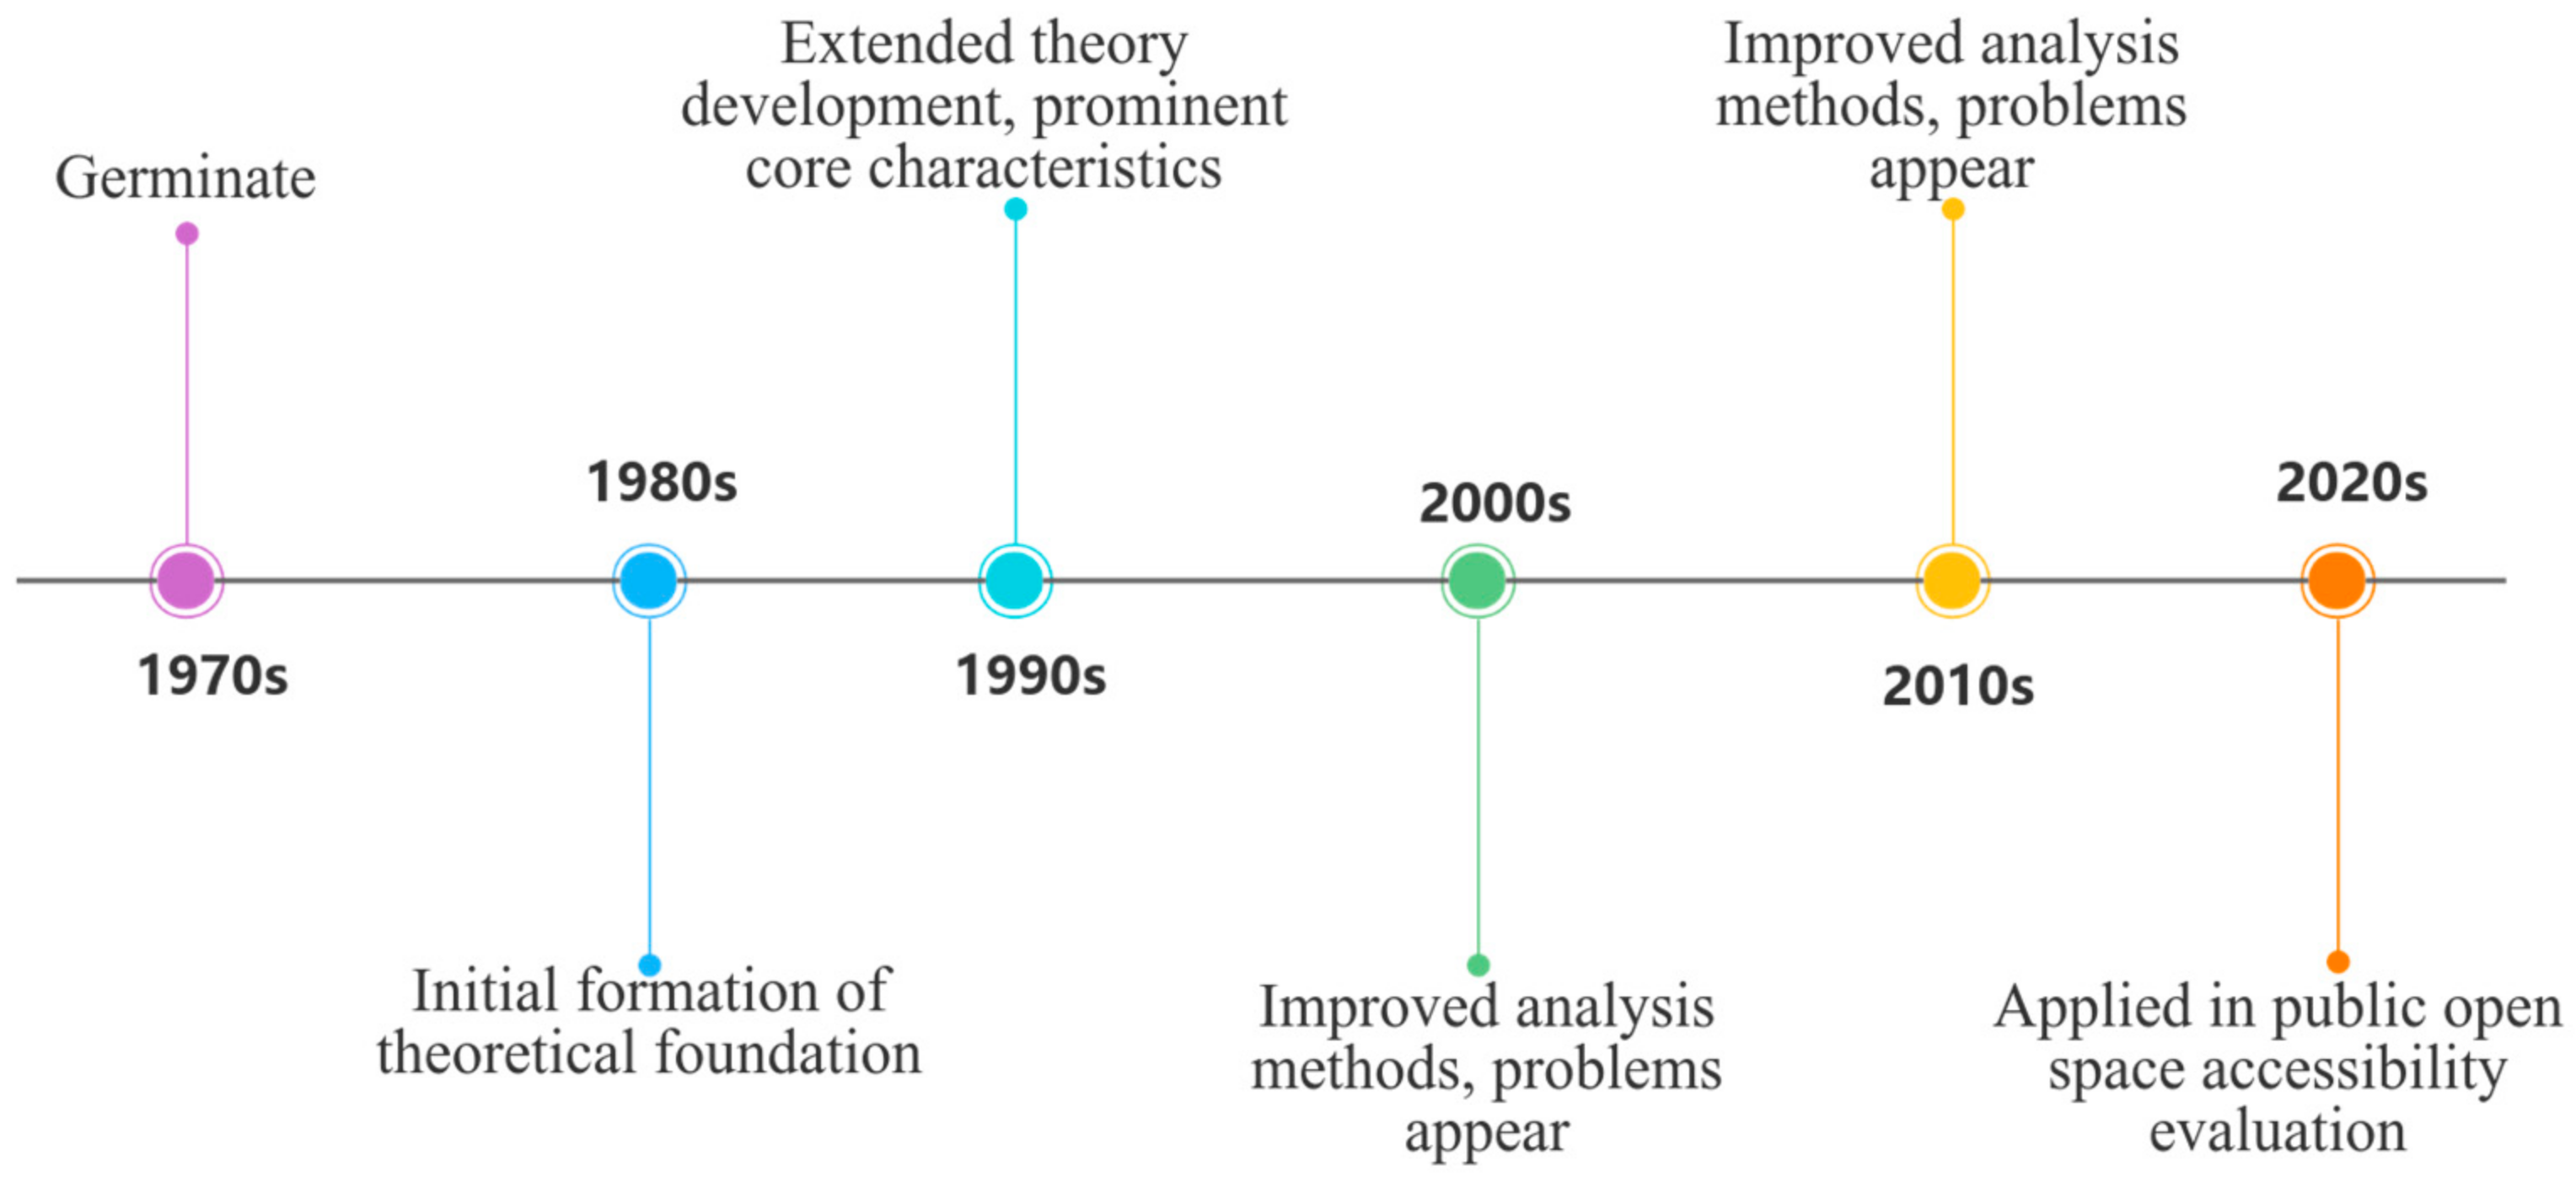
Space syntax is a method for quantitatively analyzing the relationship between spatial structure and human activities. With its development and improvement (Figure 3), it can be used to understand urban spatial structure, evaluate spatial accessibility, predict human activity patterns, and support urban planning decisions [37,38]. In space syntax analysis, the spatial model is imported, the street network is segmented into axes, and spatial elements are coded. Then, indicators for spatial analysis are calculated.
The evaluation methods above mainly concentrate on physical accessibility such as distance, area, and quantitative factors based on models. However, visual perception plays a crucial role during the process of residents traveling to public spaces [39]. For instance, obstructions caused by buildings, layout of greenery, etc., may hinder the visual recognition of public spaces, yet these visual obstacles are scarcely involved in the current evaluation system [40,41]. The visual attractiveness of public spaces themselves is an important factor influencing accessibility. A public space with appealing landscapes, unique architectural styles, or good views will be more attractive to residents.
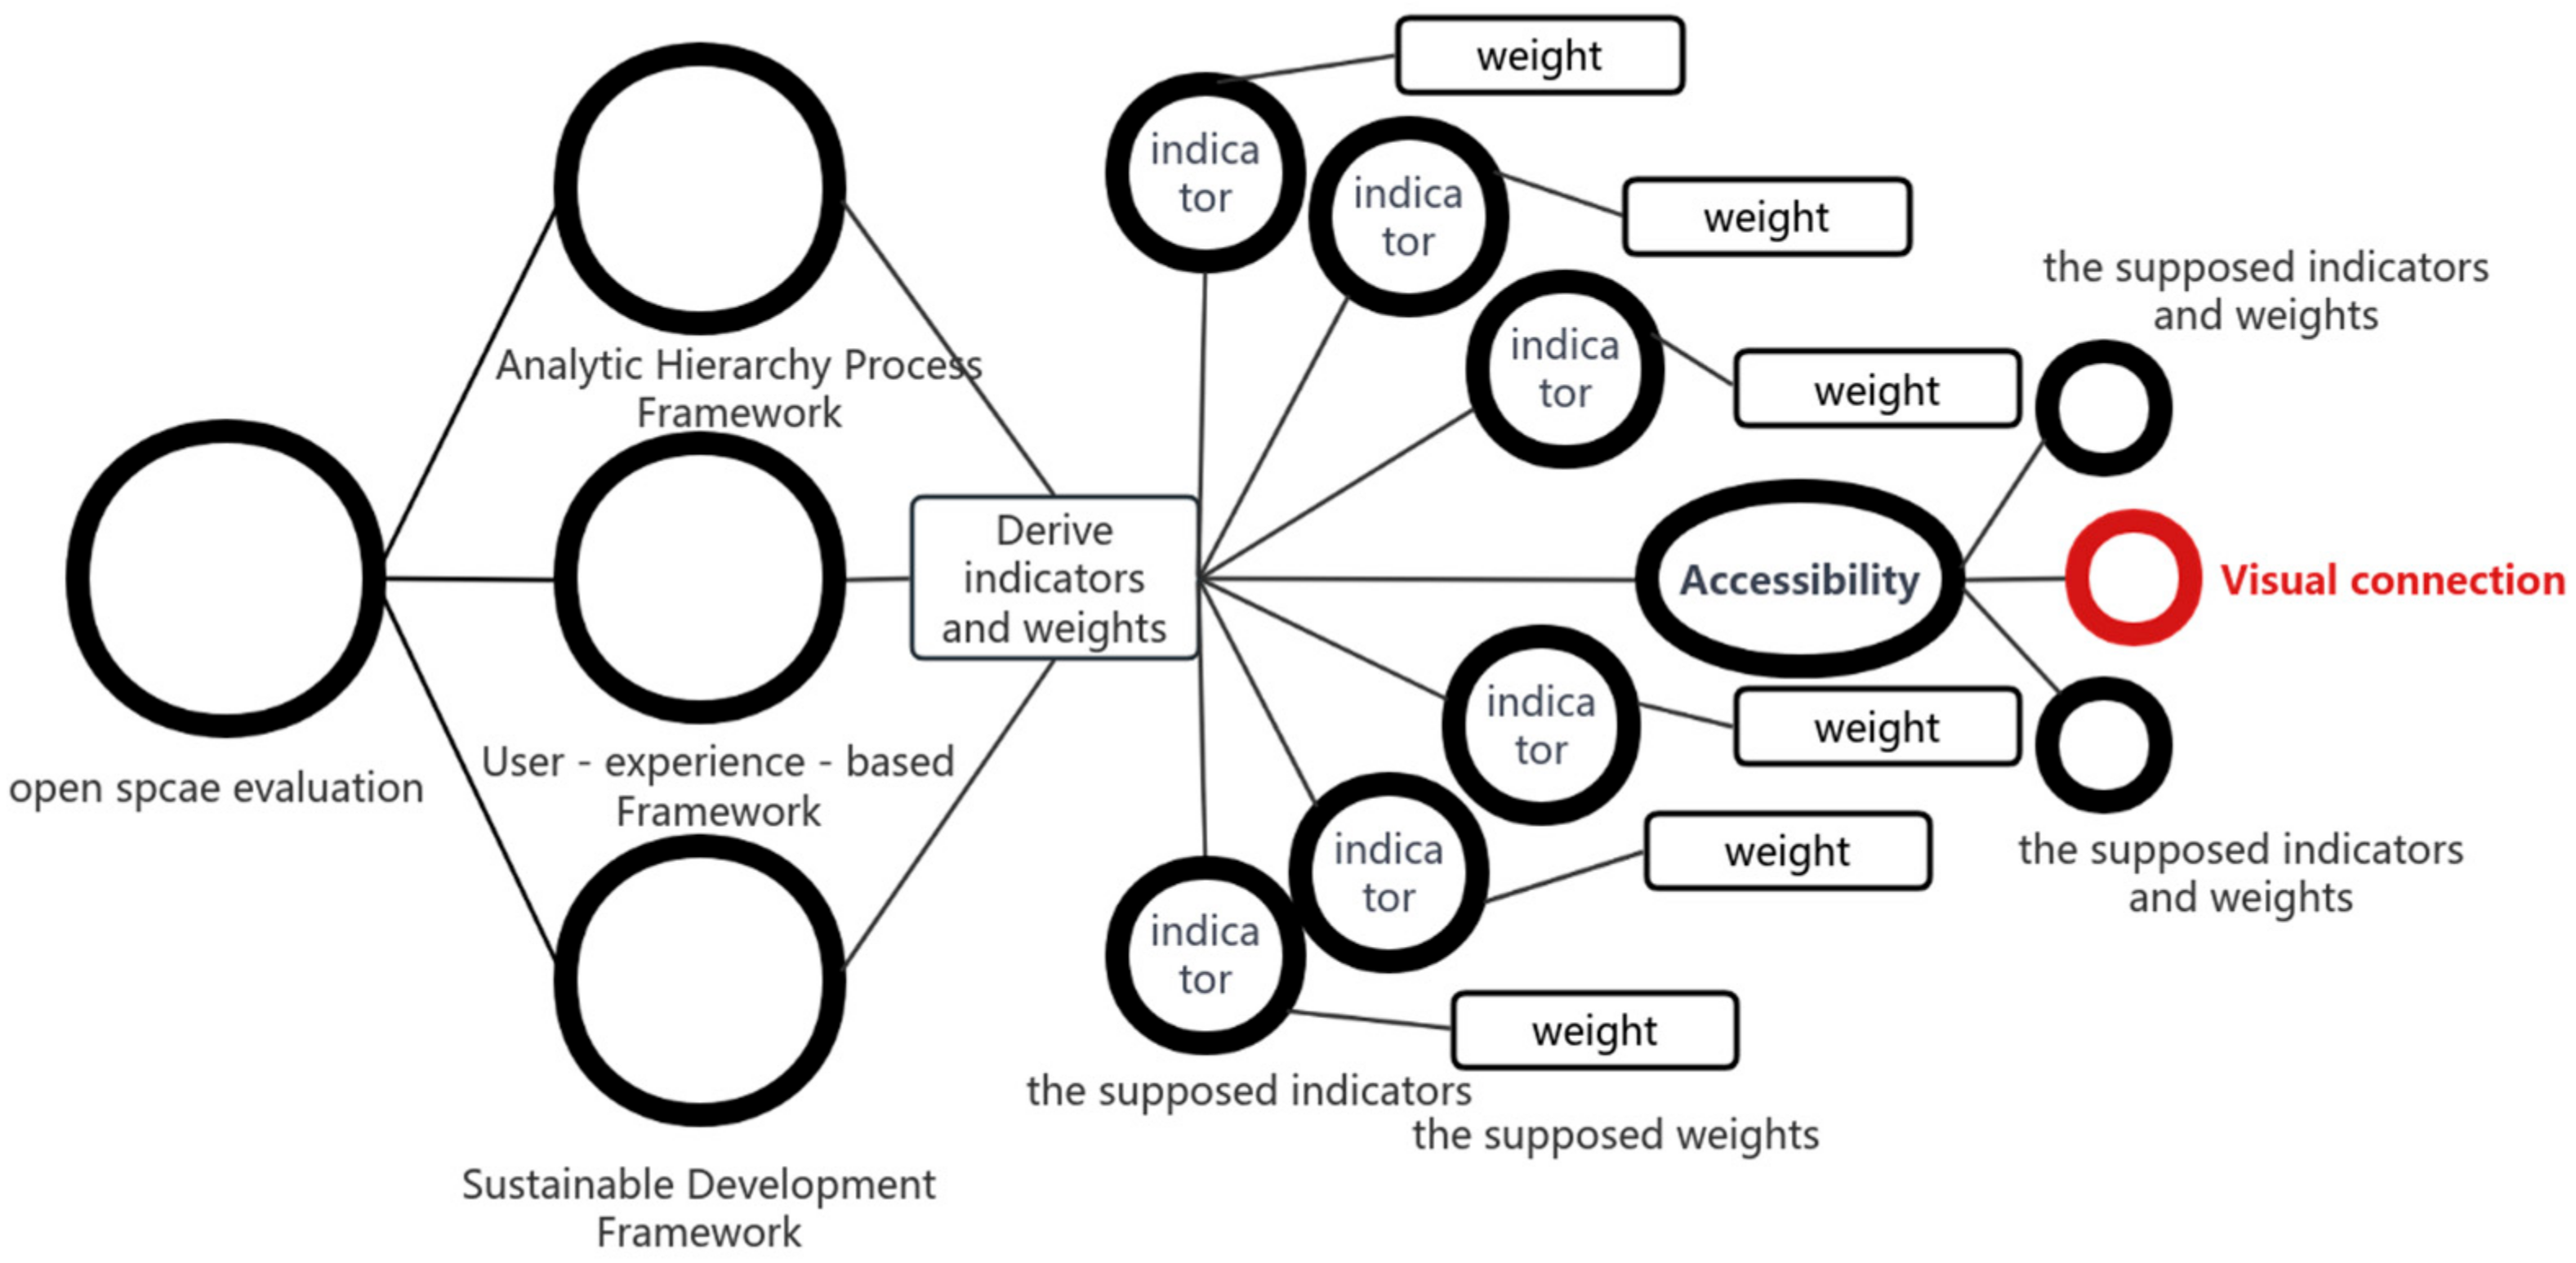
To build a comprehensive framework for evaluating and planning the open space along the Chicago River, a method will be informed by integrating the merits of the Analytic Hierarchy Process (AHP) framework, user experience-based framework and sustainable development framework. In the accessibility part, visual connection will be added to address the research gaps in prior research. Visual Graphic Analysis (VGA), conducted via the DepthmapX software, is utilized to gauge the visual connectivity of the open space. In Depthmap-based VGA, viewpoints are set at regular intervals to comprehensively capture visual information. The software then calculates visual parameters, taking into account factors such as building layouts, greenery coverage, and terrain features. By combining VGA with the existing public space evaluation framework, efforts are made to optimize and improve the evaluation methodology. Figure 4 demonstrates the authors’ exploration of the establishment of the evaluation framework, as well as the establishment of indicators (which may vary for different cities) and weights according to the characteristics of the city. In the indicator of “Accessibility”, vision is introduced to improve the system.
The primary data source for the public spaces and buildings bordering the Chicago River is CAD mapper [42], whose dataset is from OpenStreetMap. The data extracted from CAD Mapper can preliminarily reflect elements such as spatial dimensions and topological relationships (Figure 5). Through systematic data processing and transformation procedure, the figure–ground relationship between the buildings and public spaces can be precisely established. This relationship, which is visually enhanced and represented, not only aids in a more intuitive understanding of the spatial configuration but also lays a solid groundwork for further research exploration and design intervention.
Another significant data source is QGis 3.28 and the dataset utilized is from OpenStreetMap. As a highly advanced and multifunctional geographical information system, QGis presents an abundant and meticulous collection of cartographic data. It contains a wide range of building elements, such as architectural details, spatial divisions, and related attribute information, together with their accurate geographical positions. Through a systematic and accurate screening operation, public facilities, park green spaces, and building areas with public service functions are extracted and depicted on the map. This practice promotes the in-depth exploration and study of potential correlations and linkages among these spatial elements, providing an essential basis for further research and design activities in the associated area. To visually summarize the research process from the initial stages of data collection and method selection to the ultimate design exploration, the following flowchart (Figure 6) presents the key steps. It offers a concise overview of how different aspects of the study are interconnected, facilitating a better understanding of the overall research framework.
The illustration (Figure 7) presented showcases the distribution maps of public facilities and buildings along the Chicago River. It is evident from this visual representation that these establishments exhibit a certain pattern of dispersion and clustering. Through a meticulous examination of their spatial arrangement, it can be inferred that they contribute to the formation of a unique network structure within the given area [42]. This network structure, in turn, has implications for the overall functionality and connectivity of the region.

3. Results

This section presents the spatial analysis results of the riverside open space and, by means of the Visibility Graph Analysis map, demonstrates the concept of vision-led design. During the design exploration, the well-known Las Vegas Strip was selected as a reference. In the mapping of the river and its adjacent open spaces (Figure 8a), the layout of the open spaces in relation to the river (Figure 8b) shows a resemblance to the Las Vegas Strip, which provided inspiration for the design. Through the application of Visibility Graph Analysis, the connectivity degree among the open spaces along the Chicago River is visually presented.

3.1. Surveying the Open Spaces

An analysis of the public spaces and key nodes along the Chicago River was conducted in conjunction with QGis [43]. By mapping, quantifying, and categorizing relevant data, a more detailed map of spatial distributions and connectivities was achieved (Figure 9). This organized information forms a crucial foundation for subsequent in-depth analyses. As shown in Figure 8, the open spaces in the northern part of the river are mainly characterized by non-continuous green areas. Most of the open spaces along the river are factories, some of which are abandoned, and some are still in operation. Such spatial distribution of open spaces provides a reference for further exploring the optimization of the riverside environment and the improvement of public space connectivity.
Taking an overview of the larger area (Figure 7), the points which indicate traffic connections, commercial activities, and public events are densely located in the Loop district, compared to the sparsely distributed north. For clarity, Figure 7 was created and key points were selected. In Figure 10, it is clear that resources in the Main Stem area are more concentrated.
The Depth map is utilized for conducting a visual connectivity analysis. By applying specific analytical techniques and algorithms, the visual accessibility of the public spaces along the Chicago River is determined [44]. The resulting analysis enables the clear identification of areas with visual limitations, such as those obstructed by physical barriers or occluded by other structures [45], as well as areas with good visual conditions. These findings possess reference values for the comprehensive design and planning of the area. They provide crucial guidance in determining the specific locations [46] where visual connections need to be enhanced and optimized, thereby facilitating the creation of a more visually coherent and functionally efficient urban environment.

3.2. Identifying Areas with Low Connectivity

Based on the DepthmapX software, a comprehensive visual computation was conducted on the selected open spaces along the Chicago River (Figure 11). This involved calculating several key visual parameters, namely the visual clustering coefficient, visual control, visual controllability, visual entropy, and visual integration. In Figure 11, areas with significant differences in colors are boxed, and five relatively well-known areas are circled.
The visual clustering coefficient can be construed as a metric for gauging the density of connections within a network or graph [47]. In essence, it aids in discerning the extent of connectivity among nodes within a particular region of a network [48]. As depicted in the map (Figure 11a), the regions with a higher incidence of visual obstructions are denoted by the red areas. These red areas signify areas where the visual clustering coefficient might be affected due to the presence of obstacles that disrupt the smooth flow of visual connections between nodes.
Visual control is defined as the extent to which the visible space from a specific point to other visible points either exceeds or falls short of what is perceived by the observer [49]. In simpler terms, a control point might afford a view of multiple regions, yet each of these regions might appear relatively diminutive in terms of visual expanse. For instance, a vantage point on a high-rise building might offer a panorama of various city blocks, but each block might seem relatively small when observed from that particular point. As shown in the figure (Figure 11b), areas with relatively better visibility tend to be closer to red.
Visual controllability is the antithesis of visual control and is used to identify areas that are susceptible to being visually dominated [50]. Instead of highlighting locations with unobstructed vistas, visual controllability focuses on the visual management of places where individuals can enhance their visibility [51]. As shown in the boxed areas in the figure (Figure 11c), the lighter blue color indicates these areas are more visible. This implies that in areas with high visual controllability, efforts can be made to optimize the visual exposure of certain elements or features within the space to make them more prominent and visible to observers.
Visual entropy pertains to the facility with which one can traverse through a specific depth or layer of a system. Put differently, a low visual entropy indicates a degree of order and predictability within the system [52]. For example, in a well-planned urban park with clearly defined paths and distinct areas, the visual entropy would likely be low. Thus, in areas closer to blue in the figure (Figure 11d), visitors are more likely to be able to anticipate and navigate through them based on the existing layout.
The measure of visual integration computes the visual distance between all spaces in relation to one another [53]. It provides insights into how different spaces are interconnected visually and how easily one can move from one space to another within the visual realm. As shown in the figure (Figure 11e), the closer the color is to red, the higher the degree of visual integration. Thus, in red-dominant areas, more public facilities can be added to maximize the visual advantages.
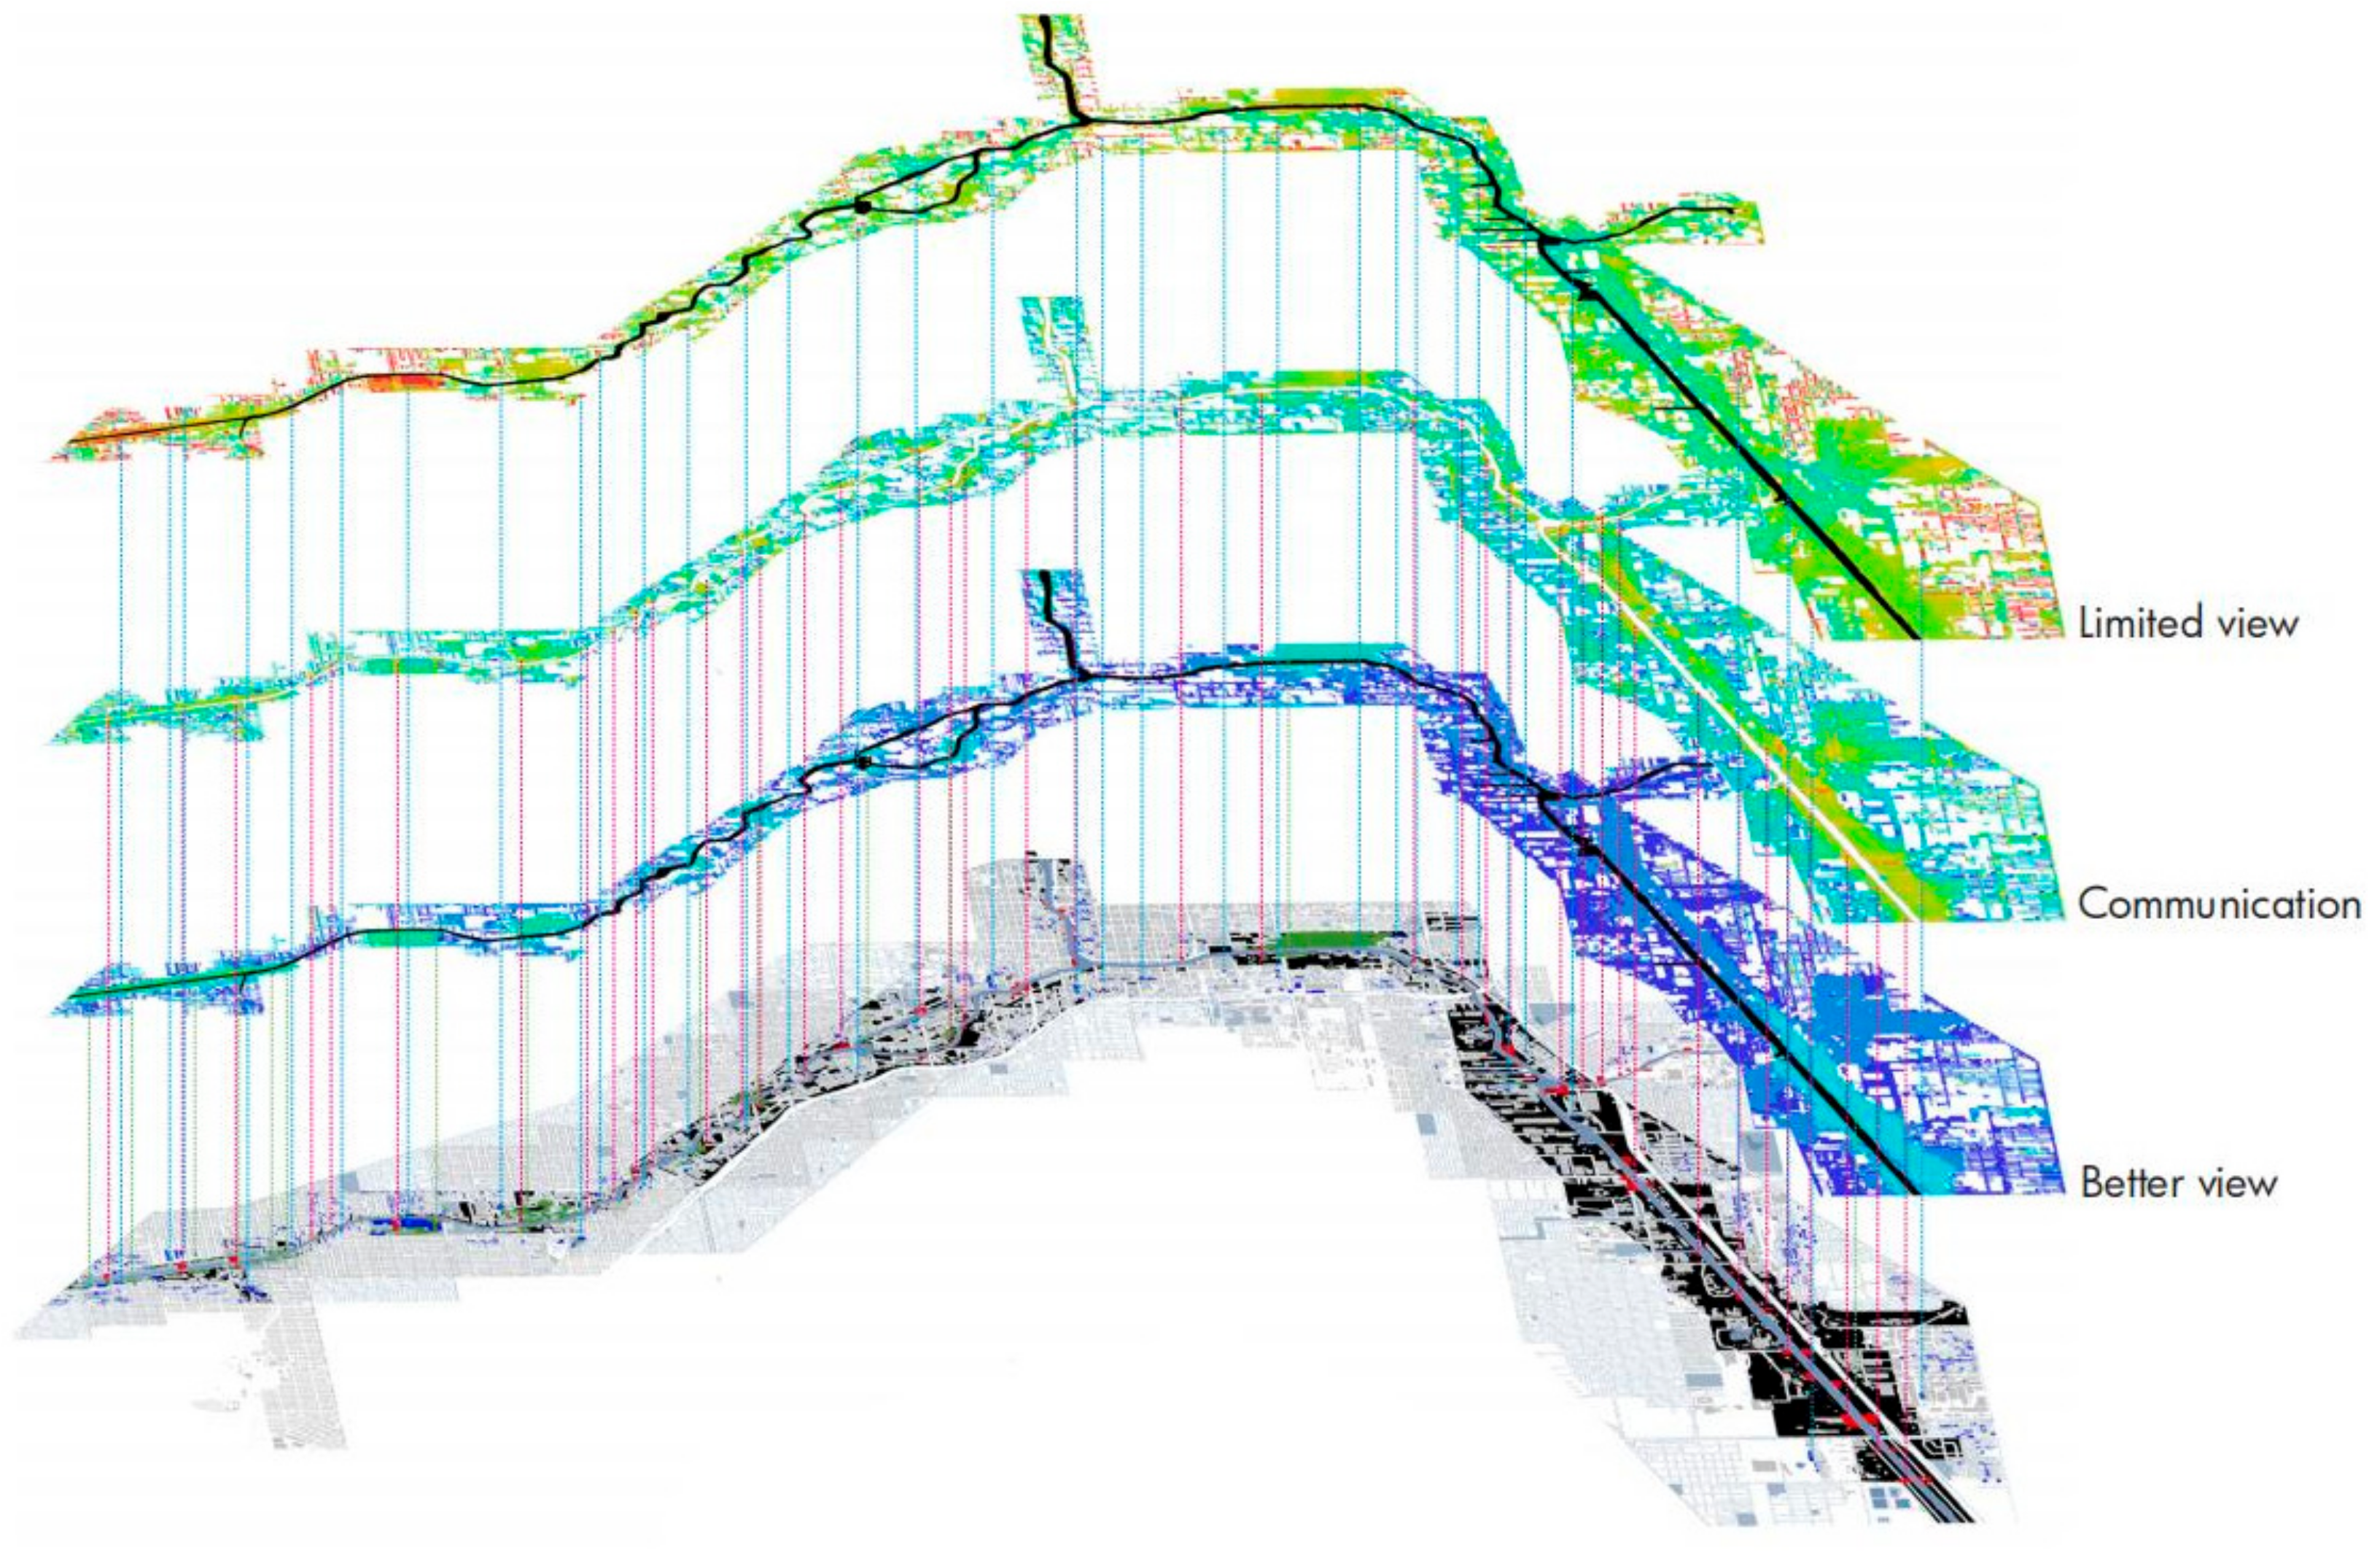
By integrating the aforementioned data, it becomes possible to identify, within the corresponding open spaces as illustrated in the following figure (Figure 12), which areas possess suboptimal views (referred to as “Limited View” in a relative sense, meaning areas where the view might not be as good as expected), which areas are more likely to be visible (termed “Communication” here, indicating areas that are more prominent and easily noticed), and which areas enjoy better views (again, “Better View” but in the context of having a relatively superior visual experience). Ultimately, the superposition of the three upper layers in Figure 12 yields the bottom-most layer in Figure 12, which represents the recommended design intervention points in the design exploration.

3.3. Design Reference: The Las Vegas Strip

As a city that has grown out of the desert, Las Vegas provides an example of how public spaces can be connected through a boulevard to create a unified urban environment [54]. This example can inspire the exploration of the potential of linking the various open spaces along the Chicago River [55]. By simplifying the map and narrowing the focus to the river and its surrounding open public areas, the situation becomes comparable to the Las Vegas Strip. Through studying the Strip, valuable insights can be gained into how to bring together the scattered points along the Chicago River into a cohesive and connected whole.
Waterborne transportation in Chicago plays a crucial role in facilitating mobility between diverse segments of the city [56,57]. Water taxis and water buses present commuters with an alternative to conventional transportation modalities like automobiles, buses, and trains [58]. This assumes particular significance in areas of the city afflicted by congestion where vehicular traffic poses challenges. As per the data furnished by the Chicago Department of Transportation, the water taxi service in Chicago recorded a total ridership of 400,000 passengers in 2018, which was equivalent to the ridership of over 8000 buses and surpassed 200,000 car trips [59]. Tourism also constitutes a significant application of waterborne traffic in Chicago. River excursions and cruises enjoy popularity among tourists, affording a distinct vantage point for appreciating the city’s architecture, history, and culture [60]. Moreover, recreational pursuits such as kayaking, paddleboarding, and fishing are accessible on the city’s waterways, endowing both visitors and residents with prospects for leisure and physical activity [61].
The visual information obtained from VGA (Visual Graphic Analysis) can serve as an important reference for the design and renovation of specific areas. In areas with good views, viewing platforms can be set up to make the most of the scenery. In highly visible areas, signage can be installed to improve communication. For areas with restricted views, where non-permanent obstacles exist, targeted renovations like adjusting the layout, removing removable obstacles, or improving lighting can be carried out. These can be taken as reference elements during the design process to enhance their accessibility and seamless integration into the overall space.

3.4. Design Exploration: To Build a Better Connection

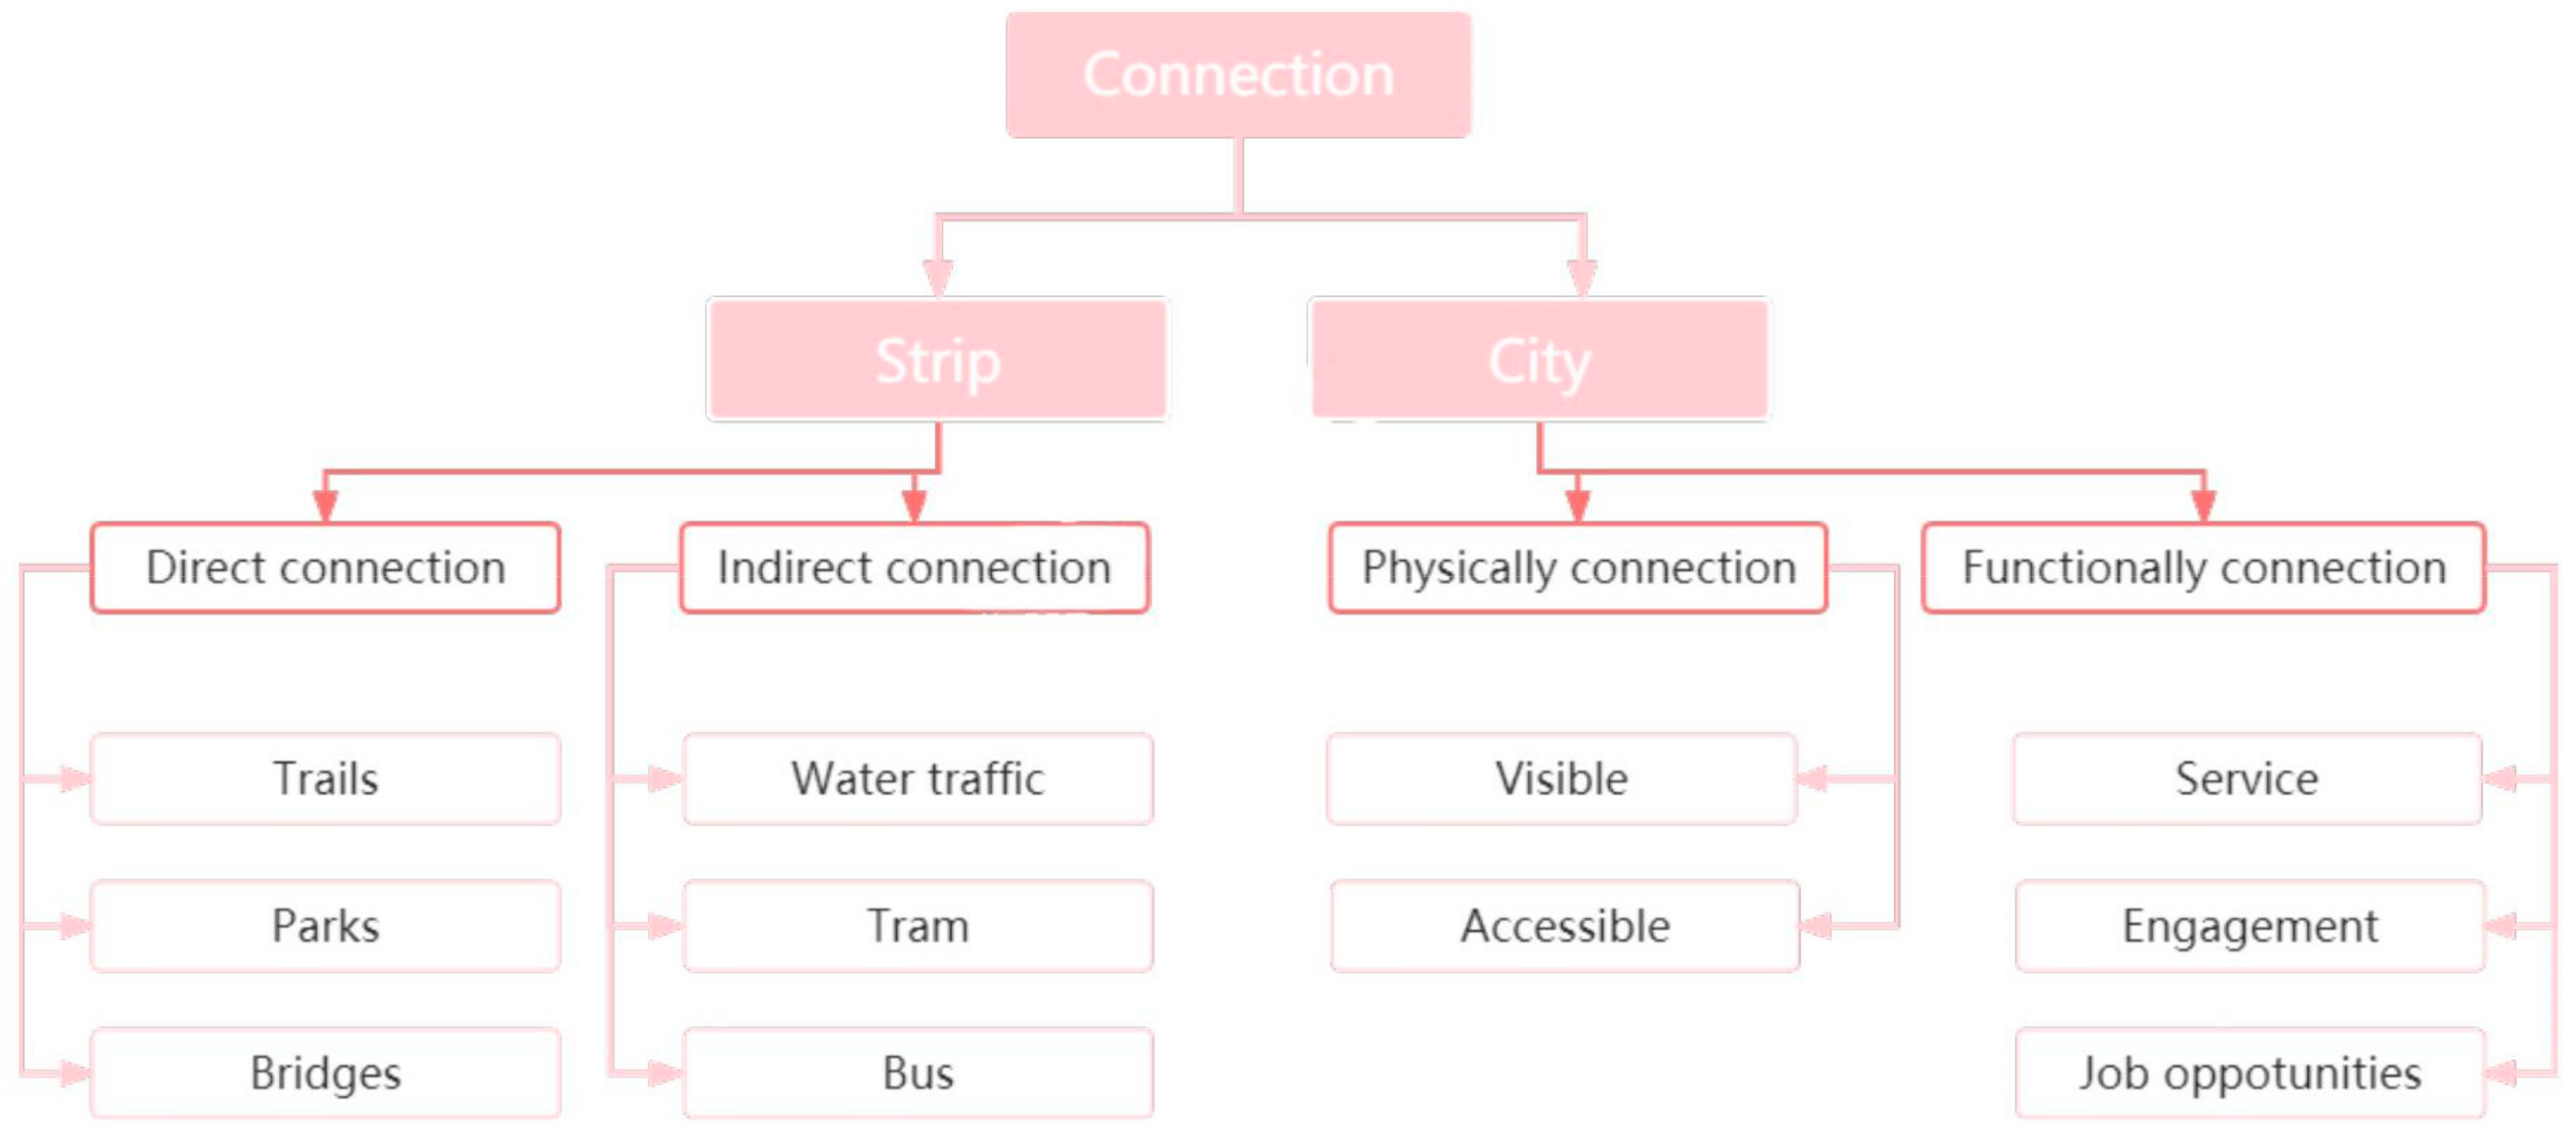
In the overall design concept proposal (Figure 13), consideration is given to the internal connections between the river and the surrounding spaces (forming a “Strip”), as well as the connections between this “Strip” and the city. The improvement of waterborne transportation can enhance the internal connections within the Strip. The figure of Visibility Graph Analysis (Figure 11) can provide reference points for the enhancement and improvement of waterborne transportation. The improvement of water traffic can connect the open space and neighborhood along the Chicago riverbank and is expected to bring economic benefits such as increased tourism and business, which reflects its economic feasibility, as traffic flow models suggest the economic impact of optimized connectivity [62]. It can boost economic development by increasing tourism and business [63] and reduce air pollution and greenhouse gas emissions [64]. By referring to VGA and other factors, water transportation hubs can be set up as needed to form a close connection from the river to the city. Another aspect indicating economic feasibility is that a vibrant riverfront strip can attract investment, raise adjacent property values, and generate more tax revenue for local government reinvestment in riverside public spaces.
Firstly, as is shown in the figure (Figure 14), the establishment of water transportation points along the Chicago River can lead to the formation of a continuous strip. These points, as essential nodes, enhance the riverfront’s spatial continuity and integrity. They create a linear connection, binding different riverbank segments and facilitating efficient movement. This strip also boosts the area’s aesthetic and functional coherence, making it more appealing and user-friendly.
Secondly, via these transportation points, efforts can be made to connect with surrounding public spaces (Figure 15). By linking the hubs with adjacent parks and amenities, an interconnected network of accessible spaces emerges. This connectivity spurs people to explore public spaces, fostering social interaction. It also allows for better integration of land uses and activities, enhancing accessibility in terms of both physical access and function within the urban fabric. Considering VGA and other factors, this benefits the Chicago River area’s economic, environmental, and spatial aspects.
In summary, as shown in the figure of connection proposal (Figure 16), the design exploration seeks to establish linkages between the extant public spaces along the Chicago River and the potential areas for development. Consider creating a closed circuit of recreational trails on a relatively small scale. By making use of the areas with visual advantages as indicated by Visual Graphic Analysis, explicit and lucid guidance can be furnished. Additionally, on a larger scale, it extends outwards from the presently developed public spaces to augment the overall accessibility, thereby generating a continuous and accessible strip. This strip amalgamates assorted elements, endowing the area with enhanced vitality and greater user-friendliness.
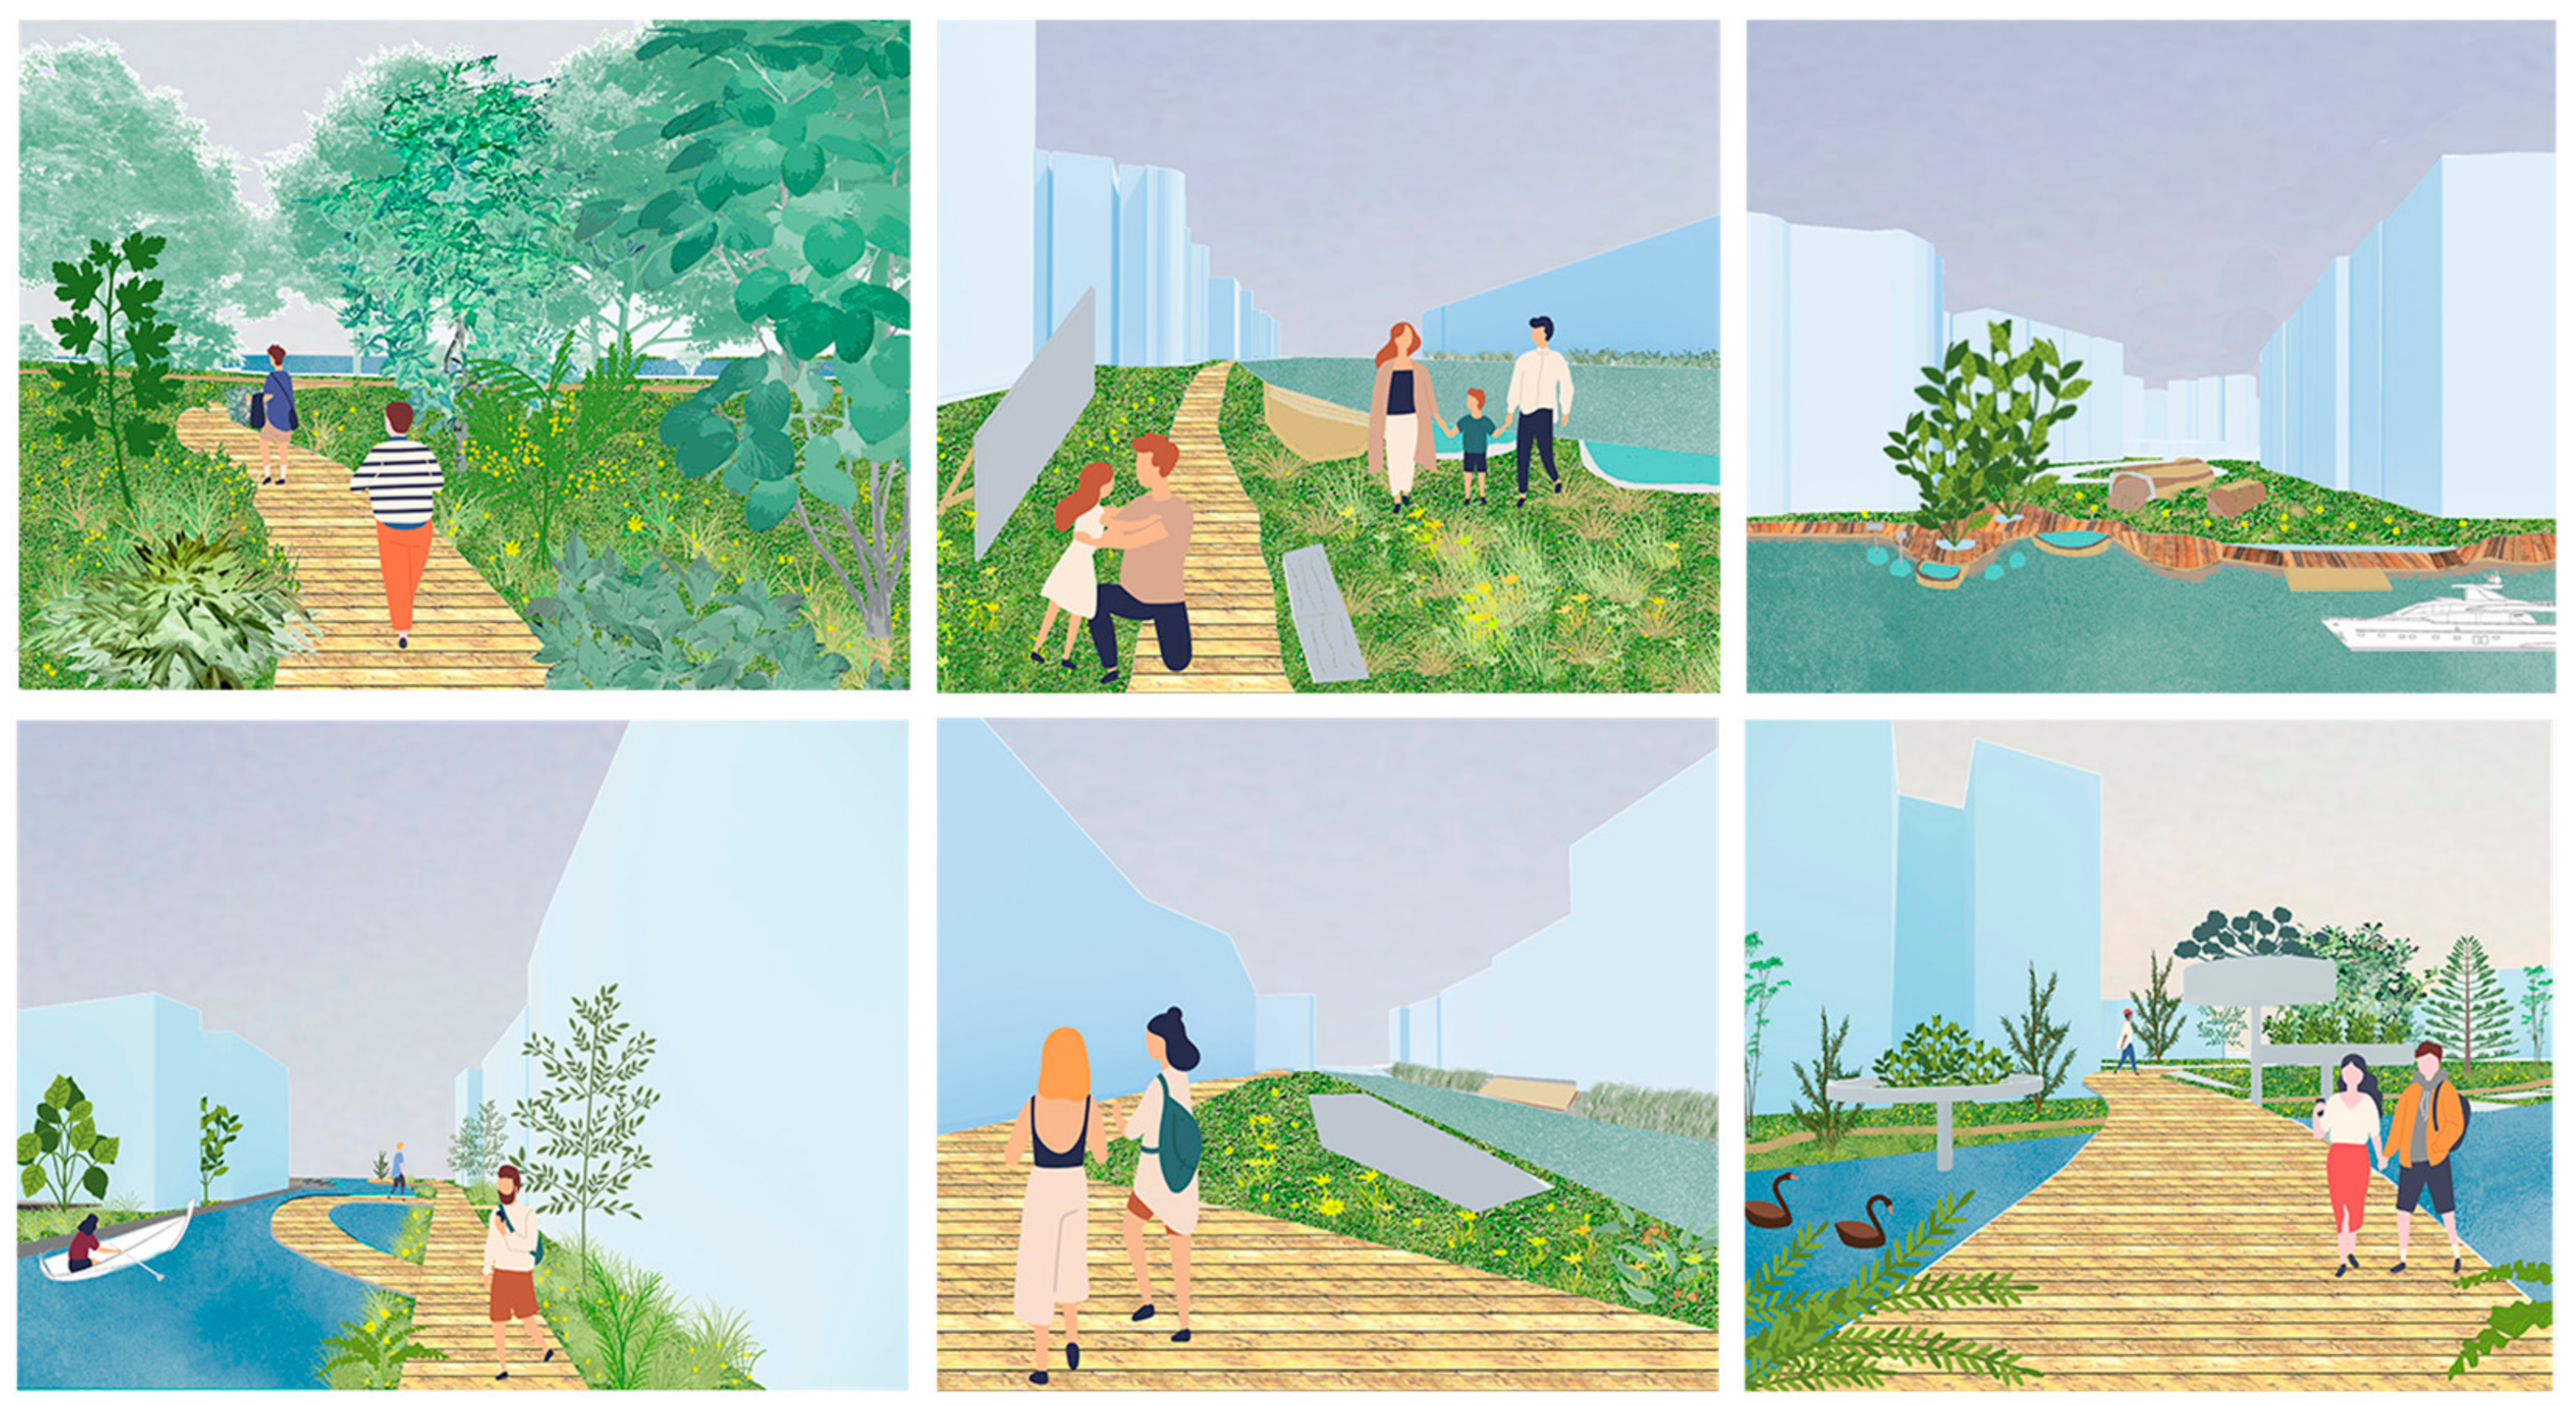
When considering planning, safety and accessibility should be prioritized. According to Giles et al. [65], creating safe and accessible spaces for walking, biking, and other recreational activities can encourage people to use the space, and promote healthy lifestyles. As the collage images (Figure 17) show, the design exploration attempts to make the environment more approachable while connecting spaces. By using VGA to establish path connections, a continuous landscape is created. Furthermore, the strip’s design should consider the unique needs and preferences of different user groups, such as families with children, older adults, and individuals with disabilities [66].
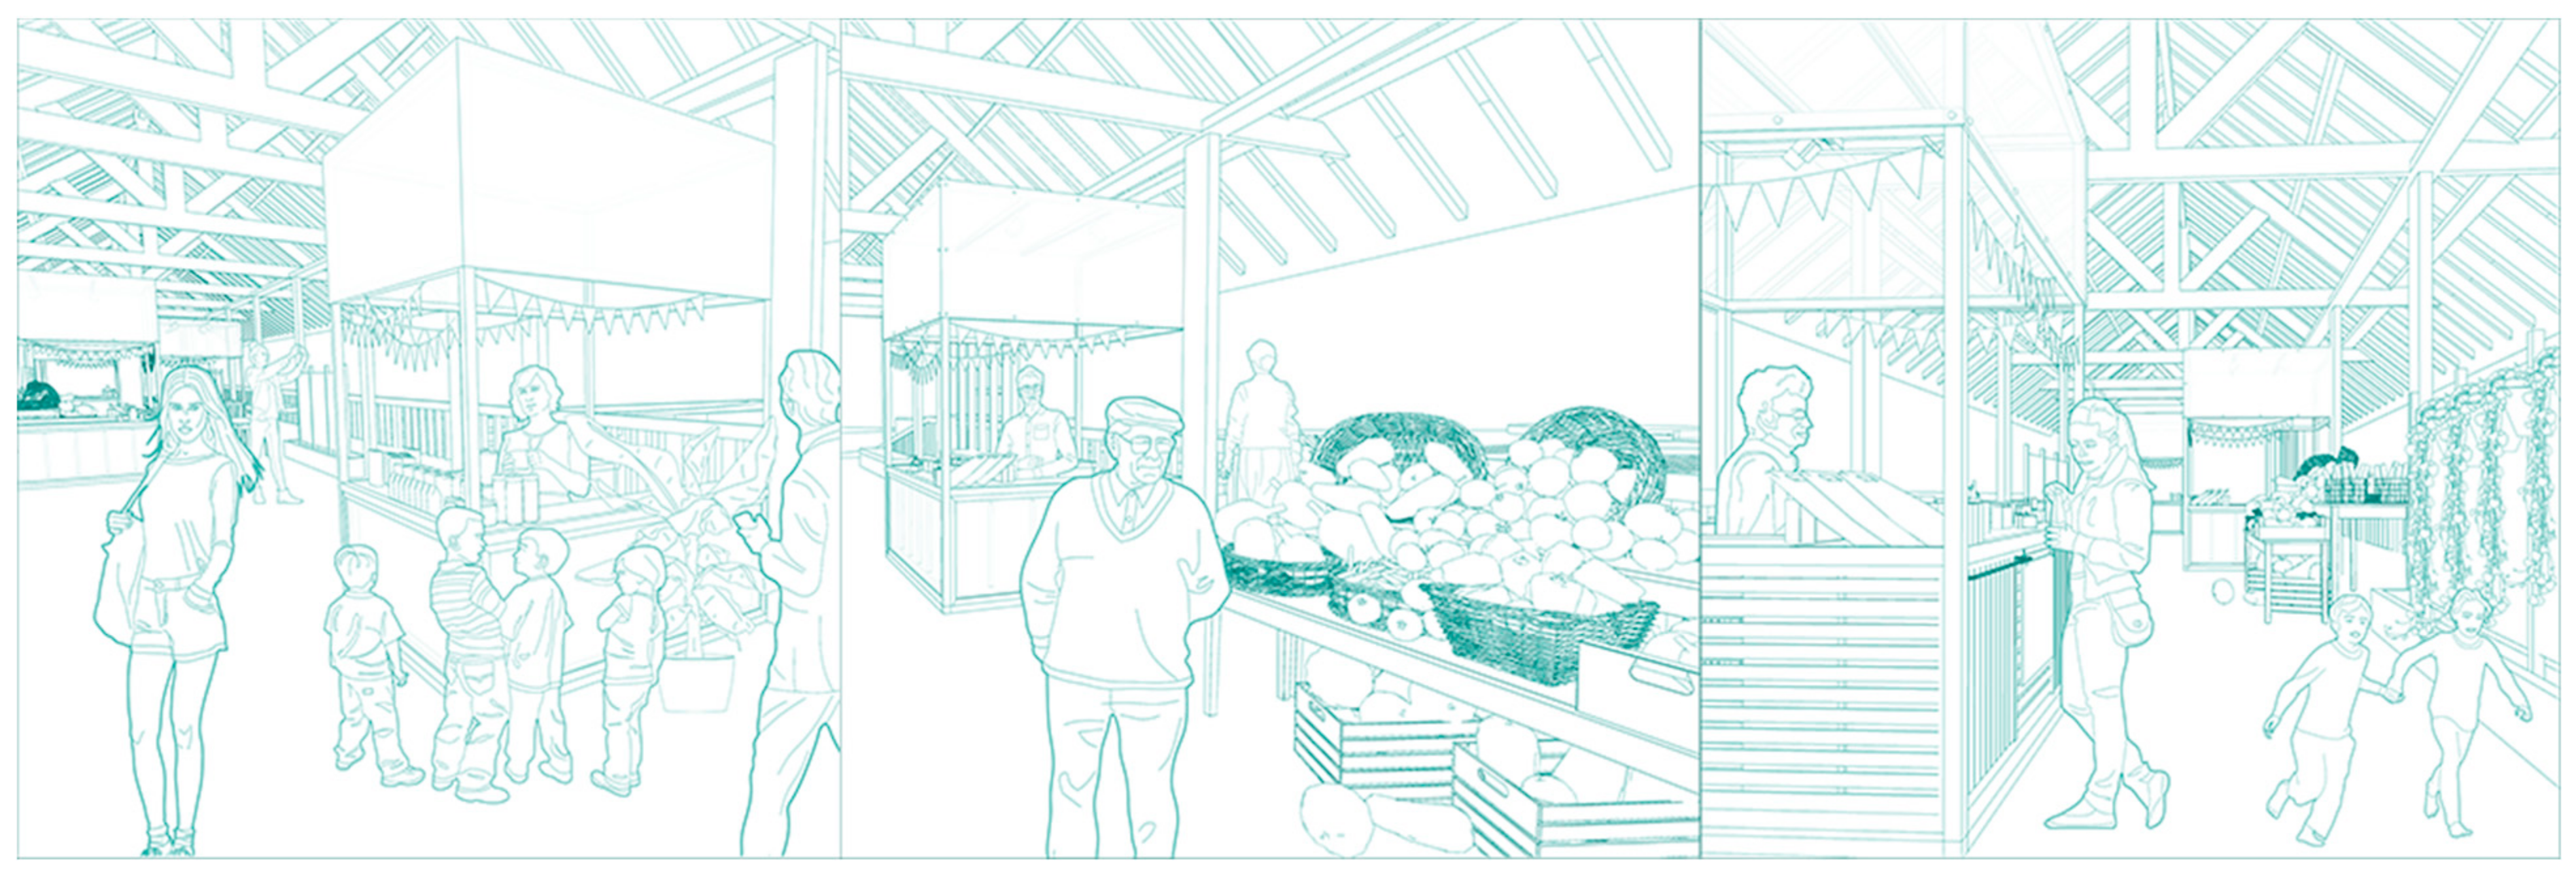
As shown in the following figure (Figure 18), in the design exploration, the consideration of involving the community in the planning process is incorporated. These connected spaces offer sites for community members to carry out social and commercial activities, facilitating communication and local development. According to Purdey et al. [67], community involvement can foster a sense of ownership and pride in the space, resulting in increased use and appreciation of the area.
Furthermore, a vibrant and attractive public space can have positive economic effects, including increased property values, increased tourism, and increased local business activity [68].
Finally, the river has a complex ecosystem that is home to various plant and animal species. Therefore, the design of the strip should prioritize the conservation of the river’s ecosystem and the prevention of pollution and other negative environmental impacts [69].

4. Discussion

4.1. Reflection and Improvement of the Evaluation System

The balance between subjectivity and objectivity is a crucial issue within the evaluation framework [69]. Quantitative data possess the advantage of being intuitive, clearly presenting the values and differences in various indicators and providing a relatively explicit basis for evaluation. However, the selection of these indicators is not static and is subject to numerous dynamic factors. The reasons for choosing specific indicators and how to determine their validity require continuous dynamic updates and revisions to a certain extent [70]. Due to differences in cultural backgrounds, living habits, and social needs, people in different regions have diverse understandings and expectations of public spaces. Similarly, with the passage of time, social development, technological progress, and the transformation of people’s concepts, the emphasis on public space evaluation indicators also changes in different time periods. For example, in the past, people might have been more concerned about the basic functional facilities of public spaces, whereas nowadays, there may be higher demands for aspects such as ecological sustainability, intelligent facilities, and social interaction in the space.
Taking the public spaces along the Chicago River in this study as an example, when analyzing using space syntax-related indicators such as the visual clustering coefficient, visual control, visual controllability, visual entropy, visual integration, and the visual information obtained from VGA (Visibility Graph Analysis), although these indicators can reflect the visual characteristics and connectivity of the space to a certain extent, their limitations and adaptability still need to be considered in practical applications. For instance, in some areas with special cultural or historical significance, some traditional and difficult-to-quantify factors such as local emotional value and historical memory inheritance may not be incorporated into these indicator systems, but they have a profound impact on the spatial experiences of local residents and tourists.
Therefore, according to the actual situation of the local area, using the Analytic Hierarchy Process (AHP) to determine the indicator weights can fully consider the local characteristics and needs, which is one of the important steps in accurately evaluating public spaces in specific regions. Through this method, various factors such as the opinions of local residents, the characteristics of regional development, and the direction of future planning can be integrated, making the evaluation indicator system more in line with the local reality and improving the effectiveness and relevance of the evaluation results. In the process of determining the indicator weights, not only the quantitative results of the data but also qualitative considerations based on the human and social aspects need to be taken into account to construct a more comprehensive and balanced evaluation framework.

4.2. Design Reflection and the Attempt Based on “Research by Design”

This design practice is an exploration based on the concept of “Research by Design”, aiming to embody new design ideas and visual-based open space planning and design. The design practice delves into the relationship between public spaces, cities, and populations, with concomitant and continuous reflection and summarization. From the initial design concept proposal to the progressive development and refinement of the design scheme, considerations of relevant theories [71,72] and actual demands pervade each stage.
In the design implementation phase, certain issues overlooked in the preliminary planning stage have emerged. For instance, regarding the establishment of water transportation points, while theoretically conducive to forming a continuous strip and enhancing accessibility, practical operations may encounter challenges such as water area management regulations, compatibility with existing infrastructure, and the acceptance of increased traffic noise and crowds by surrounding residents. Some spatial layouts prove to be insufficient in convenience and comfort during actual use, and certain design elements face adaptability issues within the local cultural context. These reflections furnish valuable lessons for subsequent design enhancements and stimulate further contemplation on more effectively integrating theoretical research with actual demands and comprehensively considering various factors to augment the design quality and efficacy in future endeavors.
In terms of the overall design strategy, manifold methods have been experimented with to connect the extant public spaces along the Chicago River and potential development spaces. The creation of a closed-loop recreational path on a small scale and the provision of guidance based on visual analysis results is a salutary exploration. Nevertheless, during implementation, it is found that the path continuity may be perturbed by terrain, the layout of existing buildings, and seasonal landscape variations. When expanding public spaces outward to augment overall accessibility, meticulous attention must be paid to the functional linkage with surrounding communities and commercial areas and the potential ecological environmental impacts [73].
Through this attempt based on “Research by Design”, it is anticipated to offer useful references and inspiration for the public space design field, propelling the continuous advancement of research and practice therein. Concurrently, it also offers more profound and extensive thinking directions for subsequent analogous projects in aspects like evaluation system construction, design strategy formulation, and practical operation execution, enabling public space design to better satiate diverse social demands and adapt to the perpetually evolving era backdrop.

5. Conclusions

The research project was directed towards the public spaces adjacent to the Chicago River. Through the utilization of Depthmap, Qgis, and CAD mapper, a methodical and comprehensive evaluation and scrutiny of these public open spaces were carried out. The analysis of the data and the on-site observations have indicated that there are distinct areas within the current construction of public spaces that require further attention and enhancement. For instance, the distribution of amenities, the integration of greenery, and the fluidity of pedestrian and vehicular traffic all present opportunities for optimization.
In the aspect of the evaluation system construction, an in-depth study of the existing mainstream public space evaluation systems was initiated. A comparative analysis was performed to identify the commonalities and differences among them. It was discovered that many of the existing systems had limitations in accurately measuring the visual connection and interaction within the public space. To address this problem, a concept for erecting an evaluation framework was devised, bringing vision into the scope. This framework incorporated advanced techniques for quantifying visual linkages, such as visibility analysis and spatial syntax, which are expected to provide a more accurate and holistic assessment of public spaces.
During the design exploration stage, professional drawing software was employed to create detailed plans of the public areas along the river. Based on the principles of VGA, specific design strategies were formulated. The result was the formation of a continuous strip that not only exhibited enhanced connectivity but also promoted a more engaging and user-friendly environment.

Author Contributions

Methodology, W.L.; Supervision, M.D.M. All authors have read and agreed to the published version of the manuscript.

Funding

This research received no external funding.

Informed Consent Statement

Not applicable.

Data Availability Statement

The original contributions presented in this study are included in the article. Further inquiries can be directed to the corresponding author.

Conflicts of Interest

The authors declare no conflict of interest.

References

  1. Lynch, K. City Sense and City Design: Writings and Projects of Kevin Lynch; MIT Press: Cambridge, MA, USA, 1995. [Google Scholar]
  2. van Ameijde, J.; Ma, C.Y.; Goepel, G.; Kirsten, C.; Wong, J. Data-driven placemaking: Public space canopy design through multi-objective optimisation considering shading, structural and social performance. Front. Archit. Res. 2022, 11, 308–323. [Google Scholar] [CrossRef]
  3. Christoffersen, C.; Ngo, T.; Song, R.; Zhou, Y.; Pichardo, S.; Curiel, L. Suboptimal class DE operation for ultrasound transducer arrays. In Proceedings of the 2018 16th IEEE International New Circuits and Systems Conference (NEWCAS), Montreal, QC, Canada, 24–27 June 2018; IEEE: Piscataway, NJ, USA, 2018; pp. 234–237. [Google Scholar]
  4. Yue, Y.; Yang, D.; Dan, X.; Yuan, J.; Xu, L. Research on the Relationship Between Multidimensional Characteristics of Blue-Green Spaces and Mental Health of Older Adults. China City Plan. Rev. 2023, 32, 53. [Google Scholar]
  5. Maulod, A.; Ravindran, M.; Wong, Y. A Space of Our Own: Reclaiming Public Open Spaces for Self-Expression and Community. Innov. Aging 2024, 8 (Suppl. S1), 7. [Google Scholar] [CrossRef]
  6. Wikantiyoso, R.; Suhartono, T.; Triyosoputri, E.; Sulaksono, A.G. Sustainable urban spatial resilience in improving the quality of livable Green Open Space (GOS). case study: An implementation of Green City Development Program (GCDP) in Malang City Center development area, Indonesia. IOP Conf. Ser. Earth Environ. Sci. 2021, 780, 012025. [Google Scholar] [CrossRef]
  7. Ding, Y.; Ye, X.W.; Su, Y.H. Wind-induced fatigue life prediction of bridge hangers considering the effect of wind direction. Eng. Struct. 2025, 327, 119523. [Google Scholar] [CrossRef]
  8. Ding, Y.; Ye, X.W.; Guo, Y. Copula-based JPDF of wind speed, wind direction, wind angle, and temperature with SHM data. Probabilistic Eng. Mech. 2023, 73, 103483. [Google Scholar] [CrossRef]
  9. Sipahi, S.; Timor, M. The analytic hierarchy process and analytic network process: An overview of applications. Manag. Decis. 2010, 48, 775–808. [Google Scholar] [CrossRef]
  10. Saaty, T.L. The analytic hierarchy process (AHP). J. Oper. Res. Soc. 1980, 41, 1073–1076. [Google Scholar]
  11. Bakri, M.; Kasim, A.A.; Achsan, A.C.; Maddiu, M.A.A.G.D. Determining the Location of Public Green Open Space in Kota Palu Using Analytical Hierarchy Process with Map Overlay (AHP-MOV). IOP Conf. Ser. Earth Environ. Sci. 2023, 1157, 012045. [Google Scholar] [CrossRef]
  12. Shi, J.R.; Zhao, X.M.; Ge, J.; Hokao, K.; Wang, Z. Identifying Public Preferences for the Value of Daily Used Open Spaces Using the Analytic Hierarchy Process—A Cese Study of Hangzhou City, China. Lowl. Technol. Int. Off. J. Int. Assoc. Lowl. Technol. (IALT)/Inst. Lowl. Technol. Saga Univ. 2006, 8, 40–53. [Google Scholar]
  13. Nugraha, A.L.; Awaluddin, M.; Sukmono, A.; Bashit, N.; Wahyuddin, Y.; Nugraha, P.O. Environmental vulnerability assessment based on open green space mapping with AHP and GIS in East Semarang sub-district. In AIP Conference Proceedings; AIP Publishing: Melville, NY, USA, 2023; Volume 2722. [Google Scholar]
  14. Wang, Y.G.; Yang, H.Z. AHP—Based Quantitative Research Methods for Inclusiveness of Urban Open Spaces. Huazhong Archit. 2022, 4, 51–55. [Google Scholar] [CrossRef]
  15. Ai, C.A.; Feng, F.D.; Li, J.; Liu, K.X. AHP Method of Subjective Group Decision—Making Based on Interval Number Judgment Matrix and Fuzzy Clustering Analysis. Stat. Decis. 2019, 35, 39–43. [Google Scholar] [CrossRef]
  16. Jantzen, C. Experiencing and experiences: A psychological framework. In Handbook on the Experience Economy; Edward Elgar Publishing: Cheltenham, UK, 2013; pp. 146–170. [Google Scholar]
  17. Zarour, M.; Alharbi, M. User experience framework that combines aspects, dimensions, and measurement methods. Cogent Eng. 2017, 4, 1421006. [Google Scholar] [CrossRef]
  18. Hussain, J.; Hassan, A.U.; Bilal, H.S.M.; Ali, R.; Afzal, M.; Hussain, S.; Bang, J.; Banos, O.; Lee, S. Model-based adaptive user interface based on context and user experience evaluation. J. Multimodal User Interfaces 2018, 12, 1–16. [Google Scholar] [CrossRef]
  19. Marcus, A.; Wang, W. (Eds.) Design, User Experience, and Usability: Theory, Methodology, and Management, Proceedings of the 6th International Conference, DUXU 2017, Held as Part of HCI International 2017, Vancouver, BC, Canada, 9–14 July 2017; Proceedings, Part I; Springer: Berlin/Heidelberg, Germany, 2017; Volume 10288. [Google Scholar]
  20. Singh, V. Environment, Development, and Sustainability. In Textbook of Environment and Ecology; Springer Nature: Singapore, 2024; pp. 327–339. [Google Scholar]
  21. Sen, A.; Brundtland, G.H.; Johnson, I. Sustainable Development. New Perspect. Q. 2002, 4, 78–83. [Google Scholar] [CrossRef]
  22. Salzmann, J.A. The Creative Destruction of the Chicago River Harbor: Spatial and Environmental Dimensions of Industrial Capitalism, 1881–1909. Enterp. Soc. 2012, 13, 235–275. [Google Scholar] [CrossRef]
  23. Kron, I.B. A Tale of Two Rivers: Zoning Policy Conflict and the Production of Public Space on the Chicago River. Bachelor’s Thesis, University of Chicago, Chicago, IL, USA, 2023. [Google Scholar]
  24. Koval, J.P. The New Chicago: A Social and Cultural Analysis; Temple University Press: Philadelphia, PA, USA, 2006. [Google Scholar]
  25. Neal, Z.P. From central places to network bases: A transition in the US urban hierarchy, 1900–2000. City Community 2011, 10, 49–75. [Google Scholar] [CrossRef]
  26. Holth, N. Chicago’s Bridges; Bloomsbury Publishing: London, UK, 2013; Volume 673. [Google Scholar]
  27. Talbot, E.H. Talbot’s Industry and Railroad Map of Chicago; Type: Cartographic. Format: Scale [ca. 1:25,000]. 2 1/2 in. to 1 mi., 1 map on 2 sheets: Col.; 206 × 117 cm., sheets 106 × 124 cm. Coverage: United States—Illinois—Chicago; E.H. Talbot: Chicago, IL, USA, 1904. [Google Scholar]
  28. Chicago Riverwalk. (n.d.) Sasaki. Available online: https://www.sasaki.com/projects/chicago-riverwalk/ (accessed on 11 November 2024).
  29. Ping Tom Park|Chicago Architecture and Landscape Design. (n.d.) Available online: https://www.site-design.com/projects/ping-tom-park/ (accessed on 11 November 2024).
  30. Rahman, K.A.; Zhang, D. Analyzing the level of accessibility of public urban green spaces to different socially vulnerable groups of people. Sustainability 2018, 10, 3917. [Google Scholar] [CrossRef]
  31. Kumar, P.; Sharma, L.; Sharma, N.C. Sustainable Development Balancing Economic Viability, Environmental Protection, and Social Equity. In Sustainable Partnership and Investment Strategies for Startups and SMEs; IGI Global: Hershey, PA, USA, 2024; pp. 212–234. [Google Scholar]
  32. Guagliardo, M.F. Spatial accessibility of primary care: Concepts, methods and challenges. Int. J. Health Geogr. 2004, 3, 1–13. [Google Scholar] [CrossRef]
  33. Lubis, A.R.; Lubis, M. Optimization of distance formula in K-Nearest Neighbor method. Bull. Electr. Eng. Inform. 2020, 9, 326–338. [Google Scholar] [CrossRef]
  34. Kelobonye, K.; Zhou, H.; McCarney, G.; Xia, J. Measuring the accessibility and spatial equity of urban services under competition using the cumulative opportunities measure. J. Transp. Geogr. 2020, 85, 102706. [Google Scholar] [CrossRef]
  35. Roy, J.R.; Thill, J.C. Spatial interaction modelling. Pap. Reg. Sci. 2004, 83, 339–361. [Google Scholar] [CrossRef]
  36. Yang, X.C.; Zhou, X.L.; Wan, C. Research Framework for the Comprehensive Evaluation of Urban Public Open Space Accessibility. In Proceedings of the 2013 Annual Conference of China Urban Planning (02—Urban Design and Detailed Planning), Qingdao, China, 4–5 September 2013. [Google Scholar]
  37. Griffiths, S. The use of space syntax in historical research: Current practice and future possibilities. In Proceedings of the Eighth International Space Syntax Symposium 2012, Santiago, Chile, 3–6 January 2012; Volume 8, pp. 1–26. [Google Scholar]
  38. Askarizad, R.; Lamíquiz Daudén, P.J.; Garau, C. The Application of Space Syntax to Enhance Sociability in Public Urban Spaces: A Systematic Review. ISPRS Int. J. Geo-Inf. 2024, 13, 227. [Google Scholar] [CrossRef]
  39. Shach-Pinsly, D. Visual openness and visual exposure analysis models used as evaluation tools during the urban design development process. J. Urban. 2010, 3, 161–184. [Google Scholar] [CrossRef]
  40. Kong, S.G.; Heo, J.; Abidi, B.R.; Paik, J.; Abidi, M.A. Recent advances in visual and infrared face recognition—A review. Comput. Vis. Image Underst. 2005, 97, 103–135. [Google Scholar] [CrossRef]
  41. Shach-Pinsly, D.; Fisher-Gewirtzman, D.; Burt, M. Visual exposure and visual openness: An integrated approach and comparative evaluation. J. Urban Des. 2011, 16, 233–256. [Google Scholar] [CrossRef]
  42. CADMAPPER. (n.d.) Worldwide Map Files for Any Design Program|CADMAPPER. Available online: https://cadmapper.com/ (accessed on 23 March 2023).
  43. Bani-Taha, O.I.; Shafiq, M.O. Combining the richness of GIS techniques with visualisation tools to better understand the spatial distribution of data—A case study of Chicago City crime analysis. Int. J. Big Data Intell. 2020, 7, 29–46. [Google Scholar]
  44. Zhu, B.; Liu, G.; Xia, H.; Zhang, L. Ancientdepthnet: An Unsupervised Framework for Depth Estimation of Ancient Architecture. In Proceedings of the 31st International Scientific and Practical Conference “Methodological Aspects of Education: Achievements and Prospects”, Rotterdam, The Netherlands, 6–9 August 2024; International Science Group: New York, NY, USA, 2024. [Google Scholar]
  45. Taniguchi, K.; Kubota, S.; Yasumuro, Y. Quantitative visualization of physical barriers for vulnerable pedestrians based on photogrammetry. Constr. Innov. 2022, 22, 604–623. [Google Scholar] [CrossRef]
  46. Wang, M.; Liu, J.; Zhang, S.; Zhu, H.; Zhang, X. Spatial pattern and micro-location rules of tourism businesses in historic towns: A case study of Pingyao, China. J. Destin. Mark. Manag. 2022, 25, 100721. [Google Scholar] [CrossRef]
  47. Peng, D.; Gui, Z.; Wang, D.; Ma, Y.; Huang, Z.; Zhou, Y.; Wu, H. Clustering by measuring local direction centrality for data with heterogeneous density and weak connectivity. Nat. Commun. 2022, 13, 5455. [Google Scholar] [CrossRef]
  48. El Samaty, H.S.; Feidi, J.Z.; Refaat, A.M. The impact of glazed barriers on the visual and functional performance of transition spaces in college buildings using space syntax. Ain Shams Eng. J. 2023, 14, 102119. [Google Scholar] [CrossRef]
  49. Liu, H.R.; Li, M.X.; Zhou, W.X. Visibility graph analysis of the grains and oilseeds indices. Phys. A Stat. Mech. Its Appl. 2024, 650, 130004. [Google Scholar] [CrossRef]
  50. Sailer, K.; Koutsolampros, P. Space Syntax Theory: Understanding human movement, co-presence and encounters in relation to the spatial structure of workplaces. In A Handbook of Theories on Designing Alignment Between People and the Office Environment; Routledge: London, UK, 2021; pp. 248–260. [Google Scholar]
  51. Ekinsmyth, C.J. Learning About the Urban Environment: A Case Study of Newcomers to Leicester. Ph.D. Thesis, University of Leicester, Leicester, UK, 1988. [Google Scholar]
  52. Koutsolampros, P.; Sailer, K.; Varoudis, T.; Haslem, R. Dissecting Visibility Graph Analysis: The metrics and their role in understanding workplace human behaviour. In Proceedings of the 12th International Space Syntax Symposium, International Space Syntax Symposium, Beijing, China, 8–13 July 2019; Volume 12. [Google Scholar]
  53. Bullier, J. Integrated model of visual processing. Brain Res. Rev. 2001, 36, 96–107. [Google Scholar] [CrossRef] [PubMed]
  54. Al, S.J. The Strip: Las Vegas and the Symbolic Destruction of Spectacle. Ph.D. Thesis, UC Berkeley, Berkeley, CA, USA, 2010. [Google Scholar]
  55. Goggin, J. Opening shots and loose slots: Adapting Las Vegas. Screen 2015, 56, 245–252. [Google Scholar] [CrossRef]
  56. Khisty, C.J. Waterway traffic analysis of the Chicago River and lock. Marit. Policy Manag. 1996, 23, 261–270. [Google Scholar] [CrossRef]
  57. Appennini, R. Study for the Electrification of Naval Transport System: Case Study: Venice Water Taxis. Master’s Thesis, Politecnico di Milano, Milan, Italy, 2021. [Google Scholar]
  58. Asenime, C.O. A Study of Inland Waterway Transportation in Metropolitan Lagos. Doctoral Dissertation, University of Lagos, Lagos, Nigeria, 2008. [Google Scholar]
  59. Chicago Water Taxi. In 2018, Chicago Water Taxi Took over 400,000 Passengers, Replacing over 8,000 Buses and over 200,000 Car Trips. Chicago Water Taxi. 2018. Available online: https://www.chicagowatertaxi.com/about-us/#:~:text=In%202018%2C%20Chicago%20Water%20Taxi%20took%20over%20400%2C000,over%208%2C000%20buses%20and%20over%20200%2C000%20car%20trips (accessed on 23 March 2023).
  60. Schwieterman, J.P.; Field, S.; Fischer, L.; Pizzano, A. An Analysis of the Economic Effects of Terminating Operations at the Chicago River Controlling Works and O’Brien Locks on the Chicago Area Waterway System. Ph.D. Thesis, DePaul University, Chicago, IL, USA, 2010. [Google Scholar]
  61. Simpson, D.; Kanich, C.; Yang-Clayton, K. Chicago’s Next Ward Map Can Change a Neighborhood’s Fate. Let the People Draw the Lines. Available online: https://greatcities.uic.edu/2021/04/05/op-ed-chicagos-next-ward-map-can-change-a-neighborhoods-fate-let-the-people-draw-the-lines/ (accessed on 23 March 2023).
  62. Zeng, J.; Qian, Y.; Yin, F.; Zhu, L.; Xu, D. A multi-value cellular automata model for multi-lane traffic flow under lagrange coordinate. In Computational and Mathematical Organization Theory; Springer: Berlin/Heidelberg, Germany, 2022; pp. 1–15. [Google Scholar]
  63. Fauzi, A.; Ariyani, N. From Traditional to Thriving: Predicting Rural Tourism Sustainability in Water Based Tourism of Kedung Ombo, Indonesia Using Bayesian Networks. In Proceedings of the 2024 International Conference on Economics, Management, Education & Law, Barcelona, Spain, 24–26 April 2024. [Google Scholar]
  64. Zhang, J.; Zhang, S.; Wang, Y.; Bao, S.; Yang, D.; Xu, H.; Wu, R.; Wang, R.; Yan, M.; Wu, Y.; et al. Air quality improvement via modal shift: Assessment of rail-water-port integrated system planning in Shenzhen, China. Sci. Total Environ. 2021, 791, 148158. [Google Scholar] [CrossRef]
  65. Giles-Corti, B.; Vernez-Moudon, A.; Reis, R.; Turrell, G.; Dannenberg, A.L.; Badland, H.; Foster, S.; Lowe, M.; Sallis, J.F.; Stevenson, M.; et al. City planning and population health: A global challenge. Lancet 2016, 388, 2912–2924. [Google Scholar] [CrossRef]
  66. Harrell, R.; Lynott, J.; Guzman, S.; Lampkin, C. What Is Livable? Community Preferences of Older Adults; American Association of Retired Persons (AARP) Public Policy Institute: Washington, DC, USA, 2014. [Google Scholar]
  67. Purdey, A.F.; Bahadur Adhikari, G.; Robinson, S.A.; Cox, P.W. Participatory health development in rural Nepal: Clarifying the process of community empowerment. Health Educ. Q. 1994, 21, 329–343. [Google Scholar] [CrossRef]
  68. Shaw, G.; Williams, A.M. Entrepreneurship, small business culture and tourism development. In The Economic Geography of the Tourism Industry; Psychology Press: London, UK; New York, NY, USA, 1998; pp. 235–255. [Google Scholar]
  69. Spencer, L.; Ritchie, J.; Lewis, J.; Dillon, L. Quality in Qualitative Evaluation: A Framework for Assessing Research Evidence; Government Chief Social Researcher’s Office: London, UK, 2003.
  70. Russo, R.d.F.S.M.; Camanho, R. Criteria in AHP: A systematic review of literature. Procedia Comput. Sci. 2015, 55, 1123–1132. [Google Scholar] [CrossRef]
  71. Schmidt, S.; Németh, J. Space, place and the city: Emerging research on public space design and planning. J. Urban Des. 2010, 15, 453–457. [Google Scholar] [CrossRef]
  72. Cattell, V.; Dines, N.; Gesler, W.; Curtis, S. Mingling, observing, and lingering: Everyday public spaces and their implications for well-being and social relations. Health Place 2008, 14, 544–561. [Google Scholar] [CrossRef]
  73. River Ecology—River Ecology and Wildlife—About the River—Friends of the Chicago River. 2024. Available online: https://www.chicagoriver.org/about%EF%BF%BEthe-river/river-ecology-and-wildlife/river-ecology (accessed on 23 March 2023).
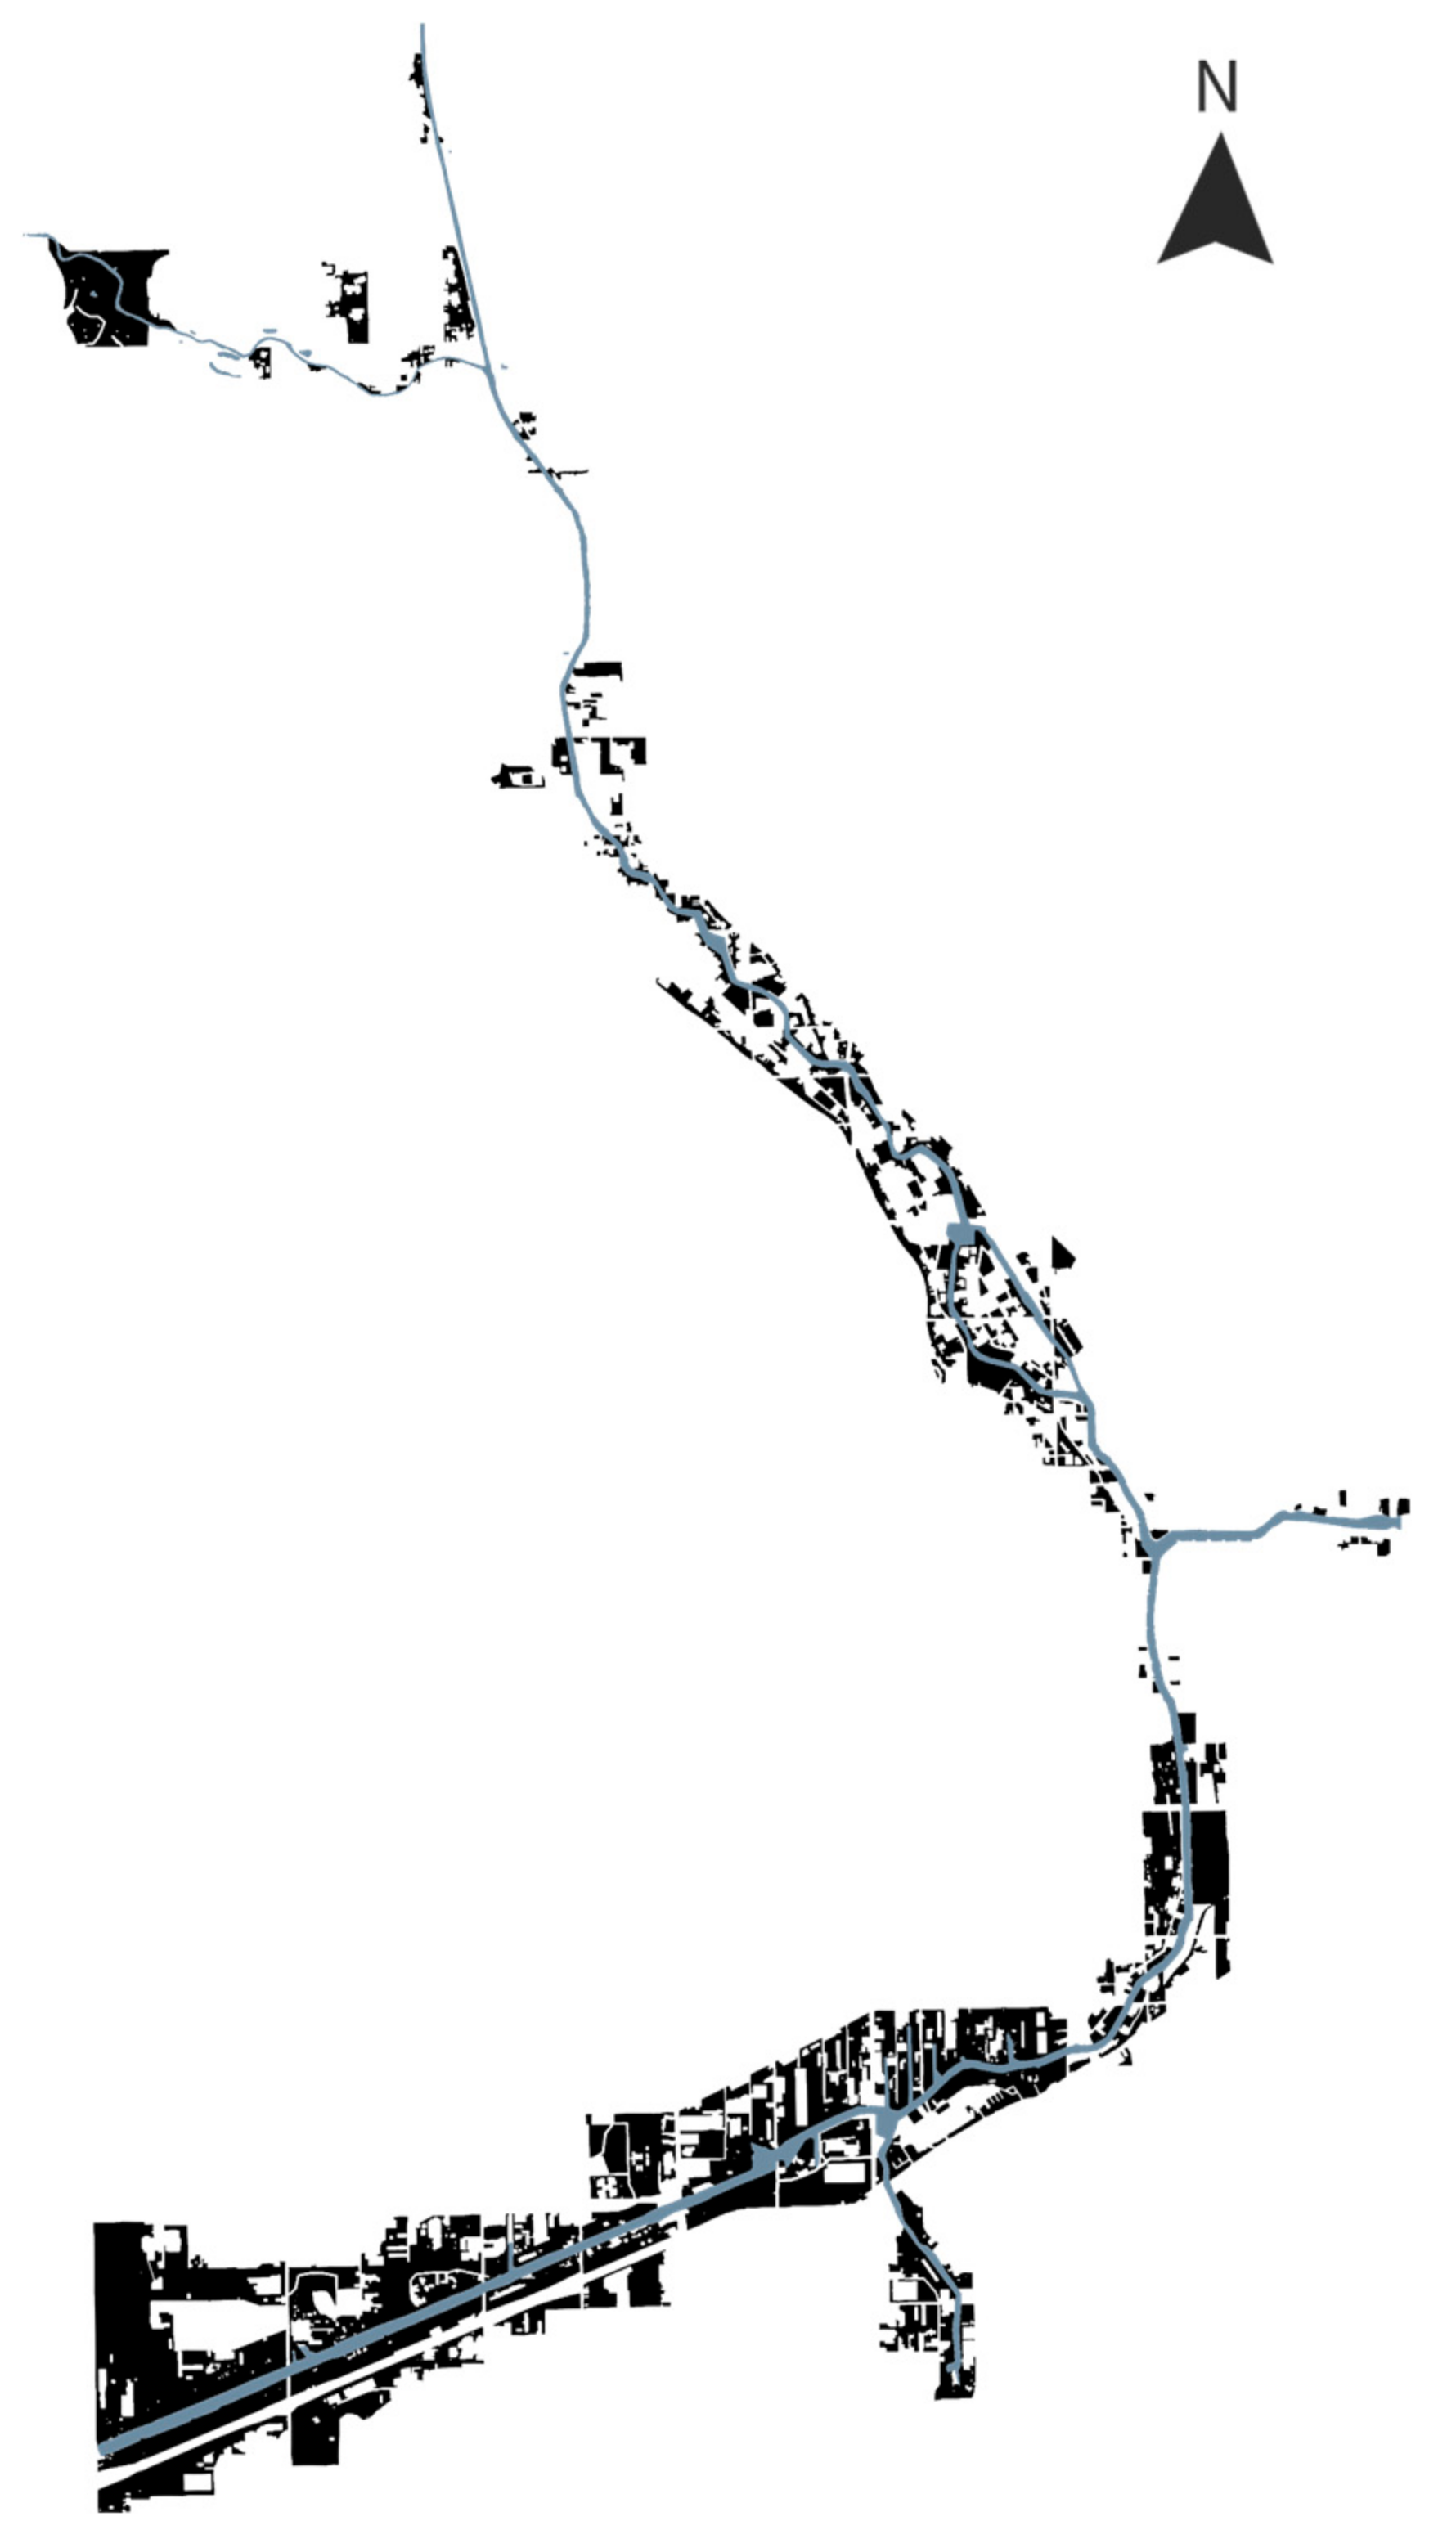
Figure 1. Open space along the Chicago River.
Sustainability 17 02457 g001
Figure 2. Current situation of the open space.
Sustainability 17 02457 g002
Figure 3. Development of Space syntax.
Sustainability 17 02457 g003
Figure 4. Concept for erecting an evaluation framework.
Sustainability 17 02457 g004
Figure 5. Three-dimensional model generated by OpenStreetMap data. Map data © OpenStreetMap contributors, available under the Open Database License (ODbL).
Sustainability 17 02457 g005
Figure 6. Research flowchart.
Sustainability 17 02457 g006
Figure 7. Public facilities and buildings information.
Sustainability 17 02457 g007
Figure 8. (a) Mapping open space; (b) The image of a “strip”.
Sustainability 17 02457 g008
Figure 9. Current situation along the river.
Sustainability 17 02457 g009
Figure 10. Uneven distribution of resources.
Sustainability 17 02457 g010
Figure 11. Visual Graphic Analysis, with comparatively valued zones boxed and five distinctive areas circled. Redder = higher value; bluer = lower value. (a) Visual clustering coefficient map; (b) Visual control map; (c) Visual entropy map; (d) Visual controllability map; (e) Visual integration map.
Sustainability 17 02457 g011
Figure 12. Analysis of the visual horizon. In the three layers above, redder = higher value; bluer = lower value.
Sustainability 17 02457 g012
Figure 13. Connection proposal.
Sustainability 17 02457 g013
Figure 14. Form a continuous strip from the Chicago River and its surrounding open space (The image depicts the Chicago River, created through graphic splicing).
Sustainability 17 02457 g014
Figure 15. Link the river and the adjacent neighborhoods (the circles) to build a stronger connection (The image depicts the Chicago River, created through graphic splicing).
Sustainability 17 02457 g015
Figure 16. The overall connection proposal (The image depicts the Chicago River, created through graphic splicing).
Sustainability 17 02457 g016
Figure 17. Collages of connections.
Sustainability 17 02457 g017
Figure 18. Community involvement.
Sustainability 17 02457 g018
Table 1. The mainstream open space evaluation frameworks.
Evaluation FrameworkAnalytic Hierarchy Process (AHP) FrameworkUser Experience-Based FrameworkSustainable Development Framework
Theoretical BasisSystems engineering and decision-making science, the principle of problem-layering and comparison.Environmental psychology, behavior science, the theory of the relationship between behavior and environment.Sustainable development theory, coordinated development of economy, society, and environment.
Application ScopePublic space planning, ranking, urban planning, and other fields.All types of public spaces, especially those emphasizing user participation.Urban public space planning and large-scale project evaluation.
Analysis MethodsExperts score, construct matrices, and require consistency checks.Questionnaires, observations, interviews, and data collation and analysis.Gather multi-faceted data and conduct in-depth comprehensive analysis.
AdvantagesHighly systematic, able to decompose problems, combines qualitative and quantitative methods, and requires less data.User-centered, diverse methods, and can identify problems.Comprehensive evaluation, in line with sustainable development, of strategic significance, and conducive to management.
DisadvantagesUnable to generate new schemes, large workload, subjective weighting, and complex calculations.Time-consuming and labor-intensive, large individual differences in data, limited for complex systems.Complex indicator system, difficult to unify standards, and issues of balancing interests.
Table 2. The mainstream accessibility evaluation frameworks.
Evaluation FrameworkRatio MethodNearest Distance MethodMethod Based on Cumulative OpportunitiesMethod Based on Spatial Interaction
Theoretical BasisBased on the concept of resource allocation ratio, reflecting the overall situation by total ratio.Based on the principle of the shortest distance, believing that people are more inclined to choose the nearest facility.Based on cumulative opportunities, the more resources within a certain range, the better the accessibility.Based on spatial interaction theory, the accessibility of service resources is affected by multiple factors.
Application ScopeSuitable for preliminary analysis of larger research units and macro assessment of various facilities.Mainly used for the assessment of smaller research units, especially for emergency facilities such as first aid stations.Suitable for the assessment of non-emergency facilities in smaller research units such as leisure parks.Suitable for the assessment of non-emergency facilities in smaller research units such as cultural venues.
Analysis MethodsCollect data on the total amount of service resources and the total population served in the research unit and obtain the ratio through simple calculation.Measure or calculate the straight-line distance, road distance or time distance between the service population and the nearest facility.Set the travel limit time or distance and count the number of public service resources that can be obtained starting from a certain point.Collect relevant data such as facilities, demanders, and spatial barriers. Use the model to calculate the difficulty of obtaining specific service resources.
AdvantagesSimple calculation and easy to understand. It can quickly show the relationship between the total amount of service resources and the total population served.Simple operation and intuitive. Can quickly determine the distance from the service population to the nearest facility.Comprehensively considers factors such as facilities, demanders, and spatial barriers. Can reflect the number of service resources that can be obtained within a certain range.Comprehensively considers factors such as facilities, demanders, spatial barriers, and distance attenuation. The assessment is relatively accurate.
DisadvantagesCannot reflect the differences in accessibility within the research unit. Does not consider spatial barrier factors. The result is relatively rough.Only considers distance and ignores factors such as the quantity and quality of services.Does not consider distance attenuation. It is difficult to determine the travel limit time or distance.It is difficult to determine the travel friction coefficient. The model is more complex and difficult to understand.
Disclaimer/Publisher’s Note: The statements, opinions and data contained in all publications are solely those of the individual author(s) and contributor(s) and not of MDPI and/or the editor(s). MDPI and/or the editor(s) disclaim responsibility for any injury to people or property resulting from any ideas, methods, instructions or products referred to in the content.