1. Introduction
The construction industry is responsible for approximately 39% of total global energy-related CO
2 emissions [
1]. Moreover, the construction industry is facing increasing pressure to adopt sustainable practices to reduce CO
2 emissions, due to rising surface temperatures of the earth and climate change. In recent years, two promising sustainable approaches that have gained significant attention from researchers are cement-less concrete, i.e., geopolymer concrete using different precursors as a partial to complete substitution for cement in concrete and, the second, is the use of recycled coarse aggregates (R.C.As.) as a partial to complete substitution for natural coarse aggregates (N.C.As.) in concrete.
Cement-less concrete comprises different precursors (industrial or agricultural waste), such as fly ash (FA), metakaolin, rice husk ash, or ground granulated blast furnace slag (GGBS), as binders, which are activated by alkaline activator solutions (AASs) to form a three-dimensional aluminosilicate network [
2]. The use of FA in cementless concrete significantly reduces greenhouse gas emissions associated with concrete production [
3]. It is noted that about 70–80% of FA is discarded as waste every year [
4].
Concurrently, the use of R.C.As. in concrete production has emerged as a viable solution to address the rising concern related to construction and demolition (C&D) waste. Globally, the construction industry accounts for approximately 30–40% of total global solid waste production. In 2018, C&D waste was estimated to reach 1.68 kg per person, per day [
5]. A partial to 100% substitution of N.C.As. with R.C.As. in virgin concrete mixes can help in conserving natural resources and reducing the environmental impact of increasing construction activities [
6].
In the existing literature, numerous research studies have reported on the axial and flexural behavior of cement-less concrete prepared with 100% substitution of OPC with fly ash [
7]. These research studies investigated the influence of NH molarity and AASs on the mechanical properties of cement-less concrete. Khan et al. [
8] studied the influence of varying NH molarities (10 M to 16 M) on the compressive strength (C.S.) of cement-less concrete and reported the highest C.S. of 45.6 MPa at 14 M. Verma et al. [
9] investigated the effect of two NH molarities (5 M and 10 M) and reported an optimum C.S. of 31.3 MPa at 10 M. Ghafoor et al. [
10] explored the influence of varying NH molarities (8 M to 16 M) and reported the maximum C.S. and flexural strength (F.S.) of 21.5 MPa at 14 M and 5 MPa at 16 M, respectively. Raj et al. [
11] investigated the effects of varying NH molarities (10 M to 14 M) and found an optimum C.S. of 29 MPa at 14 M. Reddy et al. [
12] considered varying NH molarities (8 M to 16 M) and reported that an NH molarity of 16 M produced the optimum C.S. of 39.2 MPa. The existing studies in the literature have reported that both NH molarities of 14 M and 16 M resulted in the optimum C.S. of the mixes. However, increasing NH molarity increases both the embodied carbon dioxide (e-CO
2) emissions and the cost.
A large number of research studies have also investigated the influence of sodium silicate to sodium hydroxide (Na
2SiO
3/NH) ratios on the mechanical properties of cement-less concrete. Ozbayrak et al. [
13] investigated the effect of varying Na
2SiO
3/NH (NS/NH) ratios (1.5, 2.5, and 3.5) on the C.S. and F.S. of cement-less concrete. The optimum C.S. of 49.7 MPa and F.S. of 5.88 MPa were achieved at NS/NH ratios of 3.5 and 1.5, respectively. Verma et al. [
9] investigated the effect of varying NS/NH ratios (1, 1.5, and 2) and found that the maximum C.S. of 31.27 MPa was attained at an NS/NH ratio of 2. Ghafoor et al. [
10] reported that the C.S. was reduced with an increasing NS/NH ratio, from 1.5 to 2.5. Sarkar et al. [
14] varied the NS/NH ratio (2, 2.5, and 3) and reported the highest C.S. of 18 MPa at an NS/NH ratio of 2.5. A review of the literature exhibited that different research studies have observed different NS/NH ratios in regard to producing the optimum strengths.
In regard to the available literature, research studies have also investigated the effect of alkaline activator solution to FA (AAS/FA) ratios on the mechanical properties of cement-less concrete. Ozbayrak et al. [
13] varied the AAS/FA ratio from 0.5 to 0.7 and achieved the maximum C.S. of 49.7 MPa at an AAS/FA ratio of 0.7. Raj et al. [
11] investigated varying AAS/FA ratios (0.30, 0.35 and 0.40) and reported an optimum C.S. of 29 MPa at an AAS/FA ratio of 0.4. Leong et al. [
15] investigated four AAS/FA ratios (0.3, 0.4, 0.5, and 0.6) and reported an optimum C.S. of 34 MPa at an AAS/FA ratio of 0.4. Ghafoor et al. [
10] reported that the C.S. was not significantly influenced by varying the AA/FA ratio. In general, a review of such studies exhibited that higher AAS/FA ratios produced mixes with a higher C.S.
The influence of different percentage substitutions of N.C.As. with R.C.As. on the mechanical properties of cement-less recycled aggregate concrete (C.R.A.C.) has been frequently investigated. Umer et al. [
7] reported reductions in the C.S. and F.S. of C.R.A.C. by about 29.1% and 31.1%, for 100% substitutions of N.C.As. with R.C.As., respectively. Koushkbaghi et al. [
16] studied the effects of varying NS/NH ratios (2.0 to 3.0) and percentage substitutions from 0 to 30% of N.C.As. with R.C.As. on the C.S. of C.R.A.C. The study reported that an optimum C.S. of 38 MPa was achieved at an NS/NH ratio of 2.5, with a 10% substitution of N.C.As. with R.C.As. Gopalakrishna et al. [
17] investigated the influence of varying AAS/FA ratios (0.3 to 0.8), along with 100% substitution of N.C.As. with R.C.As., on the C.S. of C.R.A.C. The maximum C.S. of 35 MPa was achieved at an AAS/FA ratio of 0.3.
Le et al. [
18] reported a 28.6% reduction in C.S. at 100% substitution of N.C.As. with R.C.As. Ojha et al. [
19] found a 6.4% reduction in the C.S. of C.R.A.C. at 100% substitution of N.C.As. with R.C.As. Malayali et al. [
20] observed a C.S. reduction of 33% with 100% substitution of N.C.As. with R.C.As. Mesgari et al. [
21] reported a 1.6% reduction in the C.S. of C.R.A.C. with a 20% substitution of N.C.As. with R.C.As. Moulya and Chandrashekhar [
22] reported a 24% reduction in the C.S. of C.R.A.C. with 100% substitution of N.C.As. with R.C.As. Moreover, the study reported that the reduction in the C.S. at the 70% substitution level of N.C.As. with R.C.As. was similar to that at 100% substitution of N.C.As. Nazarpour and Jamali [
23] reported that up to 40% substitution of N.C.As. with R.C.As. reduced the C.S. by 15%. The maximum C.S. of 44.9 MPa was achieved with 40% substitution of N.C.As. with R.C.As. Saravanakumar [
24] reported a 33% reduction in the C.S. of C.R.A.C. with 100% substitution of N.C.As. with R.C.As.
In regard to the existing literature, research studies have reported significant environmental benefits of using C.R.A.C. as compared to conventional OPC concrete (OPCC). Khan et al. [
8] reported that FA-based cement-less concrete mixes produced 30% to 48.9% less embodied CO
2 (e-CO
2) emissions than OPCC. Setiawan et al. [
25] reported that cement-less concrete produced 56% less e-CO
2 emissions than OPCC. Teh et al. [
26] noted that cement-less concrete produced 32% less e-CO
2 emissions than OPCC. Turner and Collins [
27] conducted a detailed comparison of e-CO
2 emissions about OPCC and cement-less concrete; the study found that cement-less concrete produced 9% less e-CO
2 emissions than OPCC.
As the construction industry continues to seek sustainable alternatives to traditional concrete, the combination of cement-less concrete and R.C.As. offers a promising solution. This research aims to contribute to the growing body of knowledge on matter by investigating the hardened properties and microstructural characteristics of C.R.A.C. In this study, FA is sourced from the Thar Coal Power Plant (CPP), which utilizes lignite-type coal. The Thar CPP produces approximately 24,502.6 tons of FA per month [
28]. Despite the significant amount of FA produced, no study has yet been conducted on utilizing Thar FA as 100% substitution for cement in concrete. This research investigates the synergistic effects of combining these sustainable practices by studying cement-less concrete incorporating varying molarities of AASs and percentage substitutions of N.C.As. with R.C.As.
2. Experimental Program
The experimental program was designed to investigate the mechanical properties of cement-less recycled aggregate concrete (C.R.A.C.) under varying NaOH (NH) molarities and percentage substitutions of natural coarse aggregates (N.C.As.) with recycled coarse aggregates (R.C.As.). A total of 18 ambient-cured C.R.A.C. mixes (108 specimens) were cast and tested under axial compression and flexure. Each C.R.A.C. mix comprised of three cylinders, with a height of 200 mm and a diameter of 100 mm, and three prisms, with a cross-section of 75 mm × 75 mm and a length of 300 mm. In this experimental study, based on an extensive review of the research studies already conducted, varying NH molarities (12 M, 14 M, and 16 M), a Na
2SiO
3/NH (NS/NH) ratio of 1.5, an alkaline activator solution to FA (AAS/FA) ratio of 0.6, and varying percentage substitutions of N.C.As. with R.C.As. (0%, 20%, 40%, 60%, 80%, and 100%) (
Table 1) were chosen.
The C.R.A.C. mix designation comprised two numbers. The first number represented the NH molarity, and the second number represented the percentage substitution of N.C.As. with R.C.As. For example, mix C.R.A.C.–12-20% represents the C.R.A.C. mix prepared using the 12 M NH solution and a 20% substitution of N.C.As. with R.C.As.
2.1. Materials
To prepare the C.R.A.C. mixes, fly ash was sourced from Thar CPP, Sindh, Pakistan, the N.C.As. and fine aggregates (sand) were sourced from Thatta, Sindh, and Luni Kot, Sindh, respectively. The NH solids and NS solution were sourced from a local market in Punjab, Pakistan.
2.1.1. Fly Ash (FA)
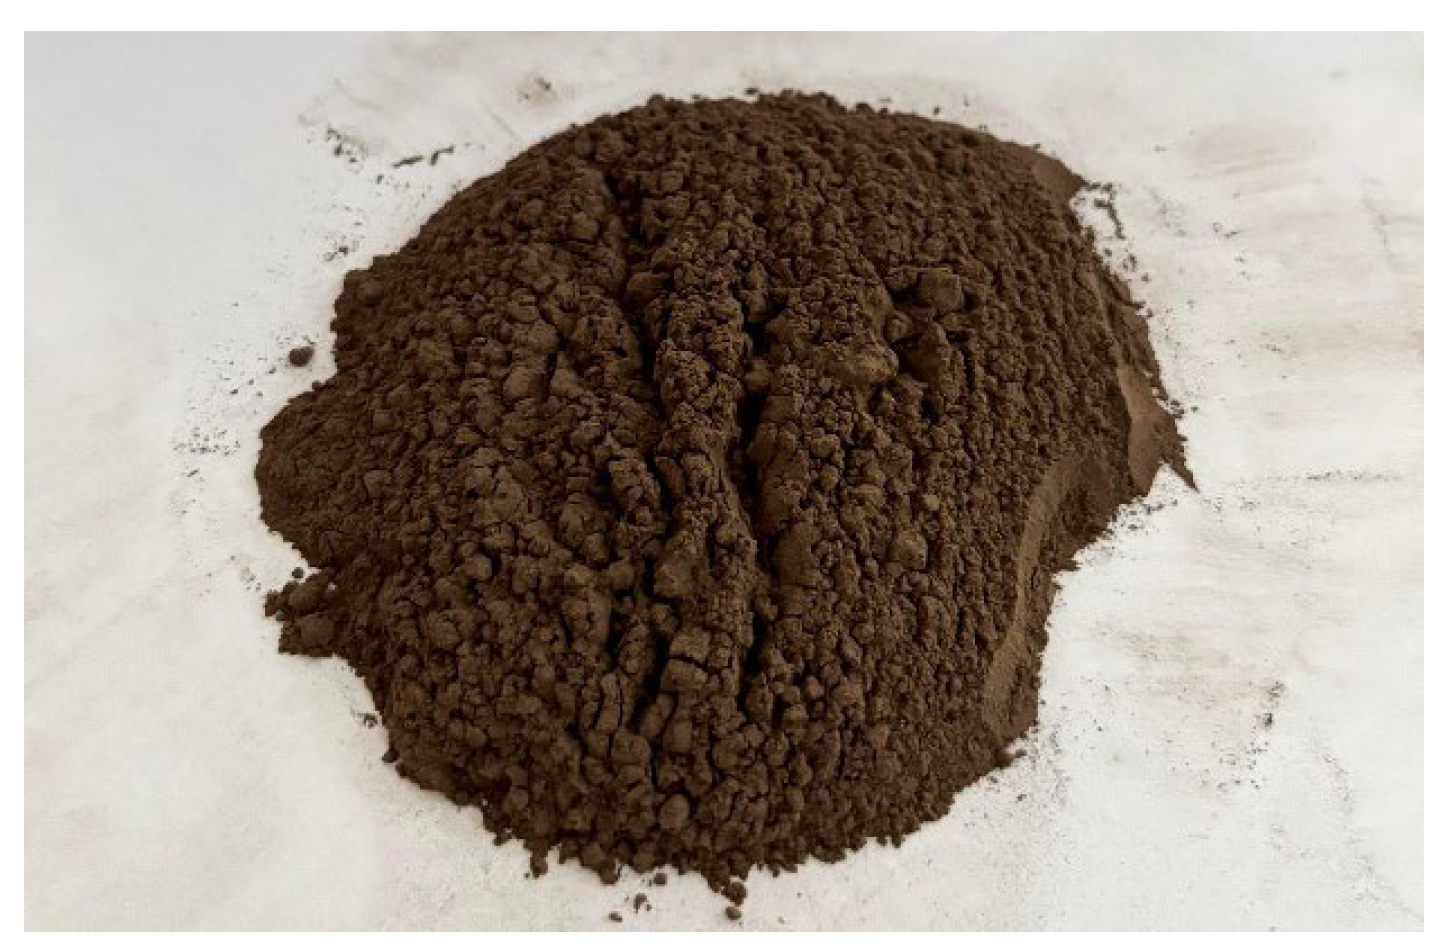
Thar CPP has an installed power generation capacity of 660 MW and was built as part of the China–Pakistan Economic Corridor (CPEC) projects. The FA sourced from Thar CPP was light brown in color, as shown in
Figure 1. The chemical analysis of the FA was conducted by the Chemical Eng. Department, UET Lahore, as per ASTM C114-22 [
29]. Based on the chemical analysis, the sum of SiO
2, Al
2O
3, and Fe
2O
3 was 62%, exceeding the threshold limit of 50%. The CaO content was 18.92%, greater than the 18% limit. The SO
3 content was 7.28%, significantly above the 5% limit. The loss on ignition (L.O.I.) was 4.3%, below the 6% threshold (
Table 2). The FA can be classified as Class F FA, as per ASTM C618-22 [
30]; however, the CaO and SO
3 contents exceeded the acceptable limits. It is pertinent to note that according to ASTM C618-19 [
31], the sum of the SiO
2, Al
2O
3, and Fe
2O
3 contents in the FA must be greater than 70% to be categorized as Class F fly ash. The SiO
2, Al
2O
3, and Fe
2O
3 contents play a pivotal role in the formation of sodium aluminosilicate hydrate (N-A-S-H) gel in cement-less concrete. The SiO
2 content contributes to the long-term strength of concrete through pozzolanic reactions, whereas Al
2O
3 aids in the early strength gain and improves the sulfate resistance of concrete. The Fe
2O
3 content enhances the durability and resistance to chemical attack of the concrete. The high CaO content increases the formation of C-S-H gel; however, an excessive quantity of CaO causes rapid early setting of concrete and increases the heat of hydration, which potentially results in thermal cracking [
32,
33]. Although Thar FA was categorized as Class F, Thar FA comprises lower SiO
2, Al
2O
3, and Fe
2O
3 contents, and higher CaO and SO
3 contents.
Scanning Electron Microscopy (SEM) Analysis
The SEM analysis of the FA was conducted as per ASTM E986-17 [
34], using a ZEISS Sigma (FE-SEM) scanning electron microscope. The SEM analysis of the FA exhibited a heterogeneous mix of particles with irregular shapes and sizes, deviating from the ideal spherical shaped, as shown in
Figure 2a.
An agglomeration of FA particles refers to the clustering or clumping together of individual particles into larger masses, as evident in
Figure 2b, which can create weak points in the concrete matrix and, consequently, reduce the pozzolanic reactivity, as reported in the study by Liew et al. [
35]. The FA particles with a rough surface texture were suggestive of a potentially higher water demand in the concrete mix and, resultantly, exhibited a negative impact on strength development [
36], as shown in
Figure 2b.
The dark porous particles, visible in the FA images in
Figure 2c, may be attributed to unburnt carbon and may also increase the water demand in the concrete mix [
36,
37]. The observed microstructural characteristics, along with high CaO and SO
3 contents, may likely result in poor packing, increased water demand, and reduced pozzolanic activity.
Energy Dispersive X-Ray Spectroscopy (EDX) Analysis
The elemental composition of the FA was determined by conducting Energy Dispersive X-Ray Spectroscopy (EDX) (
Table 3), as per ASTM E1508-19 [
38], using an INCA EDX.
The Energy Dispersive X-ray (EDX) analysis of the Thar FA exhibited a complex elemental composition that significantly influenced the cementitious properties. The predominant elements found in the FA included oxygen (46.07%), calcium (27.41%), silicon (7.71%), sulfur (8.63%), and aluminum (6.75%) (
Table 2). The high sulfur content potentially led to a delay in the ettringite formation [
39]. Moreover, the relatively low Si content may limit long-term strength development as a result of pozzolanic reactions [
40].
This elemental profile, particularly the high calcium and sulfur contents, corroborates the earlier SEM observations and further explains the observed low strength-related performance of C.R.A.C. mixes.
Particle Size Distribution Analysis
The analysis of the Particle Size Distribution (PSD) of the Thar FA was conducted as per ASTM D7928-21 [
41], as shown in
Figure 3. The PSD results exhibited that about 40% of the FA particles were smaller than 45 µm, and the remaining 60% of the FA particles were greater than 45 µm and can be considered as non-cementitious and filler in nature. In general, the presence of finer particles (<45 microns) can contribute to increase reactivity and better packing in cementitious systems, while larger particles may affect the workability and strength development in concrete applications [
42,
43]. Based on the PSD, almost 60% of the Thar FA particles acted as non-cementitious and filler materials in the C.R.A.C. mixes.
2.1.2. Natural Coarse Aggregates (N.C.As.)
The natural coarse aggregates (N.C.As.) were sourced from Thatta, Sindh, as shown in
Figure 4. The aggregate crushing value (ACV) of the N.C.As. was determined as per BS 812-110:1990 [
44]. The ACV test involves crushing a sample of the aggregates in a cylinder, with an internal diameter 154 mm, with a plunger that has an internal diameter of 152 mm, under a uniform load of 40 kN/min, for 10 min. The crushed material is then sieved (2.36 mm), and the percentage passing through the sieve is calculated as the ACV. The aggregate impact value (AIV) of the N.C.As. was determined as per BS 810-112:1990 [
45]. The AIV test measures an aggregate’s resistance to a sudden impact. A sample is placed in a mold, with an internal diameter of 102 mm and a depth of 50 mm, and subjected to 15 blows, with a falling weight of 14 kg. The crushed material is sieved (2.36 mm), and the percentage passing through the sieve (2.36 mm) is calculated as the AIV.
Additionally, petrographic analysis of the N.C.As. was carried out at Punjab University, Lahore, the results of which are presented in
Table 4, as per ASTM C295-19 [
46]. The petrographic analysis exhibited that the N.C.As. primarily consisted of limestone (yellowish–brown fine to medium grained), comprising 99% Calcite, 0.3% Dolomite, 0.5% Quartz, 0.2% iron oxide, and trace amounts of clay. The N.C.As. exhibited no potential for ACR and ASR.
2.1.3. Recycled Coarse Aggregates (R.C.As.)
The recycled coarse aggregates (R.C.As.) were prepared in the Concrete Lab at UET, Lahore. The R.C.As. were prepared initially using a hammer to manually break down large concrete pieces and, then, utilizing a roller crusher, the aggregates were reduced to smaller, consistently sized aggregates. The R.C.As. with sizes smaller than 12.5 mm were used in the C.R.A.C. mixes. The source concrete used for producing the R.C.As. had a compressive strength (C.S.) ranging from 21 MPa to 28 MPa.
The ACV and AIV of the N.C.As. and R.C.As. are presented in
Table 5. The N.C.As. exhibited a lower ACV and AIV than that of the R.C.As., which indicated that the N.C.As. were stronger and exhibited greater resistance to crushing and impact than the R.C.As. The ACV and AIV for both the N.C.As. and R.C.As. were found to be within the acceptable limits.
2.1.4. Fine Aggregates
The fine aggregate (sand) was sourced from Luni Kot, Sindh, as shown in
Figure 5. The fineness modulus of the sand was 2.6, as per ASTM C136-19 [
47].
2.1.5. Alkaline Activator Solution
The alkaline activator solution (AAS) comprised of a sodium hydroxide (NH) solution and a sodium silicate (NS) solution. Both, the NH and NS solutions were obtained from a local chemical supplier in Punjab, Pakistan. To attain the 12 M, 14 M, and 16 M NH solutions, 36%, 42%, and 48% of solid NH pellets, respectively, were dissolved in 1000 mL of distilled water at 25 °C. The ratio of NS to NH was kept at 1.5 for all the C.R.A.C. mixes.
2.2. Mix Details
A total of 18 C.R.A.C. mixes were prepared with varying NH molarity (12 M, 14 M, and 16 M) and varying percentage substitutions of N.C.As. with R.C.As. (0%, 20%, 40%, 60%, 80%, and 100%). In all the C.R.A.C. mixes, an NS/NH ratio of 1.5 and an AAS/FA ratio of 0.6 were selected, based on an extensive review of the literature and the experimental research studies of authors group [
3,
8,
10,
48,
49]. The test matrix is presented in
Table 6.
2.3. Casting of Test Specimens
The AAS was prepared 24 h prior to casting. In the first stage, the required proportions of FA, N.C.As., R.C.As., and sand were thoroughly mixed in a mechanical pan mixer for about 1 to 2 min to prepare a homogenous dry mix (
Figure 6a). In the second stage, the prepared AAS was added to the dry mix and wet mixing continued for another 1 to 2 min. An additional amount of water of about 25–30% of the FA was added to the wet mix, due to the porous nature of the FA particles, to attain a target slump of 50 mm.
The prepared C.R.A.C. mix was then poured into cylinder and prism molds (
Figure 6b,c). The molds were filled in three layers. Each layer was compacted using tamping rods and a vibrating table. The specimens were demolded after 24 h and then the specimens were ambient cured for 28 days.
2.4. Testing of Specimens
The C.R.A.C. cylinders were tested under axial compression, as per ASTM C39-21 [
50]. The ends of the cylinders were capped with gypsum plaster (
Figure 7a). The cylinders were tested under a force-controlled load of 0.15 MPa/s to 0.35 MPa/s. The C.R.A.C. prisms were tested under flexure as per ASTM C78-21 [
51]. The prisms were split into three equal spans of 80 mm each, with a cantilever length of 30 mm at both ends. The four-point loading configuration is shown in
Figure 7b.
3. Results and Discussion
3.1. Observed Failures
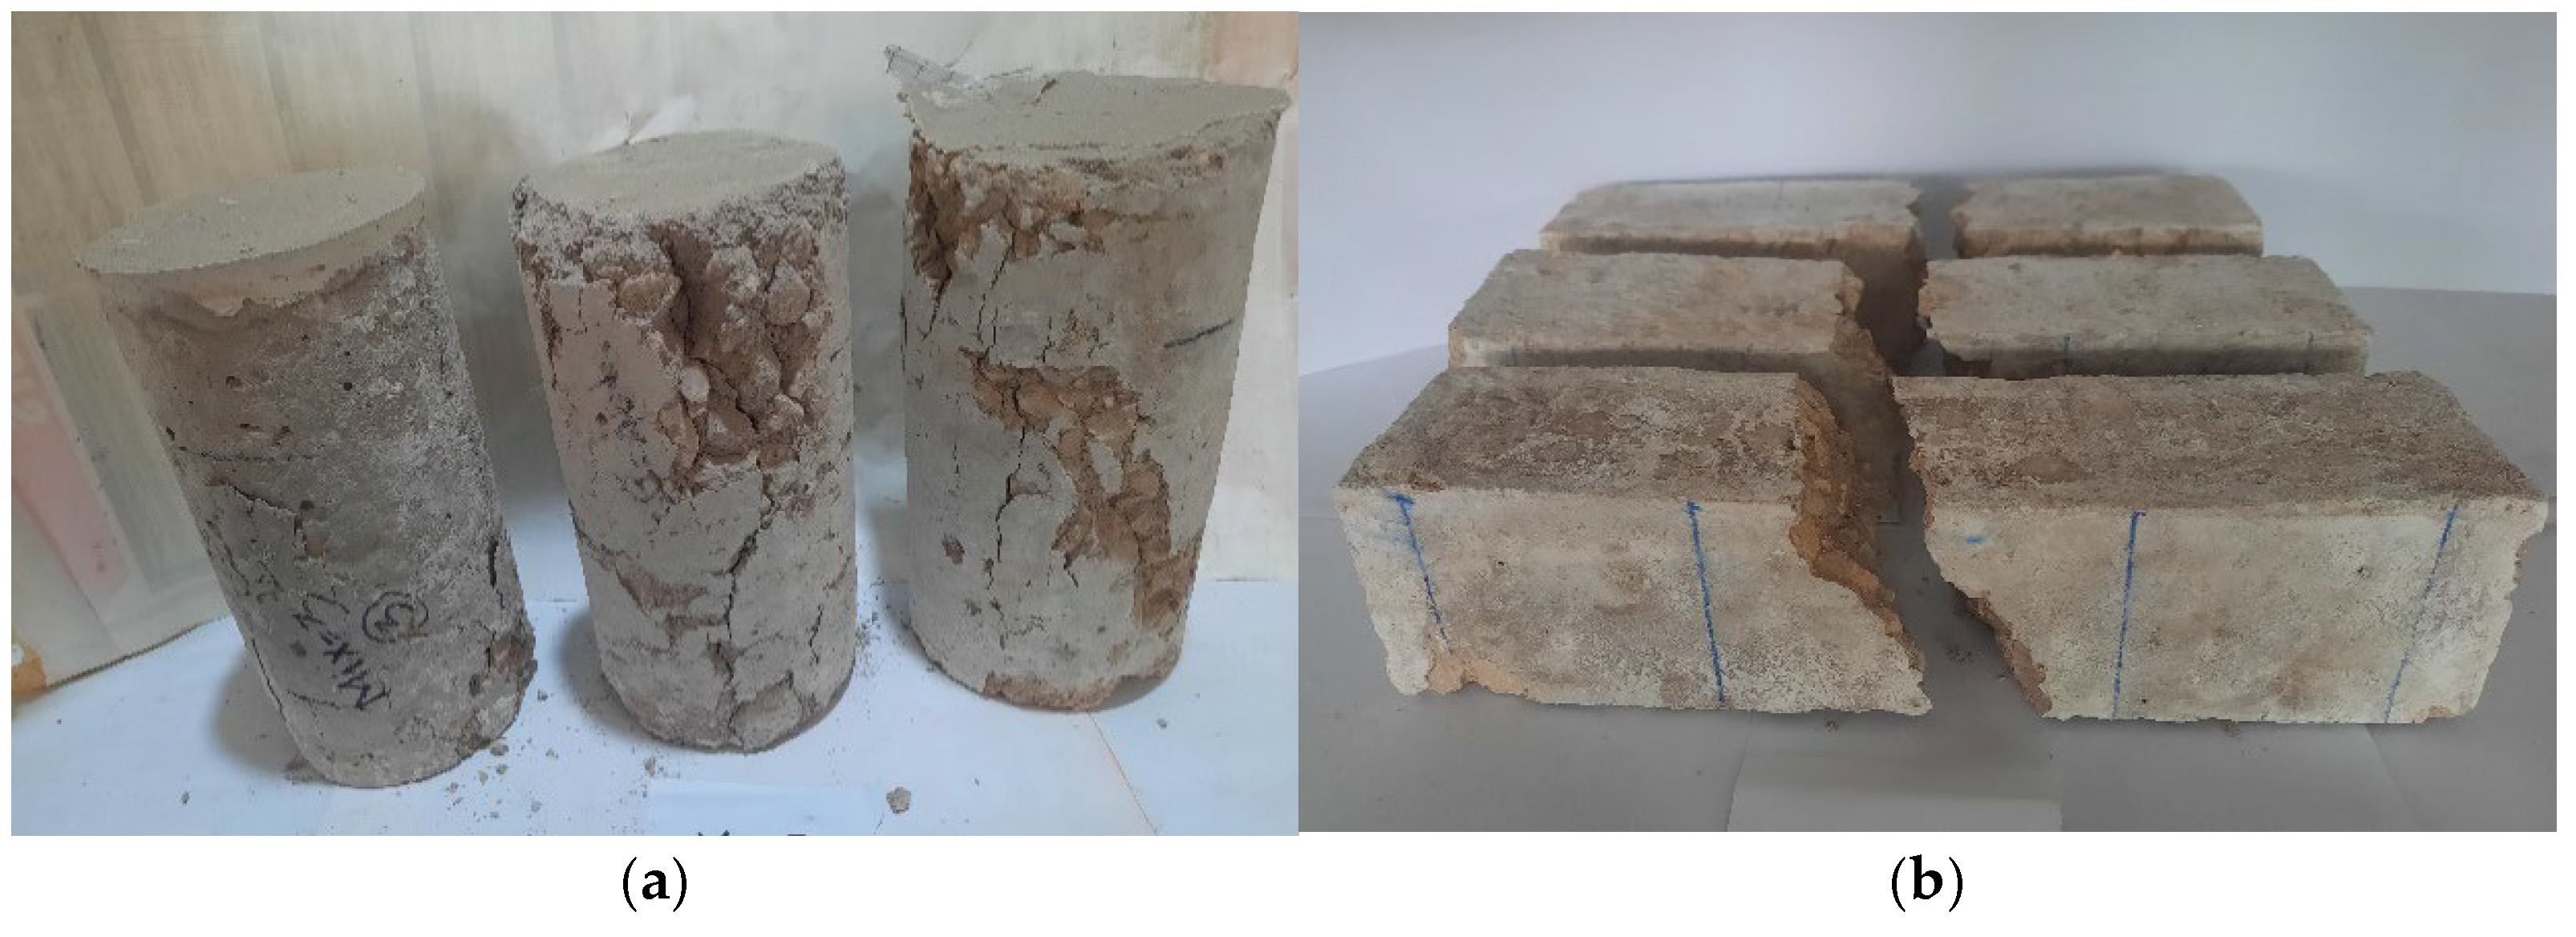
The C.R.A.C. specimens exhibited failure patterns similar to OPC concrete under axial compression and four-point flexural loading (
Figure 8). The cylindrical specimens under compression exhibited multiple vertical cracks at the edges, indicating a brittle failure mode. Additionally, the cylinders displayed conical-shaped failure patterns, characteristic of concrete compression testing.
The C.R.A.C. prisms tested under four-point loading failed within the middle third of the span, where the bending moment is at the maximum and constant. It was also observed that increasing the percentage substitution of N.C.As. with R.C.As. did not significantly alter the failure patterns of the C.R.A.C. specimens.
The compression test results are presented in
Table 7. A variation in the axial load was observed with varying NH molarities and percentage substitutions of N.C.As. with R.C.As. It was noted that increasing the R.C.A. contents beyond 60%, tends to decrease the variability in the test results. The test results demonstrated a moderate level of variability, with an average deviation in the compressive strength (C.S.) of 0.1 MPa.
3.2. Influence of NH Molarity on C.R.A.C. Cylinders
The influence of varying NH molarities on the C.S. of the C.R.A.C. mixes is shown in
Figure 9. The C.S. was observed to increase with an increasing NH molarity from 12 M to 14 M and 14 M to 16 M. This could be attributed to the increased number of hydroxide ions (OH-) in the solution, which significantly increased the geopolymerization phenomenon [
52]. An increase in the NH molarity from 12 M to 14 M resulted in an increase in the C.S. of 22.2%, 18.9%, 28.6%, 27.3%, 22.2%, and 42.9%, at 0%, 20%, 40%, 60%, 80%, and 100% substitutions of N.C.As. with R.C.As, respectively. Similarly, an increase in the NH molarity from 14 M to 16 M resulted in an increase in the C.S. of 27.3%, 36.8%, 38.9%, 50%, 54.5%, and 50%, at 0%, 20%, 40%, 60%, 80%, and 100% substitutions of N.C.As. with R.C.As, respectively. An average increase in the C.S. of 25.3% was observed with an increasing NH molarity from 12 M to 14 M. Moreover, an increase in the NH molarity from 14 M to 16 M, resulted in an average 40.1% increase in the C.S. of the C.R.A.C. mixes, which was an almost 60% greater increase in the C.S. than an NH molarity of 12 M to 14 M. The C.R.A.C specimens prepared with 16 M NaOH had the optimum C.S. at 0%, 20%, 40%, 60%, 80%, and 100% substitutions of N.C.As. with R.C.As. It is concluded that the C.R.A.C. mixes prepared with the 16 M NH solution exhibited a significantly higher C.S. than the C.R.A.C. mixes prepared with 12 M and 14 M NH solutions.
3.3. Influence of the Percentage Substitutions with R.C.As. on C.R.A.C. Cylinders
The C.S. of the C.R.A.C. mixes were observed to decrease with an increase in the percentage substitution of N.C.As. with R.C.As., as shown in
Figure 10. For the 12 M NH solution, the C.S. was reduced by 11.1%, 12.5%, 21.4%, 18.2%, and 22.2%, for percentage substitutions of N.C.As. with R.C.As. of 20%, 40%, 60%, 80%, and 100%, respectively, with respect to 0%. Similarly, for the 14 M NH solution, the C.S. was reduced by 13.6%, 5.3%, 22.2%, 21.4%, and 9.1%, for percentage substitutions of N.C.As. with R.C.As. of 20%, 40%, 60%, 80%, and 100%, respectively, with respect to 0%. Moreover, for the 16 M NH solution, the C.S. was reduced by 7.1%, 3.85%, 16%, 19.1%, and 11.8%, for percentage substitutions of N.C.As. with R.C.As. of 20%, 40%, 60%, 80%, and 100%, respectively, with respect to 0%. The average percentage reductions in the C.S. of the C.R.A.C. mixes of 10.6%, 7.2%, 19.9%, 19.6%, and 14.4%, were observed for percentage substitutions of N.C.As. with R.C.As. of 20%, 40%, 60%, 80%, and 100%, respectively, with respect to 0%. It is pertinent to note that the highest percentage reductions in the C.S. were observed between 40% and 80% substitutions of N.C.As. with R.C.As. for all the molarities of the NH solutions. However, the largest percentage reduction in the C.S. was observed at an 80% substitution of N.C.As. with R.C.As. for the 14 M NH solution.
The flexural strength (F.S.) test results are presented in
Table 8. The standard deviation values vary with the variation in the NH molarity and percentage substitution of N.C.As. with R.C.As. Overall, the standard deviation trend suggests that variability in the F.S. tends to be lower for intermediate R.C.A. contents (e.g., 20–60%), while the C.R.A.C. mixes with either no R.C.As. or very high substitution levels exhibited larger variability.
3.4. Influence of NH Molarity on C.R.A.C. Prisms
The influence of varying NH molarities on the flexural strength (F.S.) of the C.R.A.C. mixes is shown in
Figure 11. A significant increase in the F.S. with an increasing NH molarity was observed. An increase in the NH molarity from 12 M to 14 M resulted in an increase in the F.S. of 25%, 28.6%, 33.3%, 16.7%, 20%, and 25%, at 0%, 20%, 40%, 60%, 80%, and 100% substitutions of N.C.As. with R.C.As, respectively. Similarly, an increase in the NH molarity from 14 M to 16 M resulted in an increase in the F.S. of 40%, 44.4%, 50%, 42.9%, 33.3%, and 40%, at 0%, 20%, 40%, 60%, 80%, and 100% substitutions of N.C.As. with R.C.As, respectively. It was observed that an average increase of 27.7% and 29.9% in the C.S. of the C.R.A.C. mixes occurred for the NH molarity from 12 M to 14 M and 14 M to 16 M, respectively. This increase in F.S. can be attributed to the enhanced dissolution of aluminosilicate precursors at higher molarities, which promotes greater geopolymerization [
53]. It is concluded that the C.R.A.C. mixes prepared with the 16 M NH solution exhibited a higher F.S. than the C.R.A.C. mixes prepared with the 12 M and 14 M NH solutions.
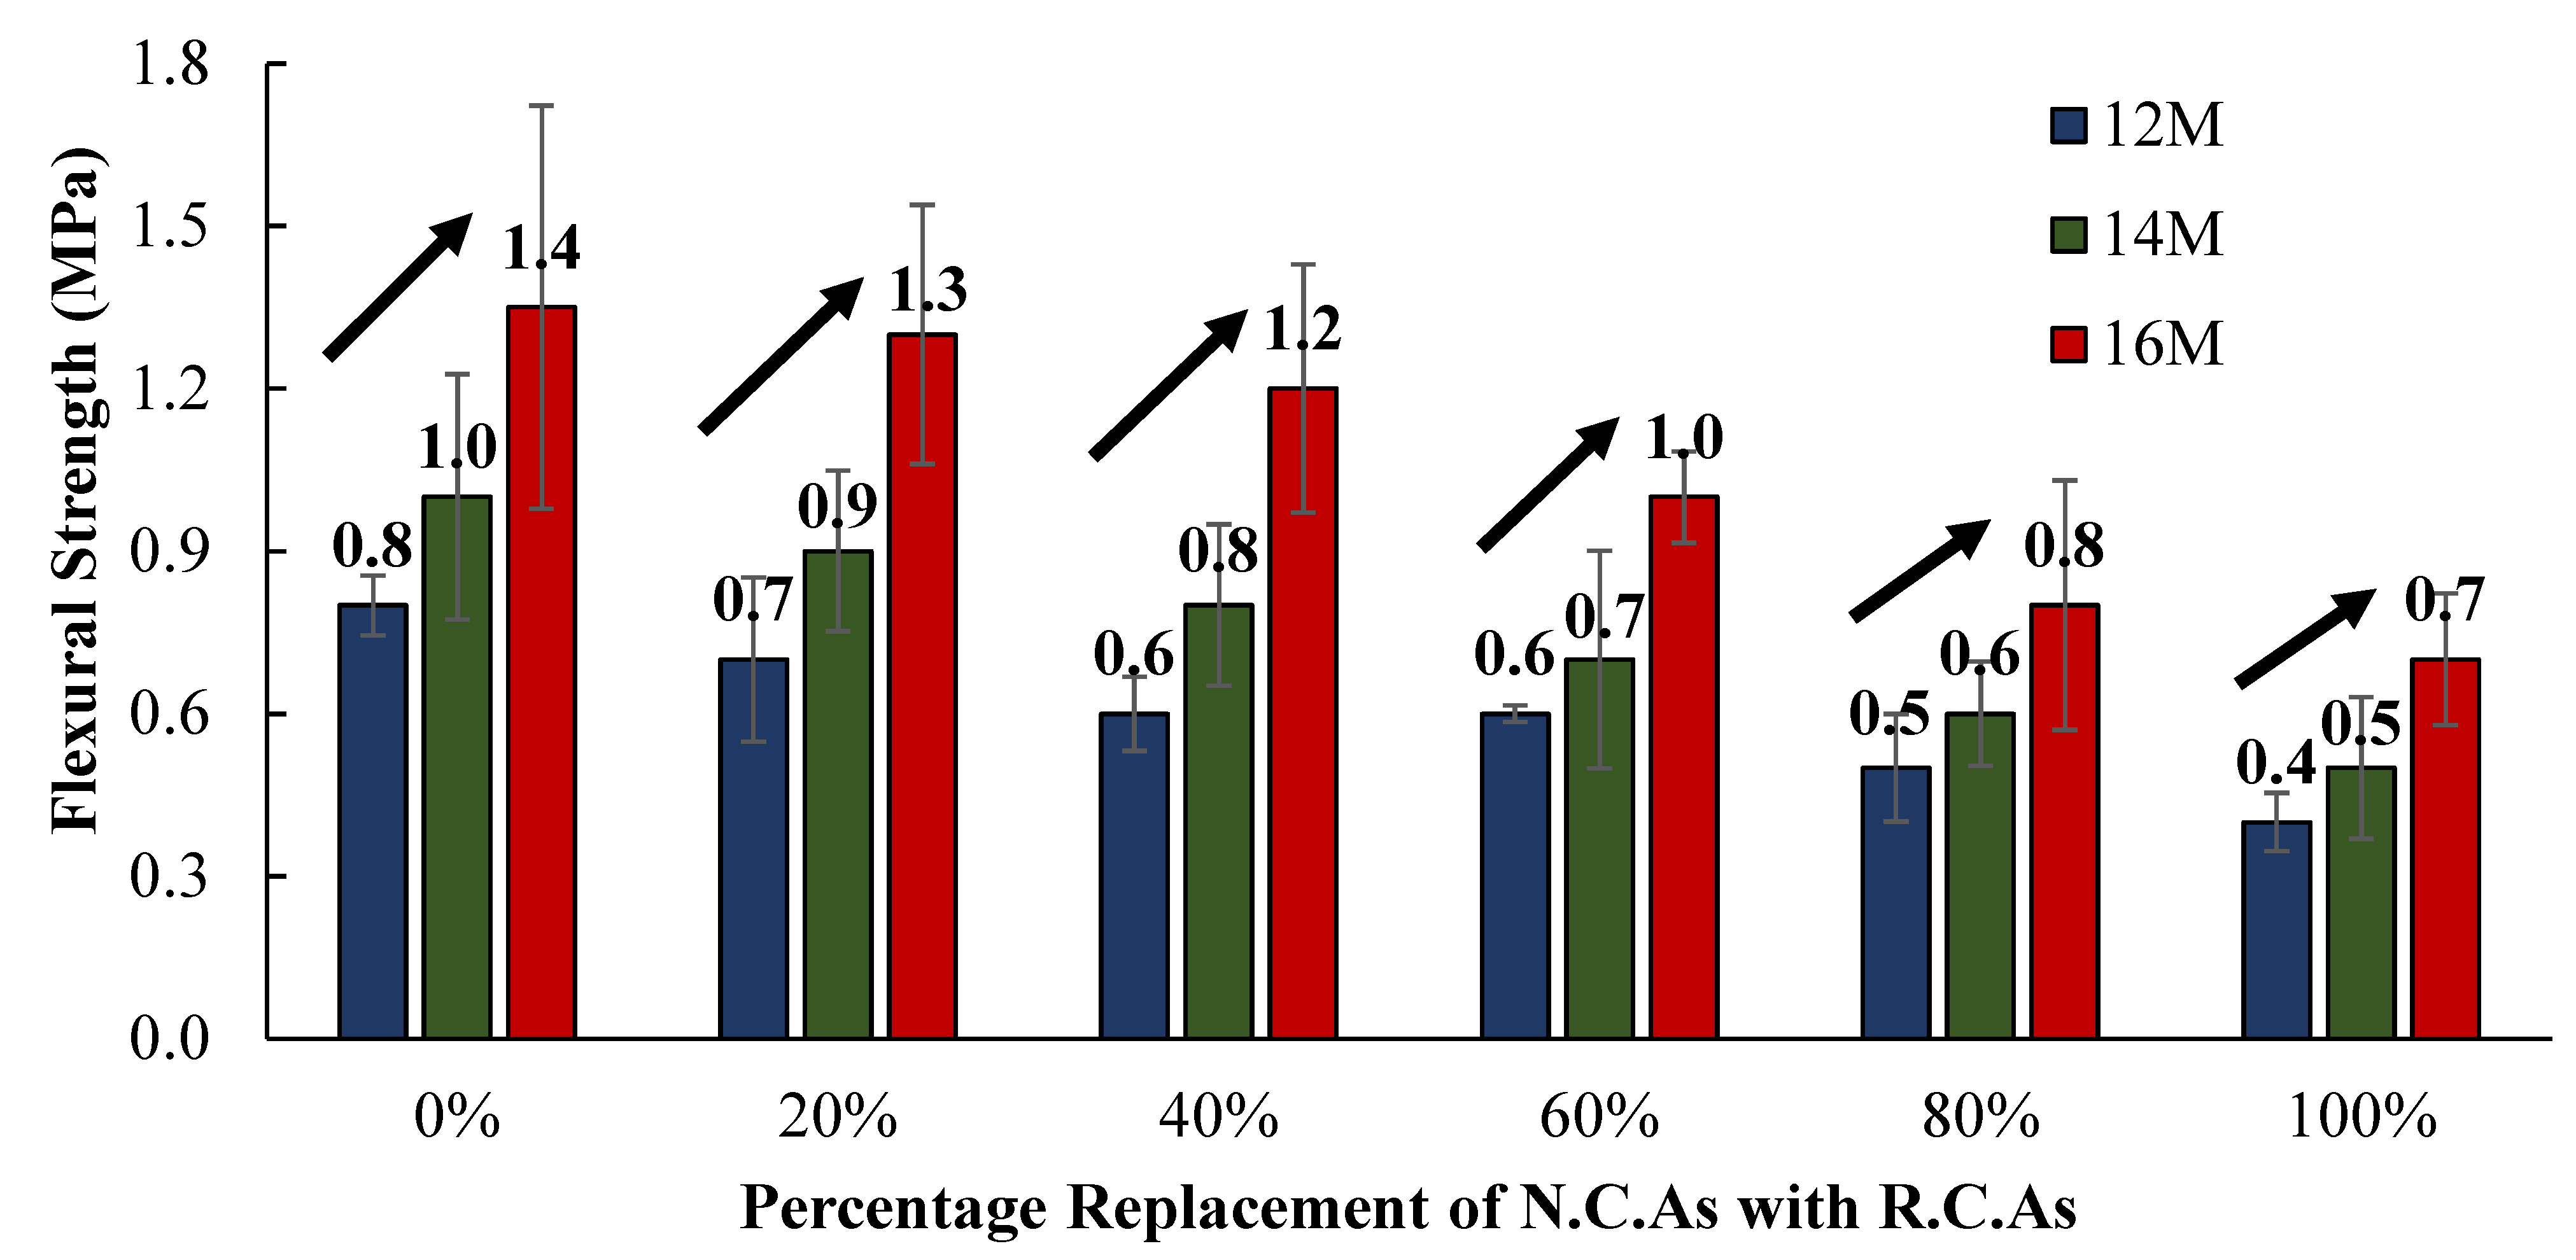
3.5. Influence of Percentage Substitutions of R.C.As. on C.R.A.C. Prisms
The F.S. of the C.R.A.C. mixes were observed to decrease with an increase in the percentage substitutions of N.C.As. with R.C.As., as shown in
Figure 12. For the 12 M NH solution, the F.S. was observed to reduce by 12.5%, 14.3%, 0.2%, 16.7%, and 20%, for percentage substitutions of N.C.As. with R.C.As. of 20%, 40%, 60%, 80%, and 100%, respectively, with respect to 0%. Similarly, for the 14 M NH solution, the F.S. was reduced by 10%, 11.1%, 12.5%, 14.3%, and 16.7%, for percentage substitutions of N.C.As. with R.C.As. of 20%, 40%, 60%, 80%, and 100%, respectively, with respect to 0%. Likewise, for the 16 M NH solution, the F.S. was reduced by 7.14%, 7.7%, 16.7%, 20%, and 12.5%, for percentage substitutions of N.C.As. with R.C.As. of 20%, 40%, 60%, 80%, and 100%, respectively. The average percentage reductions in the F.S. of the C.R.A.C. mixes of 9.9%, 11%, 9.8%, 17%, and 16.4%, were observed for the percentage substitutions of N.C.As. with R.C.As. of 20%, 40%, 60%, 80%, and 100%, respectively, with respect to 0%. It is pertinent to note that the largest percentage reductions in the F.S. were observed for 80% and 100% substitutions of N.C.As. with R.C.As., for the 12 M, 14 M, and 16 M NH solutions, respectively.
The potential application of the C.R.A.C. mixes developed in this study is primarily in regard to non-structural construction elements, where the environmental benefits take precedence over mechanical performance. Suitable applications of the C.R.A.C. mixes include non-load bearing walls, decorative elements, pavement blocks, and thermal or acoustic insulation panels. However, the material’s significantly lower strength compared to conventional concrete (typically 20–40 MPa) and other C.R.A.C. within the existing literature limits its use in structural applications.
3.6. Environmental Assessment
An environmental assessment of all the C.R.A.C. mixes with varying NH molarities and percentage substitutions of N.C.As. with R.C.As. in terms of embodied CO
2 (e-CO
2) emissions was carried out. The e-CO
2 emissions of the FA, N.C.As., R.C.As., sand, NH solutions, and NS solution were taken from existing studies [
8,
27]. It was observed that the different constituents of the C.R.A.C. mixes exhibited different e-CO
2 emissions. The FA emerged as a material with exceptionally low carbon emissions, with just 0.0090 kg/kg of e-CO
2 emissions, compared with OPC, which generates about 0.8300 kg/kg of e-CO
2 emissions. The e-CO
2 emissions of the FA were almost 92 times smaller than those of OPC. The e-CO
2 emissions of the N.C.As. and the R.C.As. were 0.0459 kg/kg and 0.0212 kg/kg, respectively, which were on the lower side. However, the AASs, comprising NS and NH solutions, exhibited significantly higher e-CO
2 emissions, ranging from 0.6964 to 0.935 kg/kg, depending on the molarity.
Table 9 presents the e-CO
2 emissions for the individual materials used in the C.R.A.C. mixes.
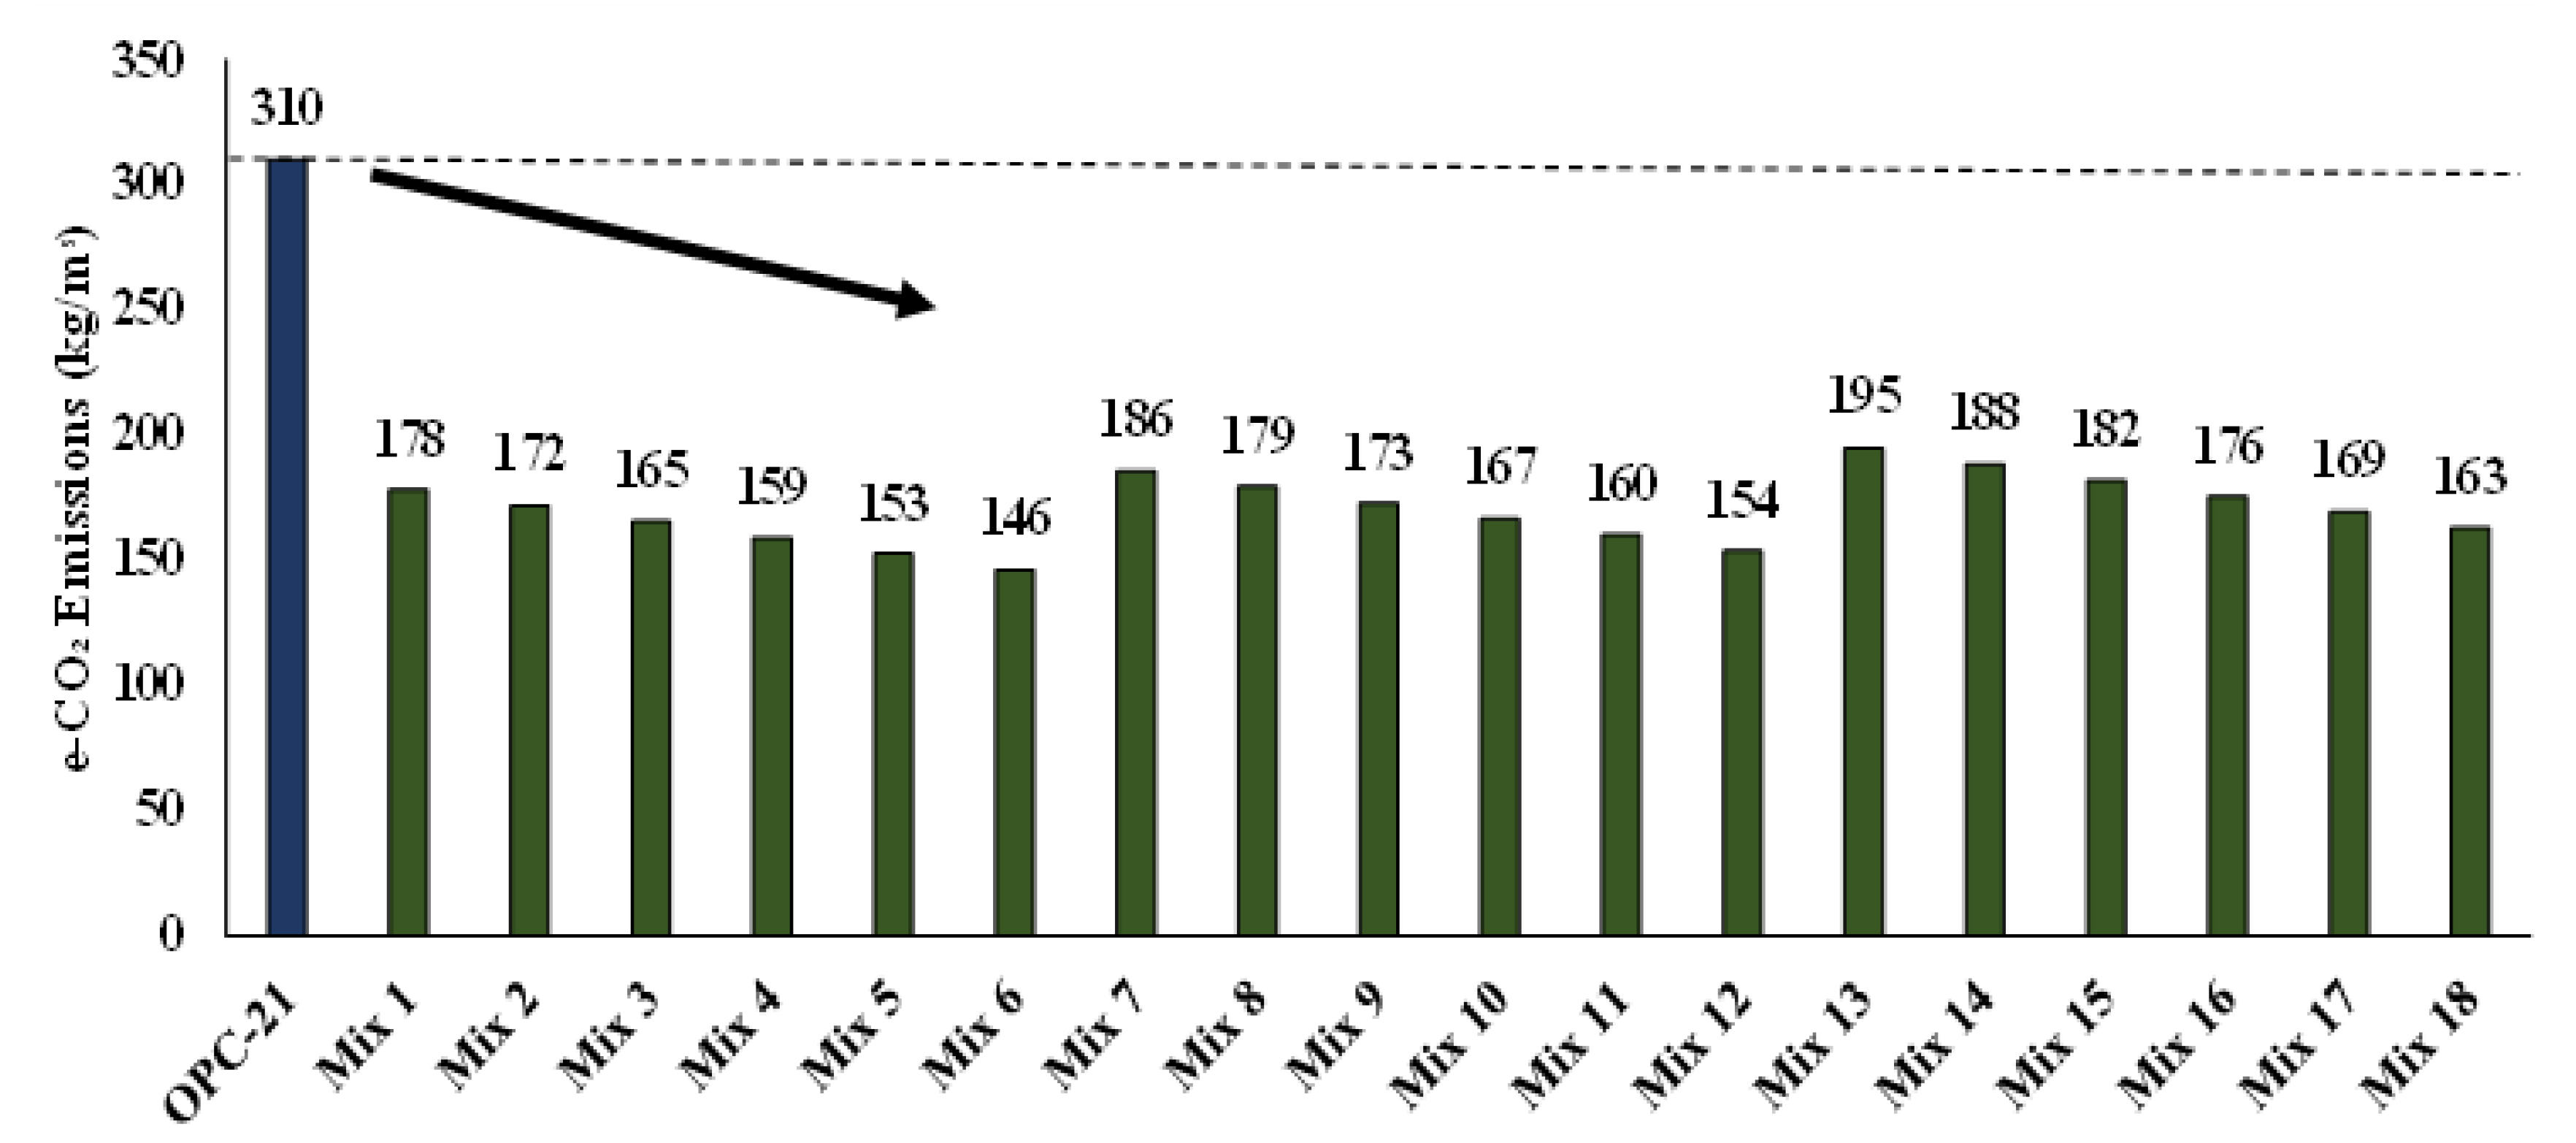
A comparison of the e-CO
2 emissions of the C.R.A.C. and OPC concrete mixes (target compressive strength of 21 MPa) exhibited a significant reduction in the e-CO
2 emissions with an increasing percentage substitution of N.C.As with R.C.As. at all the NH molarities (
Figure 13;
Table 10). The C.R.A.C.–12-0%, C.R.A.C.–12-20%, C.R.A.C.–12-40%, C.R.A.C.–12-60%, C.R.A.C.–12-80%, and C.R.A.C.–12-100% mixes exhibited 42.6%, 44.5%, 46.8%, 48.7%, 50.6%, and 52.9% lower e-CO
2 emissions than the OPC concrete mix, respectively. Similarly, the C.R.A.C.–14-0%, C.R.A.C.–14-20%, C.R.A.C.–14-40%, C.R.A.C.–14-60%, C.R.A.C.–14-80%, and C.R.A.C.–14-100% mixes exhibited 40.0%, 42.3%, 44.2%, 46.1%, 48.3%, and 50.3% lower e-CO
2 emissions than the OPC concrete mix, respectively. Likewise, the C.R.A.C.–16-0%, C.R.A.C.–16-20%, C.R.A.C.–16-40%, C.R.A.C.–16-60%, C.R.A.C.–16-80%, and C.R.A.C.–16-100% mixes exhibited 37.1%, 39.4%, 41.3%, 43.2%, 45.5%, and 47.4% lower e-CO
2 emissions than the OPC concrete mix, respectively. It is noted that the e-CO
2 emissions of the C.R.A.C. mixes prepared with the 12 M, 14 M, and 16 M NH solutions for all the percentage replacements of N.C.As. with R.C.As. (0-100%) were 47.7%, 45.2%, and 42.3% lower, respectively, than conventional OPC concrete.
Also, it was observed that with an increasing NH molarity at the same percentage substitution of N.C.As. with R.C.As. resulted in increased e-CO2 emissions. At 0% substitution of N.C.As. with R.C.As., the e-CO2 emissions were increased by 4.5% and 9.6% from the 12 M to 14 M and 12 M to 16 M NH solutions, respectively. At 20% substitution of N.C.As. with R.C.As., the e-CO2 emissions were increased by 4.1% and 9.3% from the 12 M to 14 M and 12 M to 16 M NH solutions, respectively. At 40% substitution of N.C.As. with R.C.As., the e-CO2 emissions were increased by 4.8% and 10.3% from the 12 M to 14 M and 12 M to 16 M NH solutions, respectively. At 60% substitution of N.C.As. with R.C.As., the e-CO2 emissions were increased by 5.0% and 10.7% from the 12 M to 14 M and 12 M to 16 M NH solutions, respectively. At 80% substitution of N.C.As. with R.C.As., the e-CO2 emissions were increased by 4.6% and 10.5% from the 12 M to 14 M and 12 M to 16 M NH solutions, respectively. At 100% substitution of N.C.As. with R.C.As., the e-CO2 emissions were increased by 6.9% and 11.6% from the 12 M to 14 M and 12 M to 16 M NH solutions, respectively.
The C.R.A.C. mixes present a clear environmental advantage over OPC concrete mixes. An OPC concrete mix produces 310 kg/m
3 of e-CO
2 emissions (
Table 11), whereas the equivalent C.R.A.C. mixes emitted e-CO
2 emissions ranging from 146.2 to 194.7 kg/m
3, representing a potential reduction in e-CO
2 emissions of up to 53%. Hence, C.R.A.C. mixes have a significantly reduced carbon footprint.
3.7. Cost Analysis
The costs of the different constituents of the C.R.A.C. mixes per cubic meter are presented in
Table 12, exhibiting the economic challenges associated with C.R.A.C. mixes as an alternative concrete technology.
A cost comparison of the C.R.A.C. mixes with an OPC concrete mix showed a reduction in the costs of the C.R.A.C. mixes with an increasing percentage substitution of N.C.As. with R.C.As. for all the NH molarities (
Figure 14). The C.R.A.C.–12-0%, C.R.A.C.–12-20%, C.R.A.C.–12-40%, C.R.A.C.–12-60%, C.R.A.C.–12-80%, and C.R.A.C.–12-100% mixes exhibited 23.7%, 22.0%, 20.3%, 18.6%, 16.7%, and 15.0% higher costs than the OPC concrete mix, respectively. Similarly, the C.R.A.C.–14-0%, C.R.A.C.–14-20%, C.R.A.C.–14-40%, C.R.A.C.–14-60%, C.R.A.C.–14-80% and C.R.A.C.–14-100% mixes exhibited 25.1%, 23.4%, 21.5%, 19.8%, 18.1%, and 16.4% higher costs than the OPC concrete mix, respectively. Likewise, the C.R.A.C.–16-0%, C.R.A.C.–16-20%, C.R.A.C.–16-40%, C.R.A.C.–16-60%, C.R.A.C.–16-80%, and C.R.A.C.–16-100% mixes exhibited 29.0%, 27.4%, 25.4%, 23.7%, 22.0%, and 20.3% higher costs than the OPC concrete mix, respectively. It is noted that the costs of the C.R.A.C. mixes prepared with the 12 M, 14 M, and 16 M NH solutions for all the percentage replacements of N.C.As. with R.C.As. (0–100%) were 19.5%, 20.6%, and 24.6% higher, respectively, than conventional OPC concrete.
Also, it was observed that with an increasing NH molarity at the same percentage substitution of N.C.As. with R.C.As. resulted in an increased cost of the C.R.A.C. mixes. At 0% substitution of N.C.As. with R.C.As., the costs of the C.R.A.C. mixes were increased by 1.14% and 4.34% from the 12 M to 14 M and 12 M to 16 M NH solutions, respectively. At 20% substitution of N.C.As. with R.C.As., the costs of the C.R.A.C. mixes were increased by 2.54% and 4.40% from the 12 M to 14 M and 12 M to 16 M NH solutions, respectively. At 40% substitution of N.C.As. with R.C.As., the costs of the C.R.A.C. mixes were increased by 0.94% and 7.28% from the 12 M to 14 M and 12 M to 16 M NH solutions, respectively. At 60% substitutions of N.C.As. with R.C.As., the costs of the C.R.A.C. mixes were increased by 0.95% and 4.29% from the 12 M to 14 M and 12 M to 16 M NH solutions, respectively. At 80% substitutions of N.C.As. with R.C.As., the costs of the C.R.A.C. mixes were increased by 1.21% and 4.60% from the 12 M to 14 M and 12 M to 16 M NH solutions, respectively. At 100% substitutions of N.C.As. with R.C.As., the costs of the C.R.A.C. mixes were increased by 1.23% and 4.67% from the 12 M to 14 M and 12 M to 16 M NH solutions, respectively.
There was a gradual reduction in the overall costs of the C.R.A.C. mixes with an increasing percentage of R.C.As. This reduction can be attributed to the lower cost of R.C.As. compared with N.C.As. The NH molarity also significantly influenced the overall cost of the mix. Higher molarities consistently increased the total mix cost, with 12 M mixes being the most economical and 16 M mixes being the most expensive.
The primary cost driver in C.R.A.C. mixes remains alkali activators, i.e., NS and NH solutions, which contribute substantially to higher production costs.


 ,
, 


