Article

Tall Building Design for Enhanced Wind Comfort in London

by
Yujin Kim
*,
Hesham Ebrahim
and
George Jeronimidis
Architectural Association School of Architecture, 36 Bedford Square, London WC1B 3ES, UK
*
Author to whom correspondence should be addressed.
Sustainability 2025, 17(6), 2343; https://doi.org/10.3390/su17062343
Submission received: 12 January 2025 / Revised: 22 February 2025 / Accepted: 24 February 2025 / Published: 7 March 2025

Abstract

:
While wind assessments by London authorities have become more stringent for tall buildings to address high-speed winds at pedestrian levels, there is a lack of available design guidelines for tall buildings that architects can refer to regarding this issue. This paper proposes new design procedures for tall buildings to enhance pedestrian-level wind comfort in London and thereby ensure people’s well-being and contribute to the development of sustainable urban areas. The present study undertook comparative analysis between isolated (pure aerodynamic) and urban conditions and proposed an integrated assessment approach that considered both building geometry and urban form parameters. Computational fluid dynamics was the primary methodology, supported by additional verification and validation processes. The results of this study highlighted that isolated building conditions were inadequate at representing tall building performance within the existing urban environment, as opposing results were observed under isolated and urban conditions. Therefore, it is essential to consider the existing urban conditions and perform a comprehensive evaluation that encompasses diverse building parameters, including façade angles, corner configurations, and heights, as well as urban factors such as open area ratios. This study took these aspects into account and provided practical recommendations for tall building design to improve PLW comfort across London’s urban fabric.

Graphical Abstract

1. Introduction

Tall buildings are a potential solution to the challenges of increasing urban population and rising land prices in urban areas [1], contributing to the development of sustainable cities. However, tall buildings can also introduce wind microclimate challenges, including the acceleration of pedestrian-level wind (PLW) by downdraughts, wind funnelling effects, and corner acceleration [2], which should be addressed to ensure PLW comfort and safety, both of which are crucial for people’s well-being and, consequently, the advancement of sustainable urban areas. The City of London (CoL) Corporation acknowledged these challenges due to a rise in complaints about strong PLWs and gusts around a tall building located on 20 Fenchurch Street (hereafter referred to as “The Walkie-talkie”) in London, UK [3]. With London witnessing a rapid surge in tall building construction over the past two decades [4], there has been a corresponding increase in concerns about strong winds in close proximity to the city’s tall buildings [3]. The CoL Corporation promised to conduct more robust wind assessments for tall buildings [3], especially since strong winds can cause pedestrian discomfort and raise potential safety concerns for elderly or frail persons and cyclists. Accordingly, the Planning Advice Notes [5] were presented in 2017, and the UK’s first wind microclimate guidelines for the CoL [6] were launched in 2019. The CoL also introduced thermal comfort guidelines [7], which consider a broader range of parameters (including air temperature, relative humidity, water vapour pressure, and wind speed) to provide a more holistic assessment. However, the present study focuses solely on the influence of wind speed and its mechanical effects by tall buildings in London, which can directly affect PLW discomfort and safety issues.
Although wind assessments by London’s governing body have become more rigorous for tall buildings, there remains an ongoing lack of design guidelines for tall buildings that architects can refer to for ensuring PLW comfort, considering London’s existing built environments. Substantial research to date has delved into assessing building performance in terms of PLWs; however, these studies are constrained by several limitations, such as considerations that only extend to building geometries in isolated conditions [8,9,10,11], a primary focus on perpendicular building elevation [8,9,11], a sole focus on urban densities when examining PLWs [12,13,14,15,16,17,18], the high cost associated with recently developed machine learning algorithms, which require substantial amounts of data for training, rendering them impractical for industrial application [19,20,21,22,23,24,25,26,27,28,29], and design guidelines [30] that overlooked existing urban forms that are highly heterogeneous [12,18] as outlined below:
Previous research that has primarily investigated isolated building conditions [8,9,10,11] may not accurately reflect the behaviour of tall buildings within an urban context. Furthermore, while earlier studies have highlighted the potential benefits of factors such as reduced heights, narrower building widths [8], and corner modifications (including corner cut, chamfer, and rounding) [9,31] in improving PLW comfort, these findings were predominantly based on perpendicular façades. Consequently, these conclusions have limited applicability to London’s tall buildings, which exhibit a diverse range of façade angles (e.g., the convex and concave design of The Walkie-talkie, the upwardly tapered Leadenhall Building on 122 Leadenhall Street, and the folding design of The Scalpel on 52 Lime Street) [32]. Various studies to date have also explored urban packing parameters, such as plan area ratio (PAR) [12,13], frontal area ratio (FAR) [14,15,16,17], and façade area ratio [18], which serve as representations of urban conditions, thus helping urban planners to understand the impact of urban density on the overall PLW comfort. These findings suggest that higher PAR and FAR values tend to reduce PLW speeds [12,14]. In particular, the façade area ratio was noted to exert a more significant influence on PLW speeds and comfort than the maximum building height and standard deviation of building heights, although the applicability of this parameter decreases when several urban sites have similar façade area ratios [18]. While these urban parameters have some values in terms of aiding planners, they cannot be used to examine local PLWs around a building [18] or assess the complicated aerodynamic interactions between the varying geometries of tall buildings and their neighbouring buildings; they can only give a general representation of the likely windiness of an urban context. In addition, when two different urban forms (with varying façade angles, building heights, and open area ratios [OAR] (the OAR is the ratio of open area that is not covered by the built environment divided by the total area of the site)) have similar PARs, FARs, and façade area ratios, those urban density parameters often fail to effectively indicate which urban configuration would yield better PLW comfort [18].
More recent data-driven approaches, such as conditional generative adversarial networks (cGANs) [19], reduced-order modelling (ROM), intrusive ROM (IROM), non-intrusive ROM (NIROM) [20,21,22,23], linear regression [24,25], non-linear regression [25,26], random forest [24,25], and artificial neural network (ANN) [27], could eventually replace complex high-order numerical simulations to provide near real-time flow simulations for architects and urban planners. Additionally, a “physics-informed graph neural network (GNN)-assisted auto-encoder” [28] could innovatively enhance the use of sparse sensors by rebuilding wind fields with complex, high-resolution features in urban areas [28]. However, these methods remain impractical at present due to the limited availability of training data [28], extensive data acquisition time, and the need to train the models for specific problems [20,29].
Furthermore, the current design guidelines for architects [30] intended to improve PLW comfort in buildings and urban environments overlook the complexities of existing urban environments [12,18], thus leading to a discernible scarcity of actionable reference design directives that architects can apply when incorporating PLW considerations into their tall building designs.
To bridge the gaps identified in the previous studies, this research performed several comparative analyses between isolated building conditions and existing urban built environments. By comparing the two, the performance of tall buildings—(to date, there is a lack of a universal definition for a tall building [1]; this research focused on buildings that are 100 tall or taller)—in urban conditions can be better explained. An isolated building condition is considered to be a pure aerodynamic condition where the target tall building is unaffected by the surrounding built environment [33]. A total of thirty-eight tall building geometries based on London’s existing tall buildings were tested under isolated conditions [33]. Among them, the best and worst buildings (i.e., those that cause maximum decrease and increase in PLW speeds among others, respectively) were chosen, and these configurations were then tested in conditions that were representative of existing urban patches in London, together with a base line (cuboid) building. Note that the performance of buildings in isolated conditions is well-described in [33]. This paper focuses on how the best- and worst- performing buildings, identified under isolated conditions, perform in urban conditions [33]. This research also presents an integrated examination of PLWs, considering both building geometry-related and urban form-related parameters. The building parameters analysed in this study include the building façade angle, corner design, and height, while OAR was chosen as the urban parameter. Computational fluid dynamics (CFD) was used as the main method of analysis, which was verified using a sensitivity study [33] and validated against field measurements. Finally, this study proposes a set of design recommendations for tall buildings that harness the newly acquired insights to provide recommendations for architects to enhance PLW comfort across London’s existing urban fabric.

2. Methodology

2.1. Computational Fluid Dynamics

2.1.1. Test Geometries

A total of thirty-eight building geometries, based on London’s popular existing tall building forms, were tested under isolated conditions on whether each geometry causes relative increase or decrease in PLW speeds [33]. The best building geometry (i.e., the greatest observed decreases in PLW speeds) and worst building geometry (i.e., the greatest observed increase in PLW speeds) were selected together with a baseline scenario (a cuboid) under isolated conditions, as follows [33]:
  • Baseline—Cuboid:
    This configuration is representative of the most generic and common tall tower design and serves as the baseline for this assessment.
  • Best case—Downward-tapered building with a convex façade:
    This geometry exhibits optimal performance by reducing PLW speeds around the tall building in the absence of contextual geometry [33].
  • Worst case—Upward-tapered with corner chamfers:
    This geometry demonstrates the worst performance due to increasing PLW speeds the most in the absence of contextual geometry [33].
To test these geometries under urban conditions and assess whether they affect PLW positively or negatively, London’s existing typical urban typologies were chosen; the CoL and Canary Wharf were selected, as these areas host the primary concentrations of tall buildings as of 2021 [33]. A comparative analysis of the selected building geometries between isolated and urban conditions was then conducted. The geometries were set up with target buildings at the centre of a circular urban context spanning a 700 m diameter within London’s existing urban environment; the analyses considered the effects of the surrounding environment and avoided artificial winds (as shown in Figure 1). However, only a 200 m diameter area was used for the analyses, which focused exclusively on characterising the flow-field influenced by the target building(s).
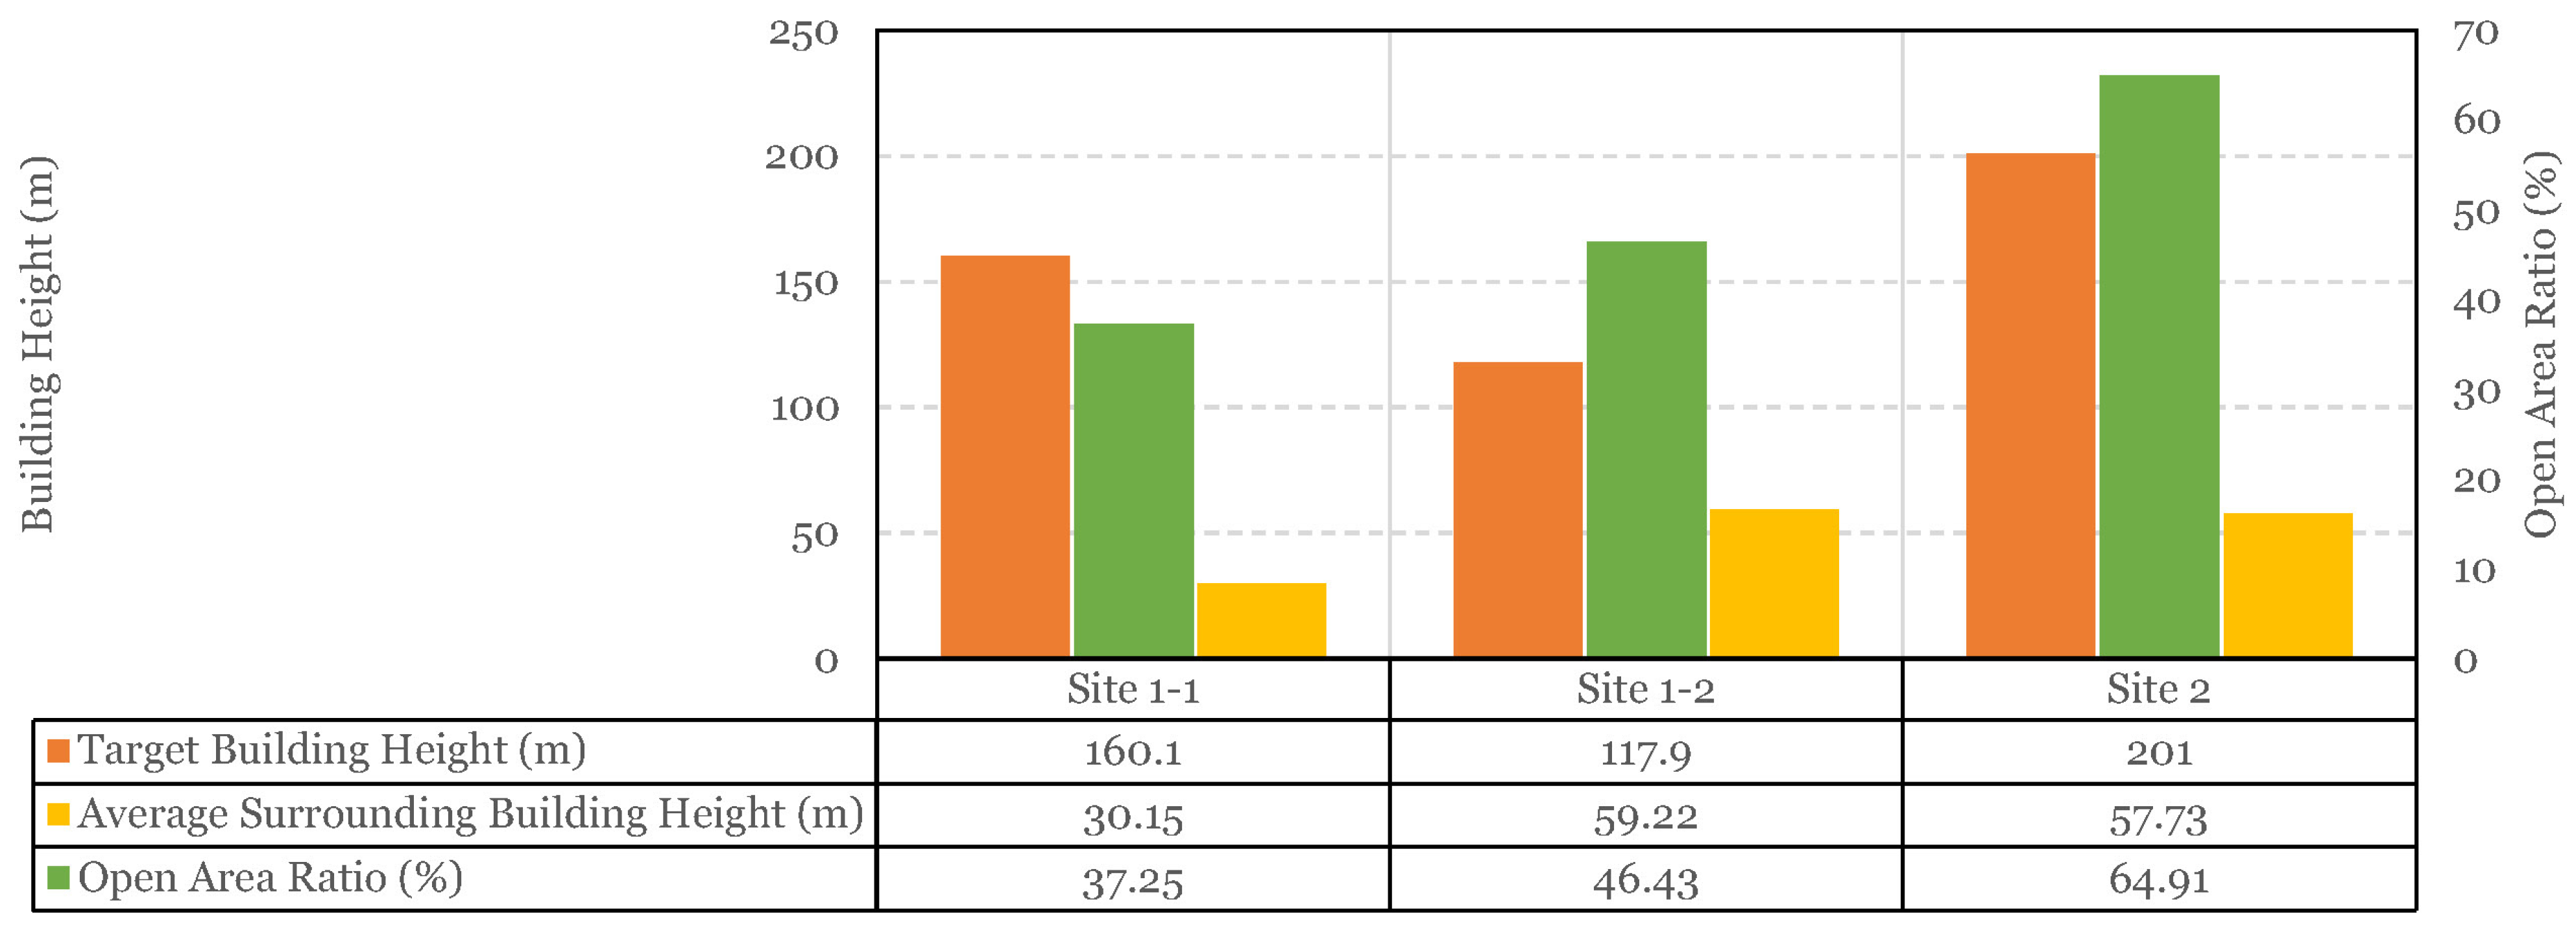
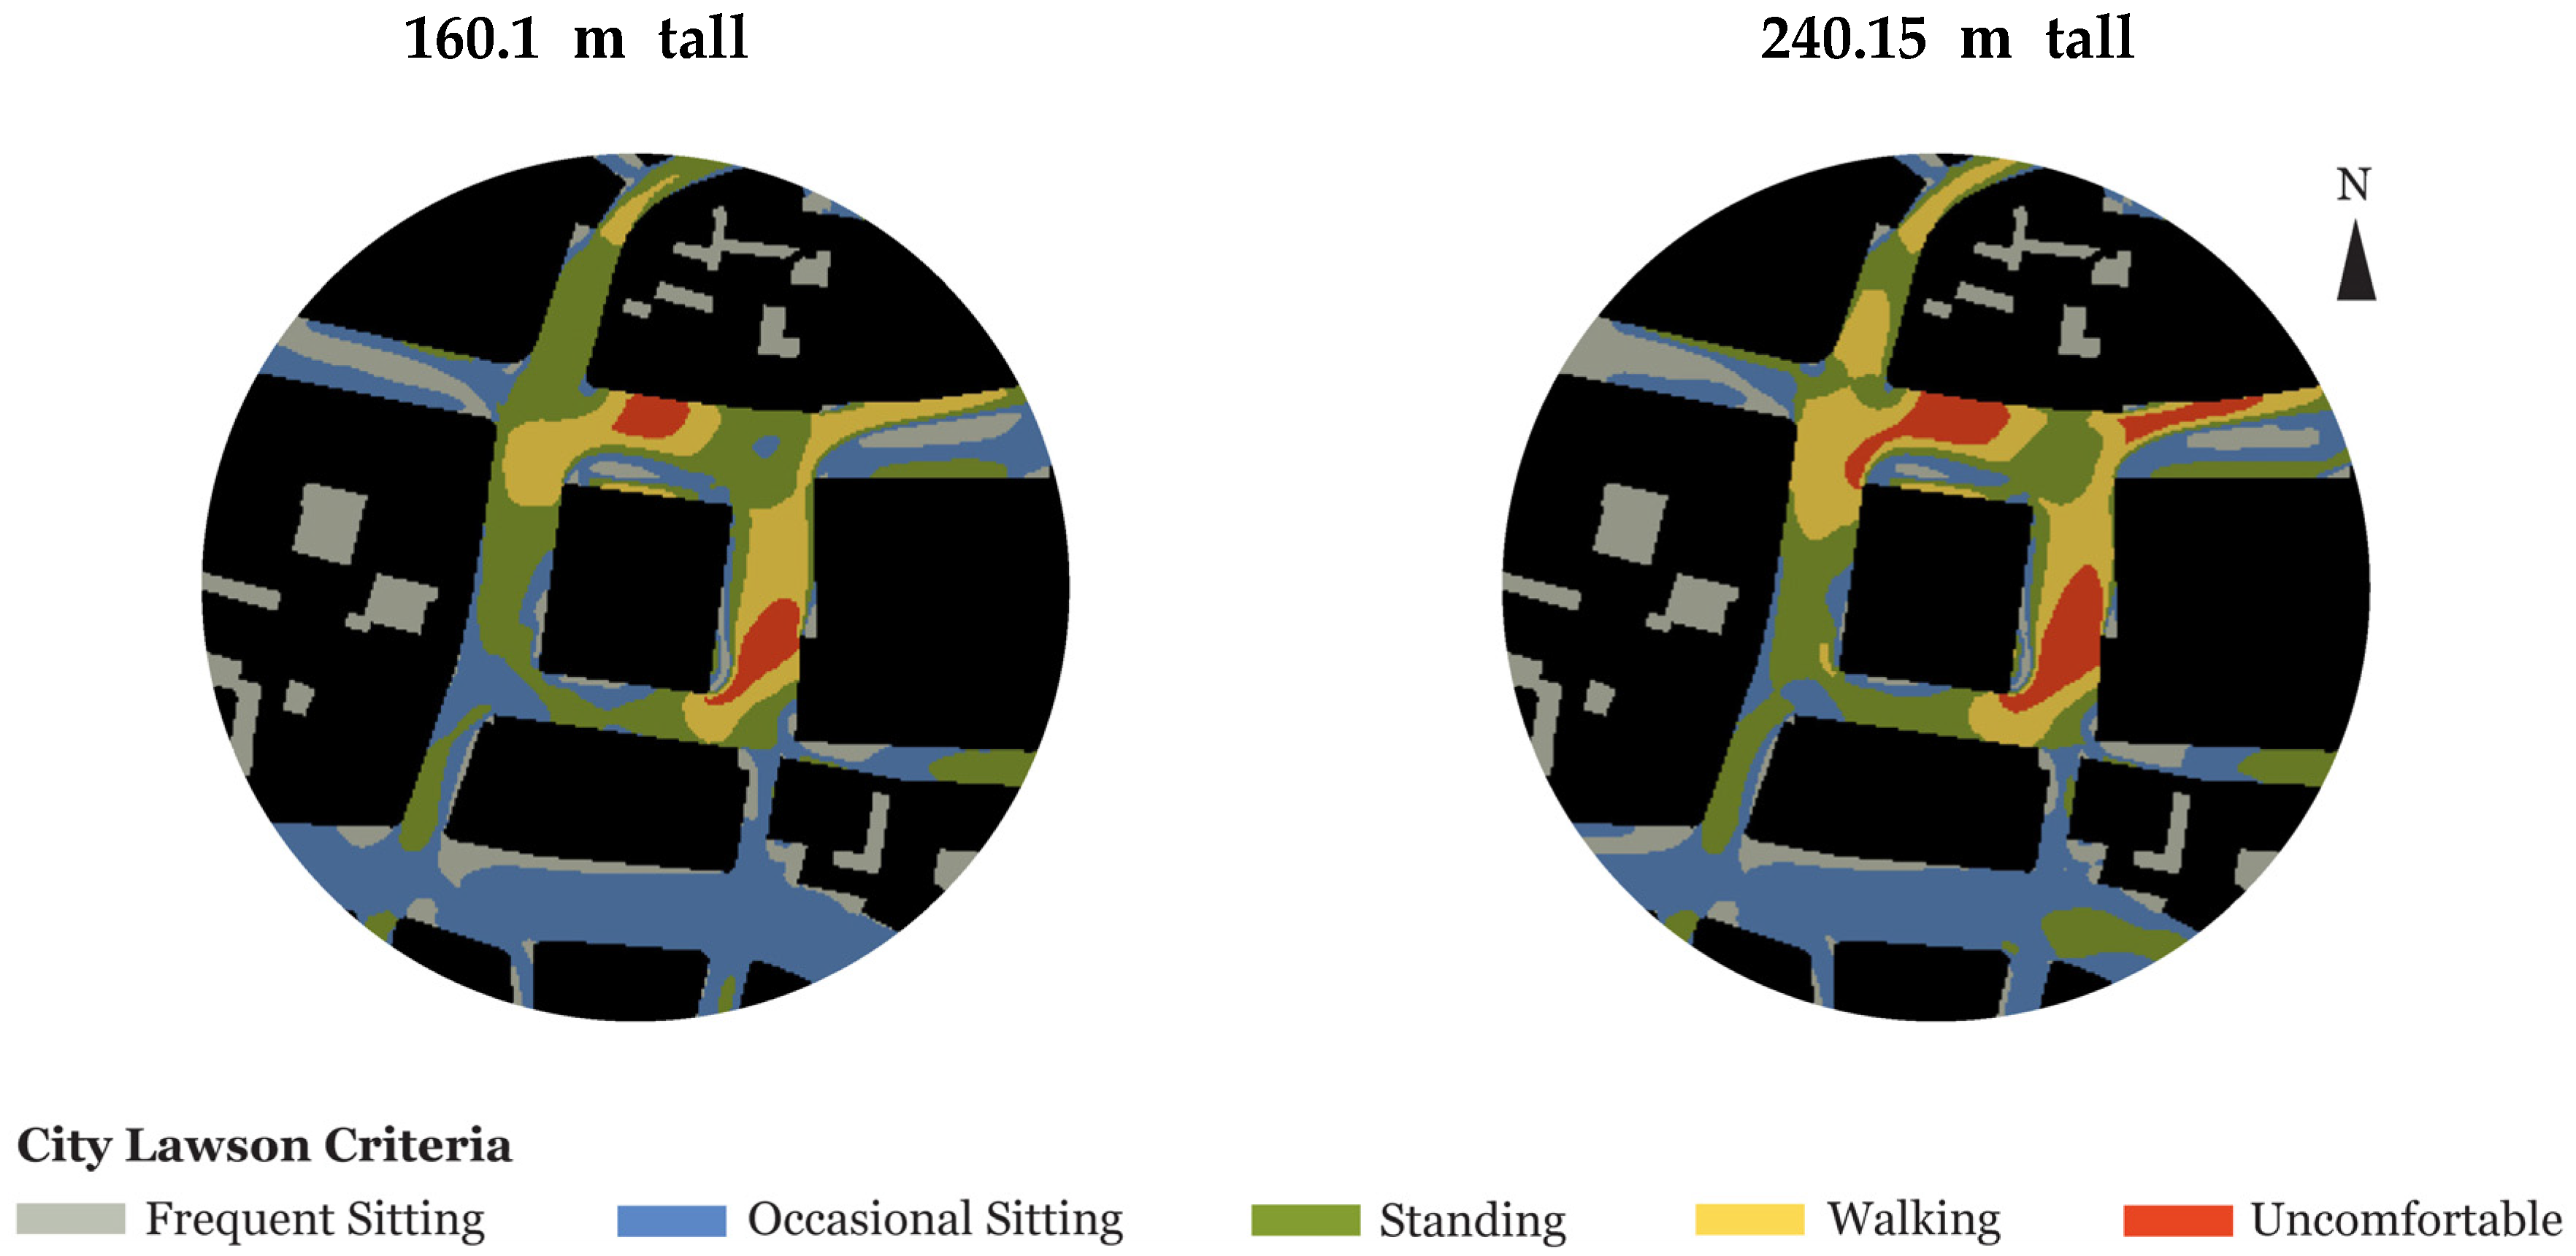
In Figure 1, Site 1-1 is centred at the Walkie-talkie (160.1 m 
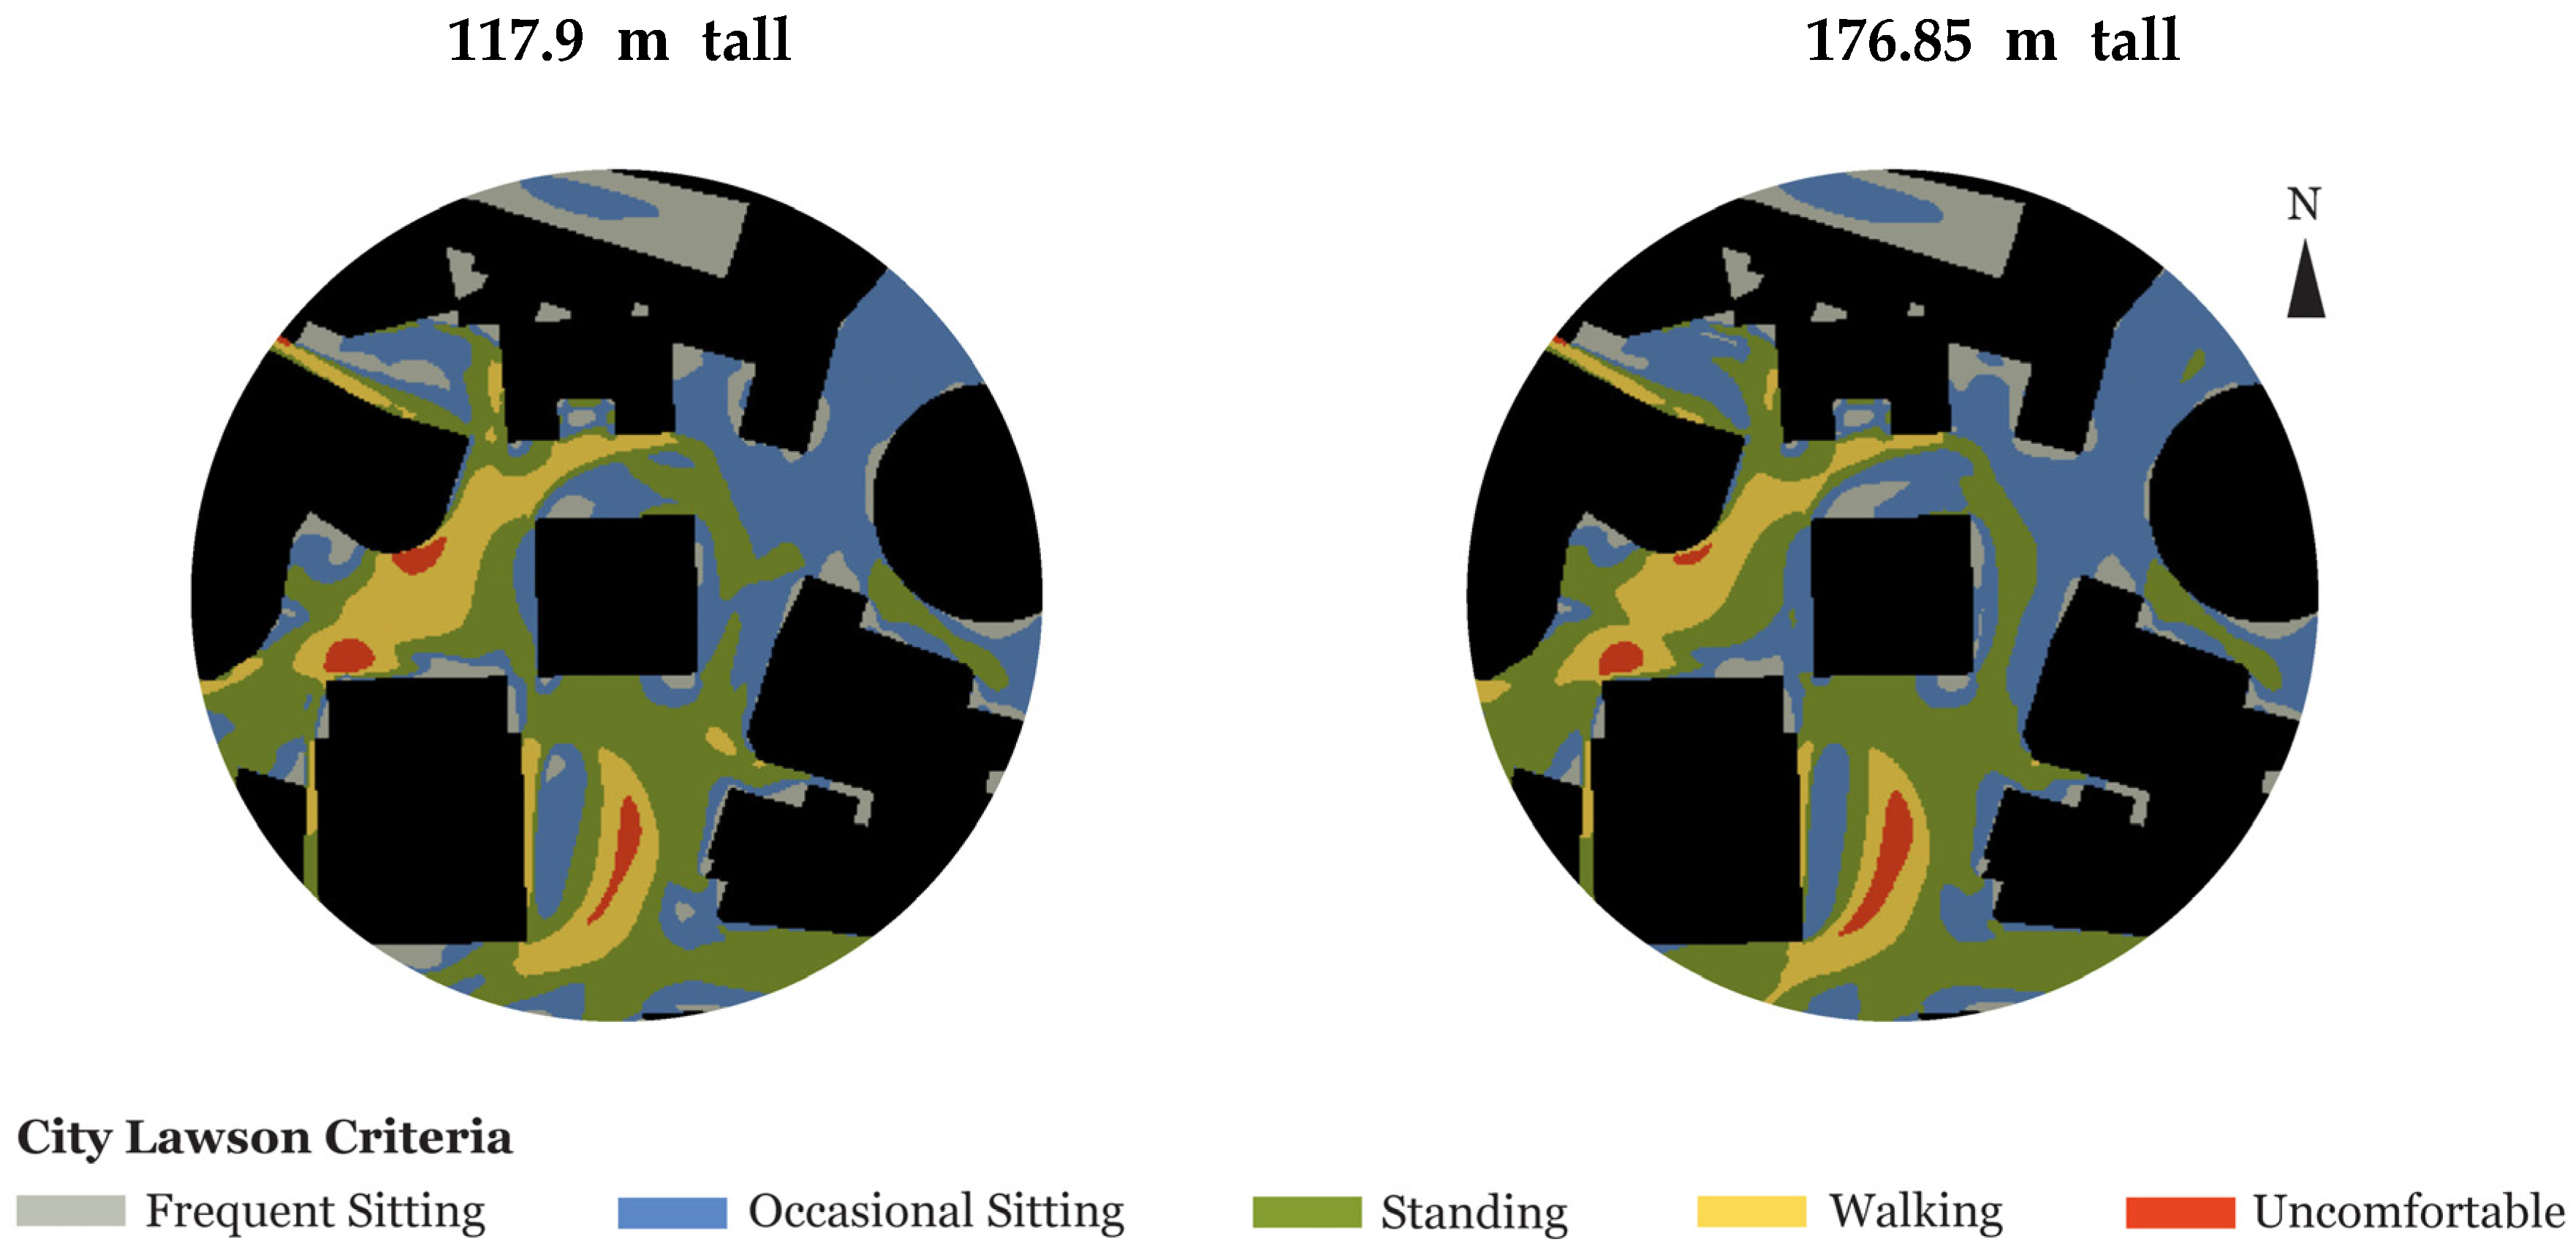
tall building), and it is surrounded by shorter buildings. It is located at 20 Fenchurch Street in the CoL, where streets exhibit curvaceous contours and relatively small open spaces interspersed amidst the buildings. Site 1-2 is centred at the Aviva tower (117.9 m tall building) and is enveloped by taller buildings, including the Leadenhall building (224.0 m tall building), 22 Bishopgate (also called TwentyTwo, 278.2 m tall building), and the Scalpel (190.1 m 
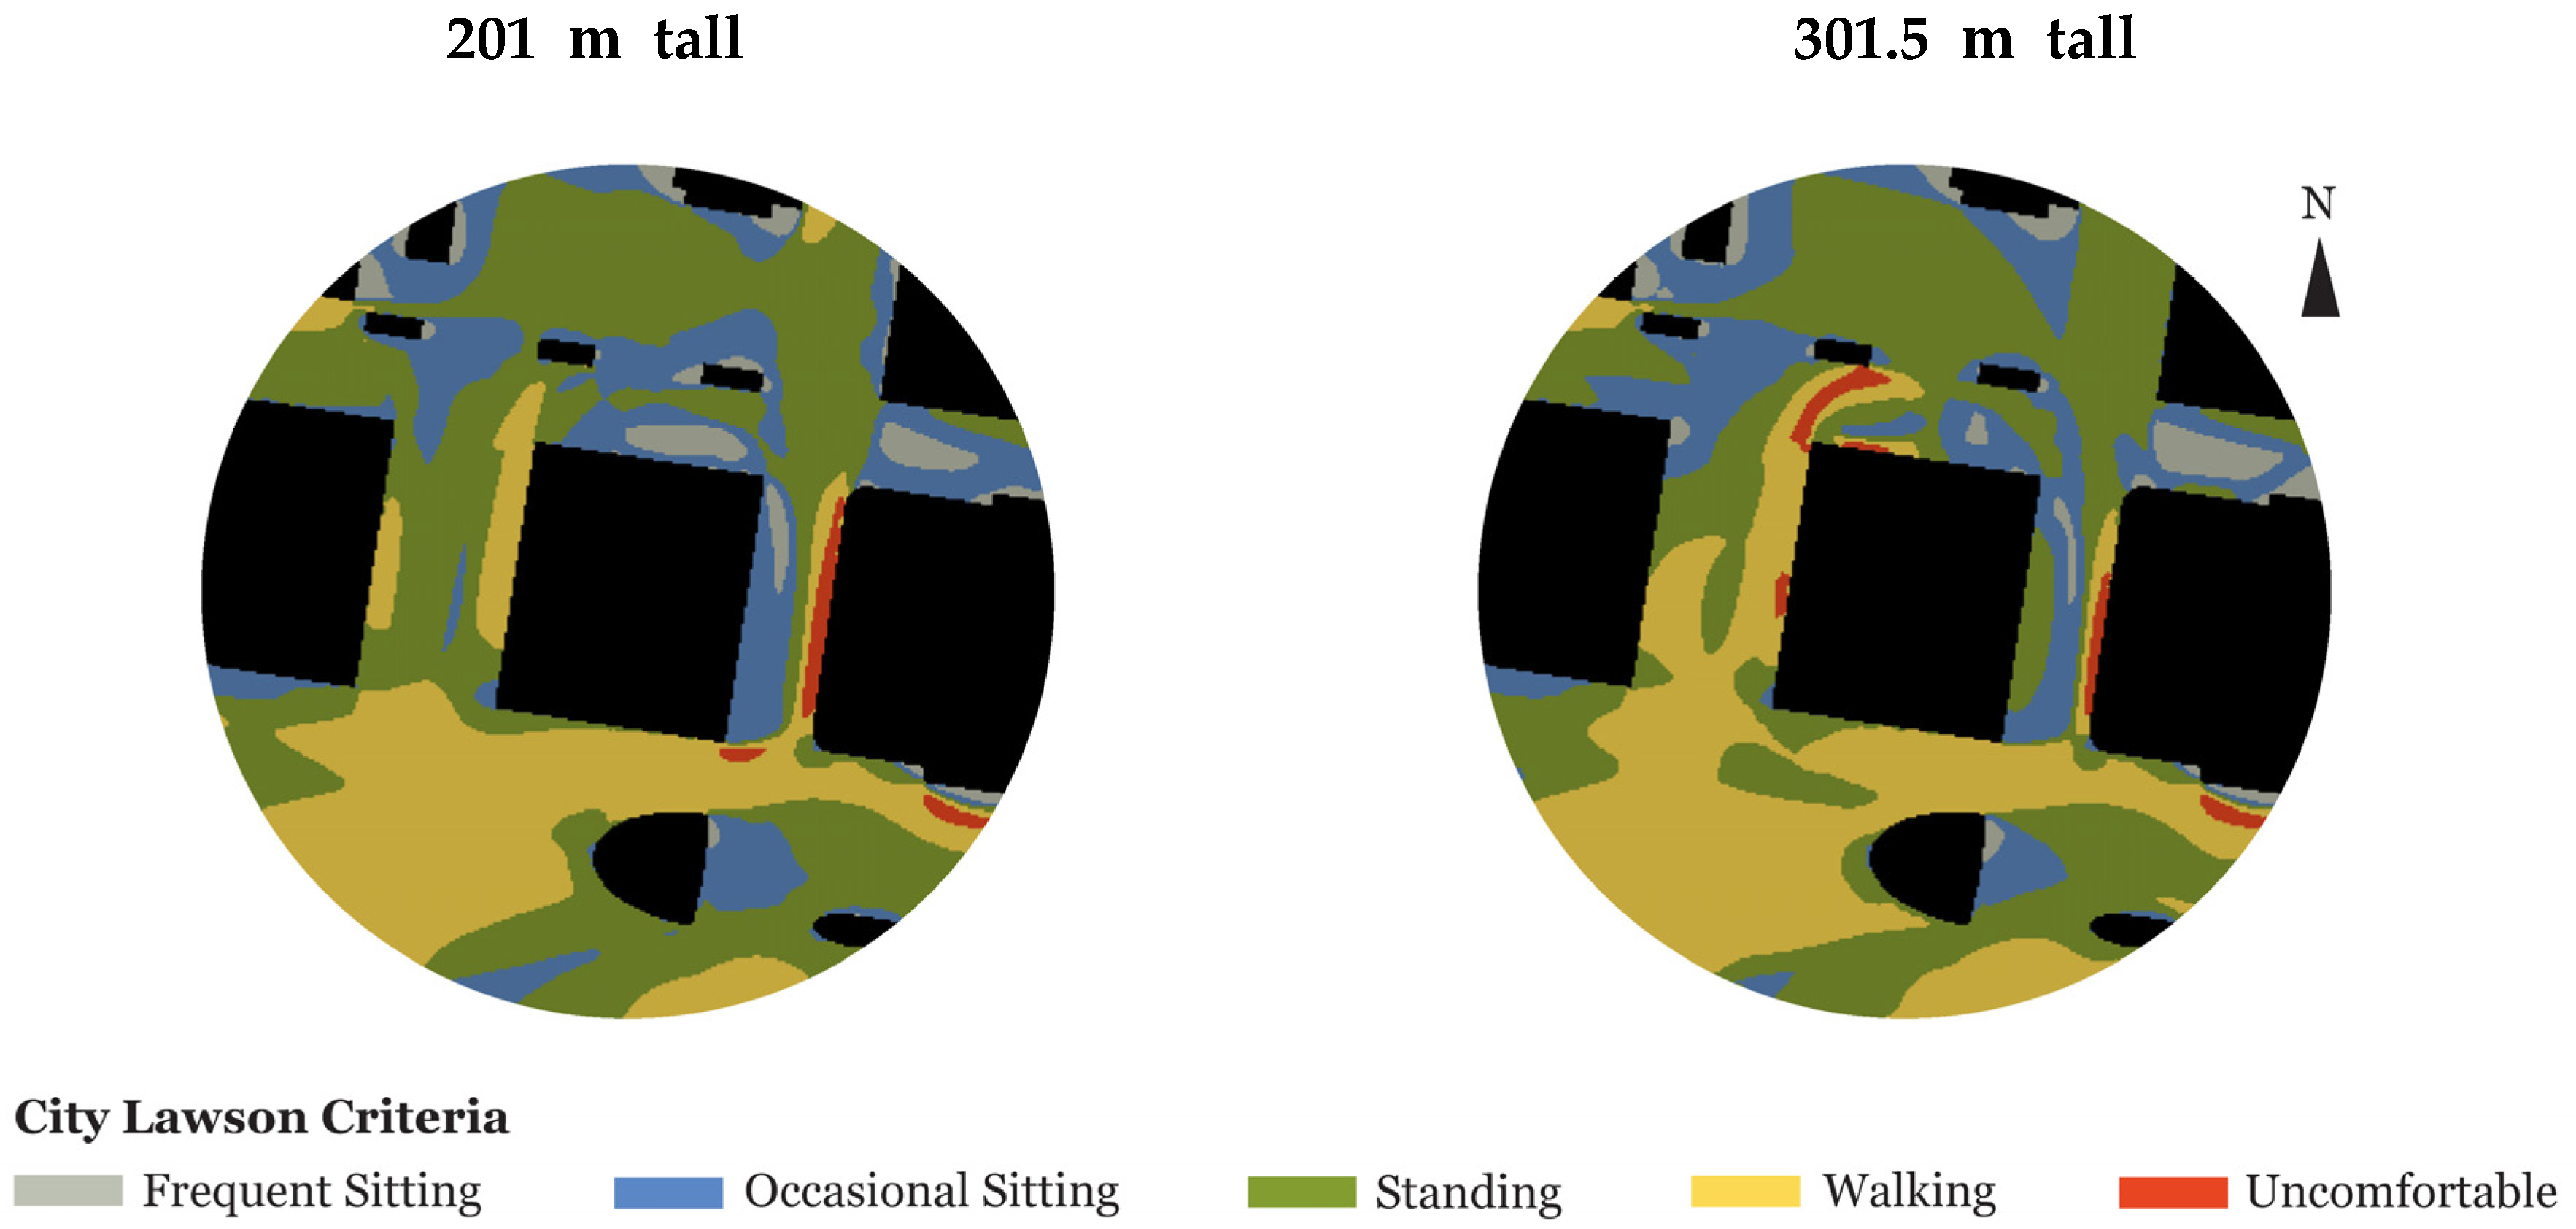
tall building). This site is also situated in the CoL. Site 2 is centred at 25 Canada Square (201 m tall building) and is surrounded by mid- to high-rise buildings. The layout in this location, situated in Canary Wharf, is characterised by a grid-like structure with more open spaces than the CoL.
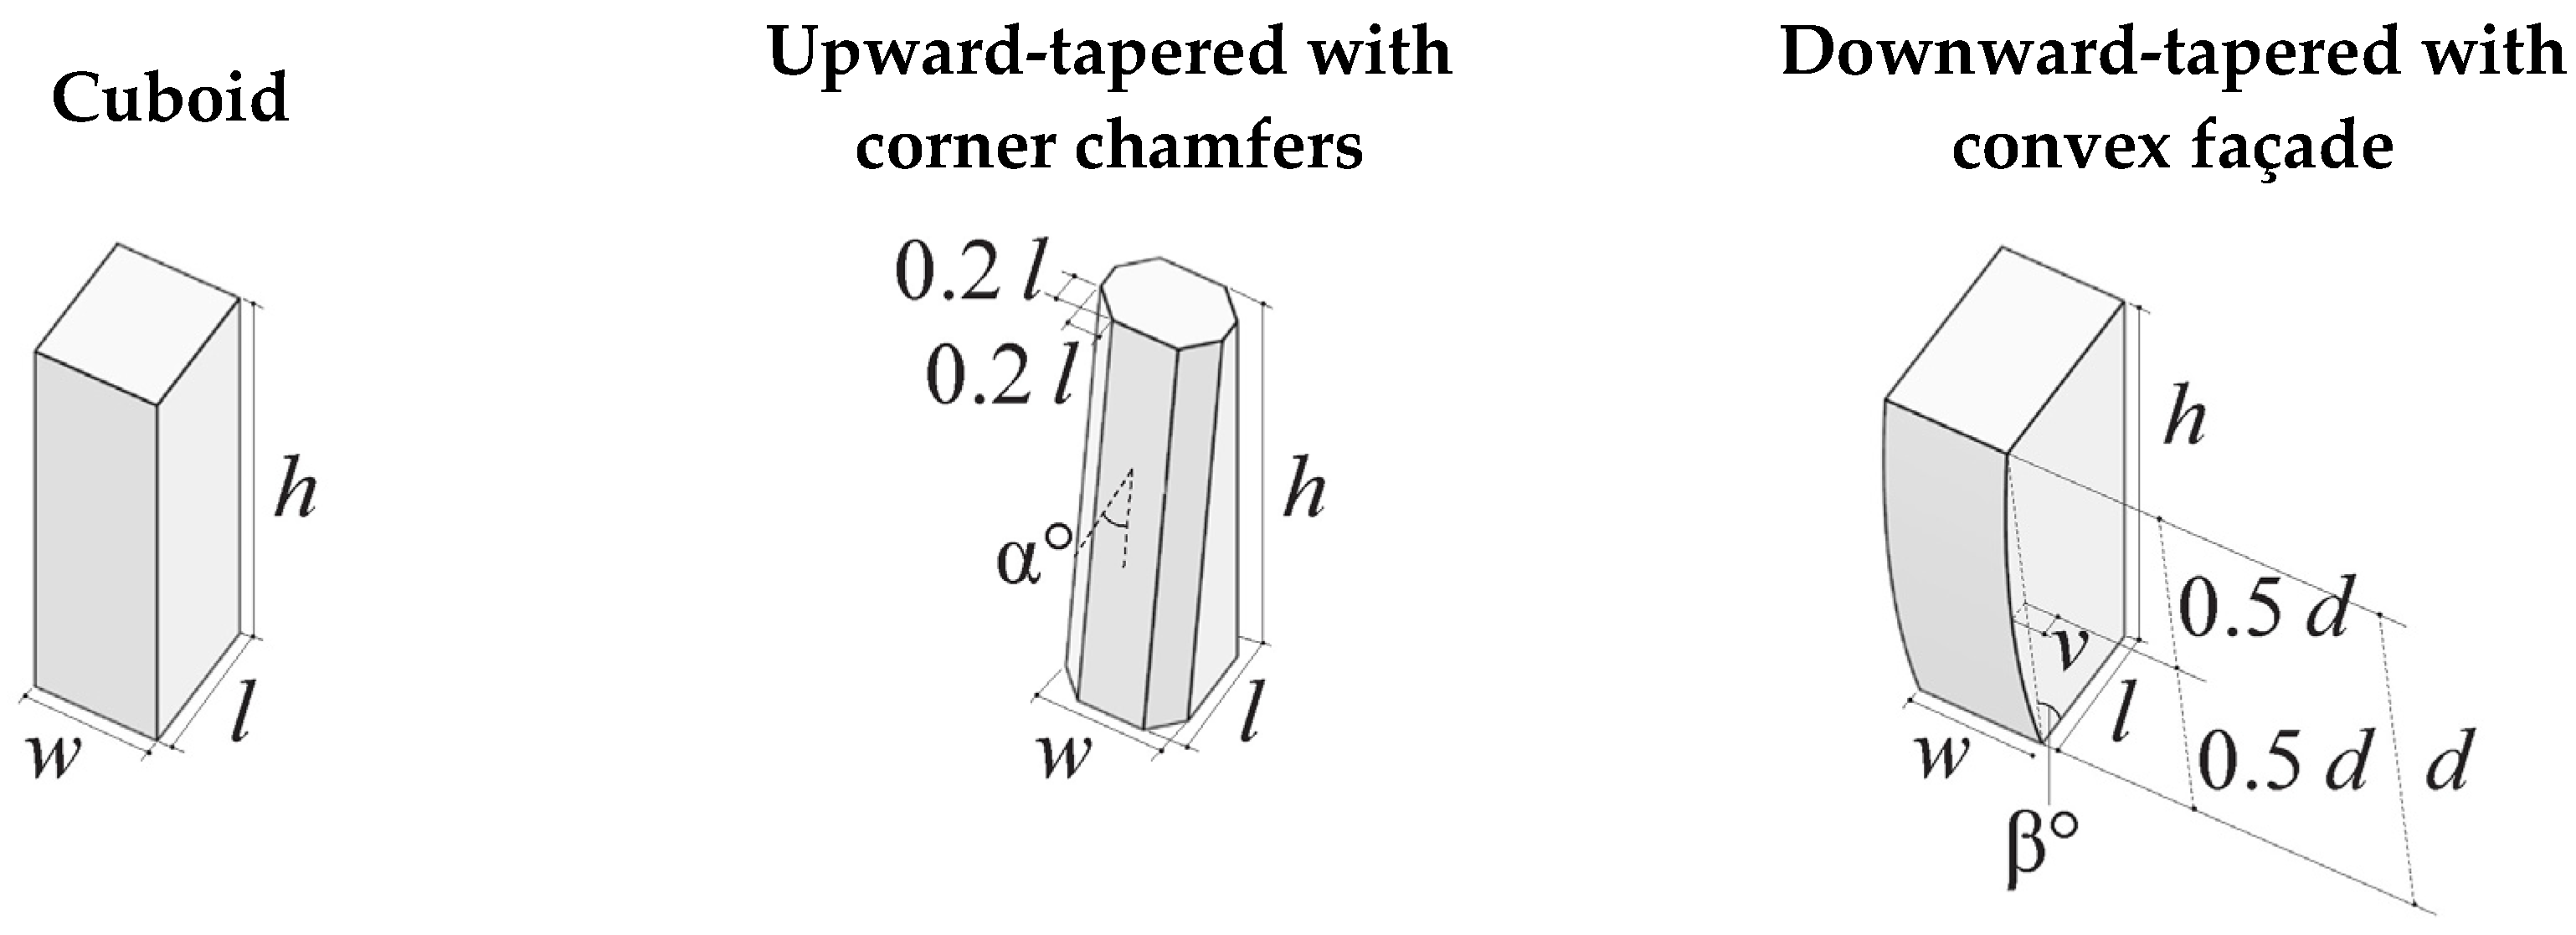
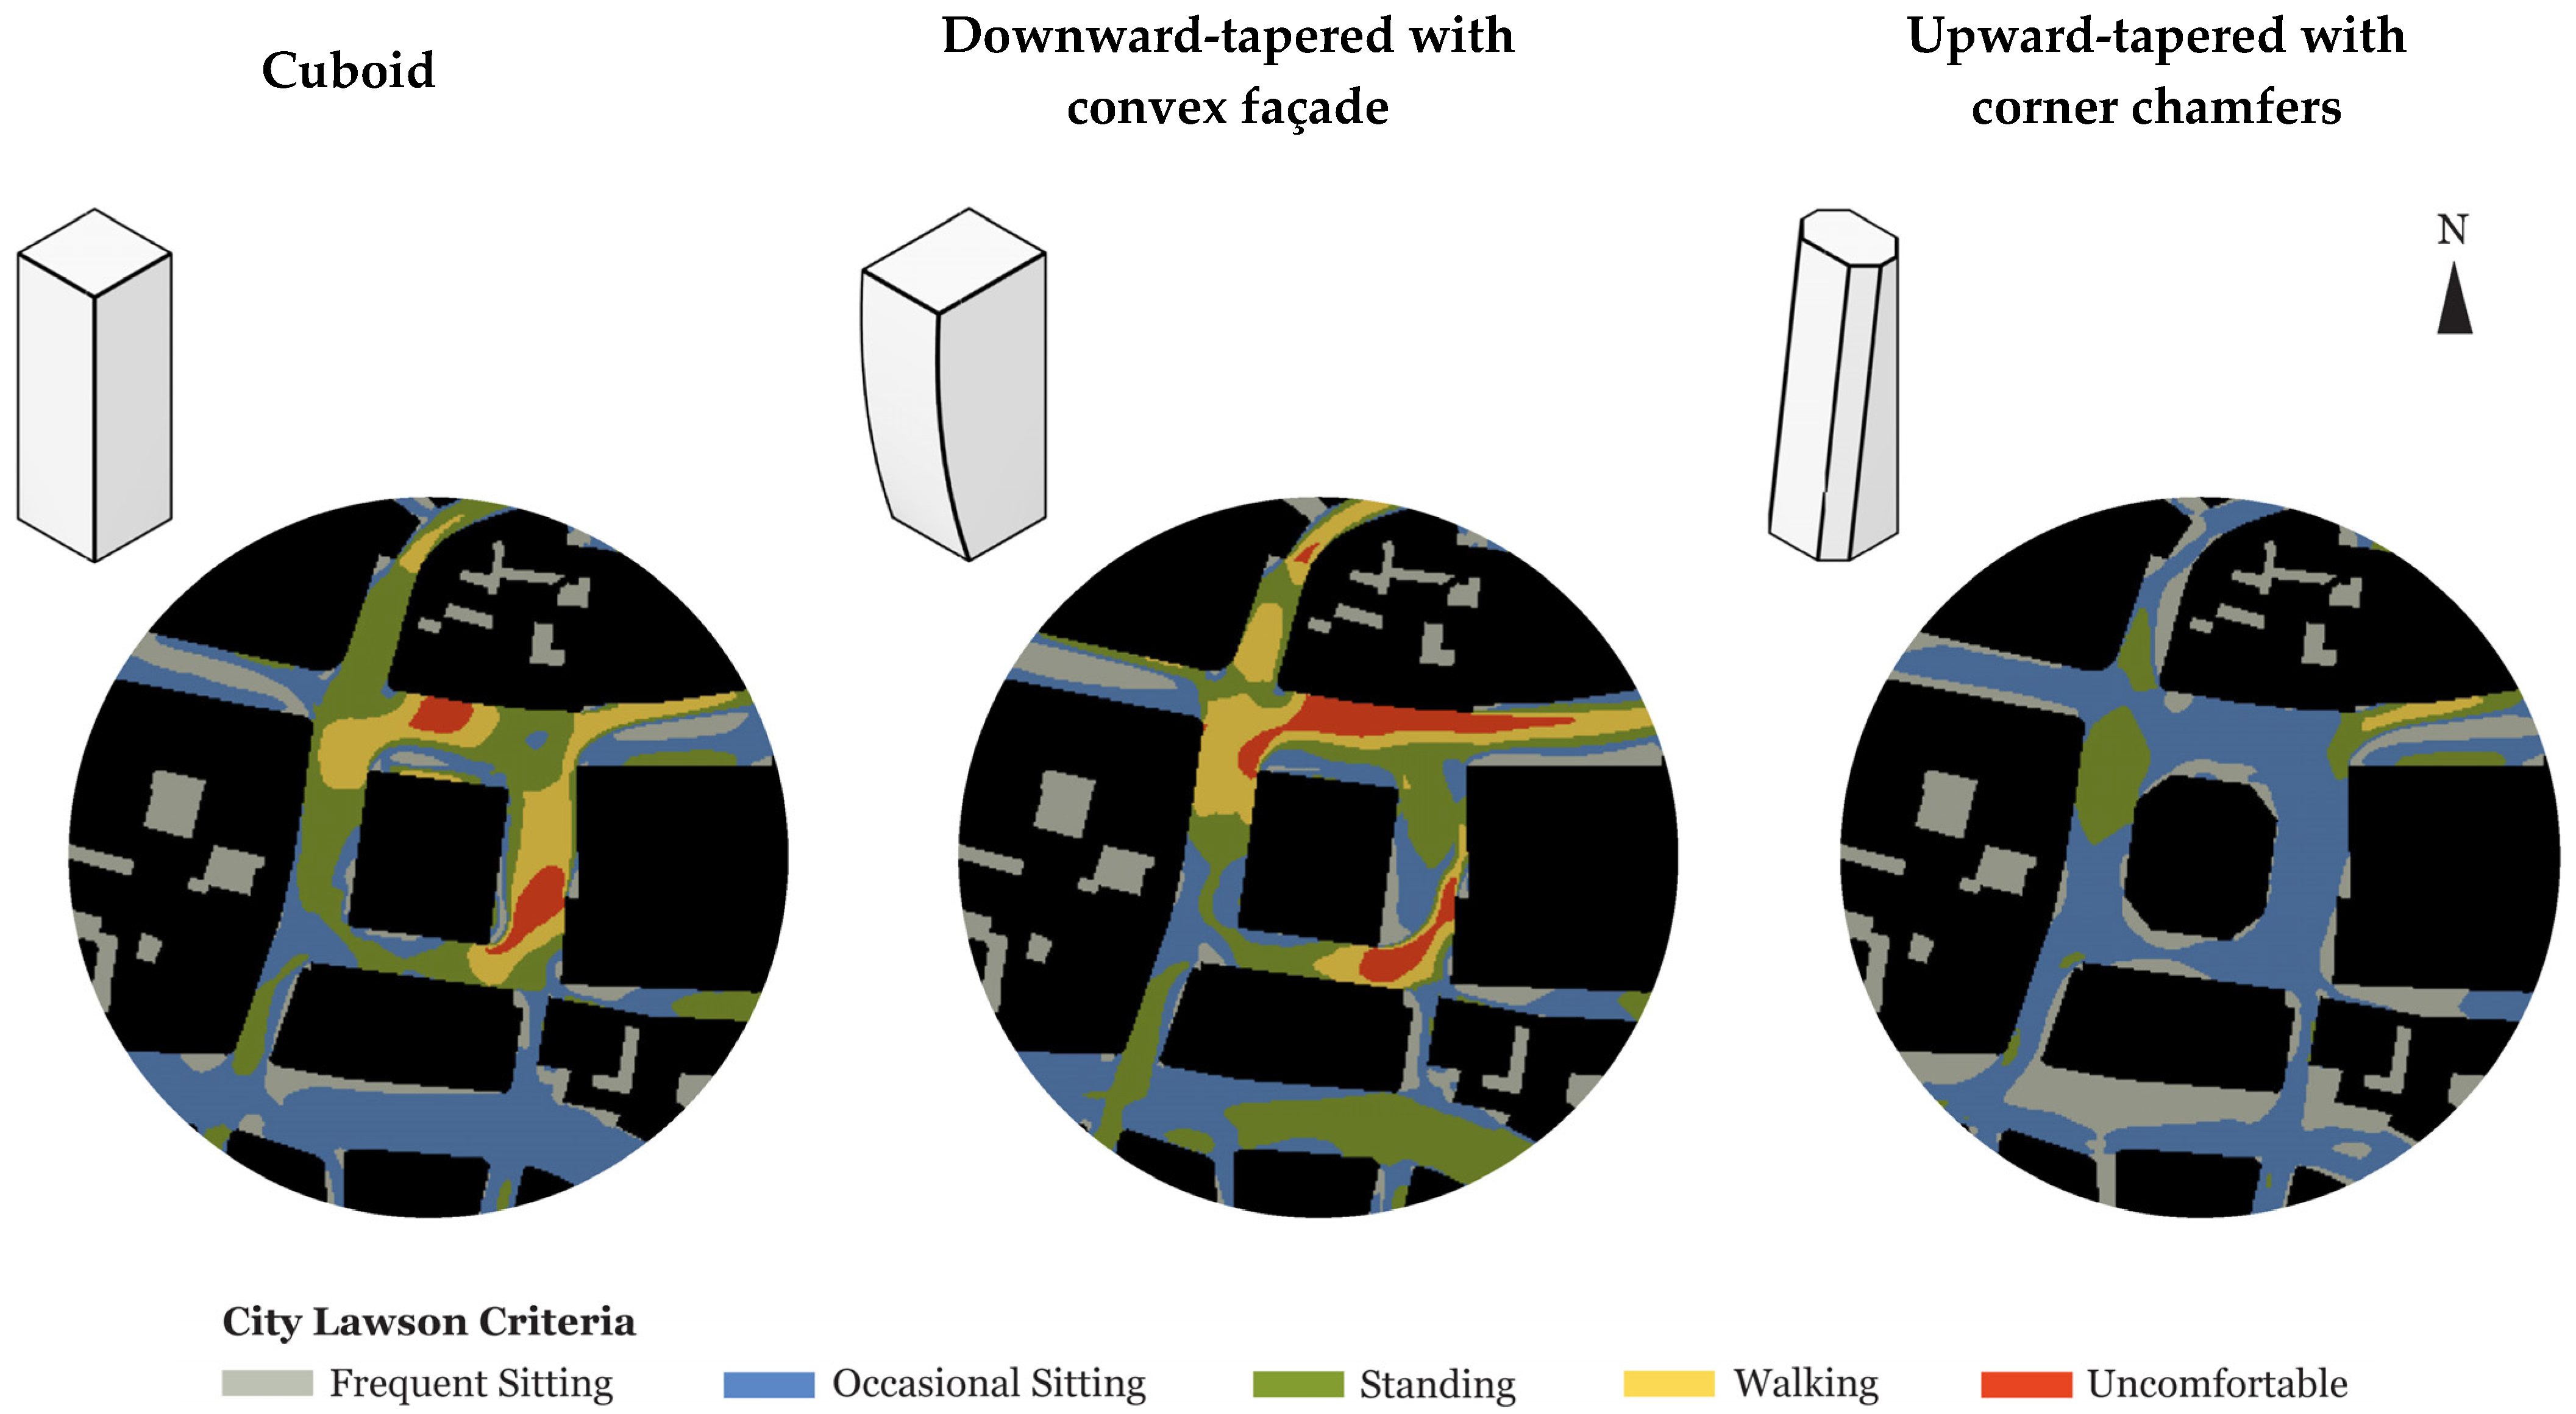
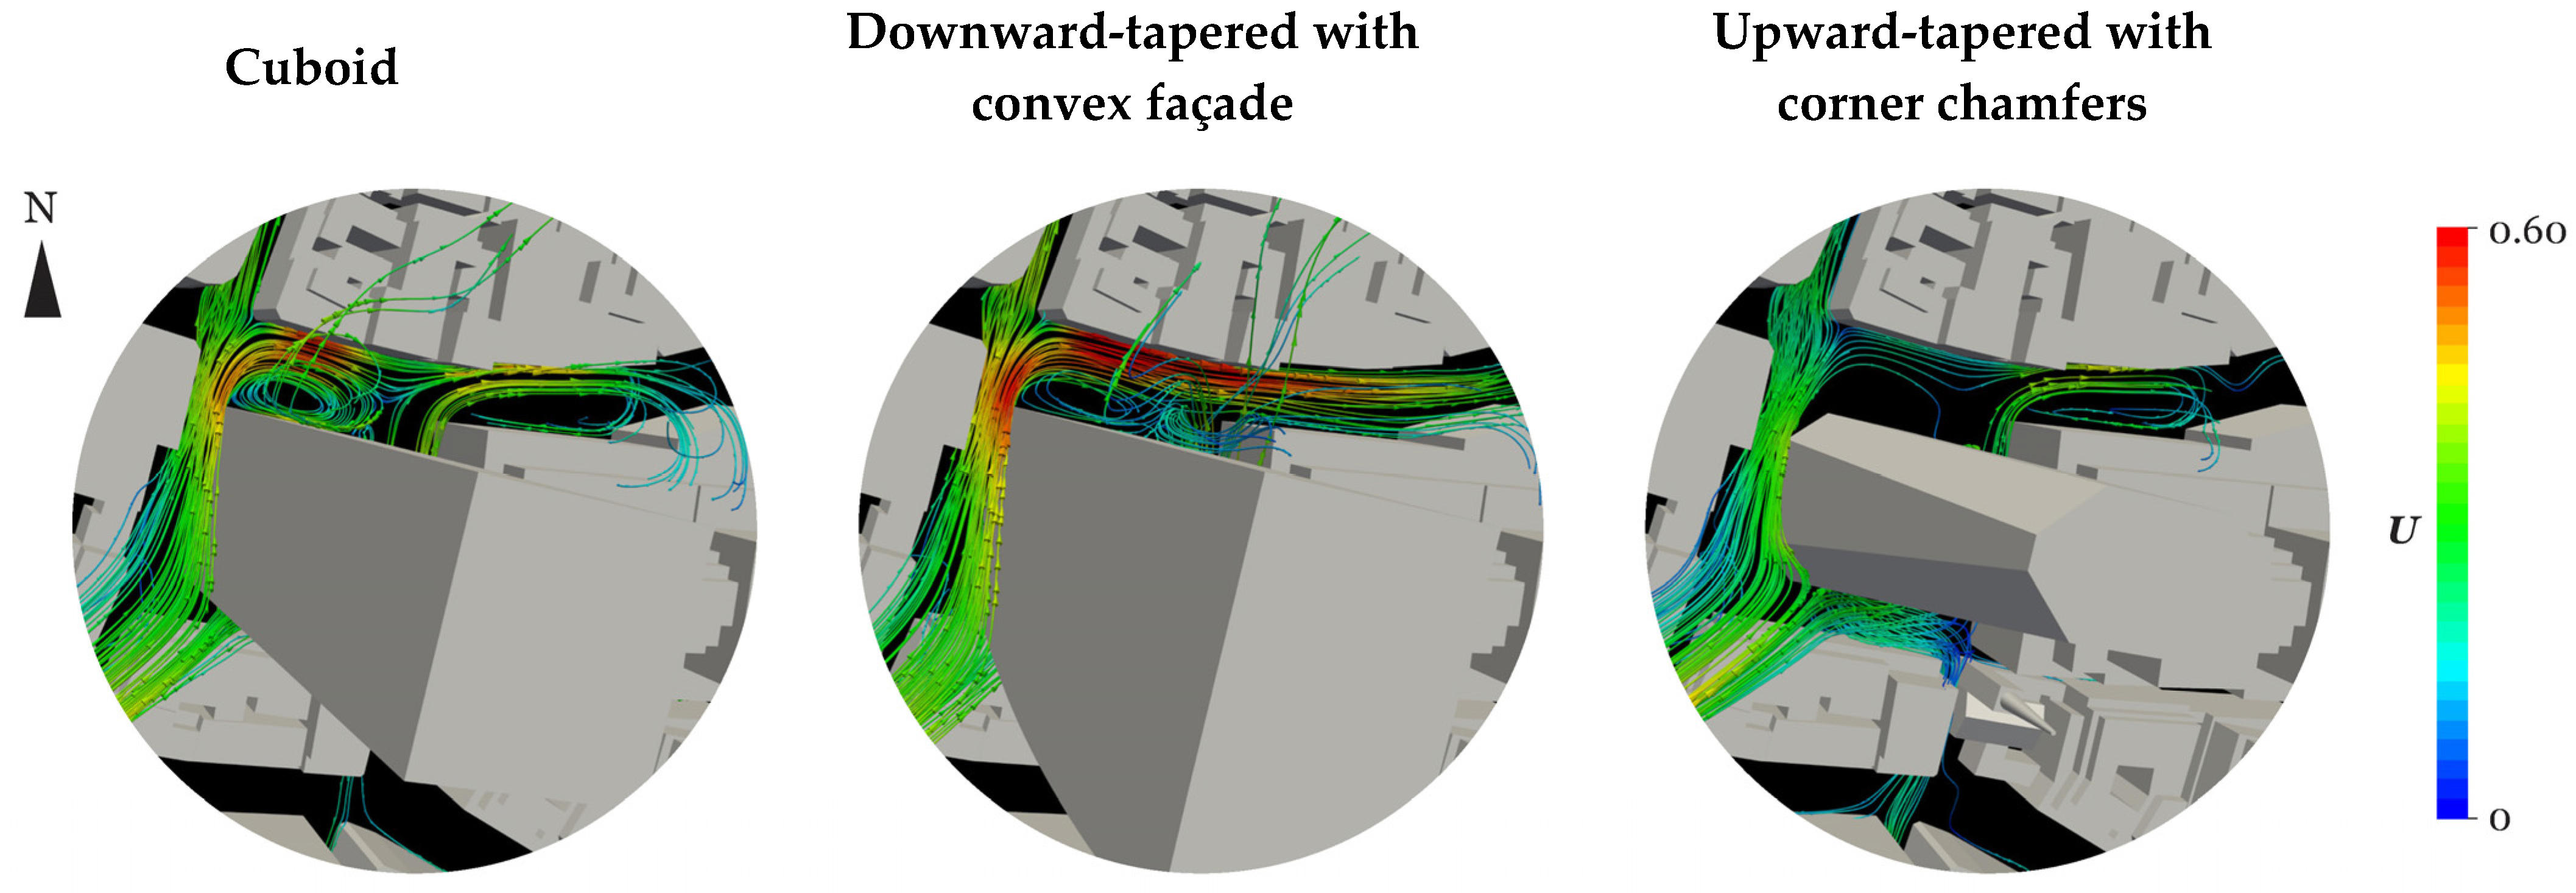
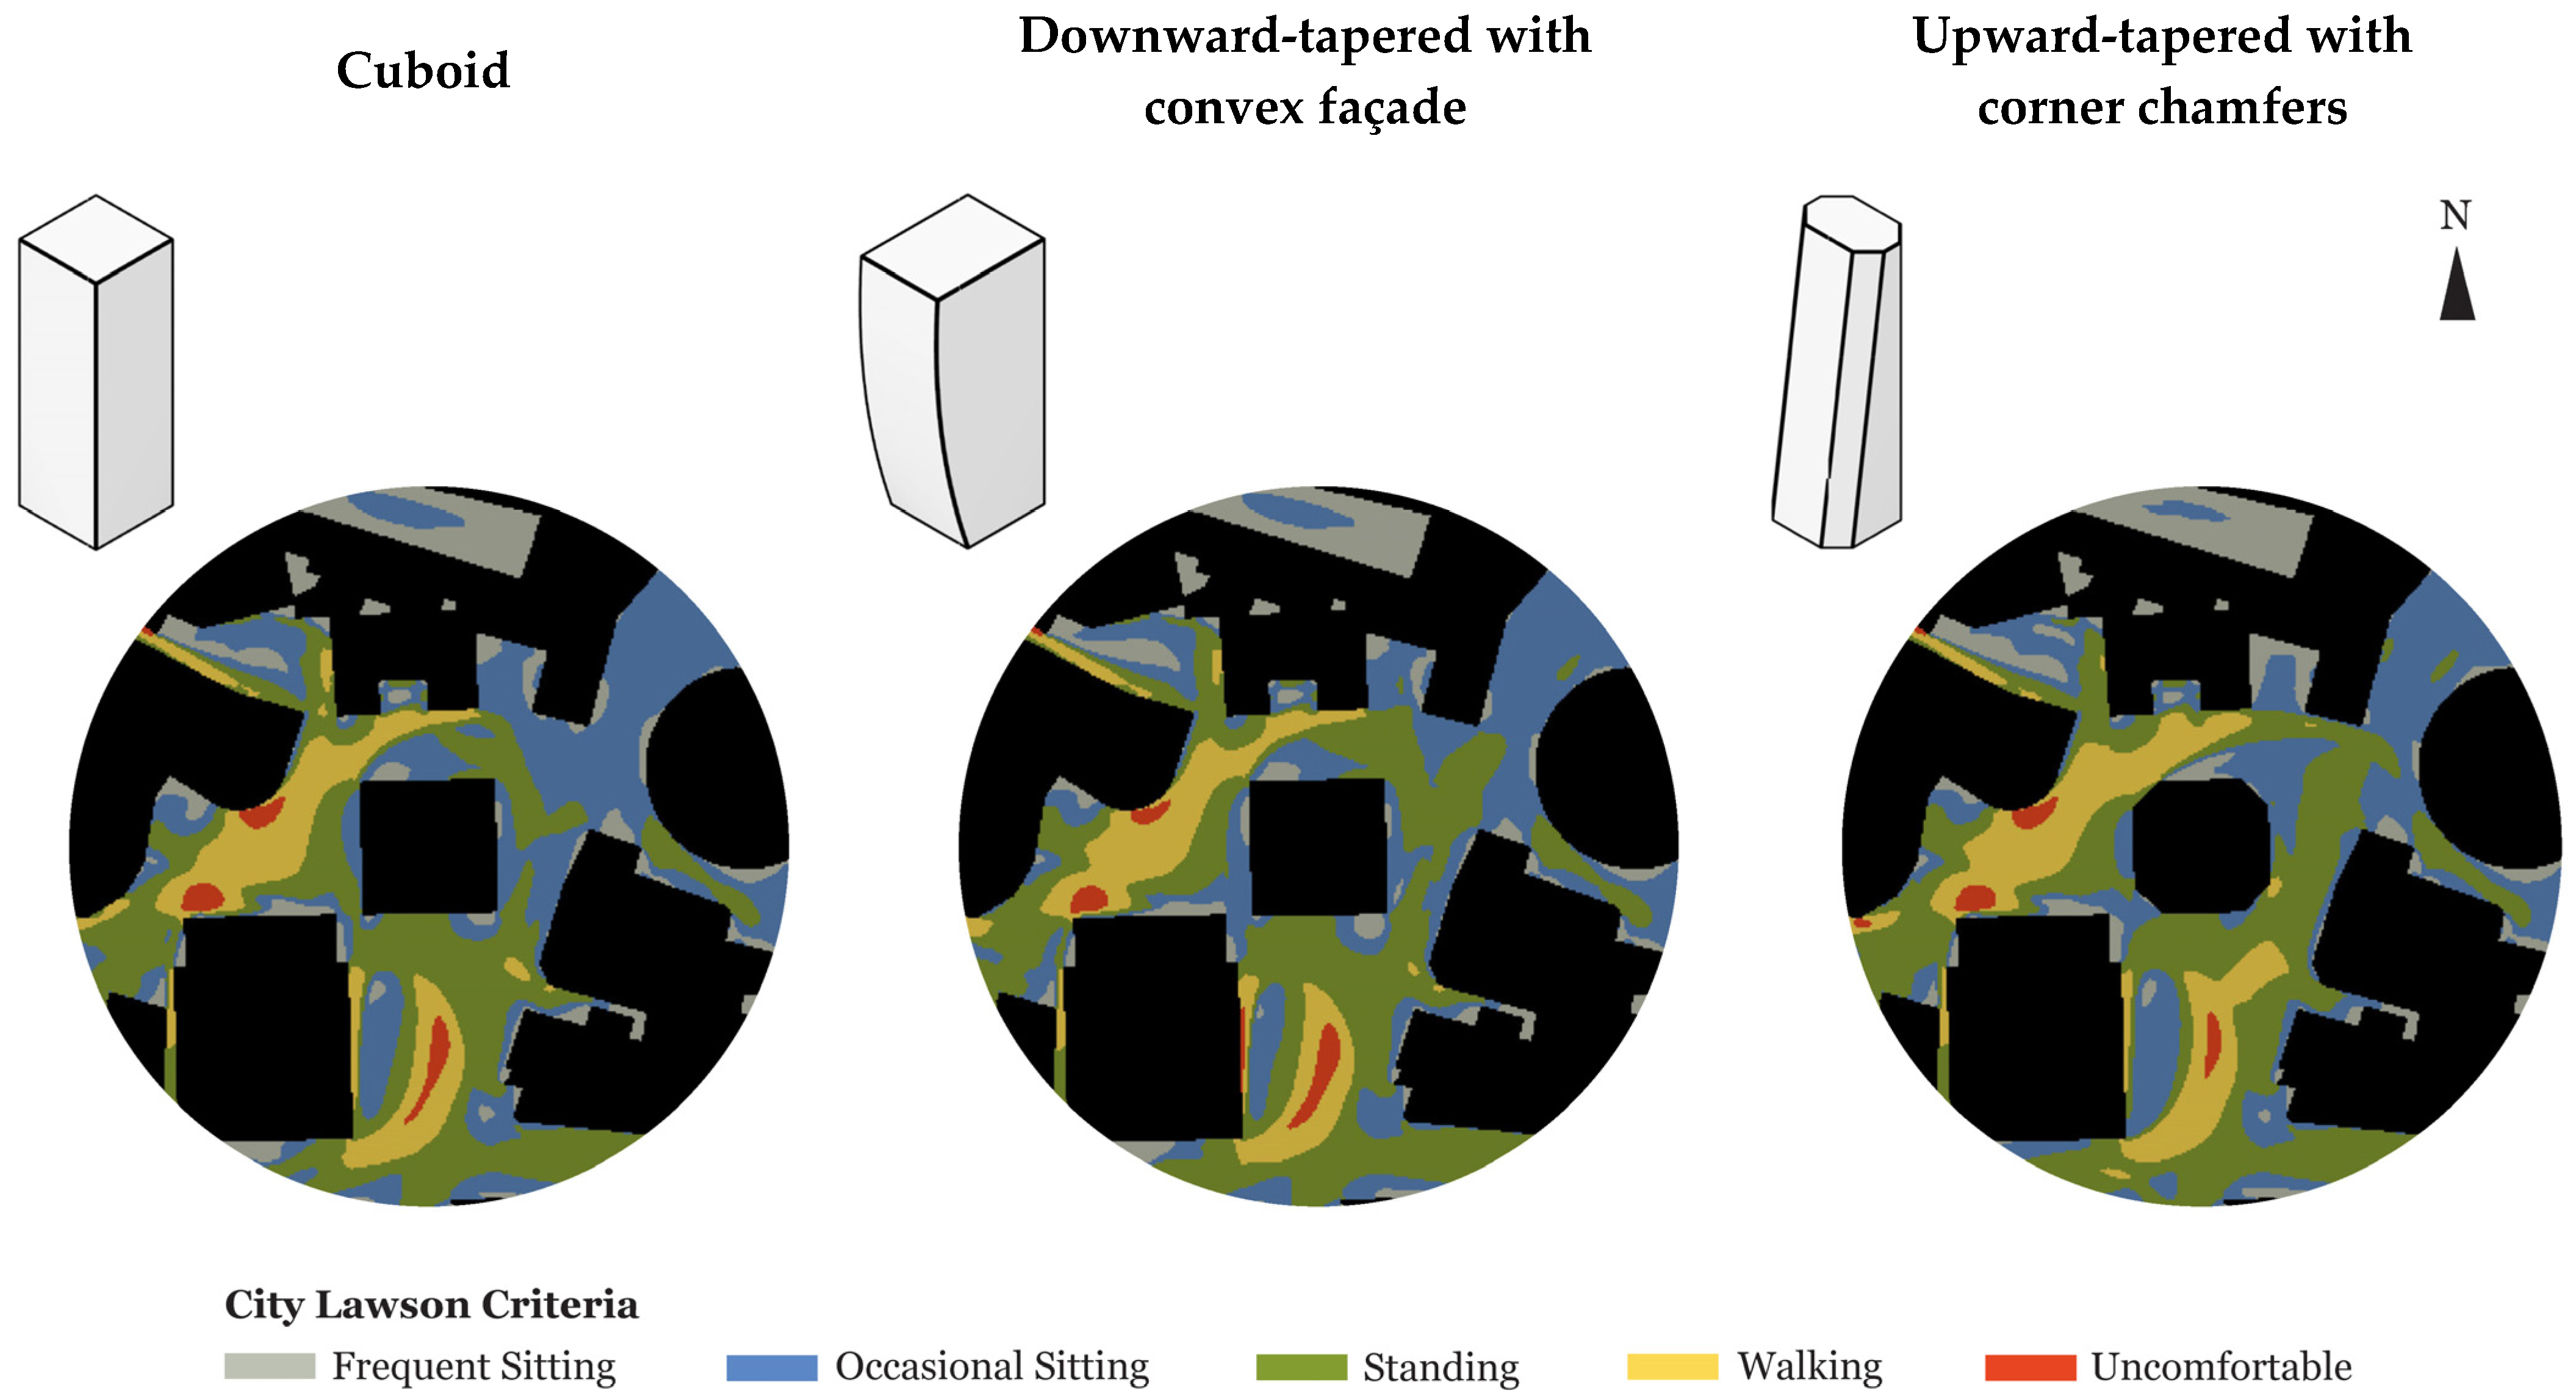
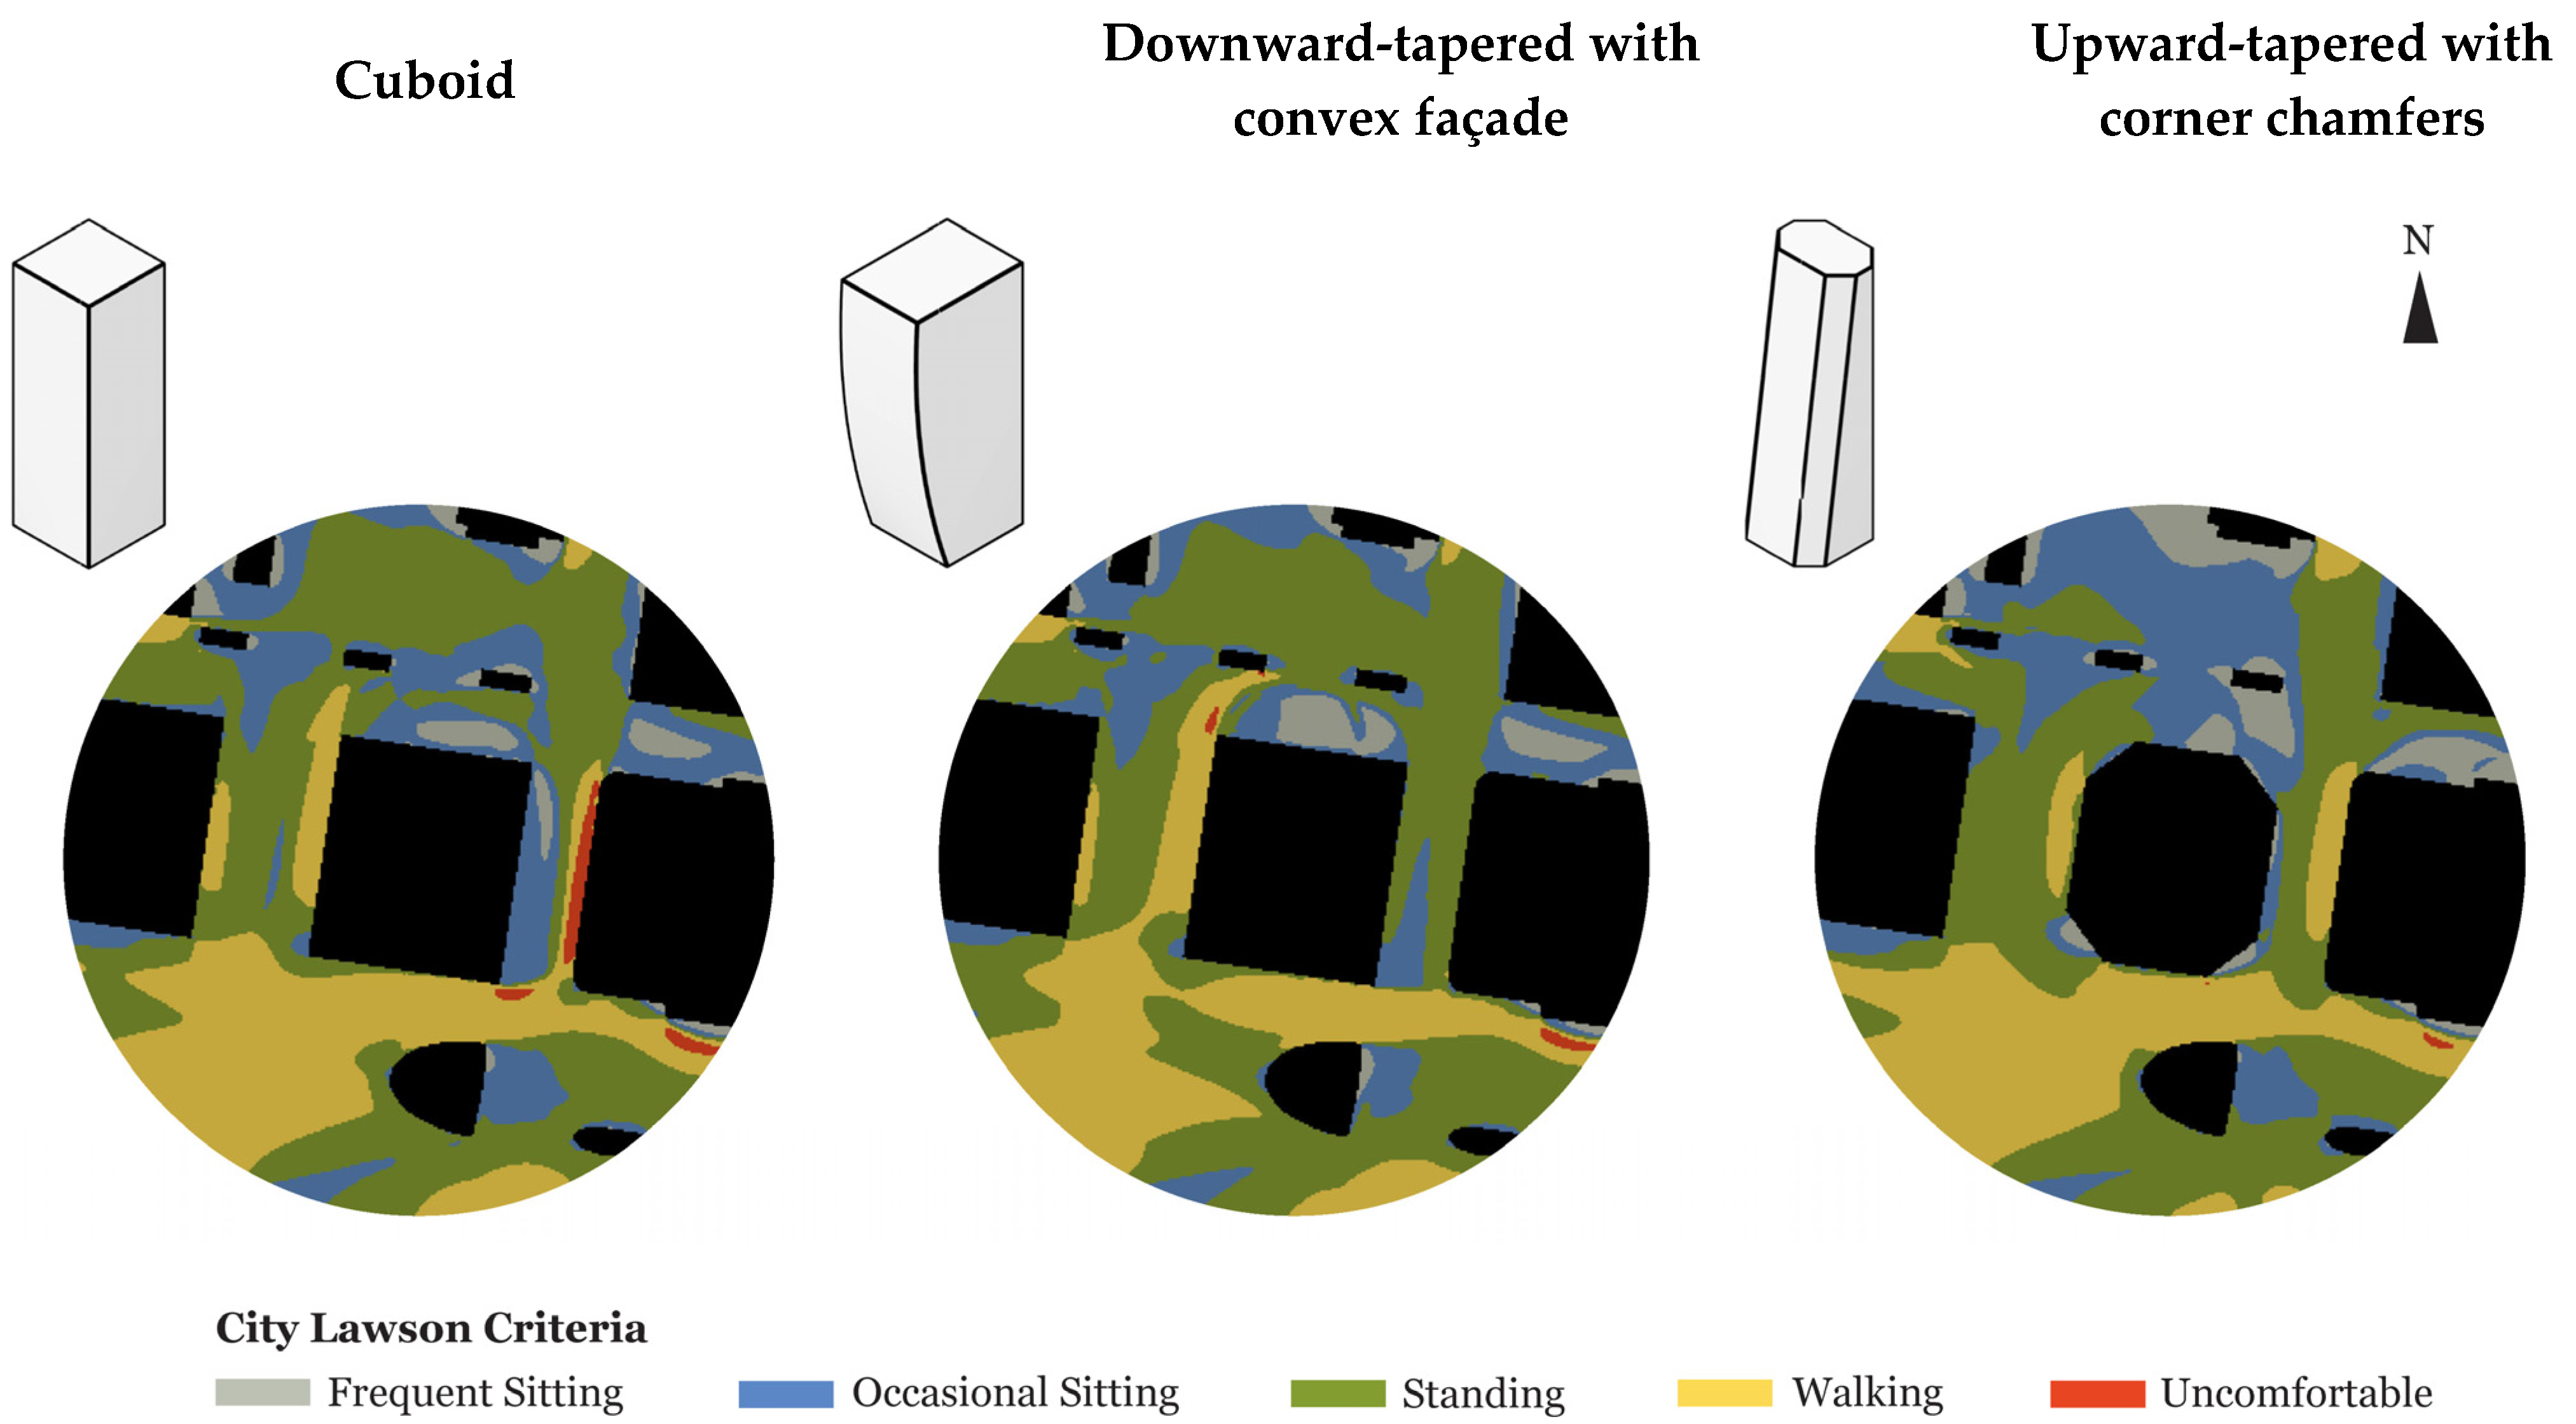
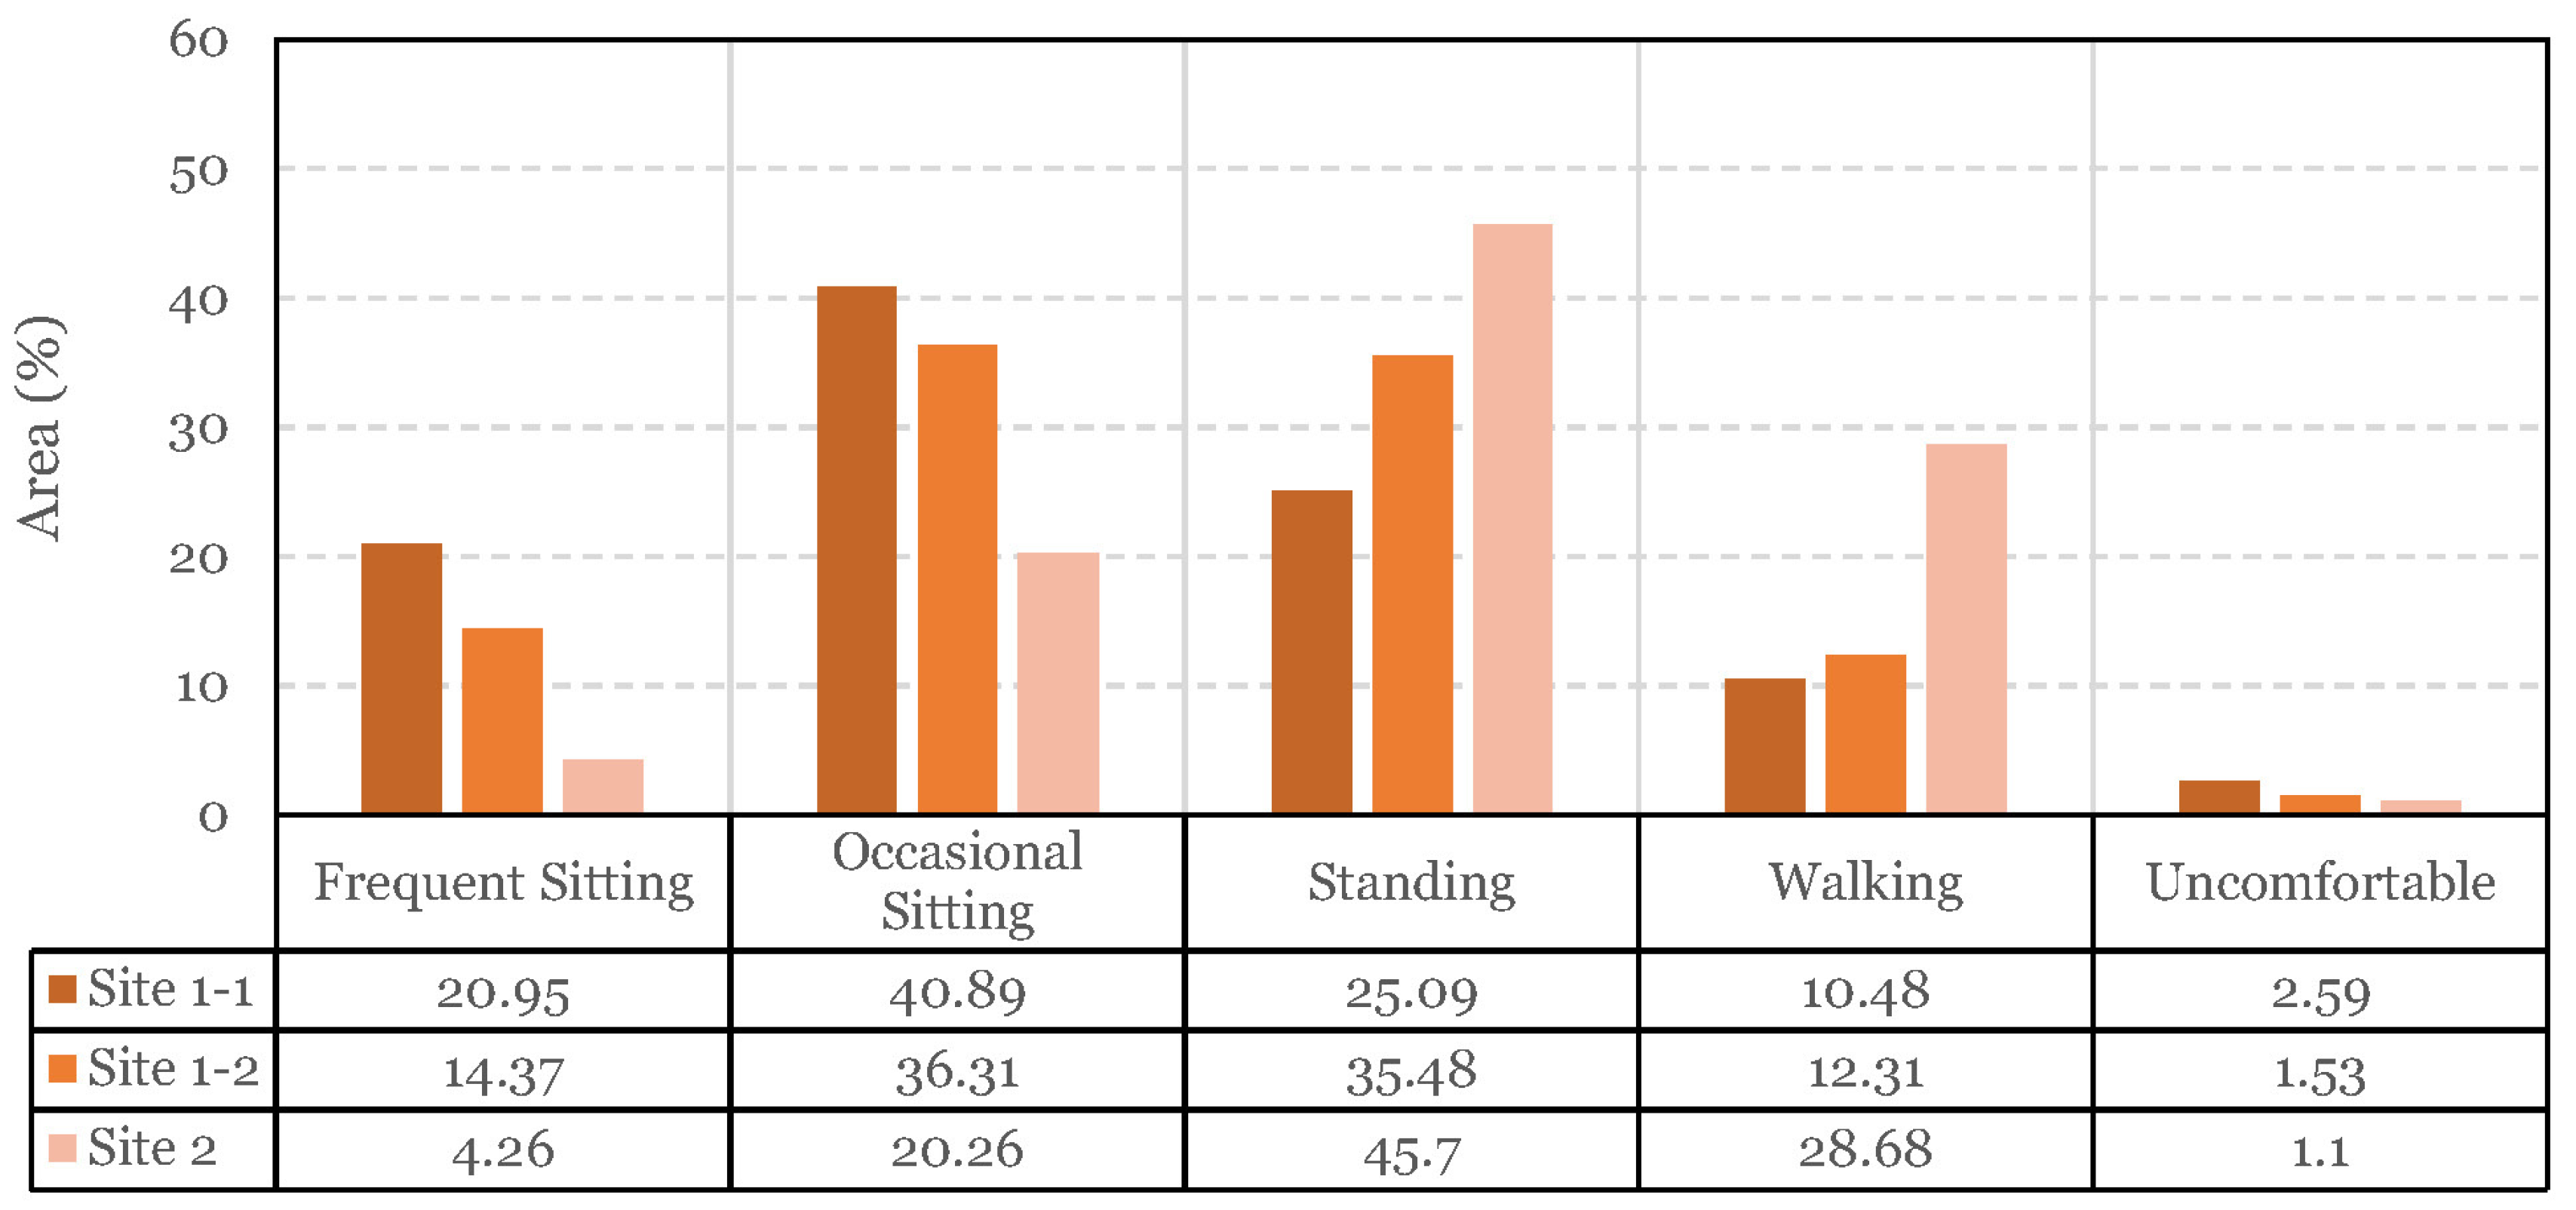
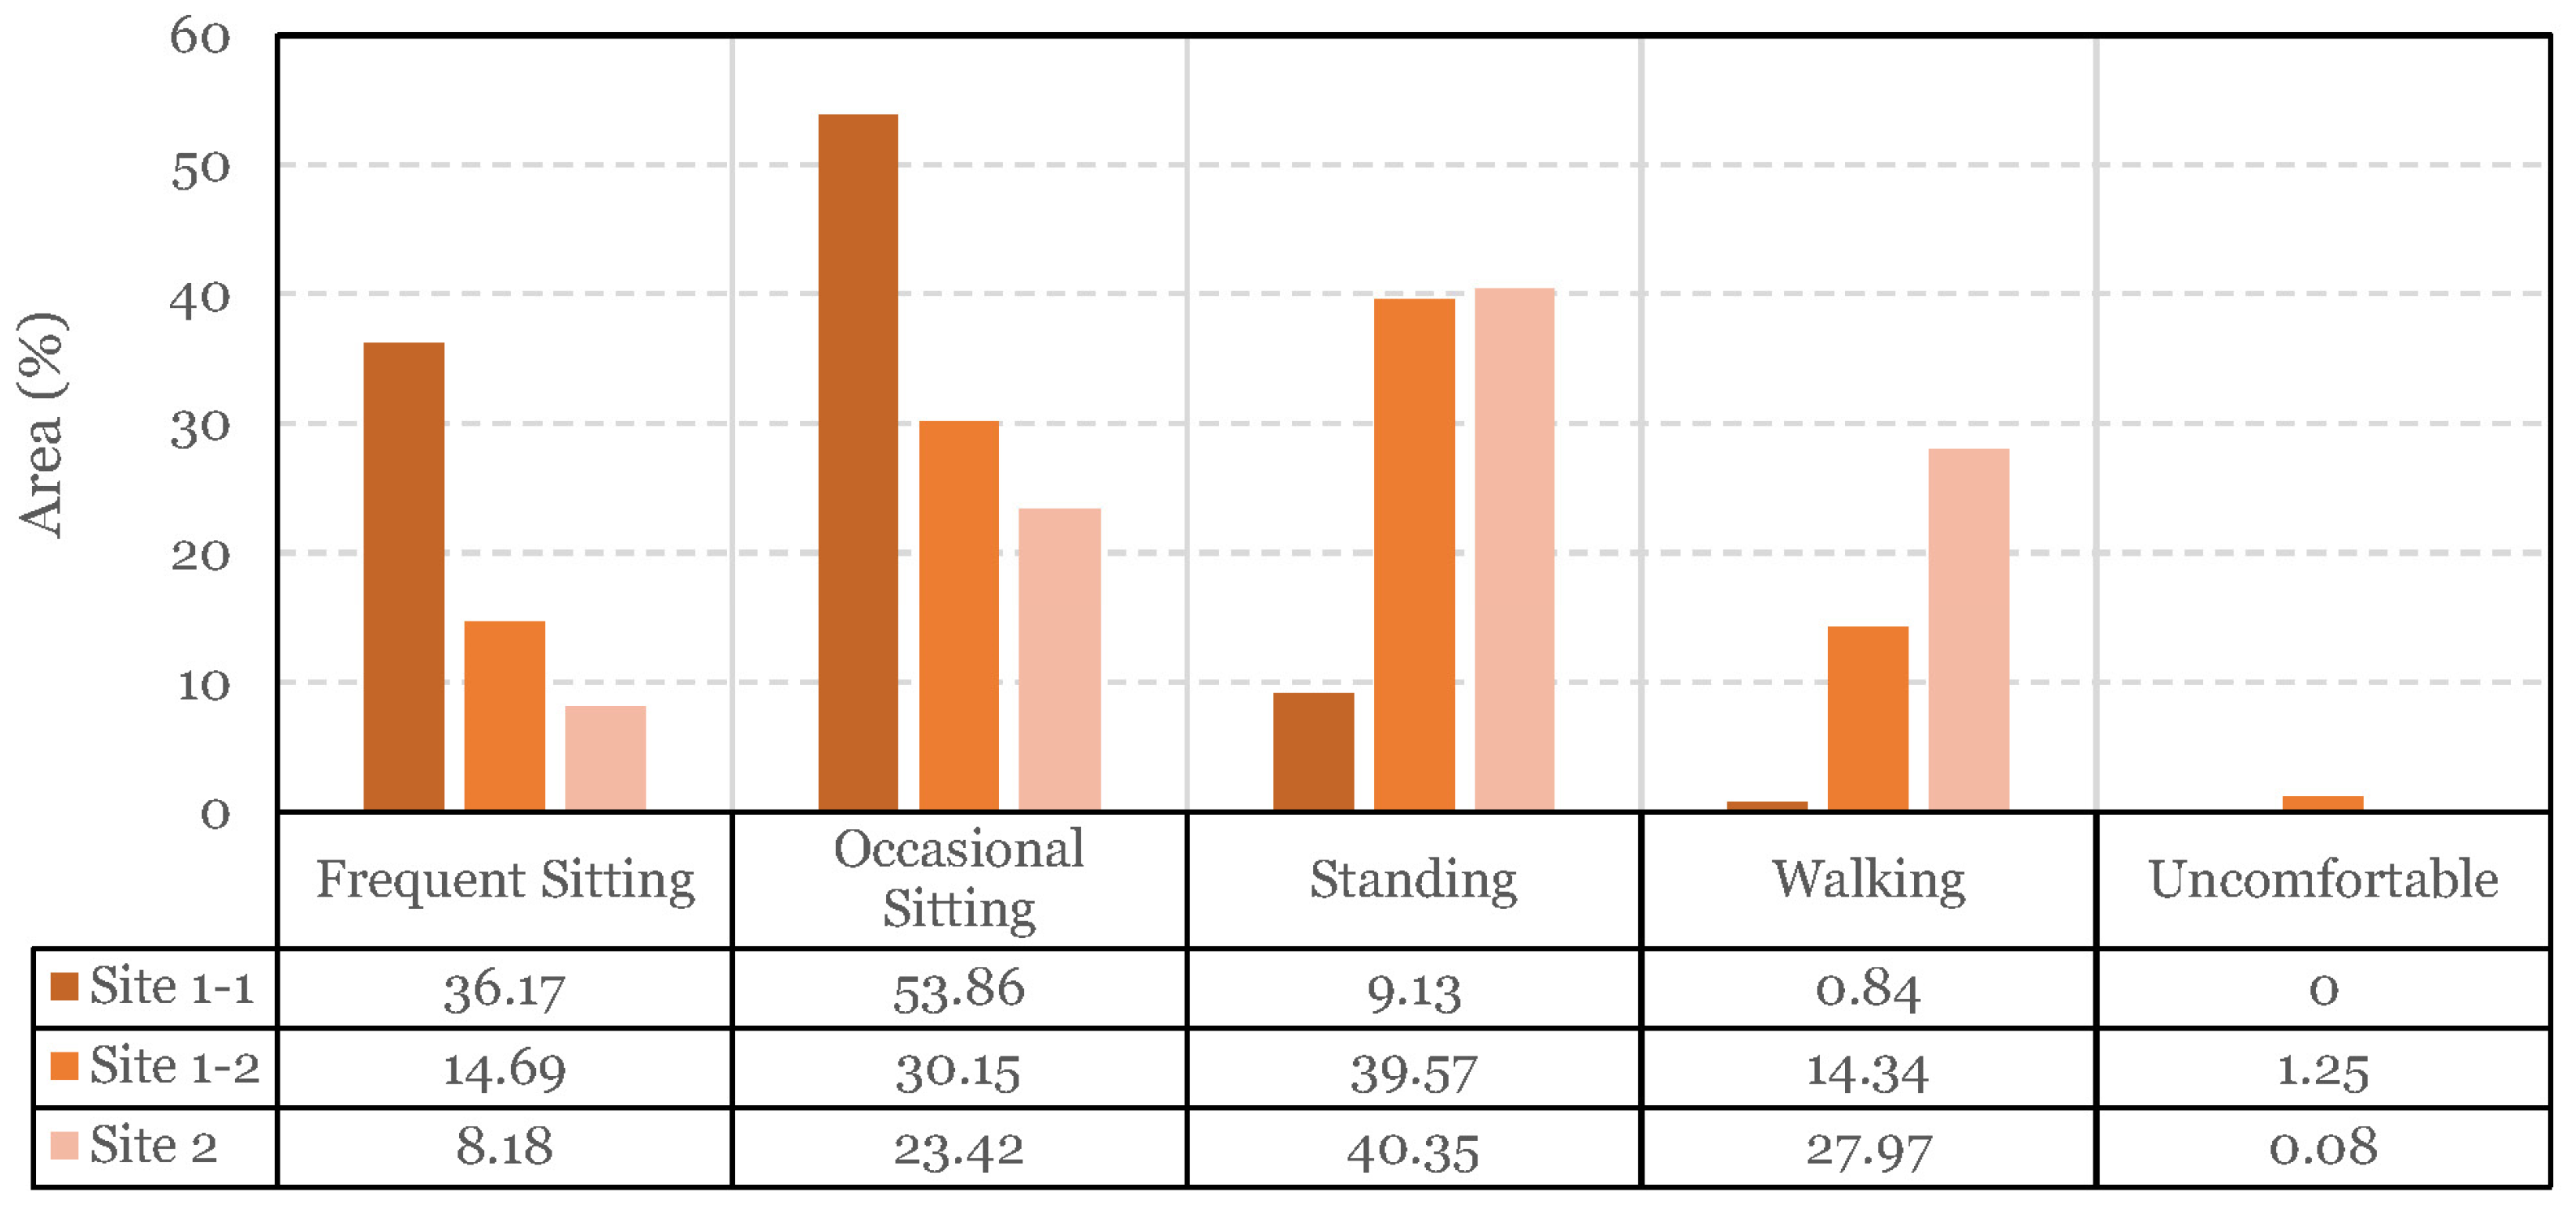
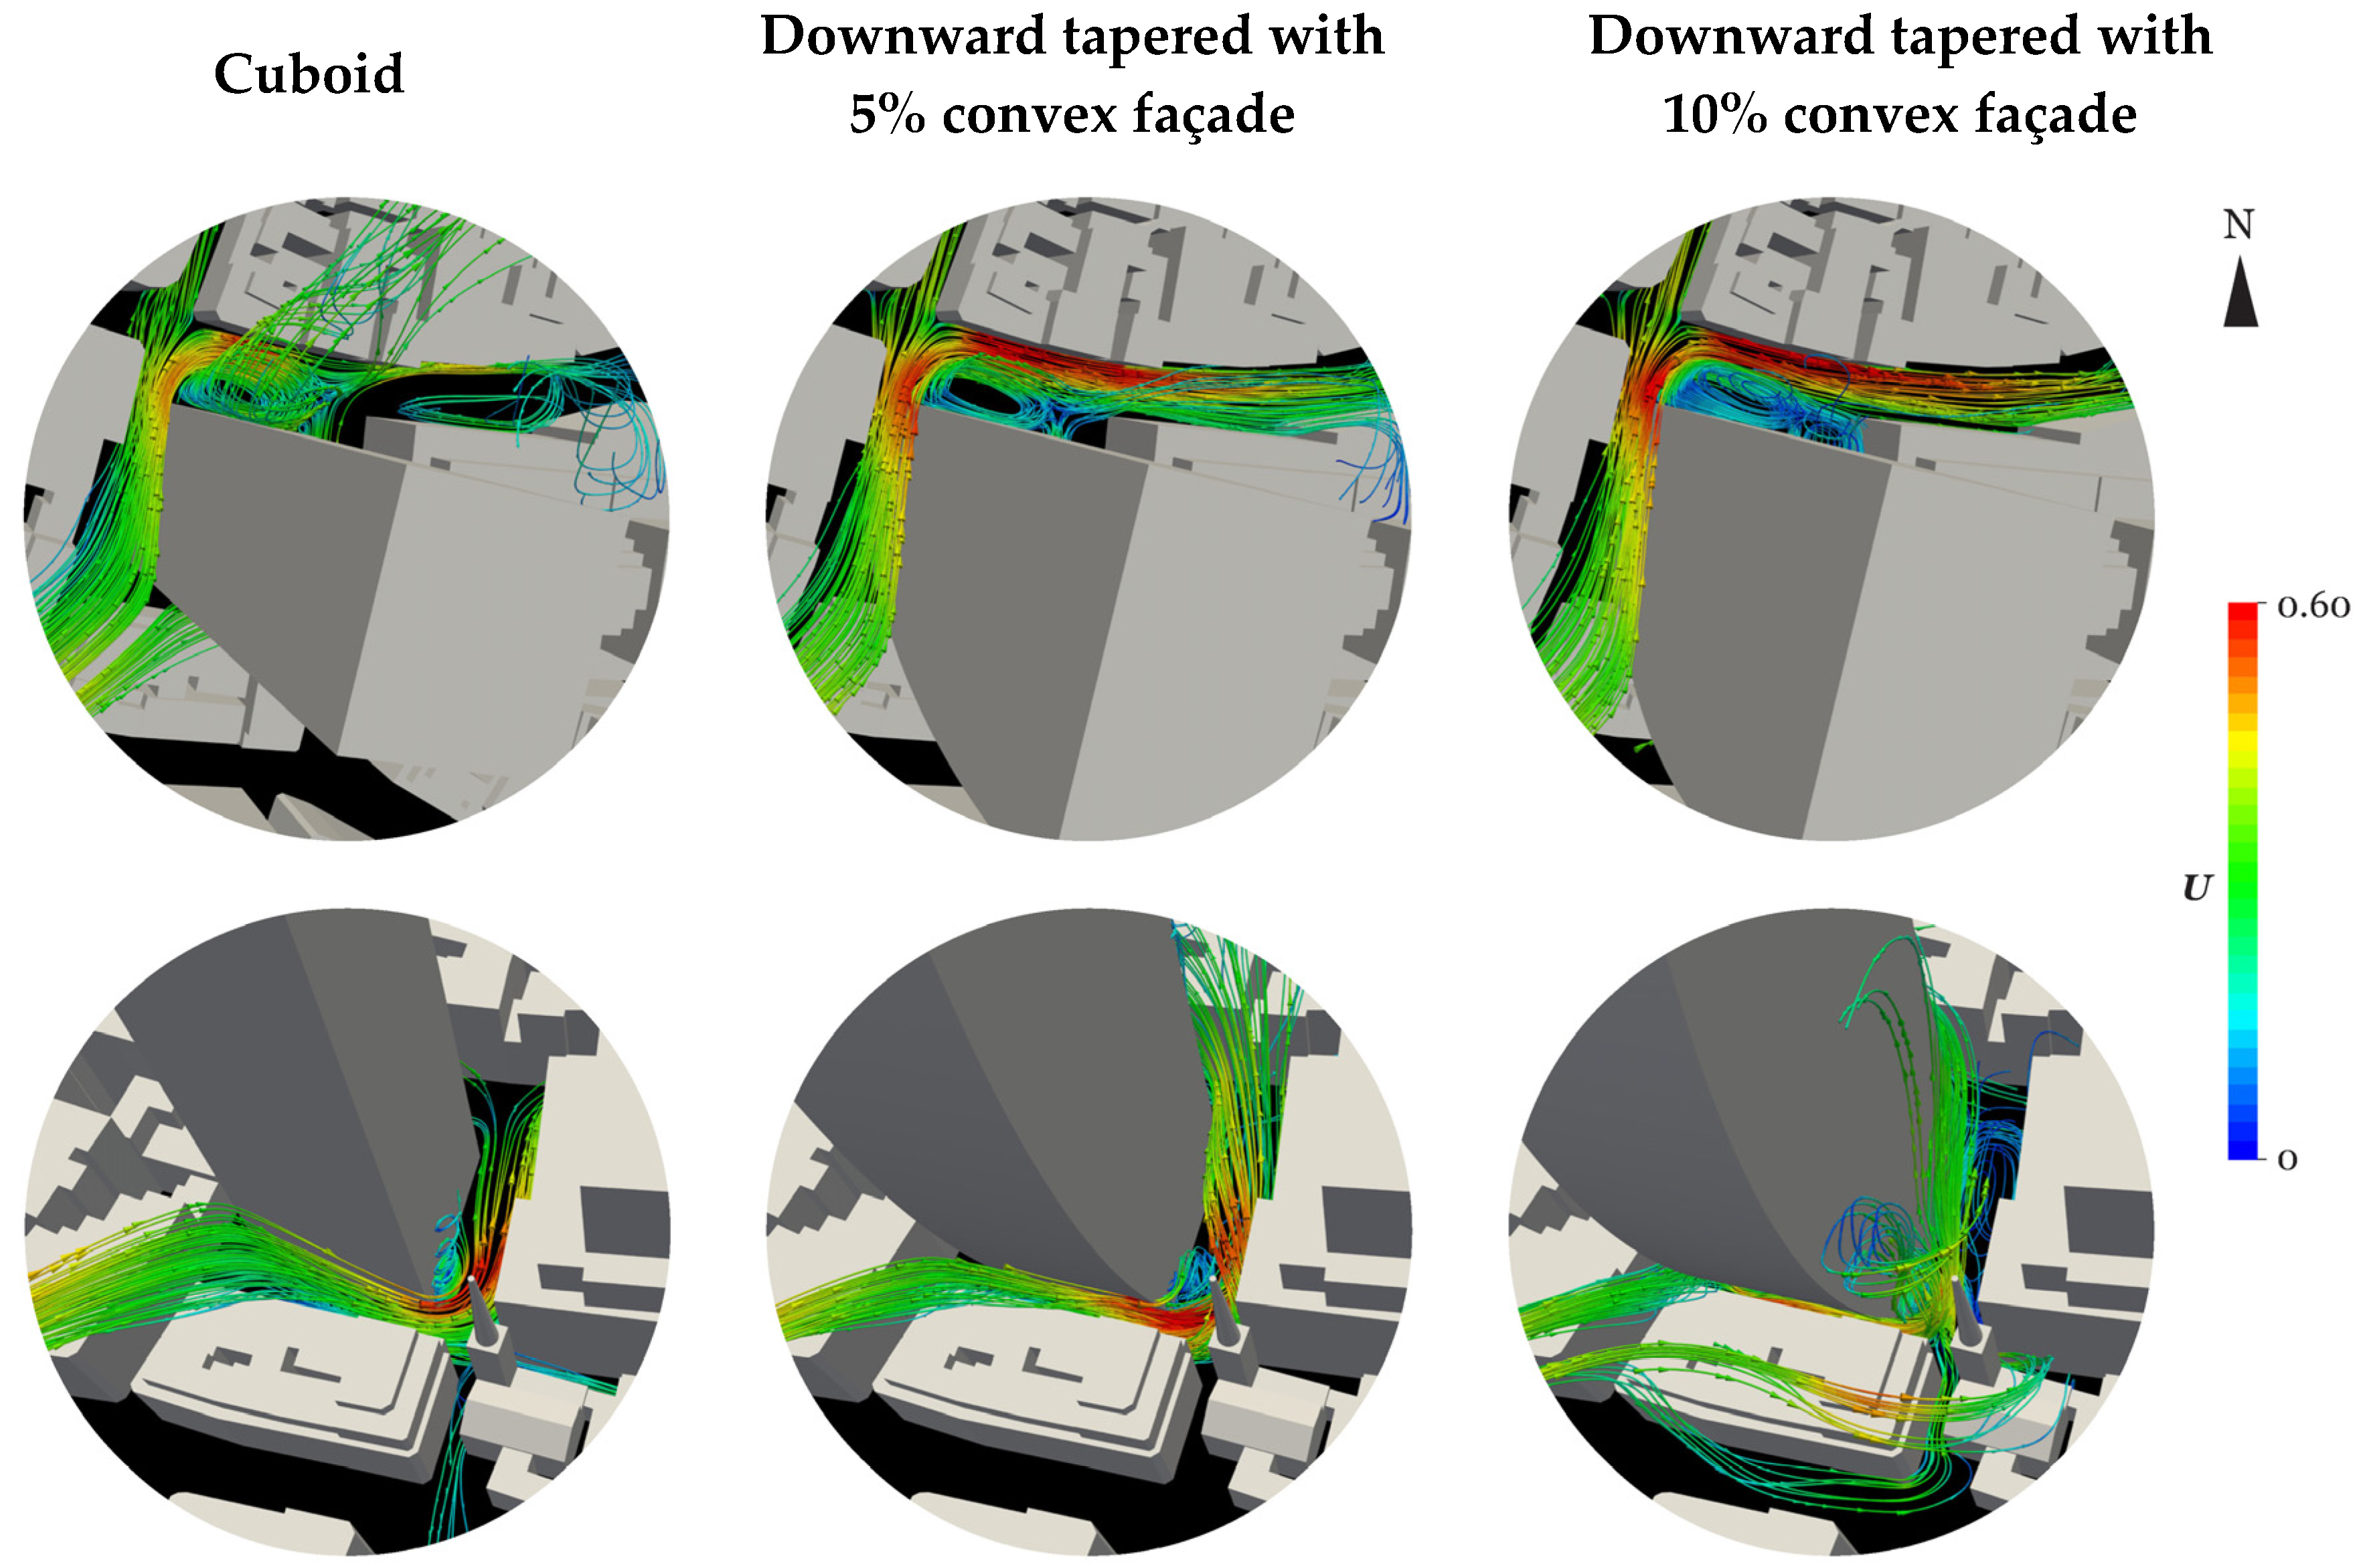
For each of the three selected sites, the influence of geometrical changes on the target building was examined. The existing target geometry was replaced with a cuboid geometry (i.e., the baseline), a downward taper with a convex façade (i.e., best case in isolated conditions), and an upward taper with corner chamfers (i.e., worst in isolation), as shown in Figure 2 and described in Table 1.
In all cases, the replaced geometries retained the same footprint and height of the existing target building for each site. It should be noted that the scope of this study is limited to comparing the performance of building geometries between isolated and urban conditions. It assesses whether the advantageous or the disadvantageous geometries, as selected from thirty-eight of London’s popular geometries under isolated conditions, have a similar effect on wind speeds in an urban context.
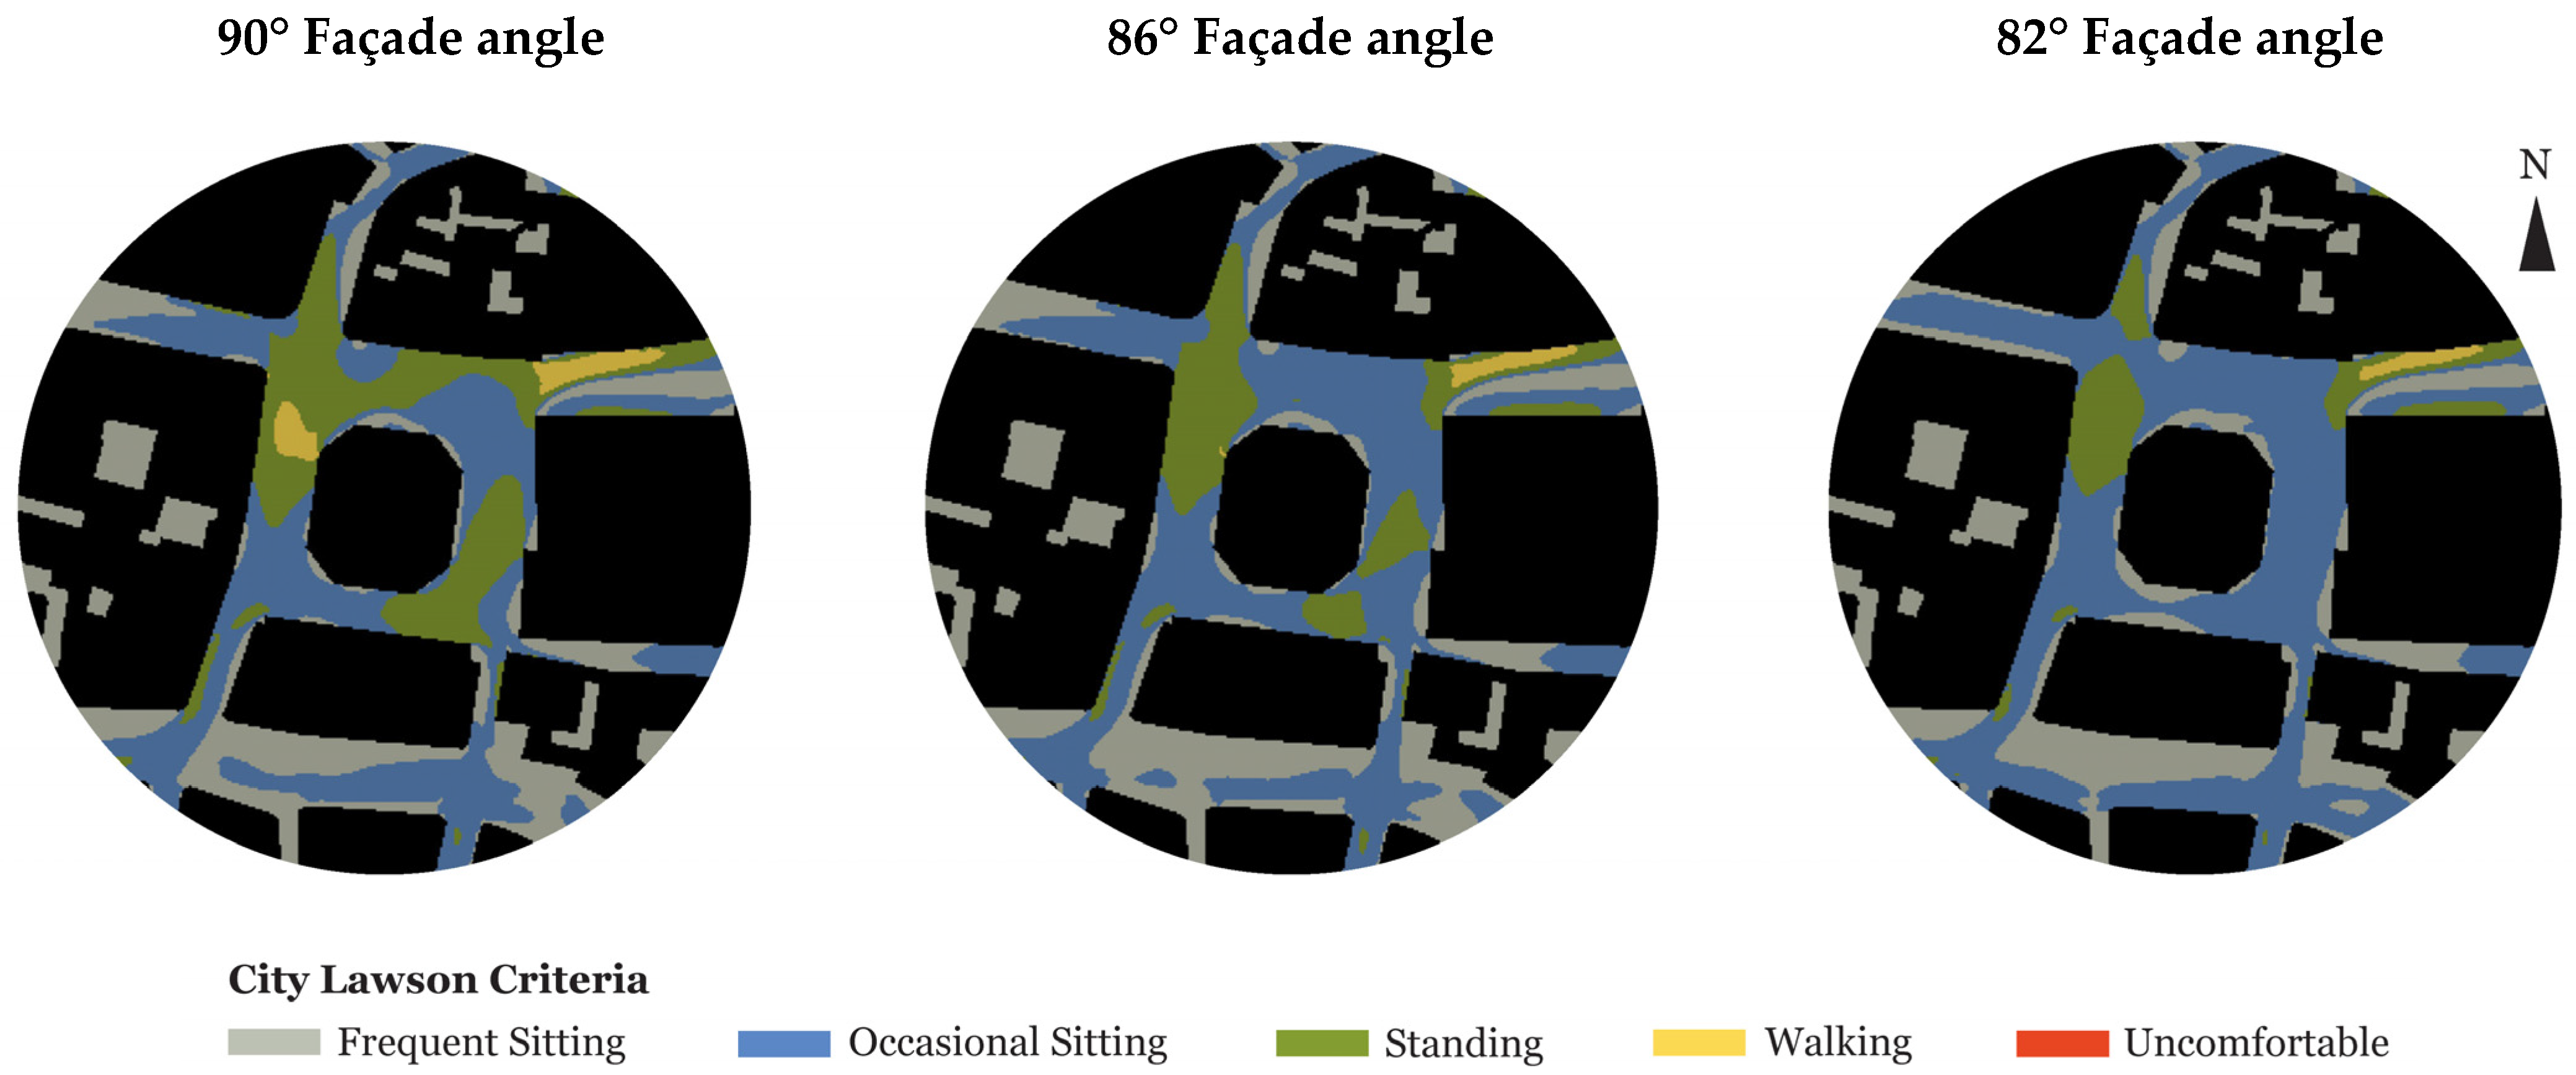
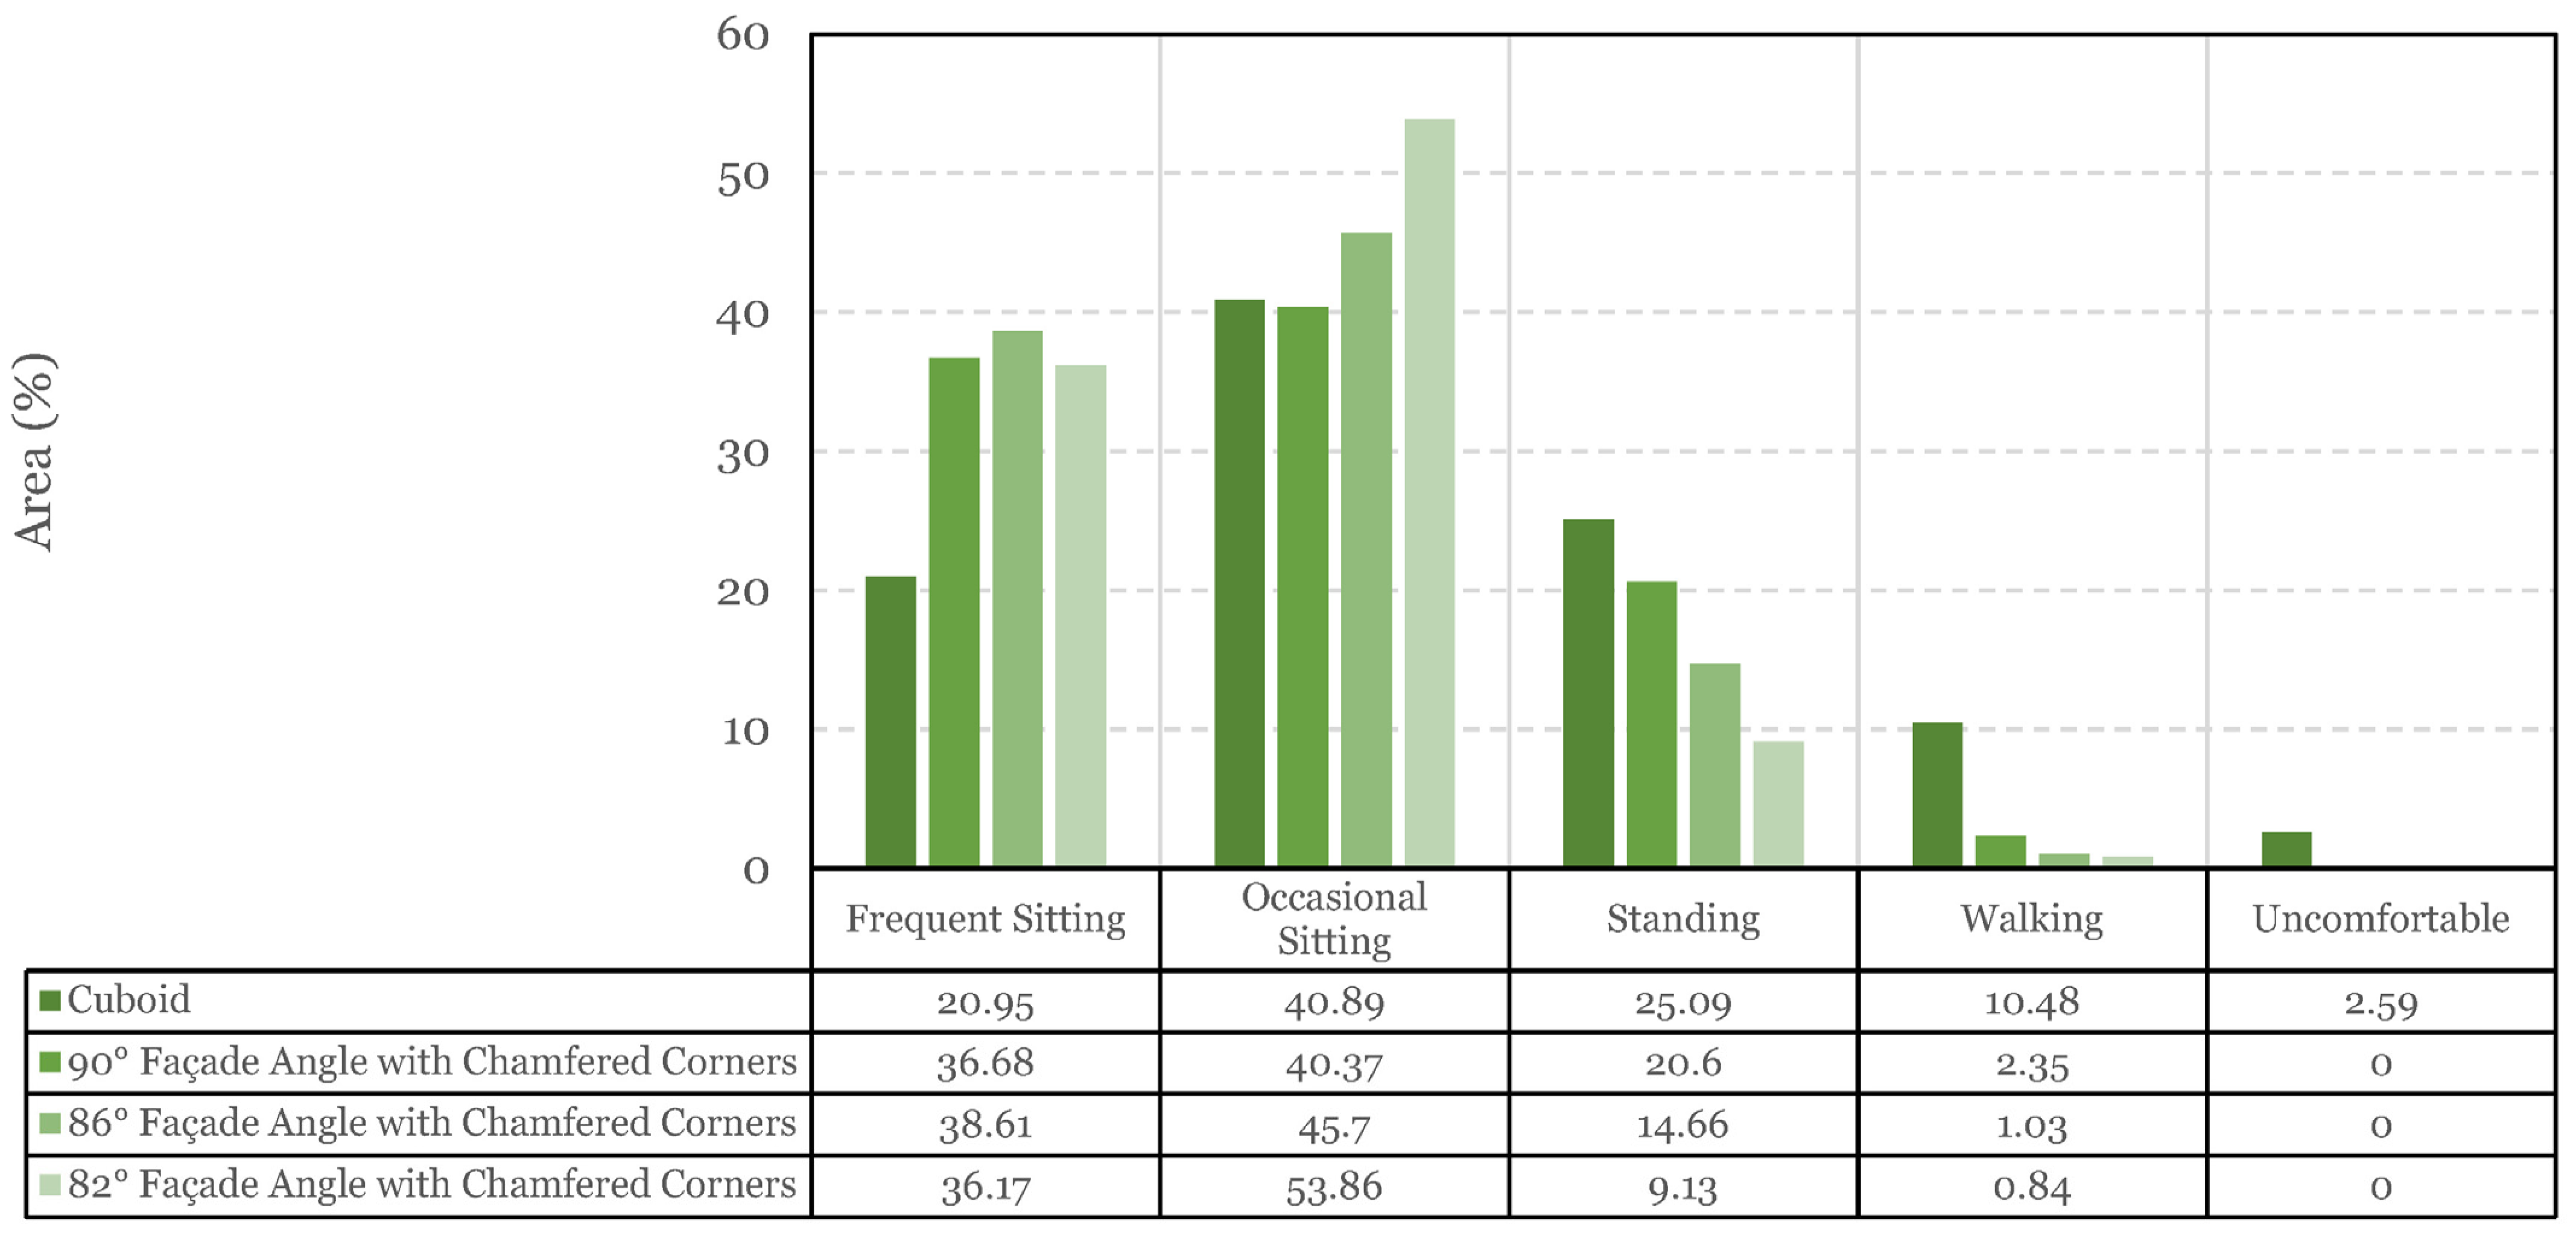
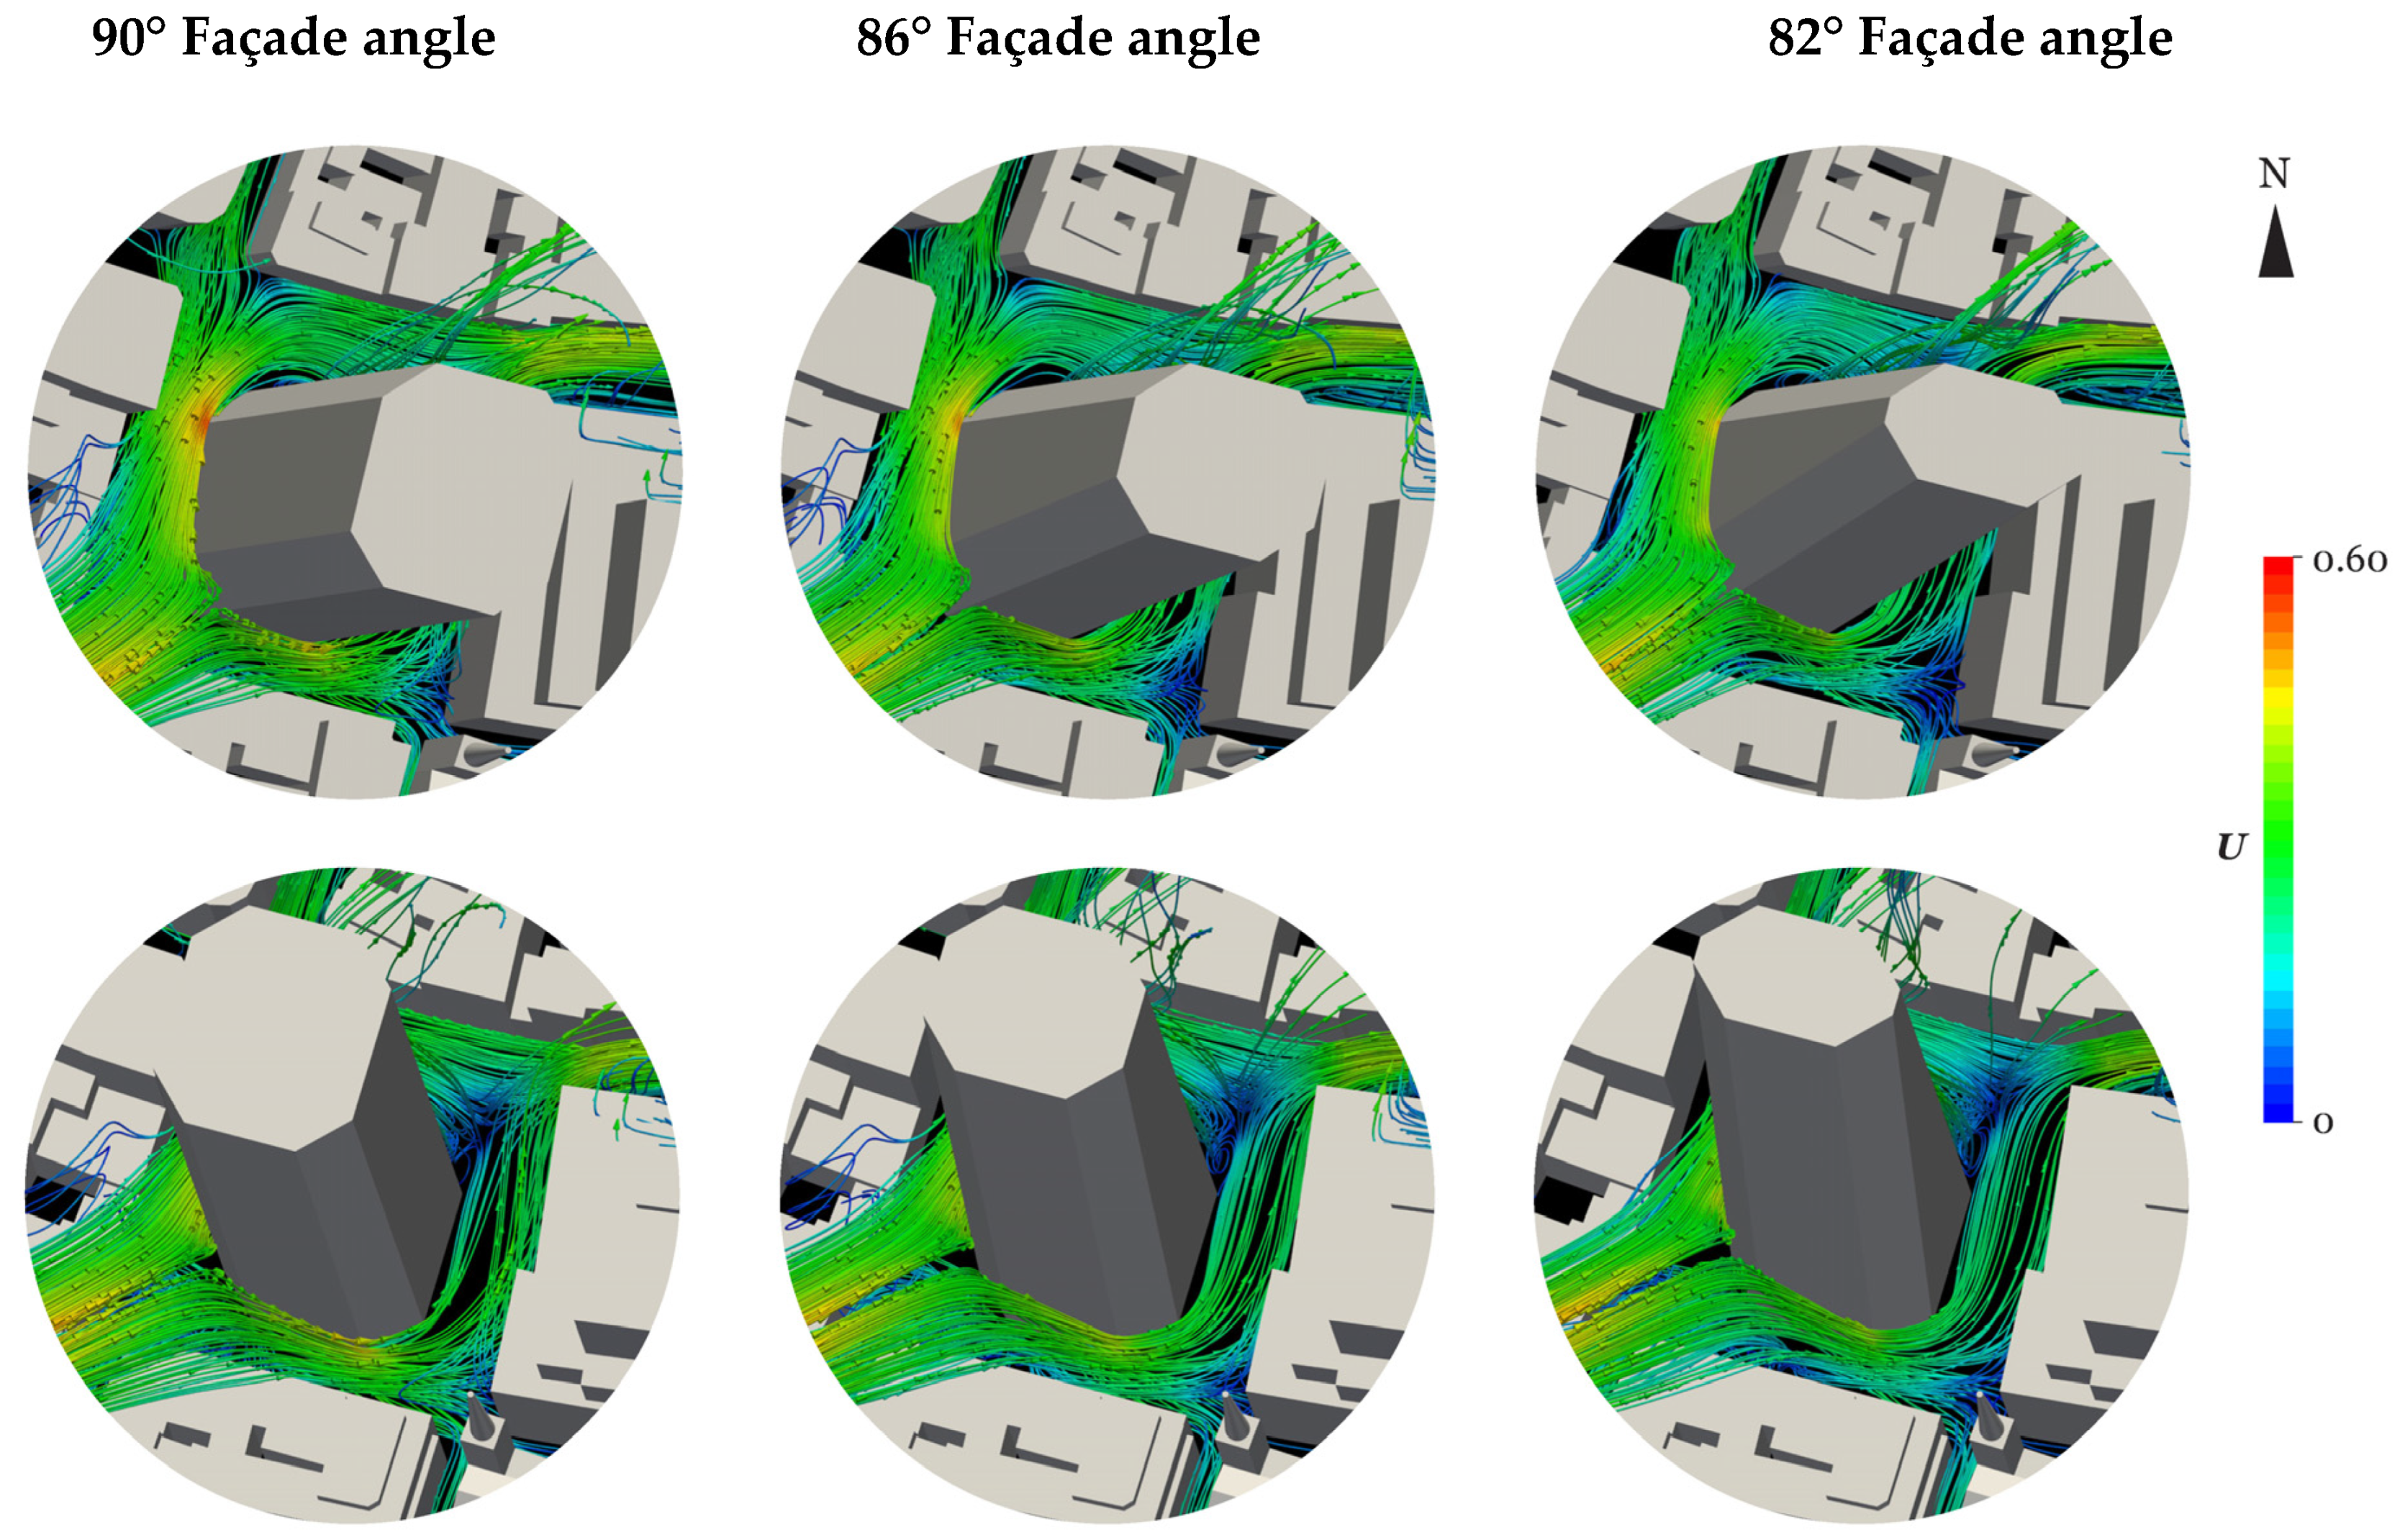
To specifically analyse the impact of façade angles on PLWs, modifications were made to the geometries with tapered façades, as described in Table 2.
To gauge the influence of building height, the cuboid geometry was exclusively utilised for each site. The relationship between incremental variations in surrounding building heights and PLW speeds was already explored in [
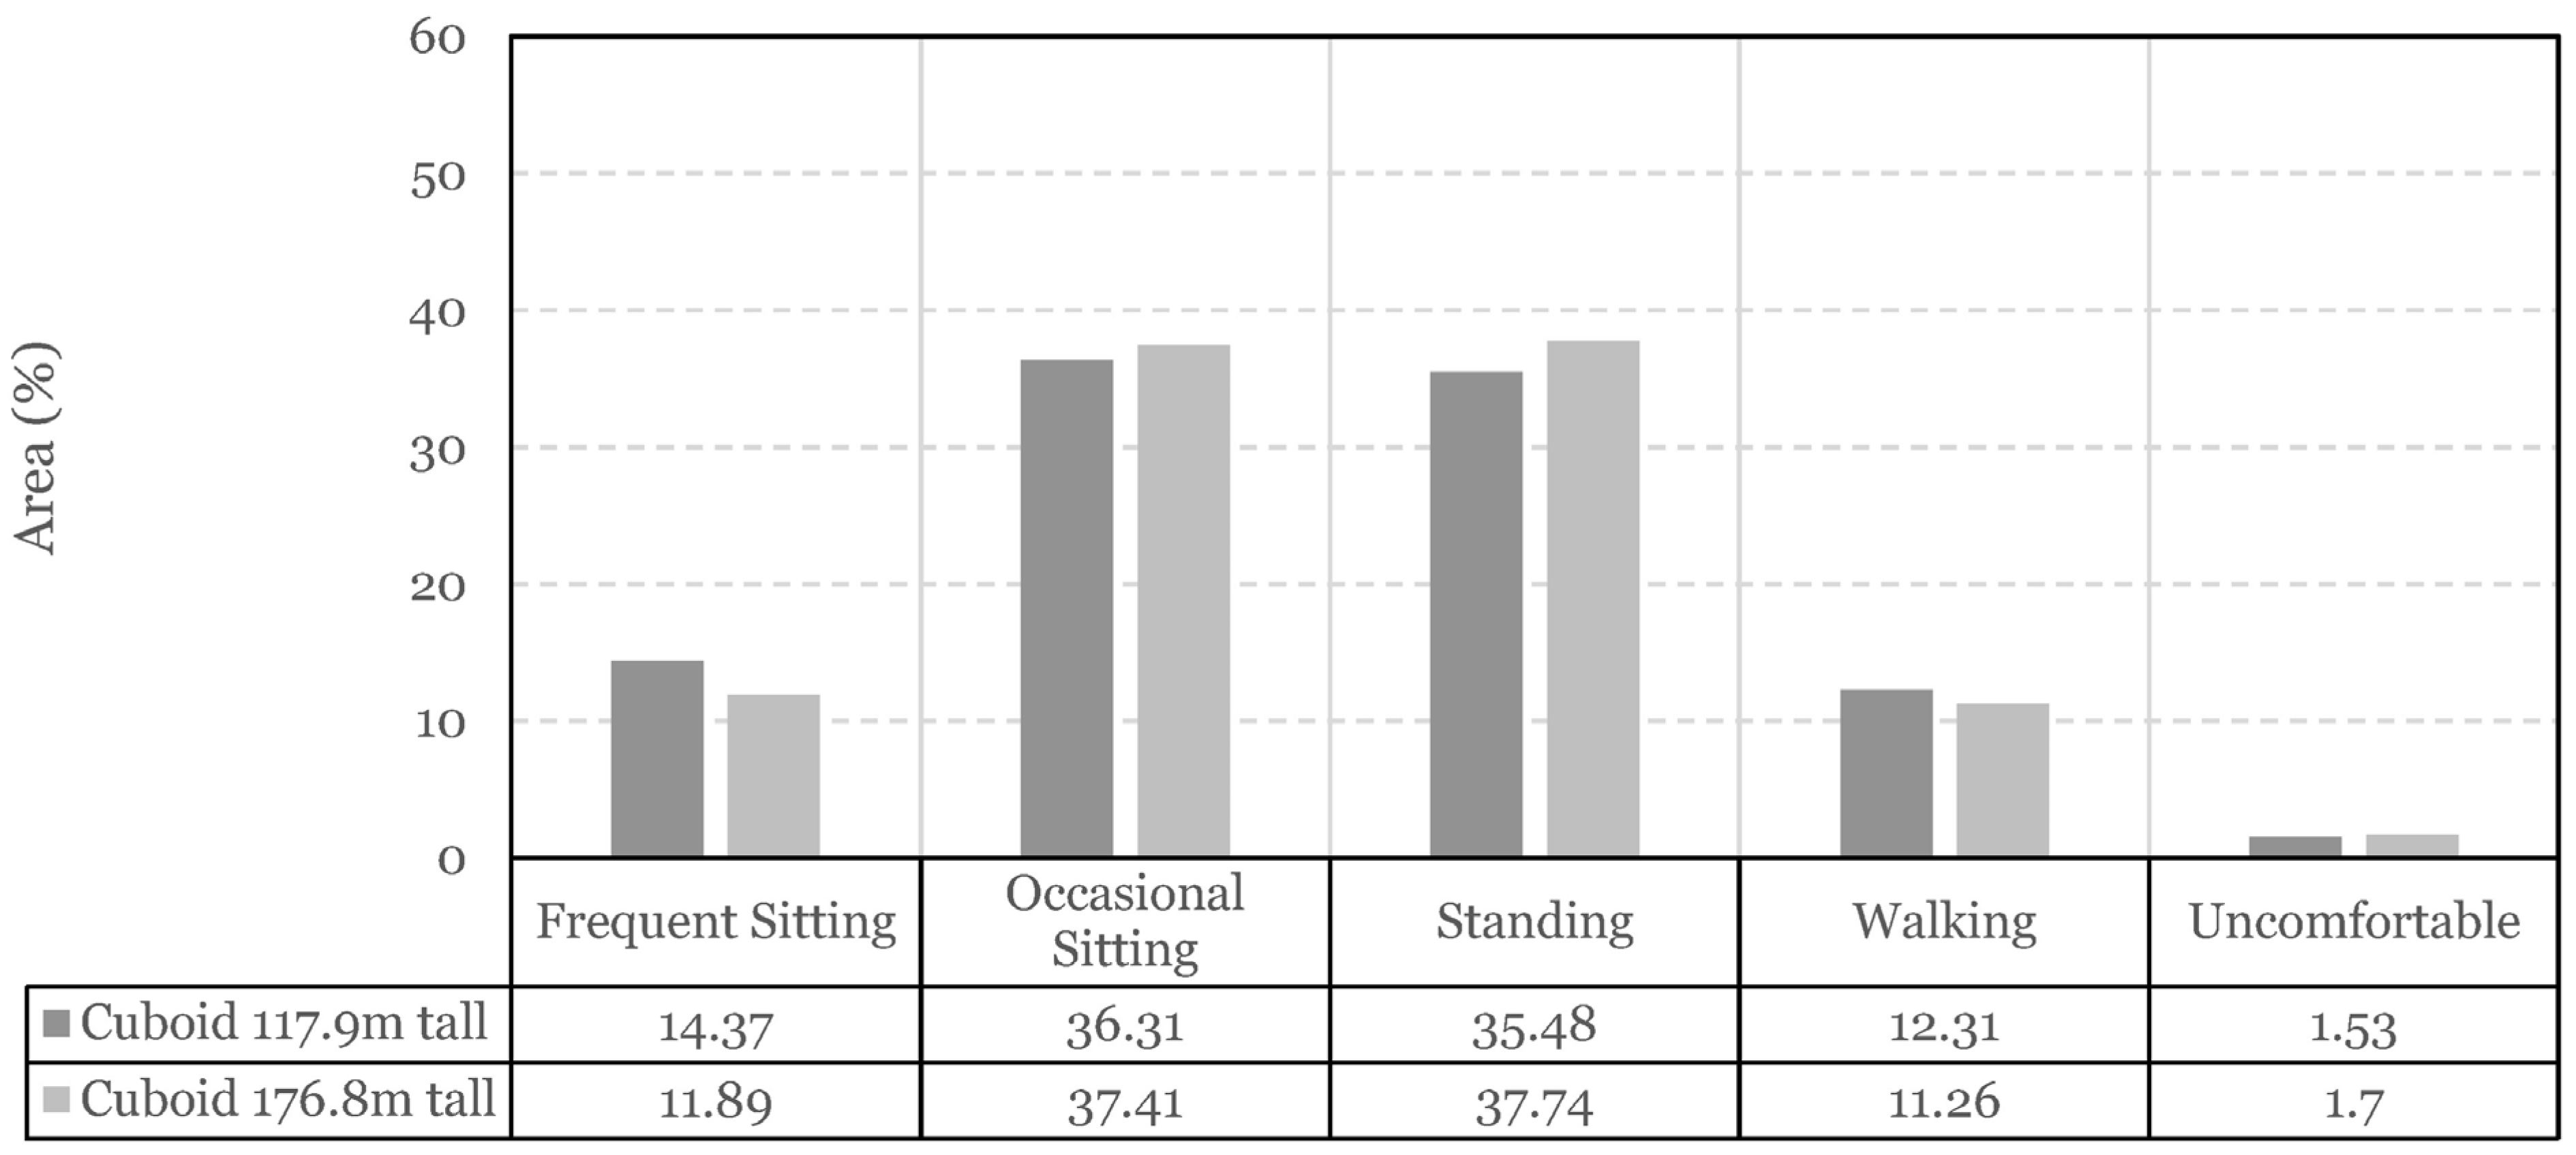
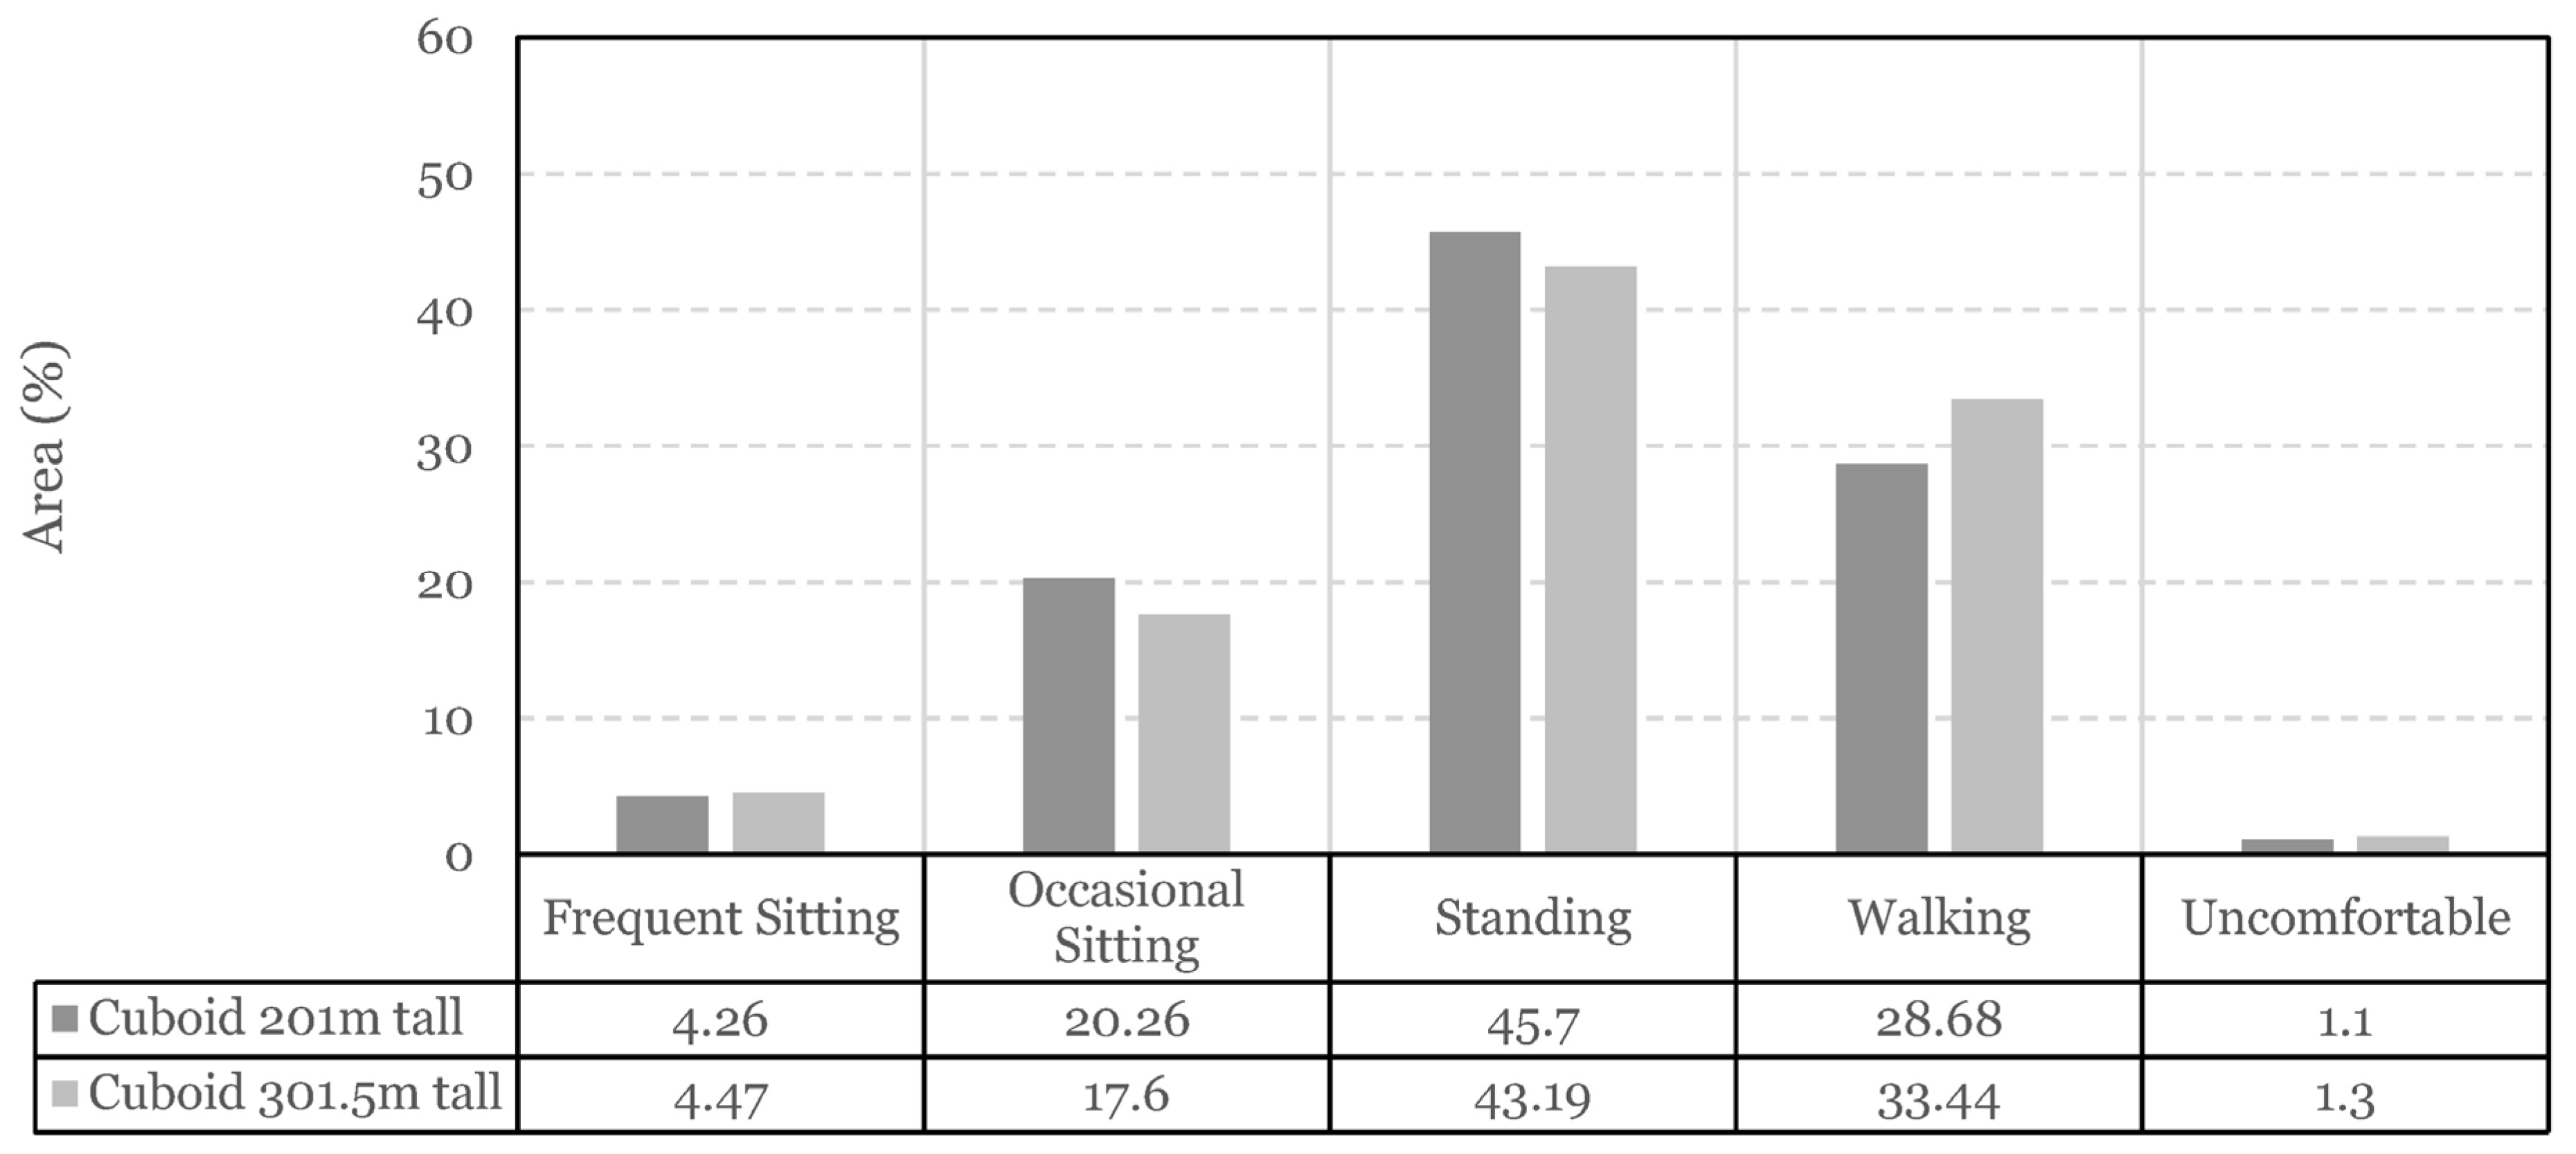
34], where the impact of diverse exposures of a tall building on PLW speeds was assessed. Therefore, in this paper, a representative case—a 50% increase in the target building height—was examined.
The overall main parameters of the site are summarised in Table 3.

2.1.2. Computational Setup

The simulations were undertaken using OpenFOAM (v9) CFD software [35]. A steady-state Reynolds-Averaged Navier–Stokes (RANS) approach was used with a realizable k - ε turbulence model and Semi-Implicit Method for Pressure-Linked Equations (SIMPLE) algorithm.
The limitations of RANS in capturing transient wind phenomena, such as gust effects and vortex shedding, are well acknowledged and represent a critical consideration in turbulence modelling. While Large Eddy Simulation (LES) provides more detailed insights into transient phenomena, its computational cost often outweighs the benefits in practical applications, where efficiency and cost-effectiveness are paramount [36].
The decision to employ RANS in this study was guided by the need to balance accuracy with feasibility, ensuring that the results remain both reliable and practical for real-world wind engineering applications. This study provides supporting evidence that RANS models can sufficiently predict flow characteristics in complex urban environments where wind gusts are not dominant, reinforcing their continued use in scenarios where LES is not economically viable.
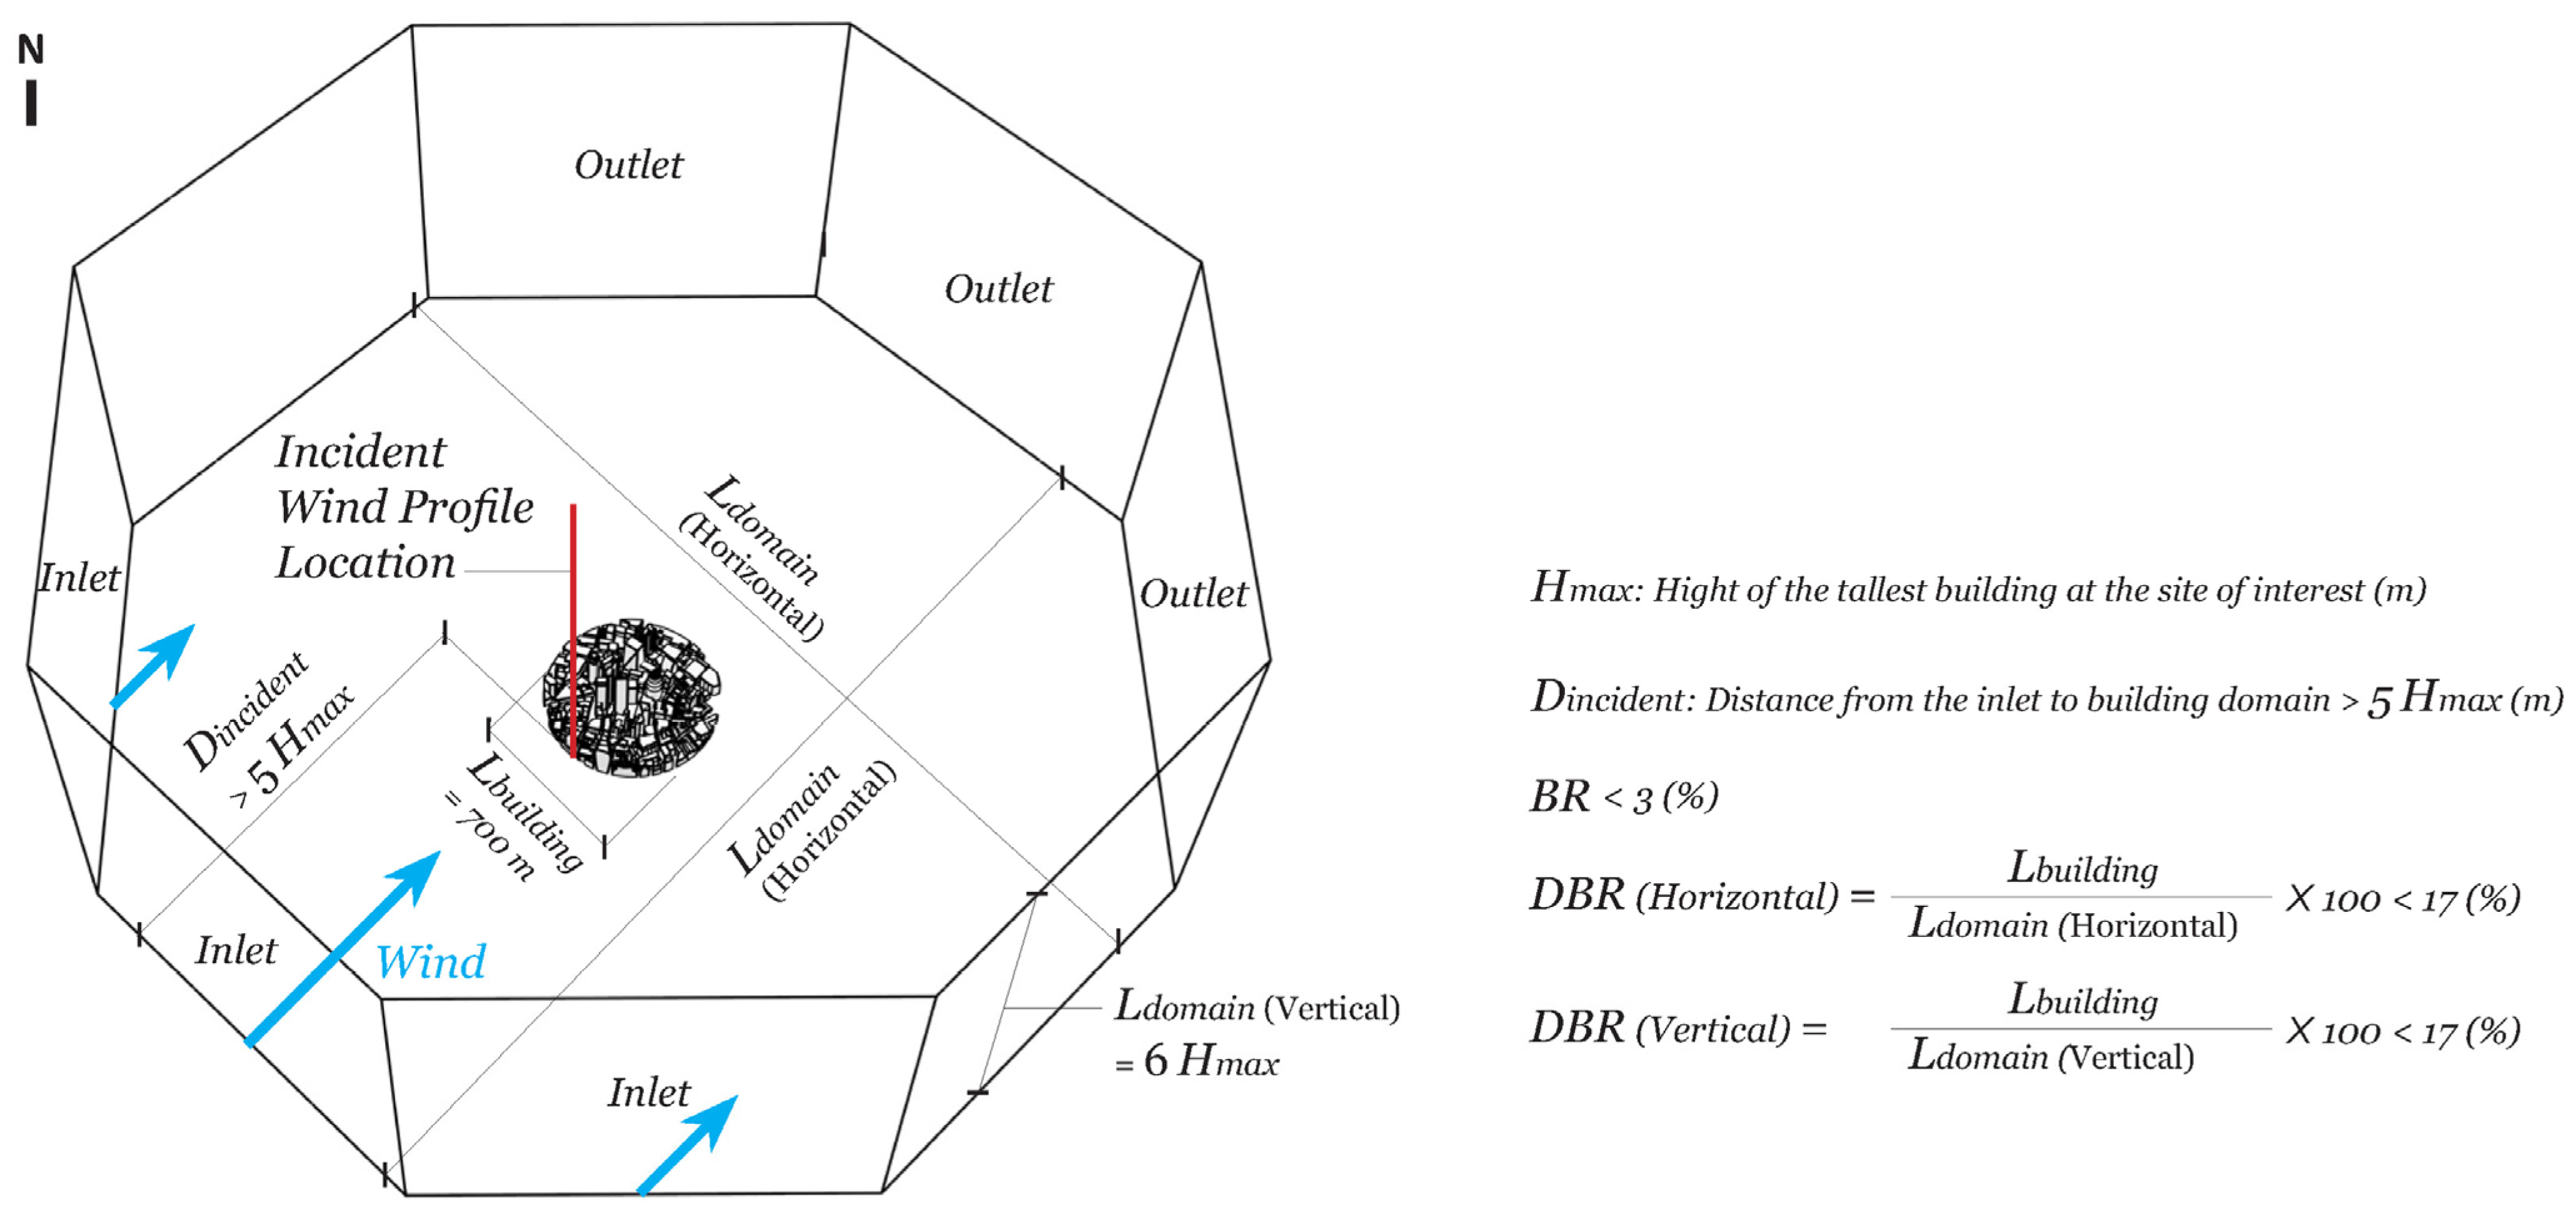
A computational domain for the simulations was set up with consideration for blockage ratios to prevent artificial acceleration (shown in Figure 3). The blockage ratio (BR) and directional blockage ratio (DBR) were set at values less than 3% and 17%, respectively [37]. The domain was configured in an octagonal shape, carefully accommodating the inlet wind directions, which simulate winds approaching from the northeast, southeast, southwest, and northwest.
The computational model was designed to encompass the neighbouring buildings within a 700 m diameter. Wake effects and building interactions were accounted for within the simulation. However, evaluating PLW comfort conditions beyond a 200 m diameter introduced far-field damping effects, which obscured the ability to isolate the impact of the target building. The 200 m diameter was determined through iterative calculations to establish a reasonable extent that accurately captured the building’s influence without introducing extraneous effects that could confound the conclusions.
The inlet boundary condition was set up as an atmospheric boundary layer, according to the equations in [38], with a roughness length of ( z 0 ) 2 m [39], reference height ( z r e f ) of 518 m [40], and reference wind speed ( U r e f ) of 10 m / s . Note that, as no existing engineering tool can determine the roughness length with absolute accuracy, it was estimated based on [39]. To improve this approximation, surrounding buildings within a 700 m diameter were included in the computational domain, allowing the approaching flow profile to develop realistically before interacting with the target buildings.
The profiles of local wind speed and kinetic energy at the Incident location from an empty domain are represented in Figure 4, where U n m is local wind speeds [ m / s ] at n   [ m ] above ground level.
Wind speed ratio ( U )s were used to represent CFD simulation results (Section 2.2 and Section 3.1) in accordance with Equation (1) [33]:
U = U 1.5 m U r e f
where U 1.5   m means wind speed ( m / s ) at pedestrian level that is defined by 1.5 m above ground level [6].
Other boundary conditions, including the outlet, side and top walls, ground, water, and building surfaces, were set up based on the best practice guidelines from [41].
The grid mesh (illustrated in Figure 5) was structured with a range of 18.8–19.6 million cells (varying based on the target and surrounding buildings for the different sites). As this study examines PLW speeds and comfort, the finest grids were constructed up to 8 m above ground level.
A benchmark assessment was conducted to determine the credibility of the CFD predictions. This involved a sensitivity study that compared the results from the CFD analysis conducted in this study with those from wind tunnel measurements from the Architectural Institute of Japan [33,42]. Additionally, the outcomes generated by the numerical CFD models in the present study were compared with the results obtained from field measurements (as discussed in Section 3.2). The velocities recorded from the CFD were averaged over the last several hundred iterations.
The wind microclimate study was carried out In the following three stages:
  • Analyse the most appropriate weather stations for wind data.
  • Conduct CFD simulations to predict the wind velocities of different wind directions.
  • Translate the wind speeds into the City Lawson Comfort Criteria.

2.2. Field Measurements

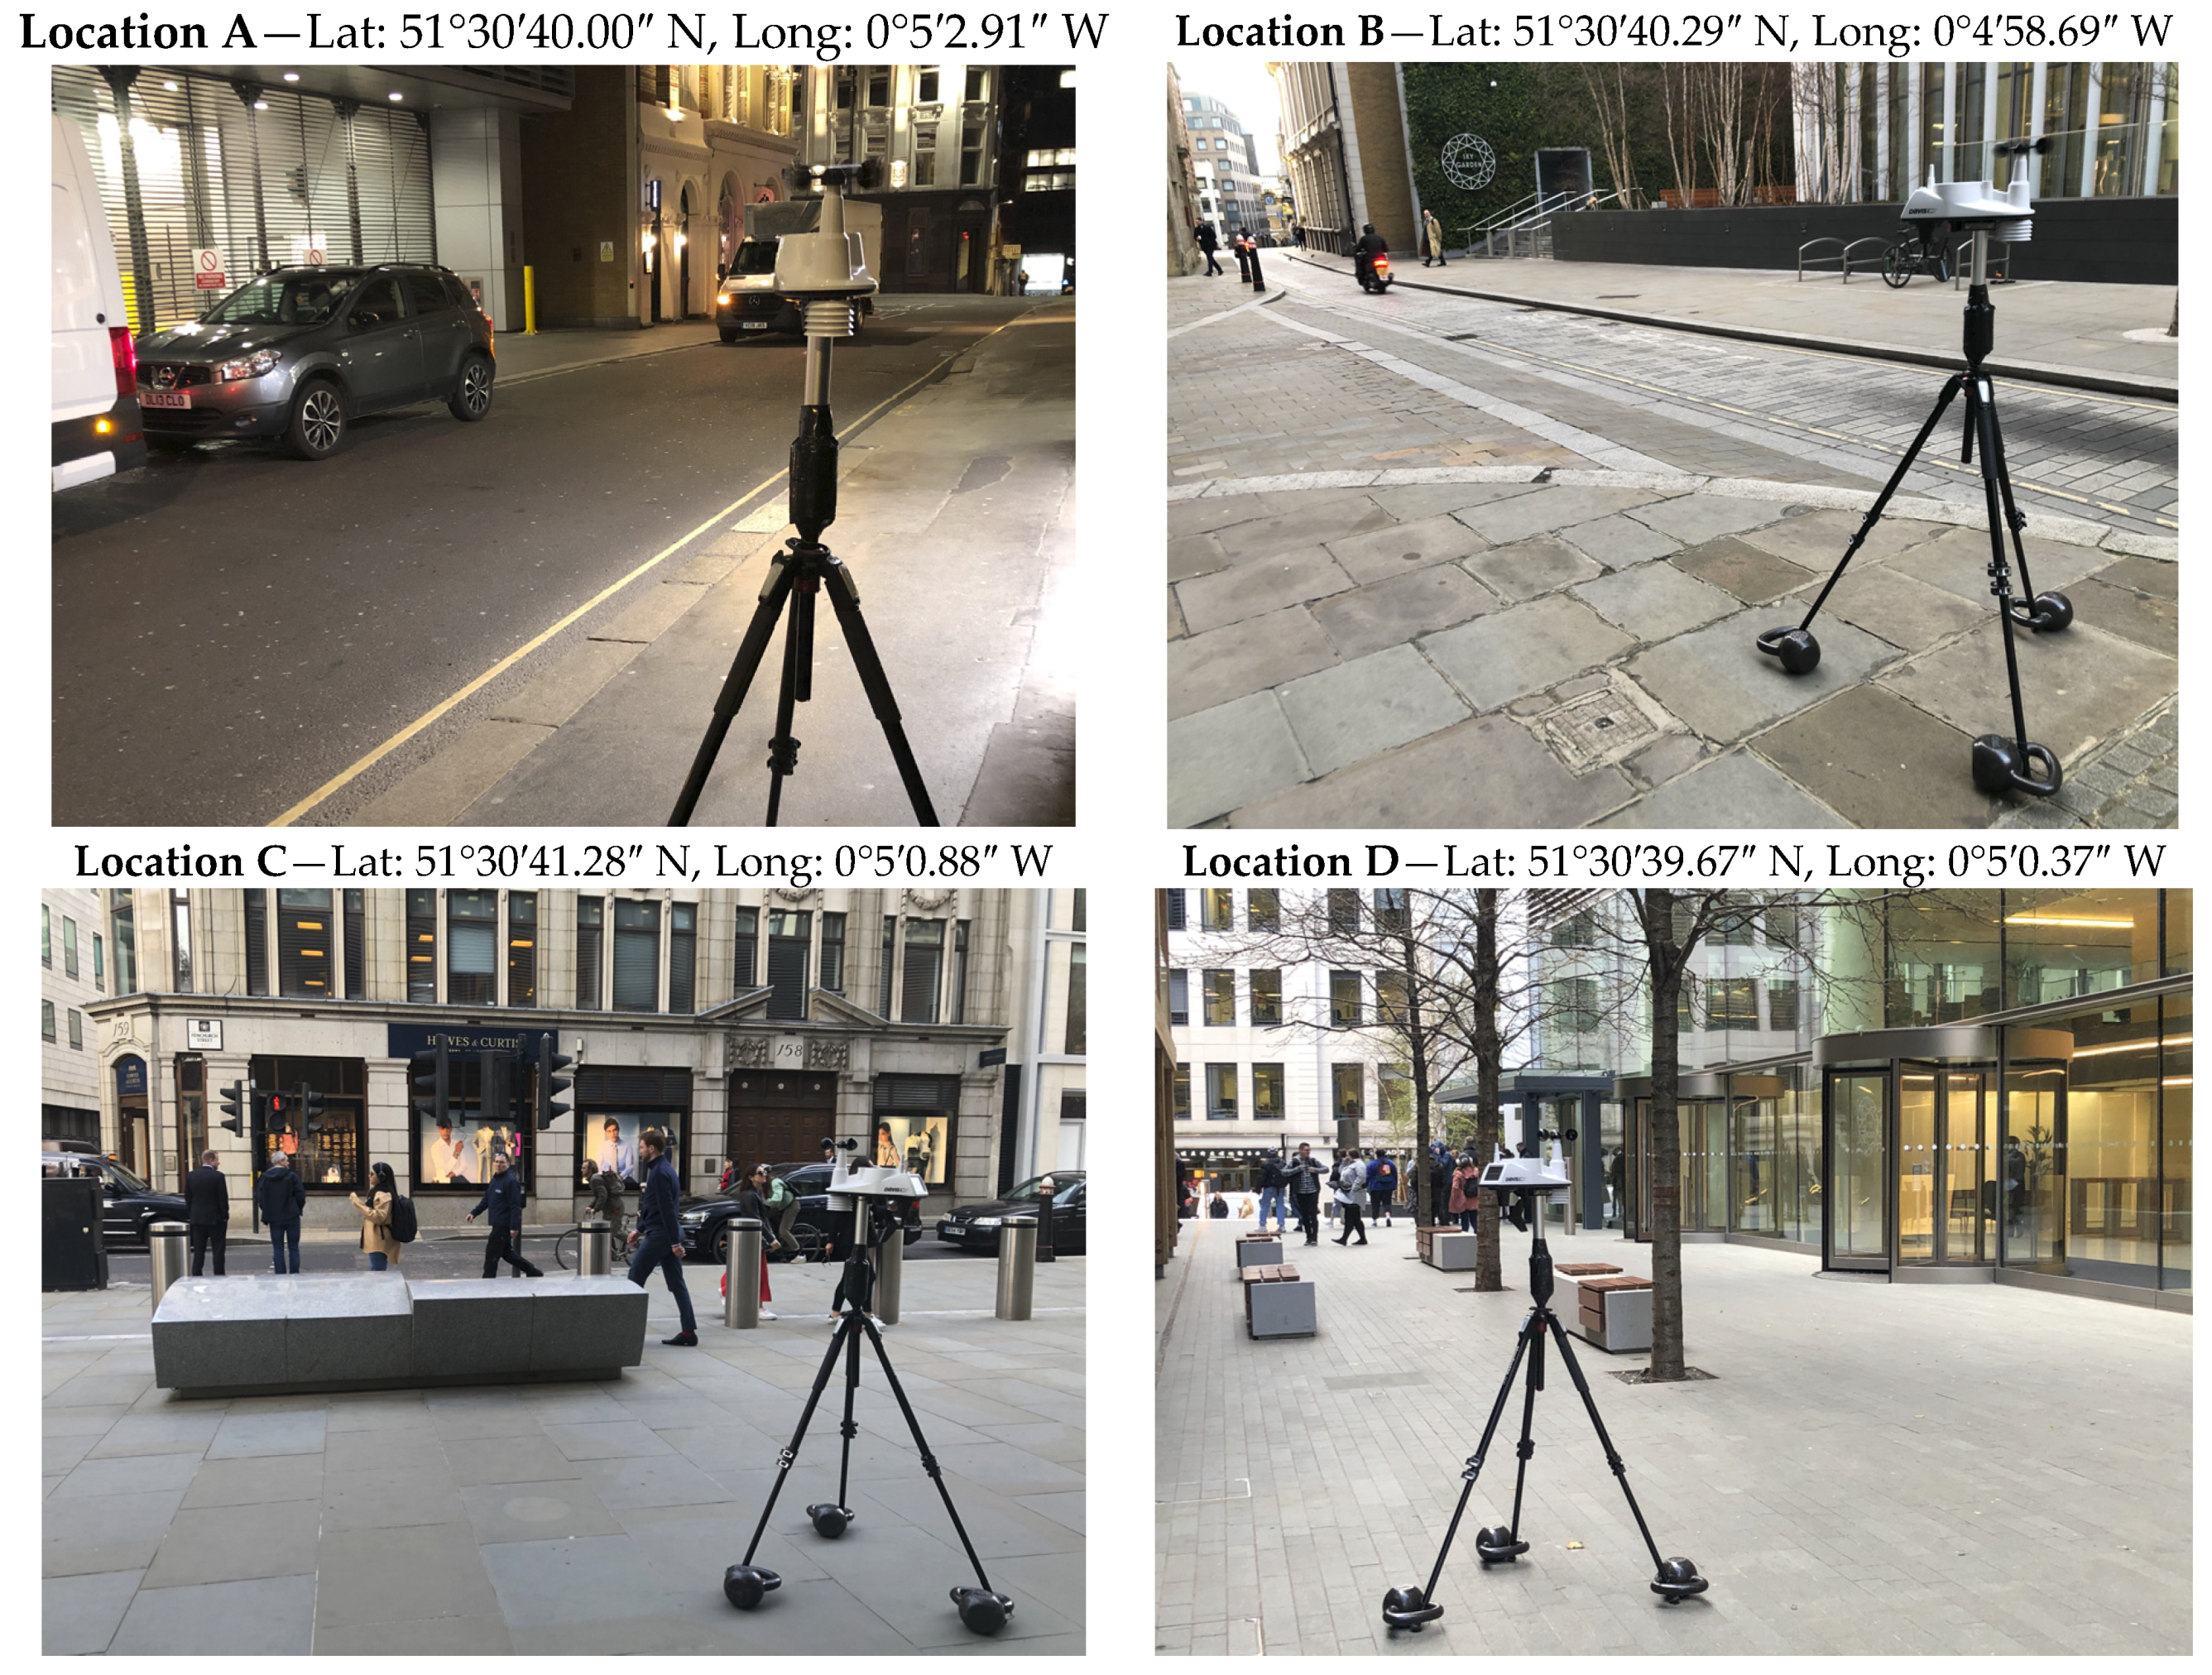
A validation assessment was conducted to verify the agreement between wind speeds predicted by CFD simulations and those measured in the real environment. Field measurements were taken using a mobile weather station (see Section 2.2.1), positioned at 1.5 m above ground level at Site 1-1 near the target Walkie-talkie building.
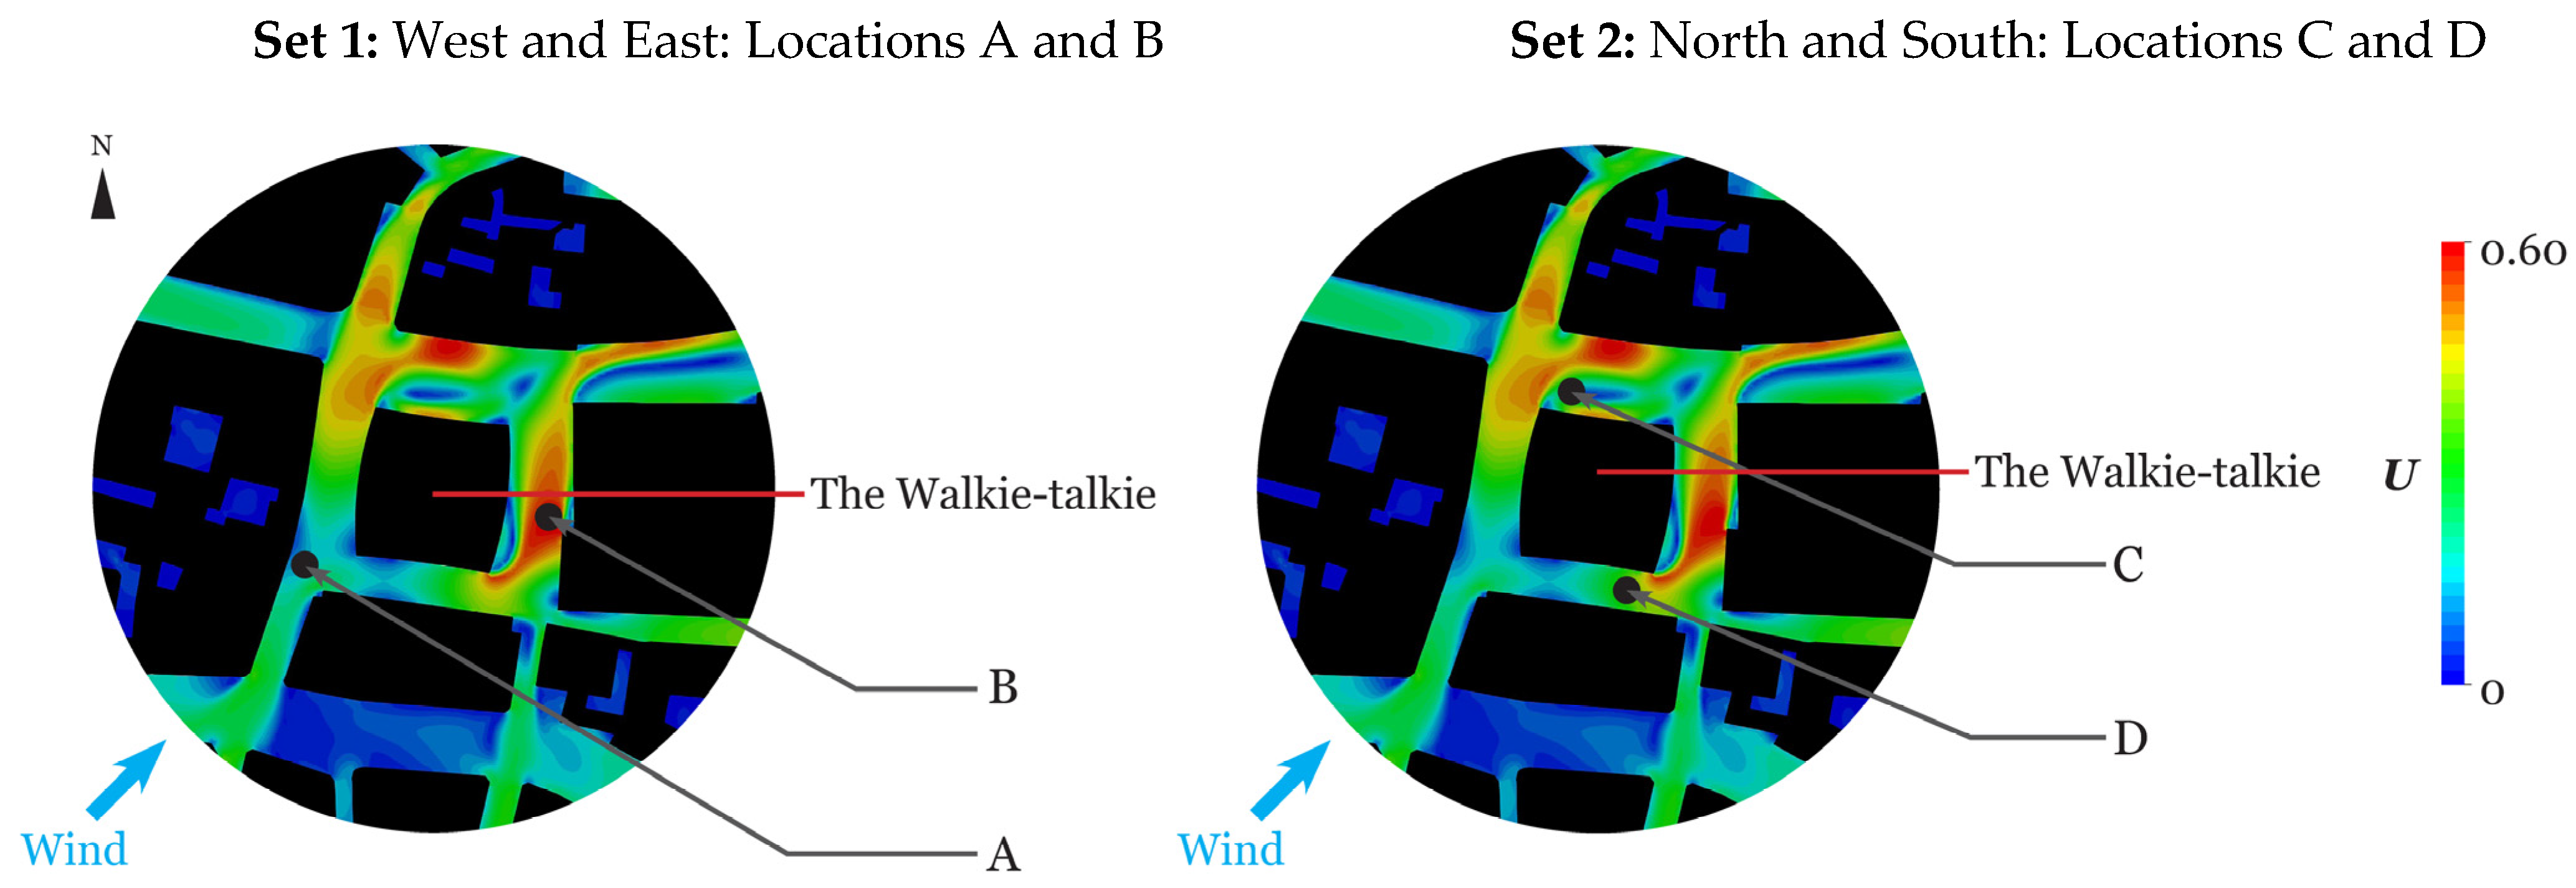
The primary validation approach involved a comparison of wind speeds at discrete measurement locations that comprised both high and low wind speed scenarios. These measurement locations were strategically chosen through a preliminary CFD simulation, employing boundary conditions identical to those outlined in Section 2.1.2, with a specific focus on the prevailing southwesterly wind direction in London. From the simulation results, two distinct sets of measurement locations, denoted as A–B and C–D, were identified, each predicting relatively low and high wind speeds (depicted in Figure 6). The exact locations are also shown in Figure 7.
However, during the actual measurement days, the prevailing reference winds recorded at London Heathrow Airport (LHR) approached from alternative directions (not southwesterly), resulting in lower velocity magnitudes than initially anticipated. While an optimisation strategy employing the use of a comprehensive wind map that reveals the locations of high and low wind speeds based on all wind directions could have improved the measurement locations chosen on the day, it is crucial to underline that the central objective of this investigation lies in validating the specific CFD methodology employed in this research.
Some of the known limitations in the comparisons made by this study are as follows:
  • Limited Measurement Times
Given the location of the project site (i.e., pavement in the centre of the CoL), the measurements could only be collected for a limited time; the mobile weather station could not be semi-permanently installed, such as the optimal duration of six months or one year, as this was unfeasible in a busy city centre. Therefore, a total of twenty hours of wind data (see Section 2.2.2) were recorded. Notably, only two days of wind measurements are used for the validation process of building commissioning in industry practices; thus, the twenty-hour duration of the obtained wind data is justifiable for the purposes of this study.
  • Simplifications in Computational 3D Model:
Given the research focus on the impact of overall massing shape on PLWs, detailed building designs, such as canopies, intricate roof structures, and elevation shapes, were not modelled in the computational 3D model. In addition, no vegetation providing pressure drop was considered.
  • Distance to Meteorological (Met) Weather Station:
The reference wind speeds were sourced from the London Heathrow Airport (LHR) Met Office ( z 0 = 0.03 m and z r e f = 10 m above ground level), situated 26 km from the measurement site. While several closer Met Office weather stations are available, none offer reliable open-source hourly mean wind data. Consequently, for validation purposes, the wind speed and direction documented at LHR on the day of measurement were employed as references to establish the inlet boundary conditions for the CFD simulations.
  • Availability of the Mobile Weather Station:
Owing to the limited availability of a singular mobile weather station, a one-hour interval was necessitated for the setup between consecutive measurements conducted on the same day.
  • Movement of People:
The presence of human activity introduces a dynamic factor that can potentially impact the precision and reliability of field measurements, especially in urban settings where pedestrian movements fluctuate throughout the day. Effectively addressing this variable poses challenges without resorting to obtrusive measures, such as installing barriers, which would also artificially alter the wind microclimate and would need to be modelled computationally. Consequently, the averaging of velocity over time was employed to attenuate subtle wind variations arising from people movement.

2.2.1. Mobile Weather Station

The DAVIS Vantage Vue 6250 mobile weather station [43] was attached to the tripod with the steel pole, and three 10   k g kettlebells were fixed with wires at each leg of the tripod to avoid movement (Figure 8). The update interval (instant reading) of DAVIS Vantage Vue is 2.5 to 3 s. WeatherLink USB data Logger 6510 [44] was connected to the console to record wind speeds in m / s and wind direction from 16 angles (22.5° increment). The logged wind data were extracted using WeatherLink software (v. 6.0.5), and the data represented the measured wind data as the average wind speed and dominant wind direction for 1 min (that is the shortest time interval from the WeatherLink software) with one decimal place.

2.2.2. Measurement Time

The selection of measurement times and dates in this study was driven by the occurrence of high wind speeds. London experiences its highest hourly-mean wind speed during the winter, reaching 4.2 m/s at 10 m above ground level (25 m above mean sea level) at LHR weather station (51.48 N, 0.45 W) from 1973 to 2020, as documented by the CEDA Archives [45].
A more focused examination of recent wind data spanning 2018 to 2020 revealed that the peak hourly mean wind speed occurred in February, registering at 5.0 m / s , whilst the second highest wind speed was recorded in March at 4.8 m / s (outside of the winter period). Given the heightened relevance of the recent three-year wind dataset to the current research, February and March were selected as the months for conducting measurements.
Considering the range of high hourly mean wind speeds observed over the three-year wind dataset (4.2 m / s to 5.0 m / s ), measurement times were strategically chosen when the reference wind speeds exceeded 4.0 m / s (refer to Table 4 and Table 5). A total of 20 h worth of data was recorded during the measurement campaign.
As the primary objective of the field measurement was to validate steady-state ‘worst-case’ wind conditions during the windiest period of the year rather than to capture seasonal variations, the choice of these 20 h measurement periods is justifiable. More importantly, the core priority of this validation process was to assess whether the current industry-standard approach (using RANS) could reliably predict wind speeds and directions to examine comfort condition, rather than account for annual wind variability.

2.3. Meteorological Data

For the assessment of PLW comfort, thirty-six wind directions are recommended by the CoL wind microclimate guidelines [6]. The increased number of wind directions give a more accurate representation of the PLW comfort environment; however, this leads to higher computational cost [46]. Thus, considering the aim of the current research (namely, to improve PLW comfort by developing design procedures for tall buildings), four wind directions were used to give an indicative performance metric to assess whether a building geometry is better or worse (refer to Figure 9). Four wind directions have been proven to provide sufficiently accurate comfort analysis; however, no detailed analyses were conducted relating to safety concerns exceeding 15 m/s for more than approximately 2 h per year [46,47]. The assessments of PLW comfort focused on the winter season only, as the highest hourly mean wind speeds occurred at 4.2 ( m / s ) in winter based on the weather data at the LHR from 1973 to 2020 [45].
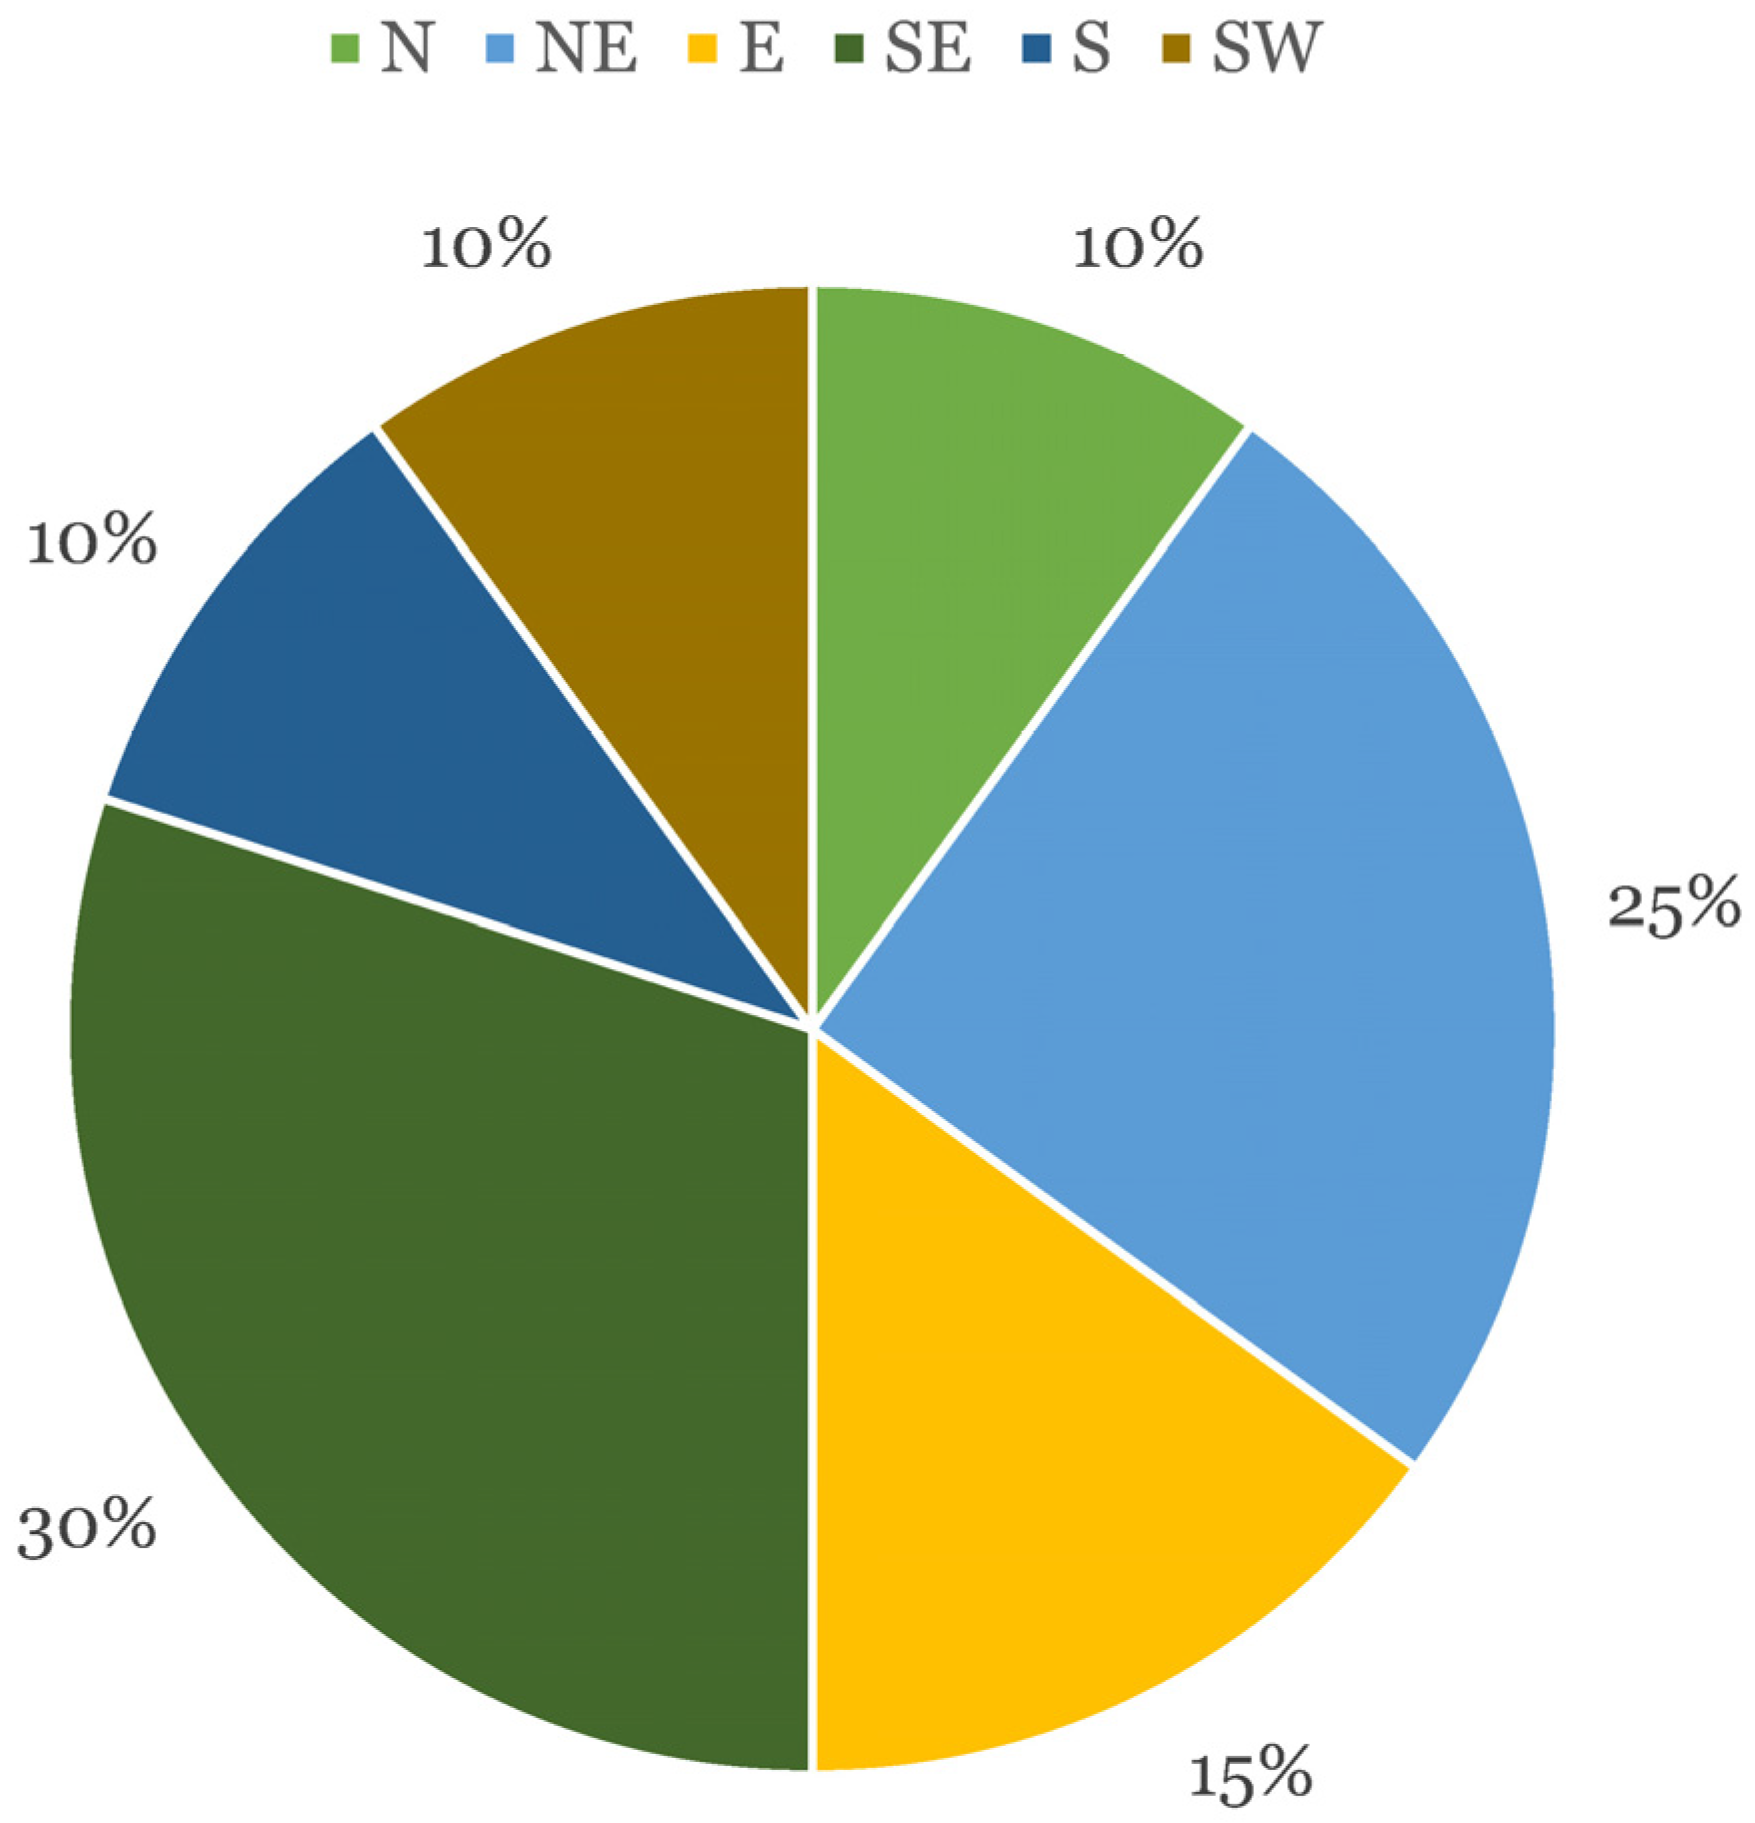
Note that the graph in Figure 9 was derived from the Weibull distributions from [6]. Thirty-six wind directions were converted into four wind directions. Each colour represents wind speeds (in m / s ) at the CoL at a height 518 m above ground that were estimated based on wind data at the Heathrow Airport (LHR) weather station from 1973 to 2017 and London City Airport (LCY) from 1988 to 2017 [6].

2.4. Pedestrian Comfort Criteria

The benchmark used for pedestrian comfort analysis in this investigation was of that developed by the CoL [6], which is a modified version of the Lawson LDDC criteria referred to as the City Lawson Criteria, as summarised in Table 6. The criteria are activity specific; for example, higher wind speeds are considered ‘acceptable’ in this index in areas where the public is merely walking through rather than sitting. For pedestrians standing near an entrance, for instance, conditions are considered ‘unacceptable’ if wind speeds exceed 6 m / s more than 5% of the time.
In addition, the criteria specify a minimum safety criterion that must not be exceeded, as it may pose a risk to vulnerable pedestrians. The limit, for all wind directions, is 15 m / s wind velocity which must not be exceeded more than 0.022% per year.
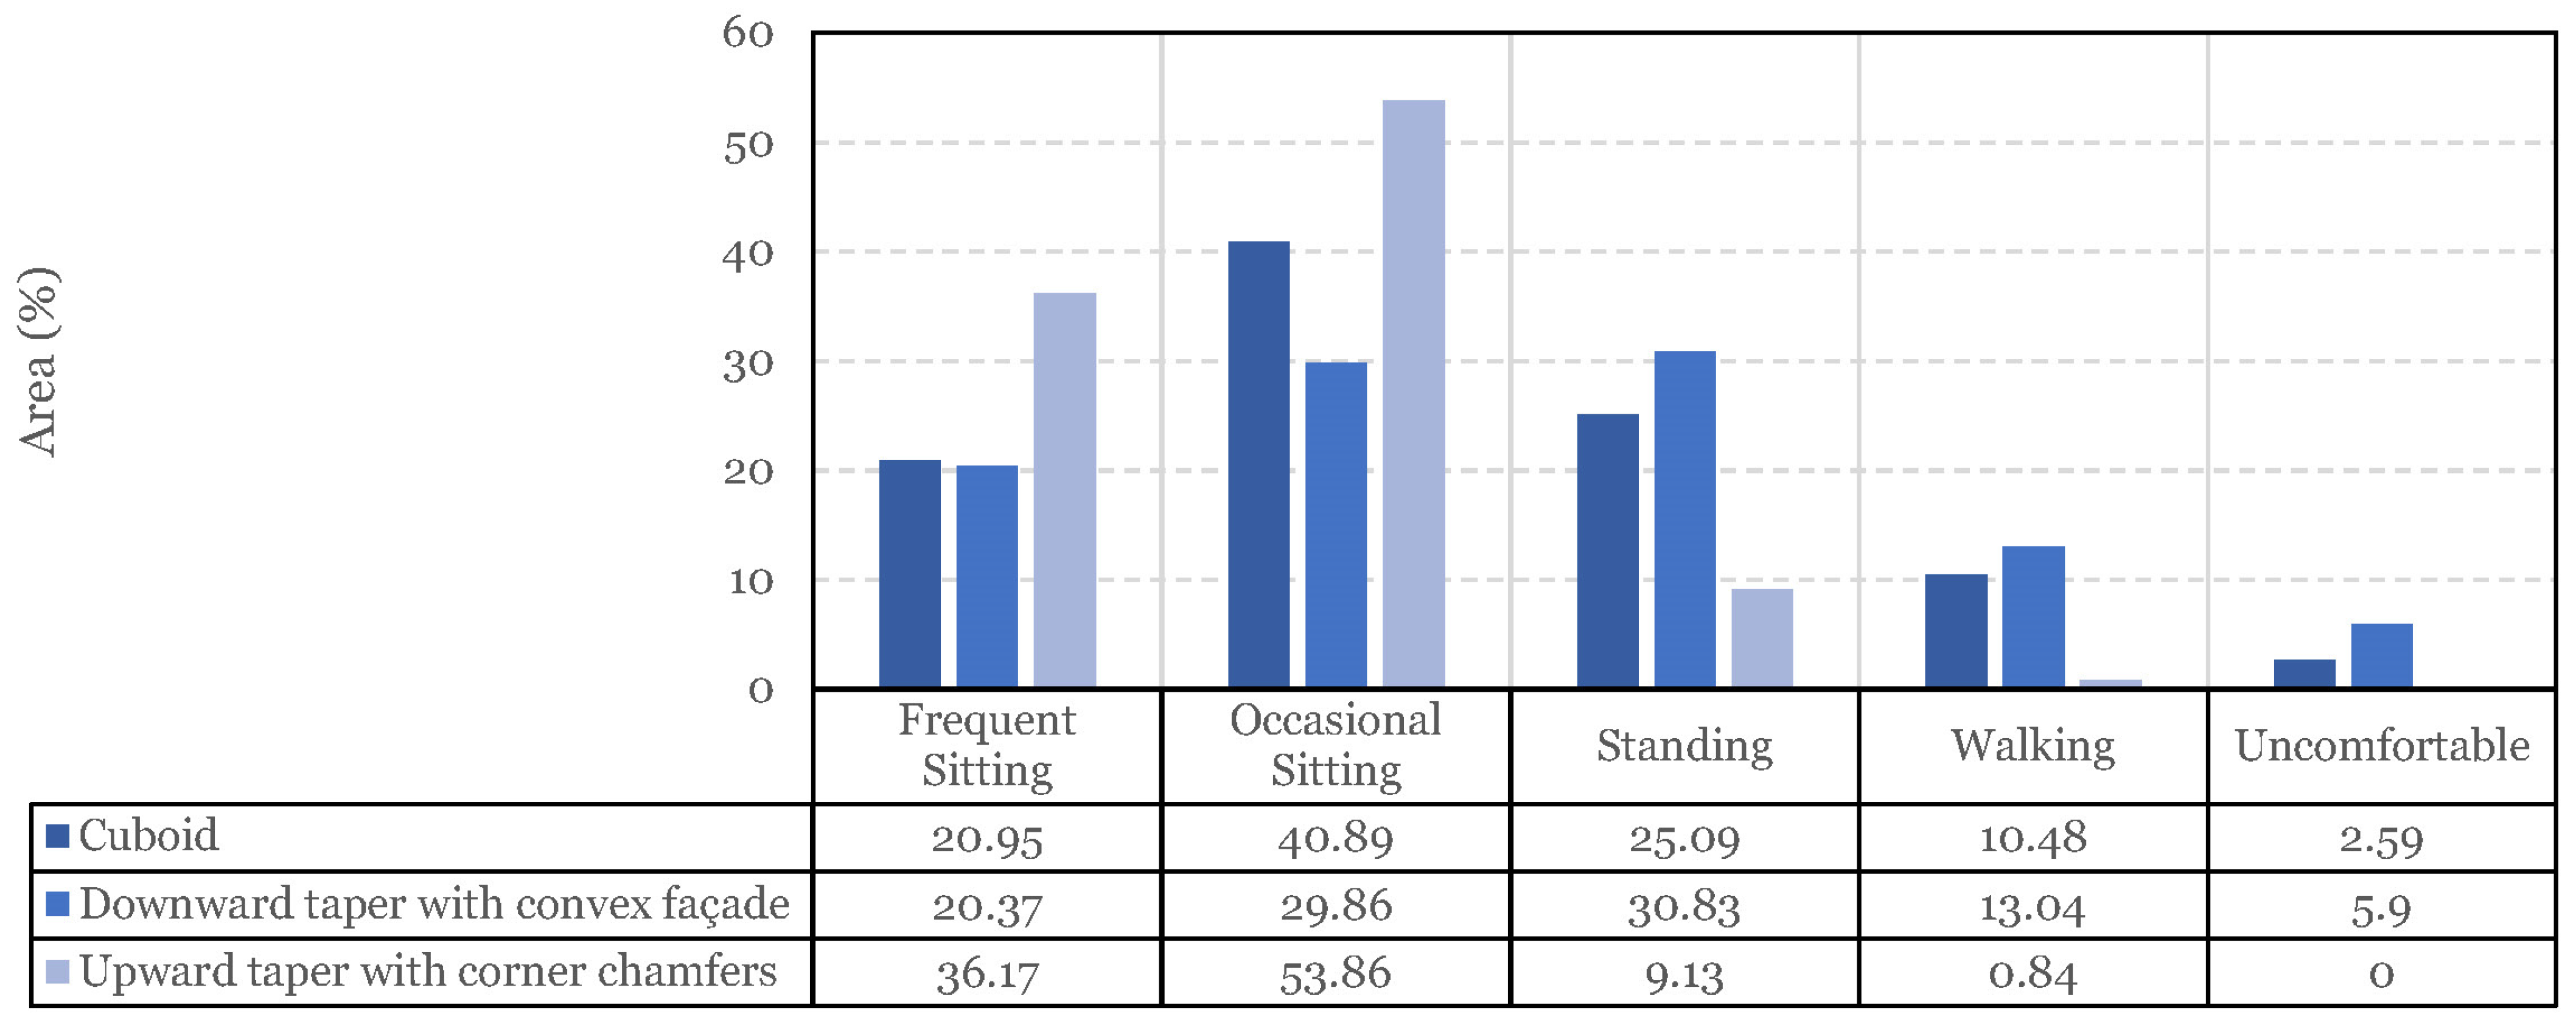
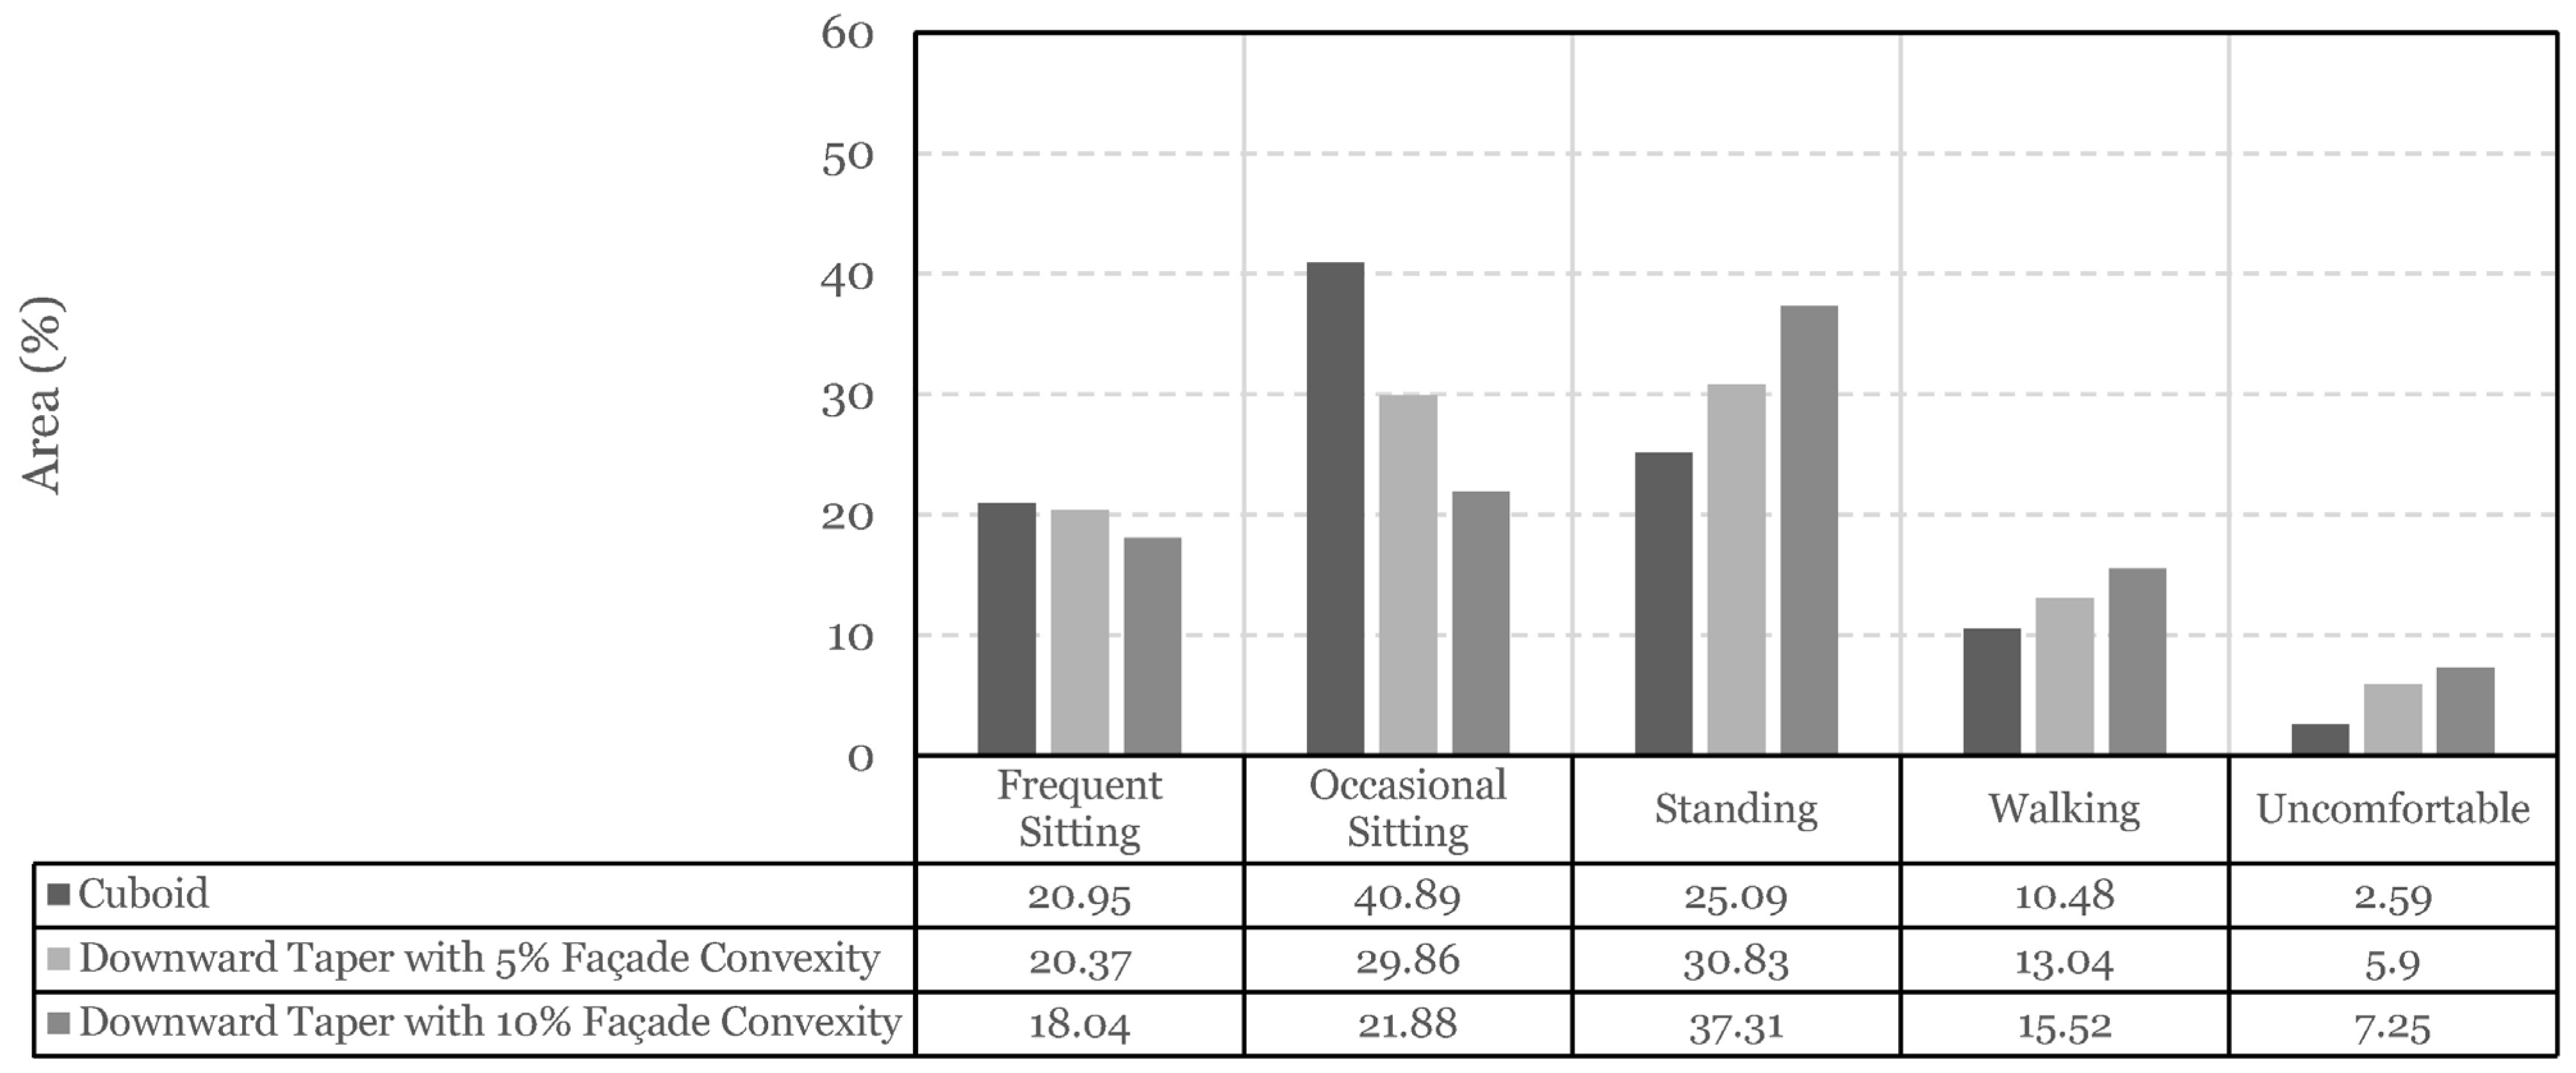
This investigation utilised these criteria, as they are the most up to date and are approved by the CoL government. It concentrated on the comfort conditions (excluding the safety criterion) as a comparative metric, without taking into consideration the activities assigned for each location. Note that an increased extent of areas with conditions suitable for standing and walking or those that are uncomfortable serves as an indicator of suboptimal building geometry performance, signifying higher PLW speeds. Conversely, larger areas with conditions suitable for frequent sitting and occasional sitting imply that the building provides more favourable PLW conditions, signifying reduced PLW speeds.

3. Results and Discussion

3.1. Computational Fluid Dynamics

3.1.1. The Effect of Building Geometry

Site 1-1

The results of the City Lawson Criteria for the three target building geometries at Site 1-1 are shown in Figure 10. Figure 11 also shows the percentage of the area each category occupied within the 200 m diameter to determine the scale of effect these geometries have on the total area accessible to pedestrians.
It appears that the building that was downward-tapered with a convex façade exhibited the least favourable outcome, as it yielded a larger area characterised by uncomfortable and walking conditions compared to the other two geometries. In contrast, the baseline cuboid geometry exhibited a lower area of uncomfortable and walking conditions, while the building that was upward-tapered with chamfered corners was nearly absent of such conditions. As such, the performance of the building that was upward-tapered with chamfered corners was substantially better than the other two geometries in terms of wind comfort.
With the cuboid and downward-tapered geometries, the areas of accelerating winds appear to start from the northwestern and southeastern corners. This is expected, as southwesterly winds make the largest contribution to high wind speeds compared to other wind directions, as shown by the meteorological data (Figure 9). These winds would stagnate at the southwesterly corner and wrap around the building geometry before separating at the northwestern and southeastern corners, resulting in such accelerations. Contrary to the geometry that was upward-tapered with chamfered corners, it appears to dampen this acceleration.
The underlying factors governing the PLW comfort conditions described above can be explained through an examination of streamlines of the wind speed ratio, as depicted in Figure 12. Given that the comfort conditions are predominantly influenced by the prevailing winds, the analysis focuses on the southwesterly wind direction.
The broader profile of the building that was downward-tapered with a convex façade contributed to an increased pressure differential between the western and northern building surfaces, consequently creating a more pronounced corner acceleration. This resulted in higher wind speeds extending over a greater distance on the north side of the building, with an elongated wake region compared to the other two geometries.
The corner chamfers incorporated into the design of the upward-taper served to mitigate the pressure differential between the western and northern facades. This, in turn, resulted in a reduced corner acceleration and a larger flow separation on the northern side.
An additional factor contributing to the relatively higher PLWs experienced in the vicinity of the building that was downward-tapered with a convex façade pertains to the irregular spatial relationships between the target building and its neighbouring structures, as illustrated in Figure 13. Unlike the flat surface of the cuboid design, which maintains a consistent distance between the target building and its surroundings with perpendicular angles, the curvature of the façade introduces variability in these distances, resulting in the intensification of the Venturi effect [34].
Consequently, in the southeastern corner, the downdraught winds from the convex southern façade of the downward-tapered geometry experienced greater acceleration compared to both the cuboid building and that with an upward-taper with chamfered corners. These accelerated winds were subsequently diverted by the convex façade and redirected by the eastern neighbouring building.
The upward-tapered design, in contrast, extended the distances between the target building and the surrounding structures with perpendicular angles beyond those of the cuboid building and that with a downward taper and a convex façade. This reduced the Venturi effect, which led to less pronounced wind acceleration at the building corners.

Site 1-2

At Site 1-2, the three target buildings exhibited similar PLW comfort patterns, as shown in Figure 14. Notably, in this location, the presence of taller neighbouring buildings, such as the Leadenhall (standing at 224.0 m ) and 22 Bishopsgate (standing at 278.2 m ), in the prevailing southwesterly wind direction minimised the impact of the target building geometries on PLW comfort.
The marginal variations in comfort conditions within the occasional sitting, standing, and walking criteria (as shown in Figure 15) were associated with flow interactions between the buildings, the wake characteristics of each geometry, and the contribution of other wind directions.

Site 2

At Site 2, which was characterised by a moderately sheltered environment and expansive grid-shaped open spaces, PLW comfort was once again influenced by the geometric configuration of the target building, in contrast to Site 1-2, as demonstrated in Figure 16. The three target building geometries in this setting were not only taller than those at Site 1-1 but were also surrounded by larger open spaces, leading to a pronounced increase in the percentage of area occupied by standing and walking conditions, as shown in Figure 17. Even in this altered context, the building that was upward-tapered with chamfered corners continued to demonstrate a better performance when compared to the other two geometrical designs.
The convex façade of the geometry that was downward-tapered also appeared to outperform the cuboid geometry. It efficiently redirected fast-moving winds along the street canyon, as opposed to permitting their flow between buildings, as observed in the case of the cuboid geometry. This observation added a layer of intricacy to the understanding of PLW dynamics in urban settings.
These analyses highlight that the performance of standalone buildings differs significantly from those situated within an urban context. The findings from the previous study of isolated buildings demonstrated that the downward-tapered building, with or without a convex façade, exhibited a superior performance by yielding relatively low-speed PLWs in three critical zones, namely the corners, the free shear layer, and the wake areas. In contrast, the buildings that were cuboid and the upward-tapered with chamfered corners showed less favourable PLW conditions among a total of 38 geometries based on London’s popular building shapes [33]. However, the situation changed when transitioning to the urban environment. In this context, the building that was downward-tapered with a convex façade exhibited poorer performance, leading to higher PLWs, while the building that was upward-tapered with corner chamfers demonstrated improved PLW conditions. This shift in performance can be attributed to the complex aerodynamic interactions that the surrounding buildings introduced, which negated the performance advantages seen in isolated conditions [33].

3.1.2. The Effect of Context Geometry

Figure 18 provides a summary of key geometrical metrics, including the target building height, the average height of the surrounding buildings, and the OAR within various contextual settings. Notably, the open area ratio progressively increases from Site 1-1 to Site 2. Site 1-2 stands out with the shortest target building height and with the highest average surrounding building height. Conversely, Site 2 features the tallest target building, accompanied by a slightly reduced average surrounding building height compared to Site 1-2.
While these metrics distinguish the geometric aspects into three primary parameters, it is crucial to acknowledge that the geometrical variations of buildings, their placement, and street configurations exert significant influence on the resultant comfort conditions, as discussed in Section 3.1.1. Nevertheless, these metrics serve as valuable tools for a rapid assessment of potential comfort issues.
As illustrated in Figure 19, Figure 20 and Figure 21, there is a consistent trend indicating that an increase in the average surrounding building height and open area ratio leads to a progressive expansion of areas occupied by walking use. Remarkably, this trend holds true regardless of the target building’s geometry, height, or placement, provided the analyses are confined to a 200   m diameter around the target building. This phenomenon is anticipated, as taller structures and more open spaces create a greater likelihood of forming tunnelling effects between buildings.
However, when it comes to severe uncomfortable conditions, the relationship with average building height and open area ratio is inversed. Higher average surrounding building heights and reduced open area ratios tend to generate more localised accelerations, especially at sharp building corners and street canyons, resulting in larger areas characterised by uncomfortable conditions. Note that an optimised building geometry, such as the one with an upward taper and chamfered corners, deviates from this trend by substantially mitigating uncomfortable conditions.
As discussed in Section 3.1.1, the diverse geometries of the target buildings yield distinct comfort conditions, a trend reaffirmed across the various sites. Intriguingly, in the context of areas occupied by frequent sitting use, lower open area ratios appear to yield larger spaces for such use, regardless of the other two parameters. However, the magnitude of these areas is influenced by the choice of building geometry, with the upward taper and chamfered corners proving most effective in maximising areas for frequent sitting. In contrast, for the categories of occasional sitting and standing use, the trend appears to be more responsive to the specific target geometry, resulting in irregularly distributed occupied areas.

3.1.3. The Effect of Building Height

Site 1-1

The comparative analysis of PLW comfort between a cuboid building at its existing height (160.1 m ) and an increase of 50% of the existing height (240.15 m ) revealed that the taller structure performed less favourably at Site 1-1. This was evident through a greater proportion of walking use areas (14.11%) and uncomfortable areas (5.65%) observed, as illustrated in Figure 22 and Figure 23. The uncomfortable areas extended further to the north and southeast sides of the building. This extension can be attributed to the increase in building height, resulting in increased pressure differentials between the windward and leeward façades and adjacent surfaces, which, in turn, generated more pronounced down-washing and corner accelerations.

Site 1-2

At Site 1-2, a remarkable similarity in the overall comfort patterns was observed, as illustrated in Figure 24 and Figure 25. This outcome may not come as a surprise, since the presence of taller buildings effectively obstructed the prevailing winds arriving from the southwest, preventing them from directly interacting with the target building elevations. Consequently, the increase in the height of the target cuboid building to 176.85 m had a relatively minor impact. The subtle variations in the results can be attributed to the influence of the other three wind directions, which were more pronounced due to the heightened structure.

Site 2

At Site 2, which was characterised by an OAR of 64.91% (larger than the other two sites), the introduction of a taller target building, standing at 301.5 m, notably expanded the areas suitable for walking use conditions (33.44%), as depicted in Figure 26 and Figure 27. While the increase in the uncomfortable area due to the heightened cuboid was minimal, it was localised to the vicinity of its northwest corner. Additionally, the taller structure led to a reduction in the available space suitable for occasional sitting and standing.

3.1.4. The Effect of Façade Angle

Upward-Tapered

In the investigation of façade angle’s impact, modifications were made to the angles of the two tapered geometries. For the geometry that was upward-tapered with chamfered corners, depicted in Figure 28 and Figure 29, subtle adjustments to the façade angle exhibited a pronounced influence on PLW comfort. The reduction in façade angle improved PLW comfort, marked by an expansion of areas suitable for occasional sitting and a substantial reduction in spaces suitable for standing and walking use.
The streamlines of the wind illustrated in Figure 30 revealed that, when the façade angle was reduced, the frontal area facing the wind decreased, resulting in a mitigated pressure differential between the windward and leeward façades, as well as adjacent elevations of the building. Consequently, the acceleration at the northwest and southeast corners reduced as the façade angle transitioned from 90° to 82°.

Downward Tapered

Unlike the upward-tapered geometry, increasing the convexity of the façade has a detrimental effect on PLW comfort for the downward-tapered geometry. This effect manifested in reduced areas suitable for frequent/occasional sitting and an expansion of areas suitable for standing and walking, as well as uncomfortable zones, as shown in Figure 31 and Figure 32.
As convexity increased from 0% to 10%, the uncomfortable areas progressively extended over a greater distance along the northerly regions of the target building. Furthermore, the area affected by uncomfortable conditions at the southeastern corner moved between the two convex tapered sizes due to the reduction in space between the target building and southern existing buildings with perpendicular angles, which caused the Venturi effect.
The wind streamlines depicted in Figure 33 offer valuable insights into the repercussions of introducing convexity to the southern façade, which underline the adverse conditions previously discussed. Two pivotal aerodynamic changes arise from this alteration, contributing to the observed effects.
The first change pertains to the elongation of the western elevation, which interacts with the prevailing southwesterly wind direction. This elongation redirects faster winds toward the northwesterly corner, inducing a heightened pressure differential between the western and northern elevations. Consequently, the increased pressure differential prompts the wake on the northern elevation to expand across the full width of the building.
The second impact of convexity on the southern elevation involves the narrowing of the space between the target building and the adjacent southern structures with perpendicular angles, generating the Venturi effect by compressing the airflow. However, with 10% convexity, this compression reaches a point where it entirely alters the flow structure, creating a unique and distinct aerodynamic phenomenon.

3.2. Field Measurements

Wind Speeds Comparison

Figure 34 shows the analysis of hourly mean wind speeds at four different locations around the Walkie-talkie tower at various times and dates throughout the windy season between February and March 2022. It is also accompanied by the dominant wind direction recorded for each measurement made, along with the reference wind direction at LHR. It is evident that the trend and magnitude of wind velocity predicted by CFD reasonably correlates to that obtained from field measurements. Differences in magnitude between the site measurements and reference velocity were expected, as the measurements were taken at different heights with different terrain roughness; therefore, the reference velocity should theoretically always be higher, unless the site measurement location was at a locally accelerated zone.
In terms of wind direction predictions, CFD generally aligned with field measurements, with minor variations of approximately 45 degrees. These minor discrepancies were associated with the way wind direction is presented in the table, as only the dominant wind direction was considered. The contribution of other wind directions sampled within the measurement period was neglected in this analysis for simplicity. All other wind directions that deviated by more than 45 degrees primarily occurred when winds approached from a southeasterly direction. These deviations often coincided with measurement locations in flow recirculation zones, contributing to inconsistencies between the two methods.
At measurement location A, CFD predictions demonstrated relatively low sensitivity to the reference wind speed and direction, resulting in predictions of around 1.5 m / s . Field measurements displayed similar values, albeit with increased data variability due to the measurement location’s proximity to a separated flow zone. This inherent turbulence in the area led to anticipated fluctuations in wind speed measurements.
Measurement location B exhibited significant variations, particularly on the 8th and 12th of February, when strong southerly and southwesterly winds prevailed. These wind patterns, characteristic of southern England, contributed to the substantial fluctuations in wind speeds, exacerbated by the measurement location’s placement in an accelerated flow zone. Conversely, measurements taken during winds from southeasterly and northeasterly directions exhibited lower wind speeds, reflecting the accelerations occurring in different regions of the site outside the measurement zone.
At measurement location C, relatively low-speed winds expected in Section 2.2 were recorded despite that winds approached from non-prevalent directions at the measurement times and dates. Two notable deviations were observed on the 22nd and 31st of March, where CFD overpredicted wind accelerations. Conversely, at measurement location D, CFD underpredicted wind speeds on the same days. This observation suggests that the turbulence model used in CFD simulations may struggle to accurately predict low wind speed magnitudes in separated zones in certain conditions.
Lastly, measurement location D was initially selected to capture intermediate wind accelerations. However, due to the non-prevalent wind directions during the measurement period, most measurements recorded low-speed conditions. An exception occurred on the 19th of March when easterly winds aligned with the southern street, creating the Venturi effect, resulting in higher wind speeds at this location.
Examining the wind direction reported by the reference (LHR) indicated that, while the measurements were made, the prevailing winds predominantly approached the measurement site from southeast and northeast, not from the annually prevailing southwesterly winds. Only two instances featured the prevailing southwesterly winds, as indicated in the table in Figure 34 and the pie chart in Figure 35, which highlight the common wind directions approaching the target site.
In an overarching analysis of wind speed data shown in Figure 36, without delving into the nuances of wind direction and measurement location, the CFD predictions appear to be within a reasonable margin of error, particularly when considering the inherently gusty nature of wind, as indicated by the presence of error bars. It is worth noting that a substantial portion of the error bars intercepts the linearity line, revealing that, even for an average analysis of CFD, agreement with field measurements are possible. The true variability between the data is calculated as 79.59% ( R 2 = 0.7959 ) , further affirming using the RANS approach, can be employed for wind speed predictions in PLW comfort research, as supported in [48].
The comparison of CFD predictions, field measurements, and reference wind speeds reveals that CFD simulations generally track the wind patterns observed in the field, despite certain discrepancies. The discrepancies often arise from complex wind interactions and flow dynamics, such as deflections caused by nearby structures. This highlights the importance of considering local architectural features and environmental conditions when conducting CFD simulations for accurate wind predictions. Nonetheless, RANS remains a valuable tool for representing wind patterns and their effects on built environments.
Moreover, the key takeaway from this examination is that simply selecting a wind direction from CFD and conducting field measurements with the expectation of achieving similar results are invalid approaches. A more appropriate strategy would involve creating a wind map of the study site and highlighting the locations affected by different wind directions and acceleration zones. This information could then be utilised to strategically select measurement locations based on the prevailing wind direction on the specific day of field measurements, thereby improving the accuracy and relevance of the data collected.

4. Conclusions

PLW comfort plays a crucial role in shaping the habitability and vibrancy of urban environments. This paper investigated the complex interplay of building geometry, context geometry, building height, façade angle, and field measurements on PLW comfort across diverse urban settings. The findings shed light on the relationships between these factors and their collective impact on wind dynamics, ultimately influencing pedestrian experiences.

Key Findings

  • Geometric Influence: PLW comfort conditions are intricately linked to the interaction of building shapes, wind directions, and environmental contexts. Across three distinct sites, the research revealed the high sensitivity of PLW dynamics to the geometric configuration of target buildings. Notably, upward-tapered designs with chamfered corners consistently outperformed other configurations, showcasing the crucial role of aerodynamic considerations in enhancing pedestrian comfort and fostering pleasant urban experiences.
  • Urban Context Matters: The analysis of urban geometric metrics revealed intriguing insights. Higher average surrounding building heights combined with open area ratios tend to expand walking areas, potentially exceeding desired levels. Conversely, lower average surrounding building heights with lower open area ratios resulted in larger areas characterised by uncomfortable conditions that necessitate avoidance. Optimised building geometries, like those with upward tapers and chamfered corners, demonstrate the potential to mitigate uncomfortable zones and create more favourable microclimates within these contexts.
  • Height Variation: Investigation into the impact of building height variation across the three sites revealed nuanced, site-specific responses. Increased building height at Site 1-1, for example, led to discomfort due to intensified pressure differentials. In contrast, the presence of surrounding tall buildings minimised the impact of height variation at Site 1-2. At Site 2, increased building height led to expanded walking areas, reducing space suitable for sitting and standing uses. These findings highlight the need for context-aware urban planning decisions that balance vertical growth with pedestrian comfort.
  • Façade Angles: The examination of façade angles, particularly in upward-tapered buildings with chamfered corners, revealed that decreasing angles improved comfort by expanding areas suitable for sitting use and reducing standing use and walking use spaces. However, convexity in the southern façade presents challenges, contributing to adverse PLW conditions. These findings suggest the potential for targeted façade design to further optimise microclimatic conditions and enhance pedestrian comfort.
  • CFD vs. Field Measurements: The comparative analysis of field measurements and CFD simulations of hourly mean wind speeds around a prominent landmark building that has been criticised with strong PLWs demonstrated consistent correlations, showcasing CFD’s utility as a predictive tool for assessing wind velocities in built environments. While minor discrepancies were observed due to site-specific factors, the overall agreement between CFD and field data advocates for a nuanced approach. The collaborative use of CFD and field measurements can enable the creation of comprehensive wind maps with enhanced predictive accuracy, thereby offering valuable insights for optimising urban design interventions and ensuring accurate field data collection in complex urban settings.

5. Design Recommendations for Architects

The design recommendations focus on PLW comfort conditions, aiming to equip architects with strategies for mitigating adverse wind effects prior to detailed scrutiny from wind engineers.

5.1. Tall Building Surrounded by Short Buildings with a Small Open Area

5.1.1. Façade Angle

  • Decreasing the façade angle is recommended:
The reduction in the façade angle (e.g., by an upward taper) contributes to the reduction of a building’s overall width. This leads to reduced pressure differences between the windward and adjacent surfaces, resulting in a decreased acceleration of airflow at the building corners. The decrease in façade angle extends the distance between the target building and the surrounding surfaces with perpendicular angles, mitigating the Venturi effect. Consequently, this architectural adjustment yields a reduction in the induced wind speeds around the target building, fostering an environment characterised by relatively lower wind velocities.
  • Increasing the façade convexity of a downward taper is not recommended:
The increase of convexity in a downward taper contributes to the elongation of a building’s width, leading to a relatively high-pressure difference between the windward and side surfaces of the target structure. Consequently, this higher difference of convexity induces higher-speed winds in comparison to buildings with lower convexity or those lacking convex features. Furthermore, the introduction of convexity results in irregular distances between the target building and its surrounding surfaces with perpendicular angles, intensifying the Venturi effect. This configuration thus leads to the creation of relatively fast airflow patterns at pedestrian levels.

5.1.2. Corner Design

  • Chamfering corners is recommended:
In the context of isolated building conditions, corner chamfers prove to be disadvantageous, as fast moving winds interact with the target building, resulting in significant wind acceleration [32]. Conversely, in urban settings where a target building is enveloped by relatively short structures within a constrained open area ratio, corner chamfers are beneficial. In such scenarios, the pressure differences between the windward façade and adjacent surfaces reduce, contributing to a reduction in corner acceleration.

5.1.3. Building Height

  • A shorter building height is recommended:
In instances where the OAR is relatively small, the accelerated winds at the corners of a taller target building tend to propagate over longer distances, primarily as a result of the channelling effect. Consequently, it is advisable to consider a lower building height under such conditions to mitigate the extended reach of accelerated winds.

5.2. Tall Building Surrounded by Taller Buildings

  • Geometries and heights of a target building are less critical:
In scenarios where a target building is surrounded by even taller structures, especially aligning with the prevailing wind direction, the specific geometries and heights of the target building become less critical. Alterations in the geometry and height of the target building exert a diminished impact on PLW comfort, with consistent patterns observed in PLW comfort conditions under such circumstances.

5.3. Tall Building Surrounded by a Large Open Area

5.3.1. Building Geometry

  • An upward taper with corner chamfers is recommended:
In scenarios where a target building and its surroundings are situated in a spacious open area, it is advisable to incorporate an upward taper and corner chamfers in the building design. The combination of an upward taper and corner chamfers serves to mitigate the pressure difference between the upwind and side surfaces, resulting in reduced wind acceleration from the corners of the target building.

5.3.2. Building Height

  • Lower height is recommended:
A reduced building height is advisable in this context. The presence of a substantial open area prevents accelerated winds from the corners of a taller target building from extending over longer distances, in contrast to scenarios where buildings are closely packed with a limited OAR.

Potential Applications to Other Cities

In this research, London was chosen to explore the aerodynamic conditions at pedestrian level, as its urban form exhibits significant variations, including three cases, as discussed in Section 2.1.1. Consequently, the design recommendations and conclusions of this study have the potential to be applicable to other cities beyond London, where the urban typologies are similar to those in London—whether in areas with narrow and irregular road layouts or in grid patterns.
Moreover, the proposed guidelines in this study are specifically tailored for tall buildings, as shorter structures are less likely to generate ‘uncomfortable’ wind conditions. Therefore, these recommendations are expected to be applicable to a range of cities where buildings are part of mixed-height clusters.
This holistic approach to understanding PLW dynamics highlights the critical need for careful consideration of building geometry, context geometry, building height, façade angle, and accurate field measurements in architectural design and urban planning. By incorporating these insights, architects can contribute to the creation of more comfortable, pedestrian-friendly environments as urban areas continue to evolve.

Author Contributions

Conceptualization, Y.K.; methodology, Y.K.; software, Y.K.; validation, Y.K. and H.E.; formal analysis, Y.K. and H.E.; investigation, Y.K.; resources, Y.K.; data curation, Y.K.; writing—original draft preparation, Y.K.; writing—review and editing, H.E. and G.J.; visualization, Y.K. and H.E.; supervision, G.J. and H.E. All authors have read and agreed to the published version of the manuscript.

Funding

This research received no external funding.

Institutional Review Board Statement

Not applicable.

Informed Consent Statement

Not applicable.

Data Availability Statement

Original data are available in Yujin Kim’s PhD thesis titled Geometries of Tall Buildings Improving Wind Comfort in London, Architectural Association School of Architecture and The Open University, 2023, https://doi.org/10.21954/ou.ro.00016330.

Conflicts of Interest

The authors declare no conflicts of interest.

Symbols and Abbreviations

Symbols
αFaçade angle [degrees]
ϐDownward angle [degrees]
c Scale   factor   of   Weibull   probability   distribution   [ m s 1 ]
dLength of convex part [ m ]
hHeight [ m ]
k Turbulent kinetic energy [ m 2 m 2 ]
kShape factor of Weibull probability distribution
lLength [ m ]
pProbability of wind rose from a given wind direction
U Wind speed ratio
U n m Wind speed at n [ m ] above   ground   level   [ m s 1 ]
U r e f Reference   wind   speed   [ m s 1 ]
vDistance from d centre point to convex centre [ m ]
WWidth [ m ]
z Height [ m ]
z 0 Roughness length [ m ]
z r e f Reference height [ m ]
Abbreviations
a.g.lAbove Ground Level
ANNArtificial Neural Network
CFDComputational Fluid Dynamics
cGANconditional Generative Adversarial Network
CoLCity of London
FARFrontal Area Ratio
IROMIntrusive Reduced-Order Modelling
LCYLondon City Airport
LHRLondon Heathrow Airport
MetMeteorological
NIROMNon-Intrusive Reduced-Order Modelling
OAROpen Area Ratios
PARPlan Area Ratio
PLWPedestrian-Level Wind
RANSReynolds-Averaged Navier–Stokes
SIMPLESemi-Implicit Method for Pressure-Linked Equations
ROMReduced-Order Modelling

References

  1. Al-Kodmany, K. The Logic of Vertical Density: Tall Buildings in the 21st Century City. Int. J. High-Rise Build. 2012, 1, 131–148. [Google Scholar]
  2. Jayyaratnam, K.; Shilston, R.; Hackett, D. The Use of CFD and Wind Tunnel Testing in Wind Microclimate Assessments. In Proceedings of the 2017 Symposium on Simulation for Architecture and Urban Design (SimAUD 2017), Toronto, ON, Canada, 22–24 May 2017. Society for Modeling and Simulation International (SCS). [Google Scholar]
  3. Parkinson, J. The Problem with the Skyscraper Wind Effect. BBC News, 9 July 2015. [Google Scholar]
  4. Council on Tall Buildings and Urban Habitat Buildings Completion Timeline. Available online: http://www.skyscrapercentre.com/city/london (accessed on 9 October 2022).
  5. Hampson, A. Wind Microclimate Guidelines; City of London Corporation: London, UK, 2019. [Google Scholar]
  6. City of London and RWDI. Wind Microclimate Guidelines for Developments in the City of London; City of London Corporation: London, UK, 2019. [Google Scholar]
  7. City of London and RWDI. Thermal Comfort Guidelines for Developments in the City of London. Available online: https://www.cityoflondon.gov.uk/assets/Services-Environment/thermal-comfort-guidelines-for-developments-in-the-city-of-london.pdf (accessed on 9 February 2024).
  8. Tsang, C.W.; Kwok, K.C.S.; Hitchcock, P.A. Wind Tunnel Study of Pedestrian Level Wind Environment around Tall Buildings: Effects of Building Dimensions, Separation and Podium. Build. Environ. 2012, 49, 167–181. [Google Scholar] [CrossRef]
  9. Mittal, H.; Sharma, A.; Gairola, A. Numerical Simulation of Pedestrian Level Wind Flow around Buildings: Effect of Corner Modification and Orientation. J. Build. Eng. 2019, 22, 314–326. [Google Scholar] [CrossRef]
  10. Du, Y.; Mak, C.M.; Liu, J.; Xia, Q.; Niu, J.; Kwok, K.C.S. Effects of Lift-up Design on Pedestrian Level Wind Comfort in Different Building Configurations under Three Wind Directions. Build. Environ. 2017, 117, 84–99. [Google Scholar] [CrossRef]
  11. van Druenen, T.; van Hooff, T.; Montazeri, H.; Blocken, B. CFD Evaluation of Building Geometry Modifications to Reduce Pedestrian-Level Wind Speed. Build. Environ. 2019, 163, 106293. [Google Scholar] [CrossRef]
  12. Kubota, T.; Miura, M.; Tominaga, Y.; Mochida, A. Wind Tunnel Tests on the Relationship between Building Density and Pedestrian-Level Wind Velocity: Development of Guidelines for Realizing Acceptable Wind Environment in Residential Neighborhoods. Build. Environ. 2008, 43, 1699–1708. [Google Scholar] [CrossRef]
  13. Jin, H.; Liu, Z.; Jin, Y.; Kang, J.; Liu, J. The Effects of Residential Area Building Layout on Outdoor Wind Environment at the Pedestrian Level in Severe Cold Regions of China. Sustainability 2017, 9, 2310. [Google Scholar] [CrossRef]
  14. Abd Razak, A.; Hagishima, A.; Ikegaya, N.; Tanimoto, J. Analysis of Airflow over Building Arrays for Assessment of Urban Wind Environment. Build. Environ. 2013, 59, 56–65. [Google Scholar] [CrossRef]
  15. Macdonald, R.W.; Griffiths, R.F.; Hall, D.J. An Improved Method for the Estimation of Surface Roughness of Obstacle Arrays. Atmos. Environ. 1998, 32, 1857–1864. [Google Scholar] [CrossRef]
  16. Grimmond, C.S.B.; Oke, T.R. Aerodynamic Properties of Urban Areas Derived from Analysis of Surface Form. J. Appl. Meteorol. 1999, 38, 1262–1292. [Google Scholar] [CrossRef]
  17. Erell, E.; Pearlmutter, D.; Williamson, T. Urban Microclimate Designing the Spaces Between Buildings, 1st ed.; Routledge Taylor & Francis Group: Abingdon, UK, 2011; ISBN 9781138993983. [Google Scholar]
  18. Tsichritzis, L.; Nikolopoulou, M. The Effect of Building Height and Façade Area Ratio on Pedestrian Wind Comfort of London. J. Wind. Eng. Ind. Aerodyn. 2019, 191, 63–75. [Google Scholar] [CrossRef]
  19. Mokhtar, S.; Beveridge, M.; Cao, Y.; Drori, I. Pedestrian Wind Factor Estimation in Complex Urban Environments. In Proceedings of the 13th Asian Conference on Machine Learning, Virtually, 17–19 November 2021. [Google Scholar]
  20. Masoumi-Verki, S. Analysis and Reduced-Order Modeling of Urban Airflow and Pollutant Dispersion under Thermal Stratification Conditions. Ph.D. Thesis, Concordia University, Montreal, QC, Canada, 2022. [Google Scholar]
  21. Heaney, C.E.; Liu, X.; Go, H.; Wolffs, Z.; Salinas, P.; Navon, I.M.; Pain, C.C. Extending the Capabilities of Data-Driven Reduced-Order Models to Make Predictions for Unseen Scenarios: Applied to Flow Around Buildings. Front. Phys. 2022, 10, 910381. [Google Scholar] [CrossRef]
  22. Xiang, S.; Zhou, J.; Fu, X.; Zheng, L.; Wang, Y.; Zhang, Y.; Yi, K.; Liu, J.; Ma, J.; Tao, S. Fast Simulation of High Resolution Urban Wind Fields at City Scale. Urban Clim. 2021, 39, 100941. [Google Scholar] [CrossRef]
  23. Xiang, S.; Fu, X.; Zhou, J.; Wang, Y.; Zhang, Y.; Hu, X.; Xu, J.; Liu, H.; Liu, J.; Ma, J.; et al. Non-Intrusive Reduced Order Model of Urban Airflow with Dynamic Boundary Conditions. Build. Environ. 2021, 187, 107397. [Google Scholar] [CrossRef]
  24. Alonso, L.; Renard, F. A New Approach for Understanding Urban Microclimate by Integrating Complementary Predictors at Different Scales in Regression and Machine Learning Models. Remote Sens. 2020, 12, 2434. [Google Scholar] [CrossRef]
  25. Oukawa, G.Y.; Krecl, P.; Targino, A.C. Fine-Scale Modeling of the Urban Heat Island: A Comparison of Multiple Linear Regression and Random Forest Approaches. Sci. Total Environ. 2022, 815, 152836. [Google Scholar] [CrossRef] [PubMed]
  26. Ding, C.; Lam, K.P. Data-Driven Model for Cross Ventilation Potential in High-Density Cities Based on Coupled CFD Simulation and Machine Learning. Build. Environ. 2019, 165, 106394. [Google Scholar] [CrossRef]
  27. Higgins, S.; Stathopoulos, T. Application of Artificial Intelligence to Urban Wind Energy. Build. Environ. 2021, 197, 107848. [Google Scholar] [CrossRef]
  28. Gao, H.; Hu, G.; Zhang, D.; Jiang, W.; Tse, K.T.; Kwok, K.C.S.; Kareem, A. Urban Wind Field Prediction Based on Sparse Sensors and Physics-informed Graph-assisted Auto-encoder. Comput. Aided Civ. Eng. 2024, 39, 1409–1430. [Google Scholar] [CrossRef]
  29. Yang, S.; Wang, L.L.; Stathopoulos, T. A Review of Recent Progress on Urban Microclimate Research. In Proceedings of the 5th International Conference on Building Energy and Environment, Montreal, QC, Canada, 25–29 July 2023. [Google Scholar]
  30. Krautheim, M.; Pasel, R. City and Wind: Climate as an Architectural Instrument; DOM: Berlin, Germany, 2014; ISBN 3869223103. [Google Scholar]
  31. Zhang, X.; Weerasuriya, A.U.; Zhang, X.; Tse, K.T.; Lu, B.; Li, C.Y.; Liu, C.-H. Pedestrian Wind Comfort near a Super-Tall Building with Various Configurations in an Urban-like Setting. Build. Simul. 2020, 13, 1385–1408. [Google Scholar] [CrossRef]
  32. Kim, Y.; Ebrahim, H.; Jeronimidis, G. The Effects of Geometrical Changes of Tall Buildings on Pedestrian-Level Wind Speeds. In Proceedings of the Eleventh International Conference on Engineering Computational Technology, Palma, Spain, 31 August–2 September 2021. [Google Scholar]
  33. Kim, Y. Geometries of Tall Buildings Improving Wind Comfort in London; Open University: Milton Keynes, UK, 2023. [Google Scholar] [CrossRef]
  34. Kim, Y.; Jeronimidis, G.; Ebrahim, H. The Effect of Façade Curvature and Surrounding Building Heights on Pedestrian-Level Wind Speeds in the City of London. In Proceedings of the XXVI International Conference of the Iberoamerican Society of Digital Graphics, Lima, Peru, 7–11 November 2022; Editora Blucher: Lima, Peru, 2023; pp. 1175–1186. [Google Scholar]
  35. The OpenFOAM Foundation. OpenFOAM. Available online: https://openfoam.org/version/9/ (accessed on 10 January 2022).
  36. Janssen, W.D.; Blocken, B.; Van Hooff, T. Pedestrian Wind Comfort around Buildings: Comparison of Wind Comfort Criteria Based on Whole-Flow Field Data for a Complex Case Study. Build. Environ. 2013, 59, 547–562. [Google Scholar] [CrossRef]
  37. Blocken, B. Computational Fluid Dynamics for Urban Physics: Importance, Scales, Possibilities, Limitations and Ten Tips and Tricks towards Accurate and Reliable Simulations. Build. Environ. 2015, 91, 219–245. [Google Scholar] [CrossRef]
  38. atmBoundaryLayer Class Reference | OpenFOAM. Available online: https://cpp.openfoam.org/v9/classFoam_1_1atmBoundaryLayer.html (accessed on 18 February 2025).
  39. Wieringa, J. Updating the Davenport Roughness Classification. J. Wind. Eng. Ind. Aerodyn. 1992, 41, 357–368. [Google Scholar] [CrossRef]
  40. Davenport, A. The Relationship of Wind Structure to Wind Loading. In Proceedings of the “Wind Effects on Buildings and Structures” National Physical Laboratory, Teddington, UK, 26–28 June 1963; AIVC: Ghent, Belgium, 1963. [Google Scholar]
  41. Franke, J.; Hellsten, A.; Schlunzen, H.; Carissimo, B. Best Practice Guideline for the CFD Simulation of Flows in the Urban Environment, 1st ed.; University of Hamburg Meteorological Institute Centre for Marine and Atmospheric Sciences: Hamburg, Germany, 2007; ISBN 3-00-018312-4. [Google Scholar]
  42. Yoshie, R.; Mochida, A.; Tominaga, Y.; Kataoka, H.; Harimoto, K.; Nozu, T.; Shirasawa, T. Cooperative Project for CFD Prediction of Pedestrian Wind Environment in the Architectural Institute of Japan. J. Wind. Eng. Ind. Aerodyn. 2007, 95, 1551–1578. [Google Scholar] [CrossRef]
  43. DAVIS Instruments. Vantage Vue Weather Station; DAVIS Instruments: Hayward, CA, USA, n.d.
  44. DAVIS Instruments. WeatherLink Data Loggers and WeatherLink Computer Software, 6510USB; DAVIS Instruments: Hayward, CA, USA, n.d.
  45. CEDA. Weather Data in CEDA Archives. Available online: https://help.ceda.ac.uk/article/96-weather-data (accessed on 3 January 2021).
  46. Hågbo, T.-O.; Giljarhus, K.E.T. Pedestrian Wind Comfort Assessment Using Computational Fluid Dynamics Simulations With Varying Number of Wind Directions. Front. Built Environ. 2022, 8, 858067. [Google Scholar] [CrossRef]
  47. Lynch, D. How Many Wind Directions Should I Run for a Pedestrian Wind Comfort Analysis? Available online: https://www.simscale.com/knowledge-base/how-many-wind-directions-pwc/#:~:text=This%20means%20that%20although%20for,directions%20for%20this%20use%20case (accessed on 23 December 2023).
  48. Blocken, B.; Stathopoulos, T.; Van Beeck, J.P.A.J. Pedestrian-Level Wind Conditions around Buildings: Review of Wind-Tunnel and CFD Techniques and Their Accuracy for Wind Comfort Assessment. Build. Environ. 2016, 100, 50–81. [Google Scholar] [CrossRef]
Figure 1. The three sites in their existing context form with the target building situated in the centre [33] (Note, the surrounding buildings were modelled in a 700 m diameter for the CFD simulations, but the figure only shows a 400 m diameter for diagram purposes).
Sustainability 17 02343 g001
Figure 2. The geometries replacing the target buildings at Sites 1-1, 1-2, and 2.
Sustainability 17 02343 g002
Figure 3. The computational domain [34].
Sustainability 17 02343 g003
Figure 4. The profiles of wind speed (left) and kinetic energy (right) [34].
Sustainability 17 02343 g004
Figure 5. The grid setup [33].
Sustainability 17 02343 g005
Figure 6. The location of field measurements A–B and C–D, based on the preliminary CFD simulation of southwesterly winds [33].
Sustainability 17 02343 g006
Figure 7. Photographs of the tripod and mobile weather station at each of the measurement locations [33].
Sustainability 17 02343 g007
Figure 8. Installation features of the mobile weather station [33].
Sustainability 17 02343 g008
Figure 9. The wind rose of the winter season reprocessed based on four wind directions in London from 1973 to 2017. The Weibull parameters (rounded to two decimal places) are provided in the table for reference.
Sustainability 17 02343 g009
Figure 10. PLW comfort contour plot at Site 1-1 for the following criteria: cuboid, downward-tapered with convex façade, and upward-tapered with corner chamfers at 160.1 m tall [33].
Sustainability 17 02343 g010
Figure 11. The percentage of area occupied by different comfort categories at Site 1-1 for the following criteria: cuboid, downward-tapered with convex façade, and upward-tapered with corner chamfers at 160.1 m tall.
Sustainability 17 02343 g011
Figure 12. Streamlines of wind speed ratios at 1.5 m above ground level in the northwest region of Site 1-1 with winds approaching from the southwesterly direction [33].
Sustainability 17 02343 g012
Figure 13. Streamlines of wind speed ratios at 1.5 m above ground level in the southeast region of Site 1-1 with winds approaching from the southwesterly direction [33].
Sustainability 17 02343 g013
Figure 14. PLW comfort contour plot at Site 1-2 for the buildings that were cuboid, downward-tapered with convex façade, and upward-tapered with corner chamfers at 117.9 m tall [33].
Sustainability 17 02343 g014
Figure 15. The percentage of area occupied by different comfort categories at Site 1-2 for the buildings that were cuboid, downward-tapered with convex façade, and upward-tapered with corner chamfers at 117.9 m tall.
Sustainability 17 02343 g015
Figure 16. PLW comfort contour plot at Site 2 for the buildings that were cuboid, downward-tapered with convex façade, and upward-tapered with corner chamfers at 201 m tall [33].
Sustainability 17 02343 g016
Figure 17. The percentage of area occupied by different comfort categories at Site 2 for the buildings that were cuboid, downward-tapered with convex façade, and upward-tapered with corner chamfers at 201 m tall.
Sustainability 17 02343 g017
Figure 18. Site conditions in terms of open area ratio (%) and building height ( m ).
Sustainability 17 02343 g018
Figure 19. The percentage of area occupied by different comfort categories at Sites 1-1, 1-2, and 2 for the cuboid target building.
Sustainability 17 02343 g019
Figure 20. The percentage of area occupied by different comfort categories at Sites 1-1, 1-2, and 2 for the downward-tapered with convex façade target building.
Sustainability 17 02343 g020
Figure 21. The percentage of area occupied by different comfort categories at Sites 1-1, 1-2, and 2 for the upward-tapered with chamfered corners target building.
Sustainability 17 02343 g021
Figure 22. PLW comfort contour plot at Site 1-1 with different cuboids at heights of 160.1 m (left) and at 240.15 m (right) [33].
Sustainability 17 02343 g022
Figure 23. The percentage of area occupied by different comfort categories at Site 1-1 for different cuboids at heights of 160.1 m and 240.15 m tall.
Sustainability 17 02343 g023
Figure 24. PLW comfort contour plot at Site 1-2 with different cuboids at heights of 117.9 m (left) and 176.85 m (right) [33].
Sustainability 17 02343 g024
Figure 25. The percentage of area occupied by different comfort categories at Site 1-2 for different cuboids at heights of 117.9 m and 176.85 m tall.
Sustainability 17 02343 g025
Figure 26. PLW comfort contour plot at Site 2 with different cuboids at heights of 201 m (left) and 301.5 m (right) [33].
Sustainability 17 02343 g026
Figure 27. The percentage of area occupied by different comfort categories at Site 2 for different cuboids at heights of 201 m and 301.5 m tall.
Sustainability 17 02343 g027
Figure 28. PLW comfort contour plot at Site 1-1 for different façade angles with corner chamfers for a building height of 160.1 m tall [33].
Sustainability 17 02343 g028
Figure 29. The percentage of area occupied by different comfort categories at Site 1-1 for different façade angles with corner chamfers for a building height of 160.1 m tall.
Sustainability 17 02343 g029
Figure 30. Streamlines of wind speed ratios for the different façade angles with corner chamfers of a building 160.1 m tall at Site 1-1 with winds approaching from southerly direction [33].
Sustainability 17 02343 g030
Figure 31. PLW comfort contour plot at Site 1-1 for a cuboid geometry and downward-tapered geometries with 5% and 10% convex façades at a height of 160.1 m tall [33].
Sustainability 17 02343 g031
Figure 32. The percentage of area occupied by different comfort categories at Site 1-1 for a cuboid geometry and downward-tapered geometries with 5% and 10% convex façades at a height of 160.1 m tall.
Sustainability 17 02343 g032
Figure 33. Streamlines of wind speed ratios for the different geometries for a building 160.1 m tall at Site 1-1 with winds approaching from a southerly direction [33].
Sustainability 17 02343 g033
Figure 34. Comparisons of hourly mean wind speeds and wind directions for the reference wind speed taken from LHR, CFD predictions, and field measurements with standard deviations for four different locations at different times and dates.
Sustainability 17 02343 g034
Figure 35. The wind direction approaching London Heathrow Airport broke down into percentages of occurrences during the measurements’ dates and times.
Sustainability 17 02343 g035
Figure 36. Correlation between wind speeds predicted by CFD and measurements made on site. The error bars represent the standard deviation of the field measurements.
Sustainability 17 02343 g036
Table 1. Variables of the geometries replacing the target buildings.
SymbolDescriptionSite 1-1Site 1-2Site 2
WWidth (m)39.5737.7154.60
lLength (m)43.9037.1163.00
hHeight (m)160.10117.90201.00
αFaçade angle (degrees)82.00
ϐDownward angle (degrees)97.52
dLength of convex part (m)161.49118.92202.74
vDistance from d centre point to convex centre (m)8.025.9410.14
v d × 100 Convexity (%)5
Table 2. Geometrical variables adjusted to examine the effect of tapering.
Geometry TypeVariableSite 1-1
Cuboid and upward-tapered with corner chamfersα (degrees)908682
Downward-tapered with convex façade v d × 100   (%)0510
Table 3. Site parameters [33].
Site1-11-22
Target building height (m)160.1117.9201
Average surrounding building height (m)30.1559.2257.73
Open area (m2)11,701.0414,586.7420,392.94
Total site area (m2) of 200 m-diameter site31,415.9331,415.9331,415.93
Open area ratio (%)37.2546.4364.91
Table 4. Measurement dates and times: Locations A and B [33].
Date and Time\LocationAB
8 February 20226:00–7:008:00–9:00
12 February 202210:00–11:0012:00–13:00
27 February 202215:00–16:0013:00–14:00
6 March 20228:00–9:0010:00–11:00
12 March 202218:00–19:0020:00–21:00
Table 5. Measurement dates and times: Locations C and D [33].
Date and Time\LocationCD
19 March 202212:00–13:0014:00–15:00
22 March 202212:00–13:0014:00–15:00
25 March 202213:00–14:0015:00–16:00
29 March 202213:00–14:0015:00–16:00
31 March 202214:00–15:0016:00–17:00
Table 6. The City Lawson Criteria [6].
ColourCategoryMean Wind Speed (5% Exceedance)Description
Frequent Sitting2.5 m/sAcceptable for frequent outdoor sitting use, e.g., restaurant, café.
Occasional Sitting4 m/sAcceptable for occasional outdoor seating, e.g., general public outdoor spaces, balconies and terraces intended for occasional use, etc.
Standing6 m/sAcceptable for entrances, bus stops, covered walkways, or passageways beneath buildings.
Walking8 m/sAcceptable for external pavements and walkways.
Uncomfortable>8 m/sNot comfortable for regular pedestrian access.
Disclaimer/Publisher’s Note: The statements, opinions and data contained in all publications are solely those of the individual author(s) and contributor(s) and not of MDPI and/or the editor(s). MDPI and/or the editor(s) disclaim responsibility for any injury to people or property resulting from any ideas, methods, instructions or products referred to in the content.

