1. Introduction
Over two billion smallholder farmers worldwide face persistent challenges related to poverty, largely driven by low agricultural productivity, climate change, environmental risks, and deforestation [
1]. To address these issues, digital technologies have been developed to disseminate sustainable agricultural practices aimed at enhancing crop production and mitigating the adverse effects of climate change. Among these technological advancements, smartphones have emerged as one of the most rapidly evolving digital tools, with an estimated 4.3 billion users globally [
2]. The proliferation of mobile applications has revolutionized information and communication systems, playing a pivotal role in agricultural development.
Empirical evidence indicates that digital technologies have significantly improved agricultural yields by facilitating the delivery of agricultural extension services [
3]. These technologies have enhanced connectivity and expanded farmers’ access to vital agricultural information, particularly in rural areas [
4]. Mobile technologies provide real-time access to critical farming information, including market trends and contemporary agricultural practices [
5,
6]. Furthermore, smartphone applications offer advanced functionalities such as pest detection and crop disease diagnosis, which contribute to improved farm management and productivity [
7,
8]. These innovations have not only facilitated the efficient use of resources but have also raised farmers’ awareness of and willingness to adopt sustainable agricultural practices [
9,
10]. The integration of such technologies into farming systems underscores their potential to enhance agricultural resilience and long-term sustainability.
In the 1980s, agricultural applications, such as precision agriculture technologies, sensors, and GPS devices, were used for field data collection and crop monitoring [
11,
12]. In the twenty-first century, the internet and mobile phone applications have supported agricultural operations, such as weather forecasting and crop management. For instance, artificial intelligence and internet-based applications are utilized to diagnose plant diseases and analyze data with high accuracy to address agronomic challenges [
13,
14]. Currently, integrated applications, such as drones and remote sensors, are being used to manage irrigation and harvesting operations.
Historically, the agricultural extension system in Saudi Arabia has relied on extension agents and utilized a one-way communication model to disseminate agricultural information to the farming community. This traditional approach, coupled with a limited awareness of digital extension systems, restricted farmers’ access to information on innovative and sustainable agricultural practices [
15,
16]. However, after sustained efforts, Saudi Arabia transitioned to a digital extension system, which has been widely adopted by extension agents [
17]. The adoption of the “Agricultural Guide” application has played a crucial role in addressing agricultural challenges by providing farmers with timely and specialized information on sustainable farming practices. The Ministry of Environment, Water, and Agriculture (MEWA) in Saudi Arabia introduced the “Agricultural Guide” application to offer large-scale agricultural services across the country. In 2022, the application facilitated over 2.92 million agricultural consultations across 64 different fields. Additionally, approximately 233,000 farmers, including olive growers, registered on the platform. The application also facilitated 388 agricultural guidance sessions and conducted 965 soil and water analyses. Furthermore, 84 agricultural experts from the Arab Organization for Agricultural Development and the Food and Agriculture Organization of the United Nations (FAO) participated in interactive activities aimed at enhancing agricultural knowledge and practices [
18]. This digital transformation in agricultural extension services has significantly improved the accessibility and dissemination of critical agricultural knowledge, fostering the adoption of sustainable and innovative farming techniques in Saudi Arabia
Saudi Arabia approximately accounts for 2% of the total worldwide olive output [
19]. Olive cultivation plays a vital role in the national economy, with olive oil ranking as the fifth-largest foreign currency-generating export, constituting 5.5% of the Kingdom’s total exports [
20]. Notably, olive oil produced in the Al-Jouf region is distinguished by its unique natural and nutritional properties [
21]. With evolving dietary preferences, the demand for olive oil has increased by 25% in recent years [
22]. Currently, domestic production satisfies 85.2% of the national consumption [
22]. Despite ongoing efforts to enhance olive production, farmers in Saudi Arabia encounter multiple challenges. A key issue is the lack of access to advisory services and training on sustainable agricultural practices [
21]. To address these challenges, the Ministry of Environment, Water, and Agriculture (MEWA) has developed an electronic extension system, the “Agricultural Guide”, to provide farmers with essential agricultural information and guidance. Initially launched as a trial version in 2019, the improved version, incorporating advanced smart services, was officially introduced in 2021 to promote sustainable olive cultivation practices [
23].
Currently, approximately 206,000 farmers across Saudi Arabia utilize the Agricultural Guide application, representing 31.16% of the total farming population [
23,
24]. The application provides a range of services, including workshops, training programs, advisory support, seminars, and multimedia educational resources [
25]. In line with the Saudi government’s commitment to digital transformation, efforts have been made to promote the adoption of this application [
26]. However, despite these initiatives, no scientific studies have yet examined its effectiveness. This study aims to assess the impact of the Agricultural Guide application on the adoption of sustainable olive farming practices in Saudi Arabia. Moreover, it seeks to identify the key factors influencing the adoption of the application and the most significant barriers hindering its widespread use. The research is grounded in the Unified Theory of Acceptance and Use of Technology 2 (UTAUT2), which serves as a theoretical framework for analyzing factors influencing the adoption of the application. UTAUT2 is a well-established model for predicting the adoption of information and communication technologies (ICTs), incorporating factors such as hedonic motivation, price value, habit, performance expectancy, effort expectancy, social influence, and facilitating conditions. These factors collectively offer a comprehensive understanding of the psychological and social determinants affecting ICT adoption [
27]. The application of this theory provides a robust foundation for investigating the motivations and barriers associated with the use of the Agricultural Guide, offering valuable insights into the conditions that facilitate or impede the adoption of digital agricultural solutions [
28]. The findings will contribute to bridging the knowledge gap regarding the role of digital technologies in agricultural extension services within the study area.
2. Materials and Methods
2.1. Description of the Study Area
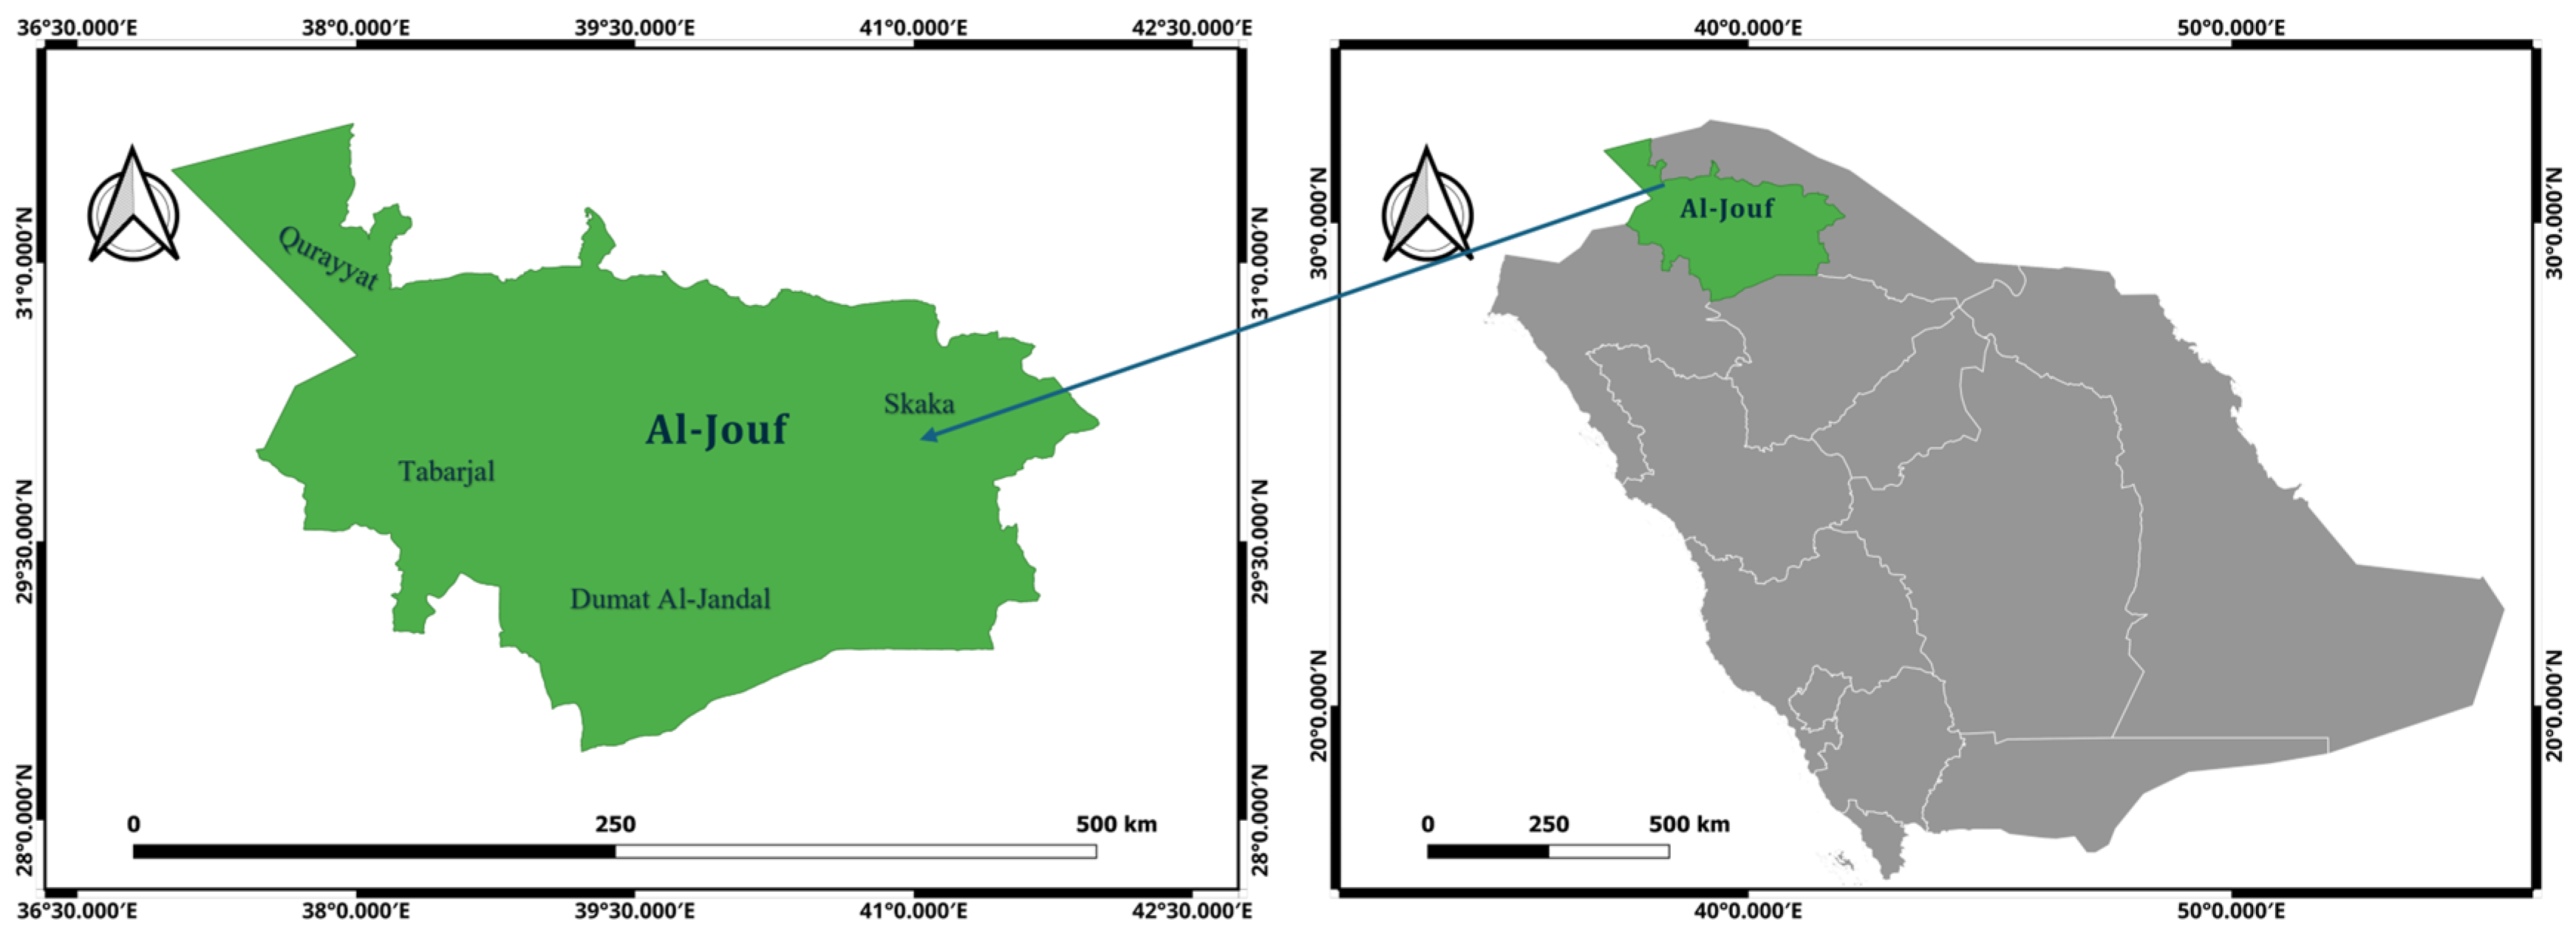
This study was conducted in the Al-Jouf region, located in the northwestern part of the Kingdom of Saudi Arabia. Al-Jouf is one of the most agriculturally significant regions in the country, covering an area of approximately 100,000 square kilometers and supporting a population of around 475,000 inhabitants [
28]. Administratively, the region is divided into three governorates: Al-Qurayyat, Dumat Al-Jandal, and Tabarjal [
26], with Sakaka serving as the regional capital. The climate of Al-Jouf is classified as a hot desert climate, characterized by high temperatures during the summer and dry, cold conditions in the winter [
29]. Annual precipitation levels range between 50 and 60 mm [
30]. The predominant soil texture in the study area is sandy loam [
31], which supports the cultivation of various crops. Notably, olive and citrus production are the most widespread agricultural activities in the region (
Figure 1). Al-Jouf is particularly recognized as the primary olive-producing area in Saudi Arabia, accounting for approximately 67% of the country’s total olive production [
32].
2.2. Study Population
The olive farmers in the Al-Jouf region were considered as the study population. The total population of 6554 farmers was identified through the Agricultural Census Statistics [
32]. A simple random sampling method was employed to ensure an equal representation of farmers across the defined population, including users and non-users of the application. The required sample size of 364 farmers was determined based on Krejcie and Morgan [
33]. The following equation was used to calculate the sample size:
where
S = Required sample size,
N = Population size, x
2 = Chi-square value at 1 degree of freedom and a significance level of 0.05 = 3.841,
P = Proportion of the phenomenon’s probability = 0.5,
D = Margin of error = 0.05. Upon applying the formula, a sample size of 364 farmers was obtained.
2.3. Data Collection
Data were collected using a structured, paper-based questionnaire administered in the participants’ native language. Prior to participation, all respondents provided written informed consent. Among the 364 farmers surveyed, 229 completed the questionnaire, yielding a response rate of 63%. The data collection process spanned four months, from March to July 2024. Ethical approval for the study was granted by the Research Ethics Committee of the Deanship of Graduate Studies at King Saud University (Approval Number: KSU-HE-23-287). This approval was obtained to ensure compliance with ethical standards, particularly concerning data confidentiality and the voluntary participation of respondents.
2.4. Survey Instrument
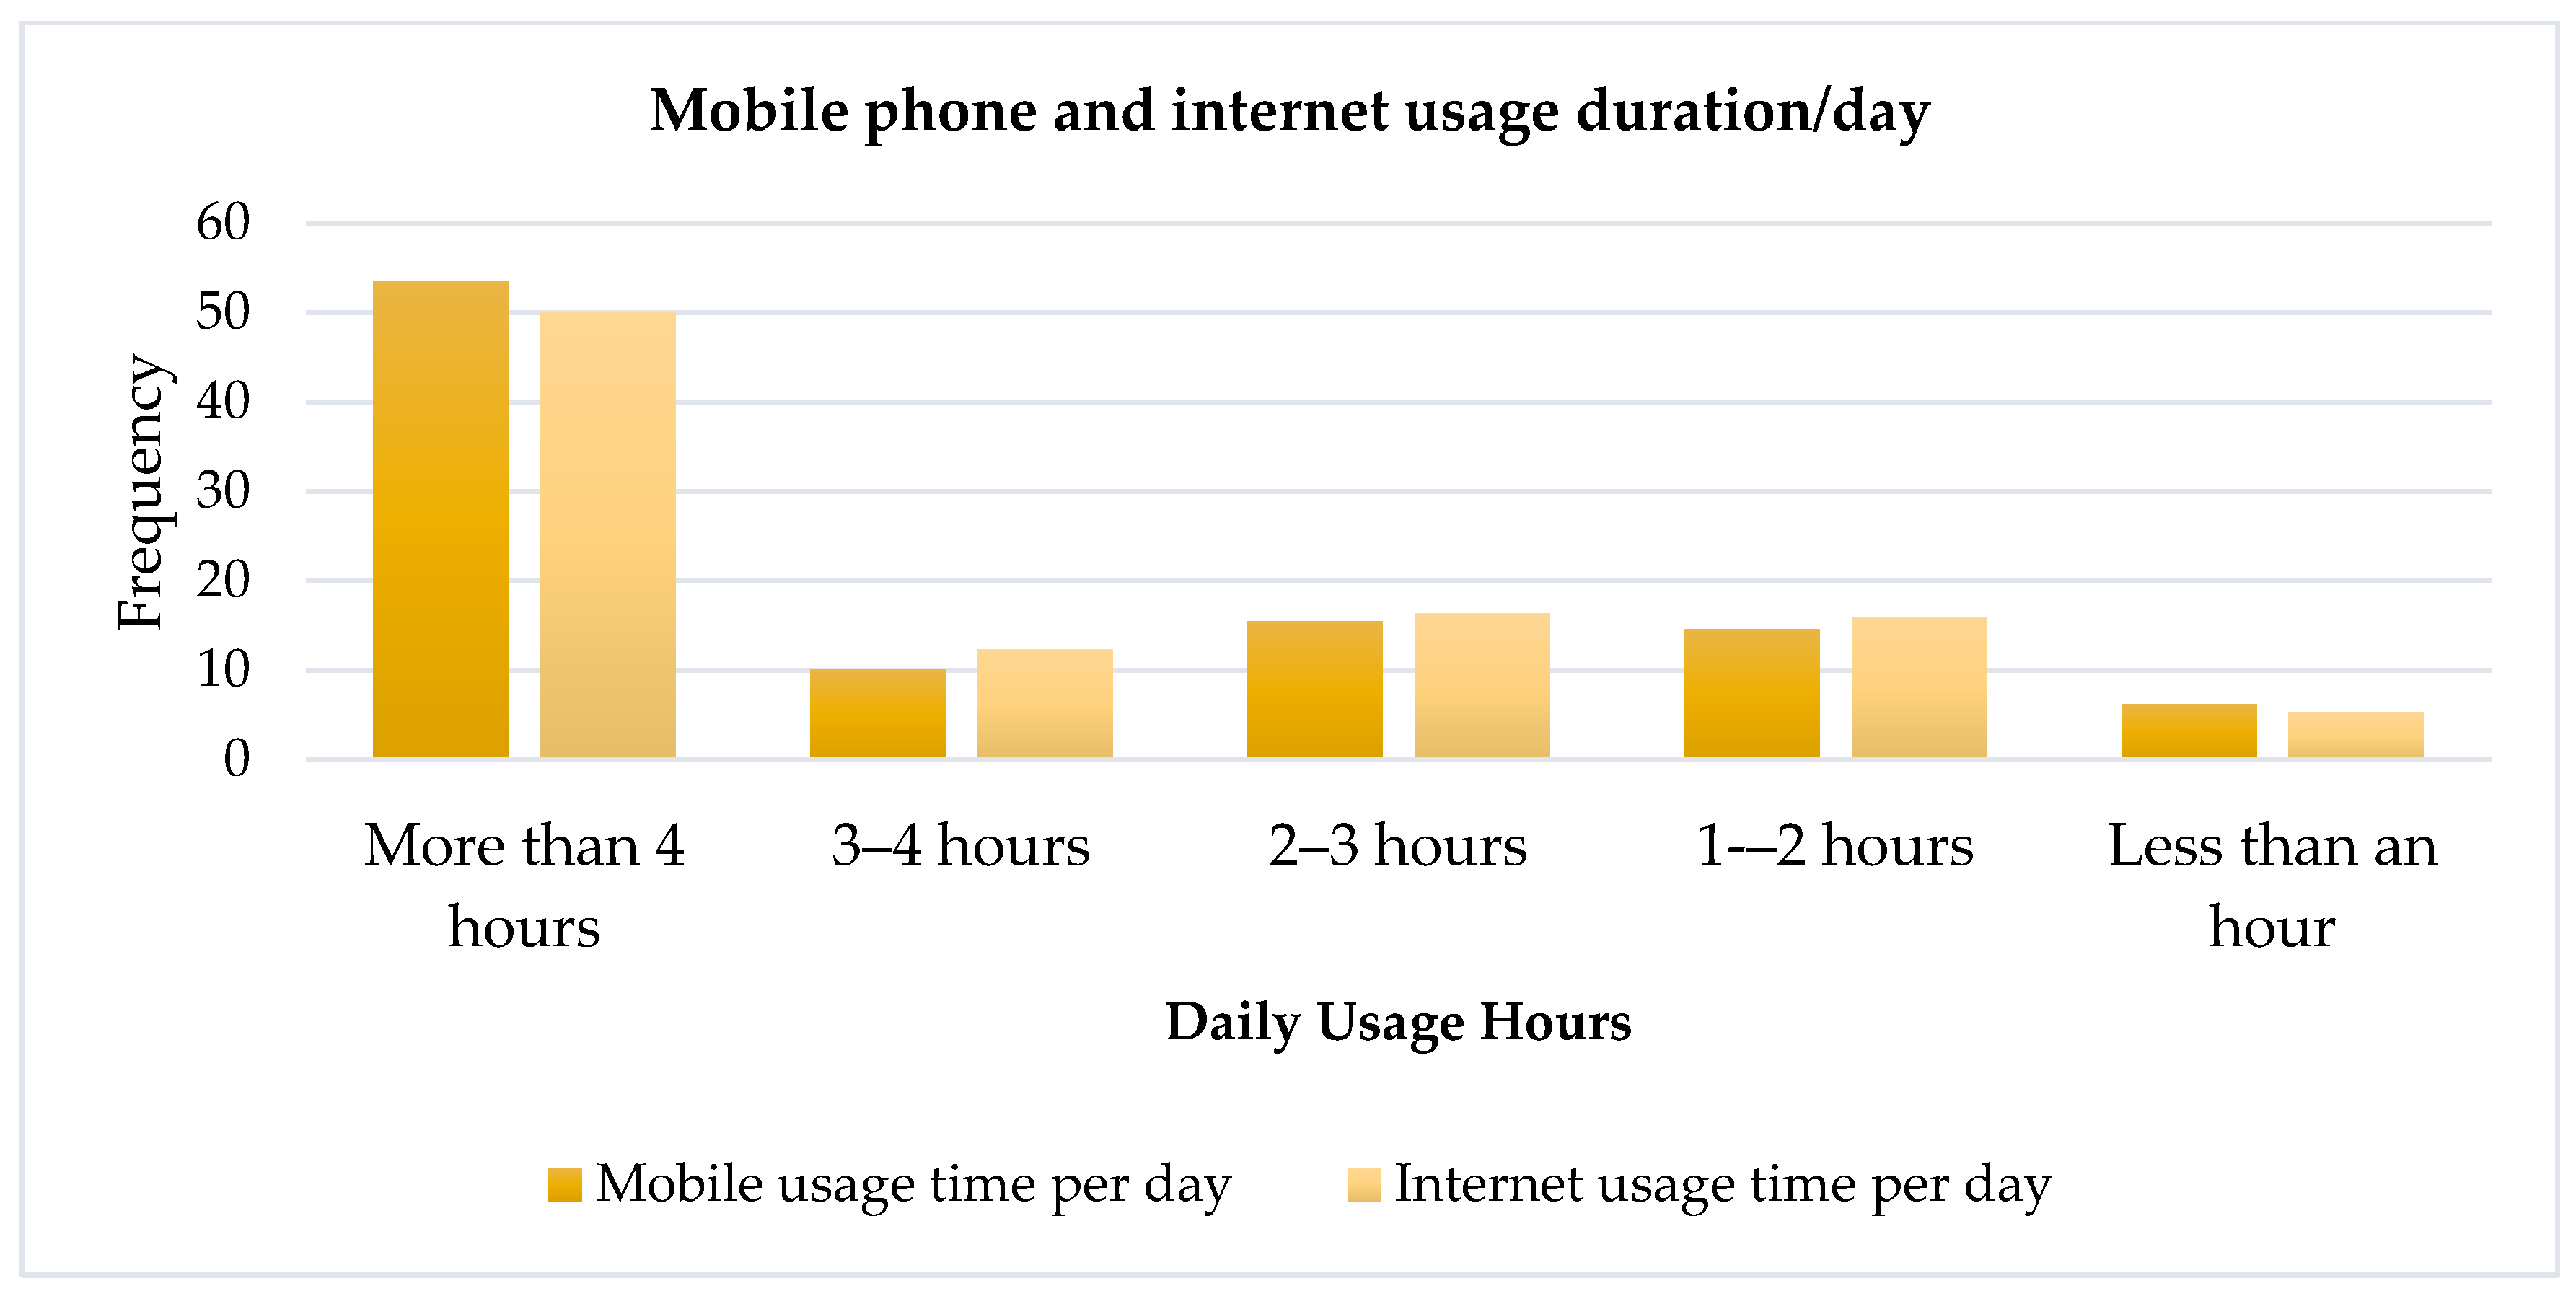
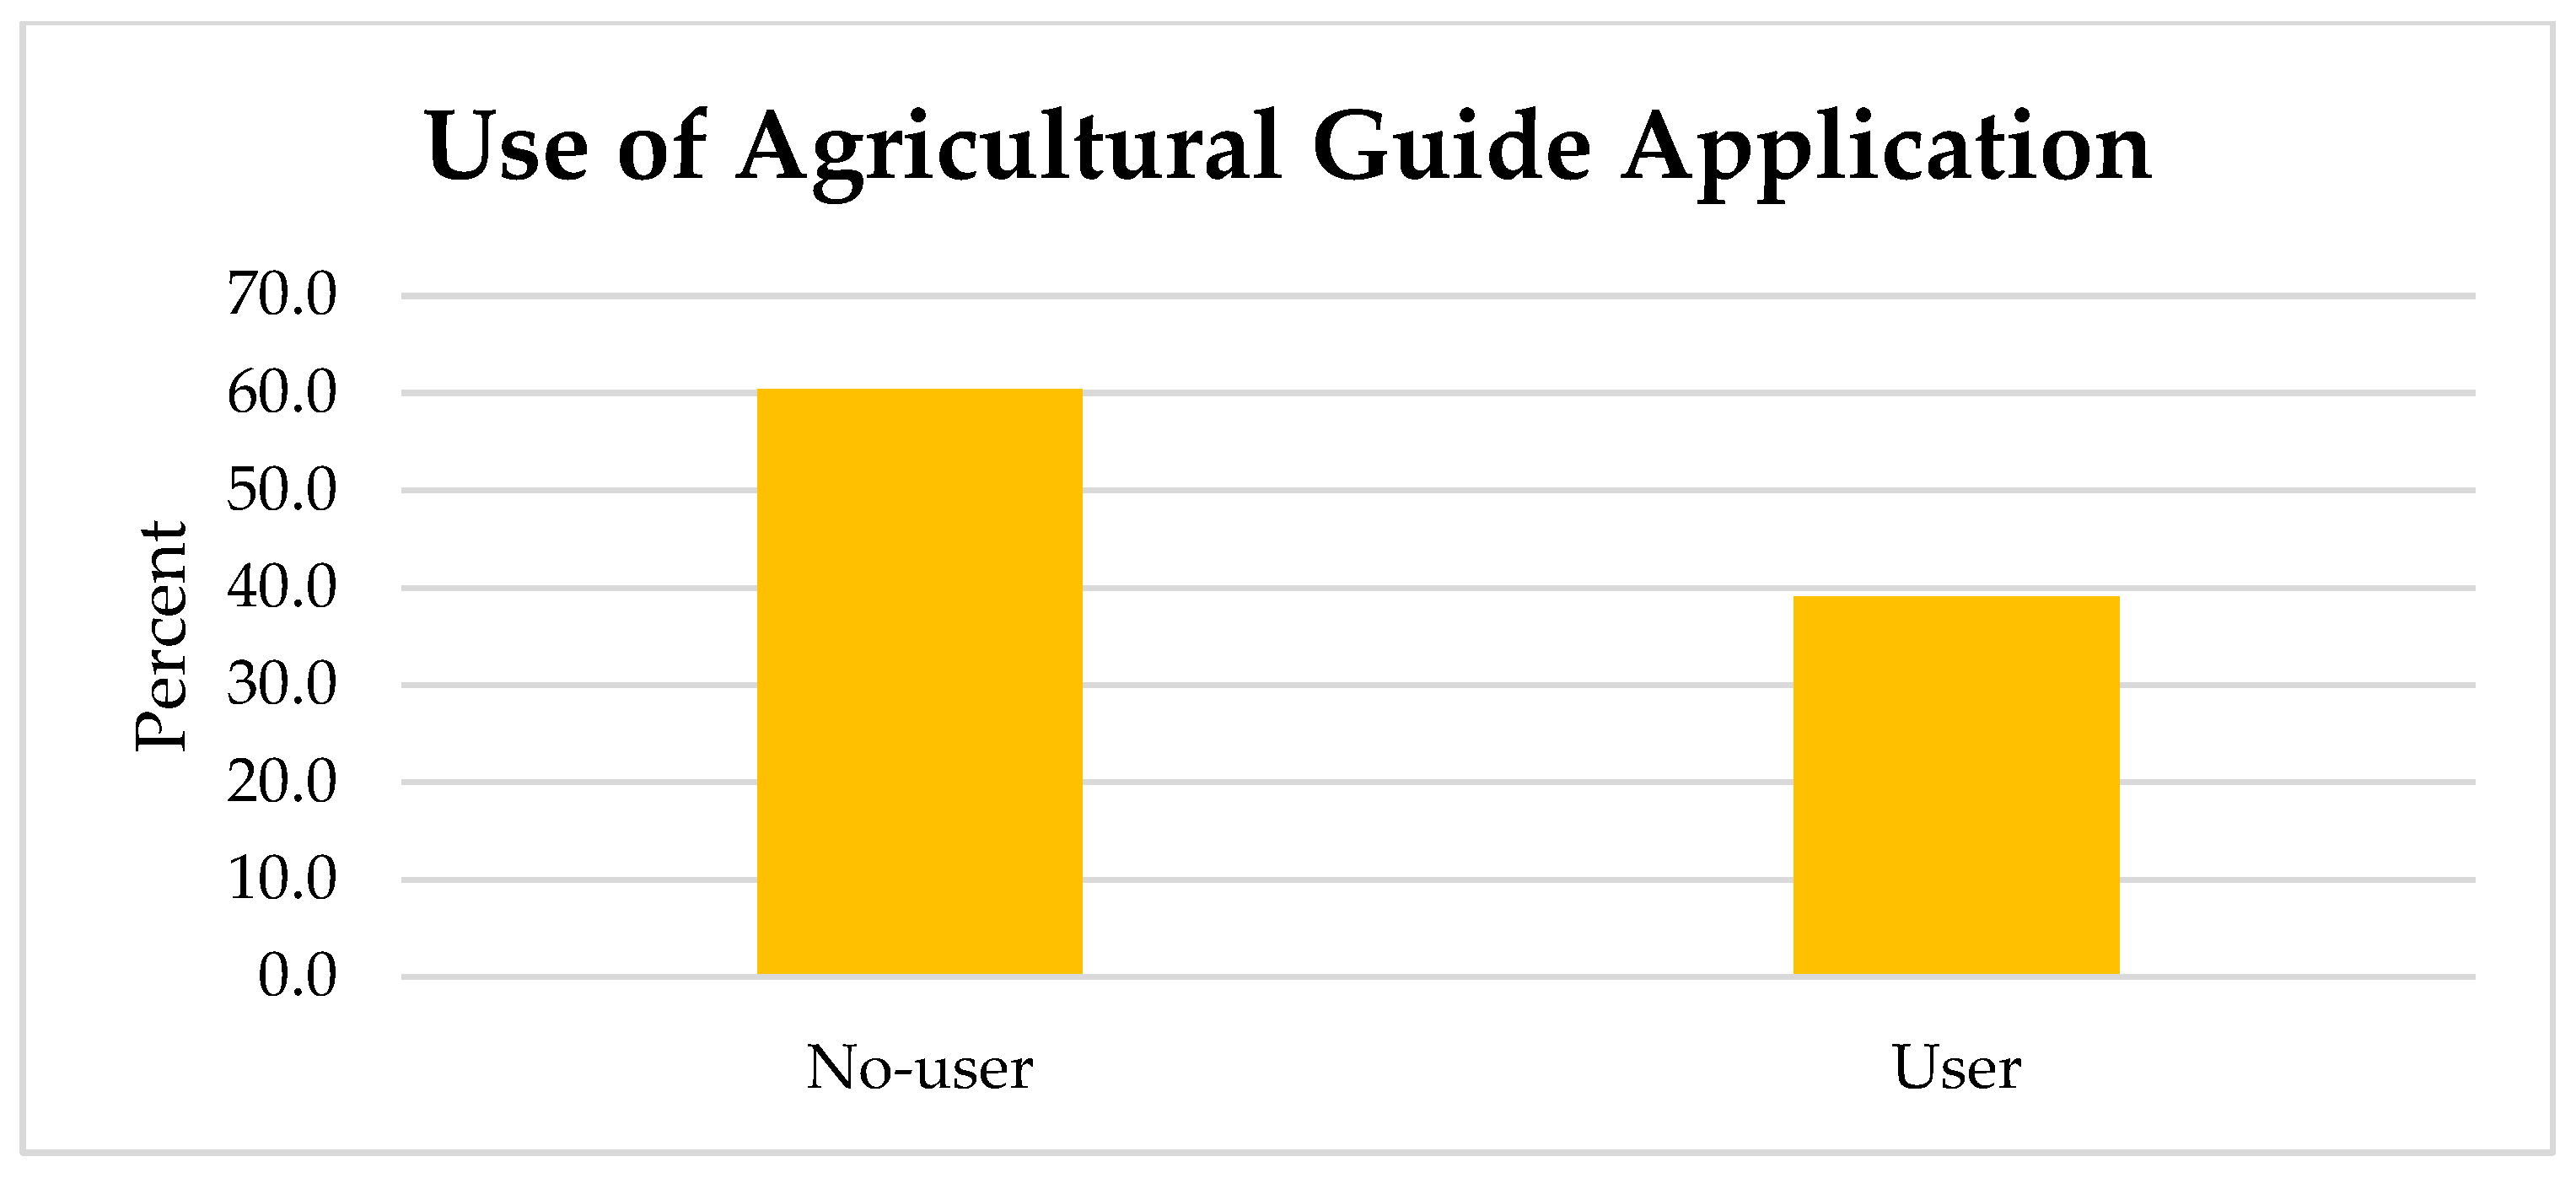
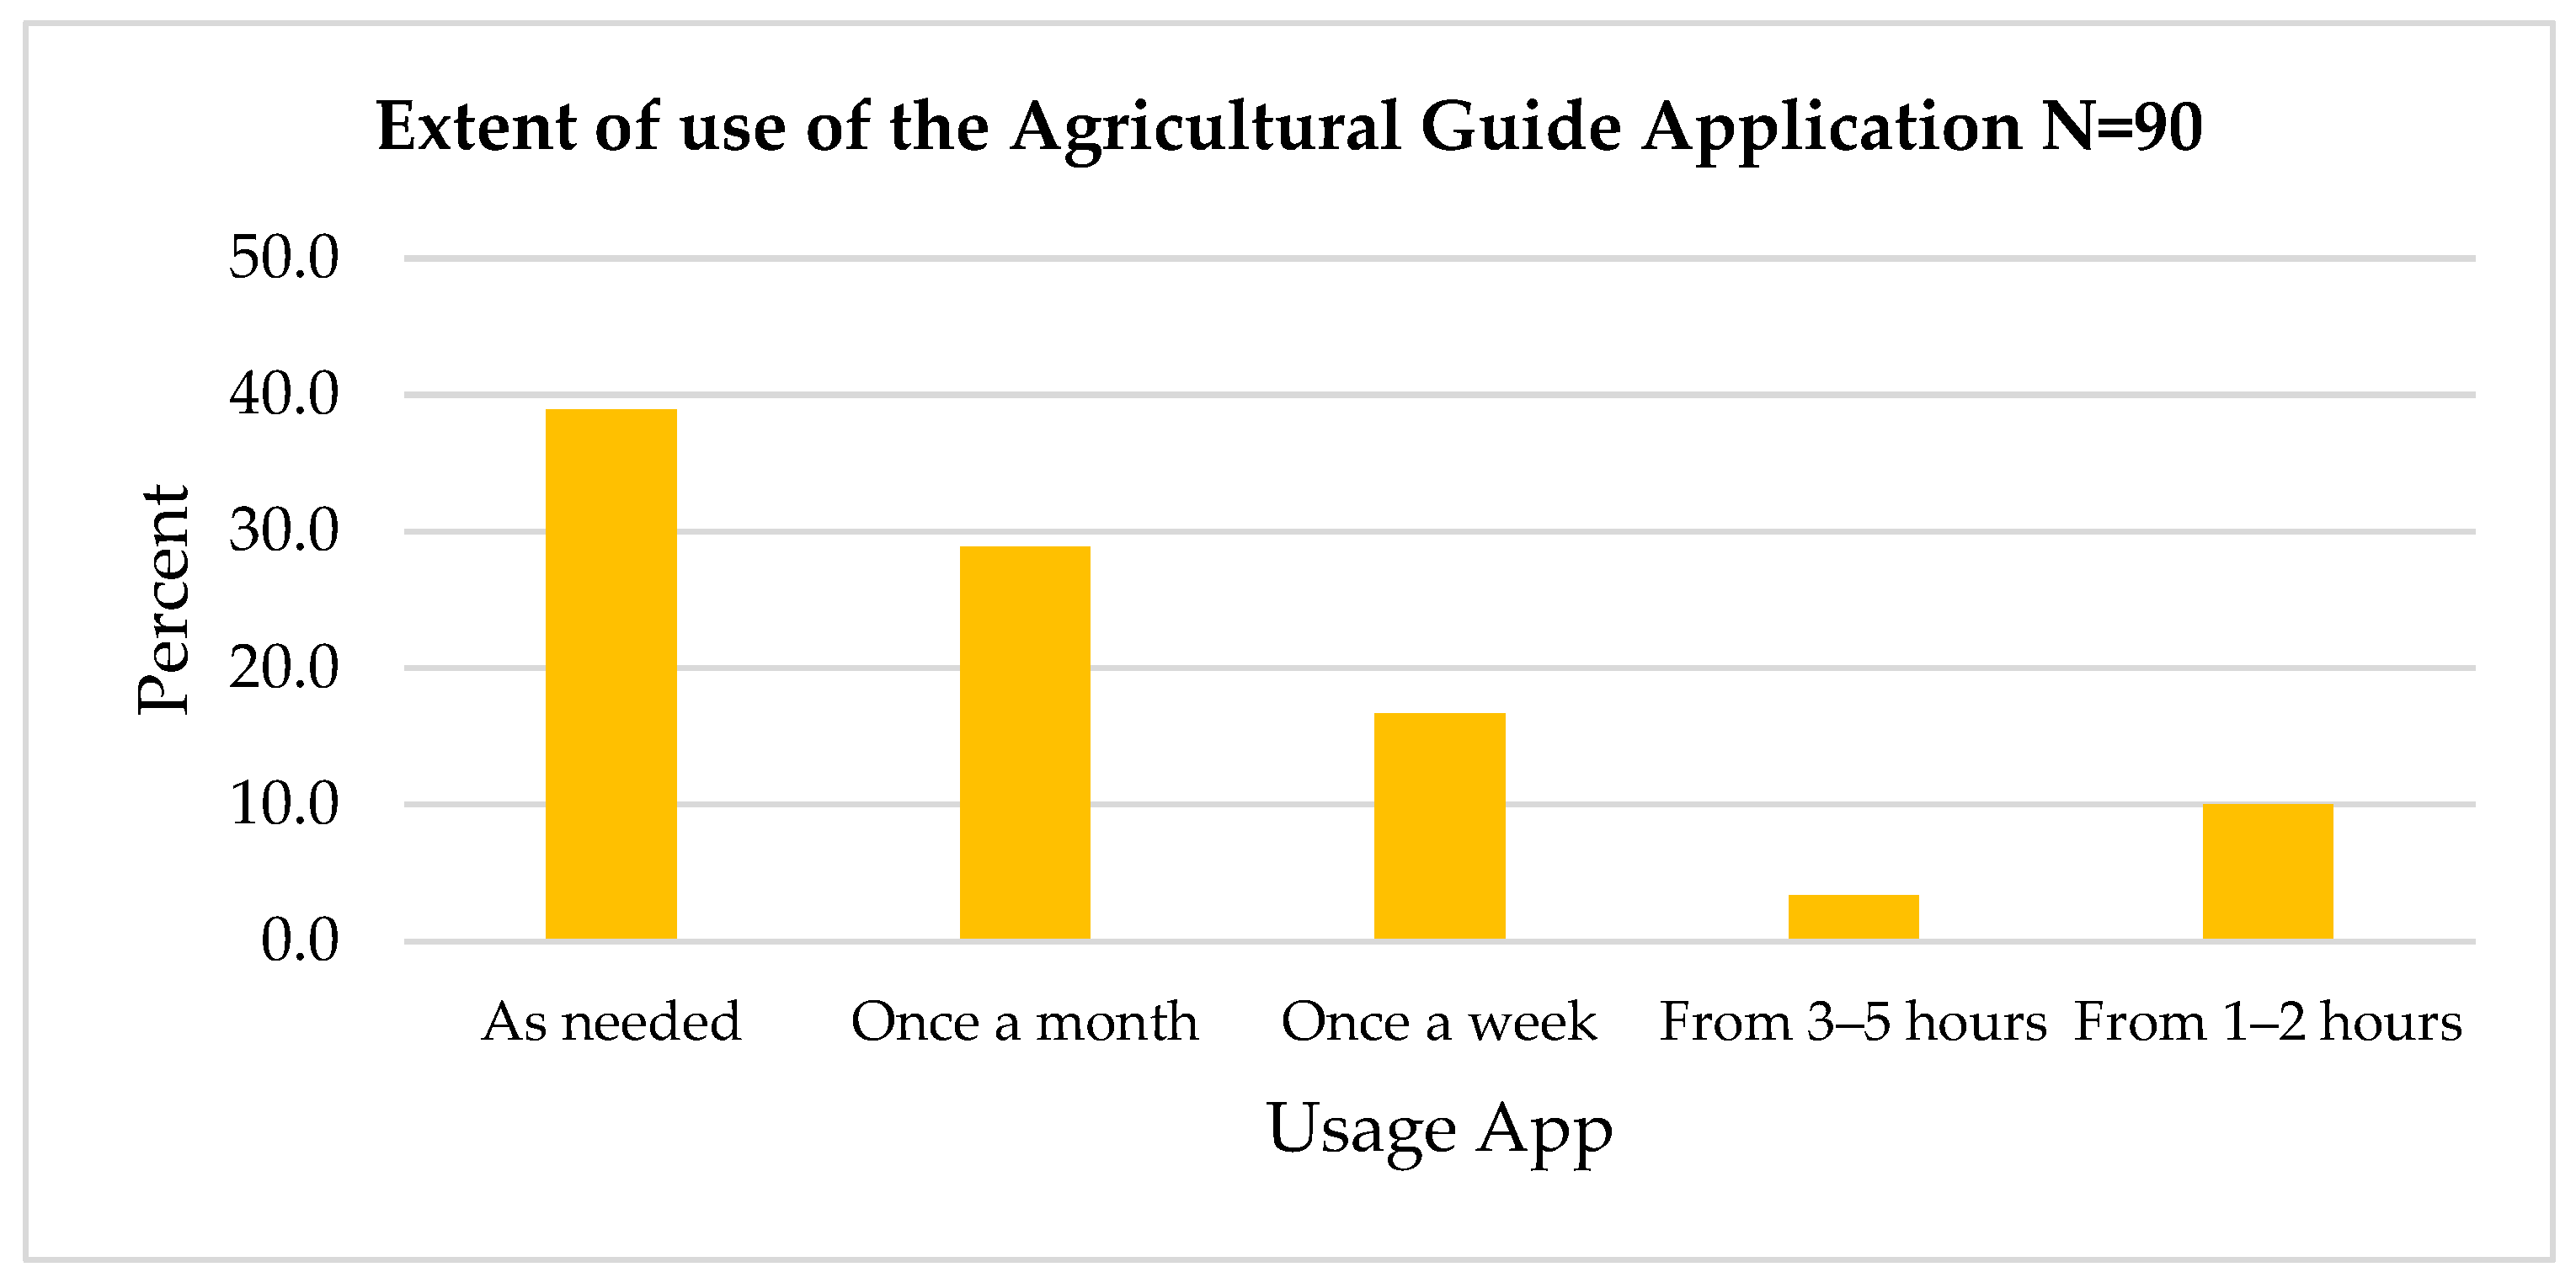
The study questionnaire was validated for construct reliability and content accuracy by the experts in the fields of agricultural extension and plant production at the College of Food and Agricultural Sciences, King Saud University. The questionnaire comprised multiple sections designed to collect data on various aspects, including the socio-economic characteristics of farmers, the adoption of sustainable olive farming practices, and barriers to utilizing the Agricultural Guide application. The socio-economic characteristics assessed included age, level of education, farming experience, landholding size, number of trees on the farm, olive production, income levels, dependence on agriculture as the primary income source, employment status, cultivation techniques, irrigation and harvesting methods, marketing strategies, engagement in agricultural activities, daily duration of mobile and internet usage, information sources, and the extent of usage of the Agricultural Guide application.
The adoption of sustainable olive farming practices facilitated by the Agricultural Guide application was evaluated using 23 items on a five-point Likert scale, ranging from 1 (never) to 5 (always). Prior to assessing adoption levels, all participants were asked to evaluate various sustainable farming practices. For individuals who utilized the Agricultural Guide application, an additional column was incorporated to indicate whether each practice was influenced by the application (marked as “Yes” or “No”). Only practices marked as “Yes” were included in the impact analysis, while those marked as “No” were considered in a broader context unrelated to the application’s influence. Furthermore, barriers to utilizing the Agricultural Guide application were assessed using 16 items on a five-point Likert scale, ranging from 1 (strongly disagree) to 5 (strongly agree).
2.5. Data Analysis
The data were analyzed using R software (v4.3.1). Descriptive statistical analyses, including frequency distributions, percentages, means, and standard deviations, were conducted to summarize the data. Inferential statistical analyses comprised Principal Component Analysis (PCA) and t-tests. PCA was employed to identify the key questions within each scale construct that accounted for most of the variance in the respective aspects. Two primary constructs were assessed using a 5-point Likert scale: (1) the adoption of sustainable agricultural practices facilitated by the Agricultural Guide application and (2) barriers to its utilization. The Kaiser–Meyer–Olkin (KMO) Measure of Sampling Adequacy was applied to assess the suitability of the survey response data for factor analysis. t-tests were conducted to examine differences in the adoption of sustainable practices and barriers to using the Agricultural Guide application based on socio-economic characteristics.
Internal consistency was evaluated to assess the reliability of the measurement instrument and its individual items. This approach involves measuring the correlation among test items designed to capture the same construct. A commonly accepted threshold for adequate internal consistency is a Cronbach’s alpha value of 0.7 (36). In the present study, the Likert scale demonstrated a high level of internal consistency, rendering it appropriate for research purposes. Specifically, the internal consistency coefficient (Cronbach’s alpha) for items measuring both the adoption of sustainable agricultural practices via the Agricultural Guide application and barriers to its use was 0.844, indicating a relatively high degree of reliability within the data.
The random forest (RF) algorithm is a well-established machine learning technique that belongs to the family of ensemble models. It employs a bagging strategy, wherein multiple decision trees are constructed using bootstrap samples drawn from the original training dataset. Each tree is trained independently, and the final prediction is obtained by averaging the outputs of all trees. Unlike traditional decision trees, RF does not consider all available features at every split. Instead, it selects a random subset of features for each split, thereby reducing the correlation among trees and preventing the formation of similar tree structures. This approach enhances the overall predictive accuracy of the model [
34,
35,
36,
37,
38].
Beyond its predictive capabilities, random forest provides an effective mechanism for feature importance estimation. It identifies the most influential variables and quantifies their individual and interactive effects, making it a valuable tool for analyzing complex, high-dimensional datasets. The integration of machine learning techniques, particularly the RF algorithm, enables a comprehensive understanding of the factors influencing farmers’ decisions regarding the adoption of specific applications.
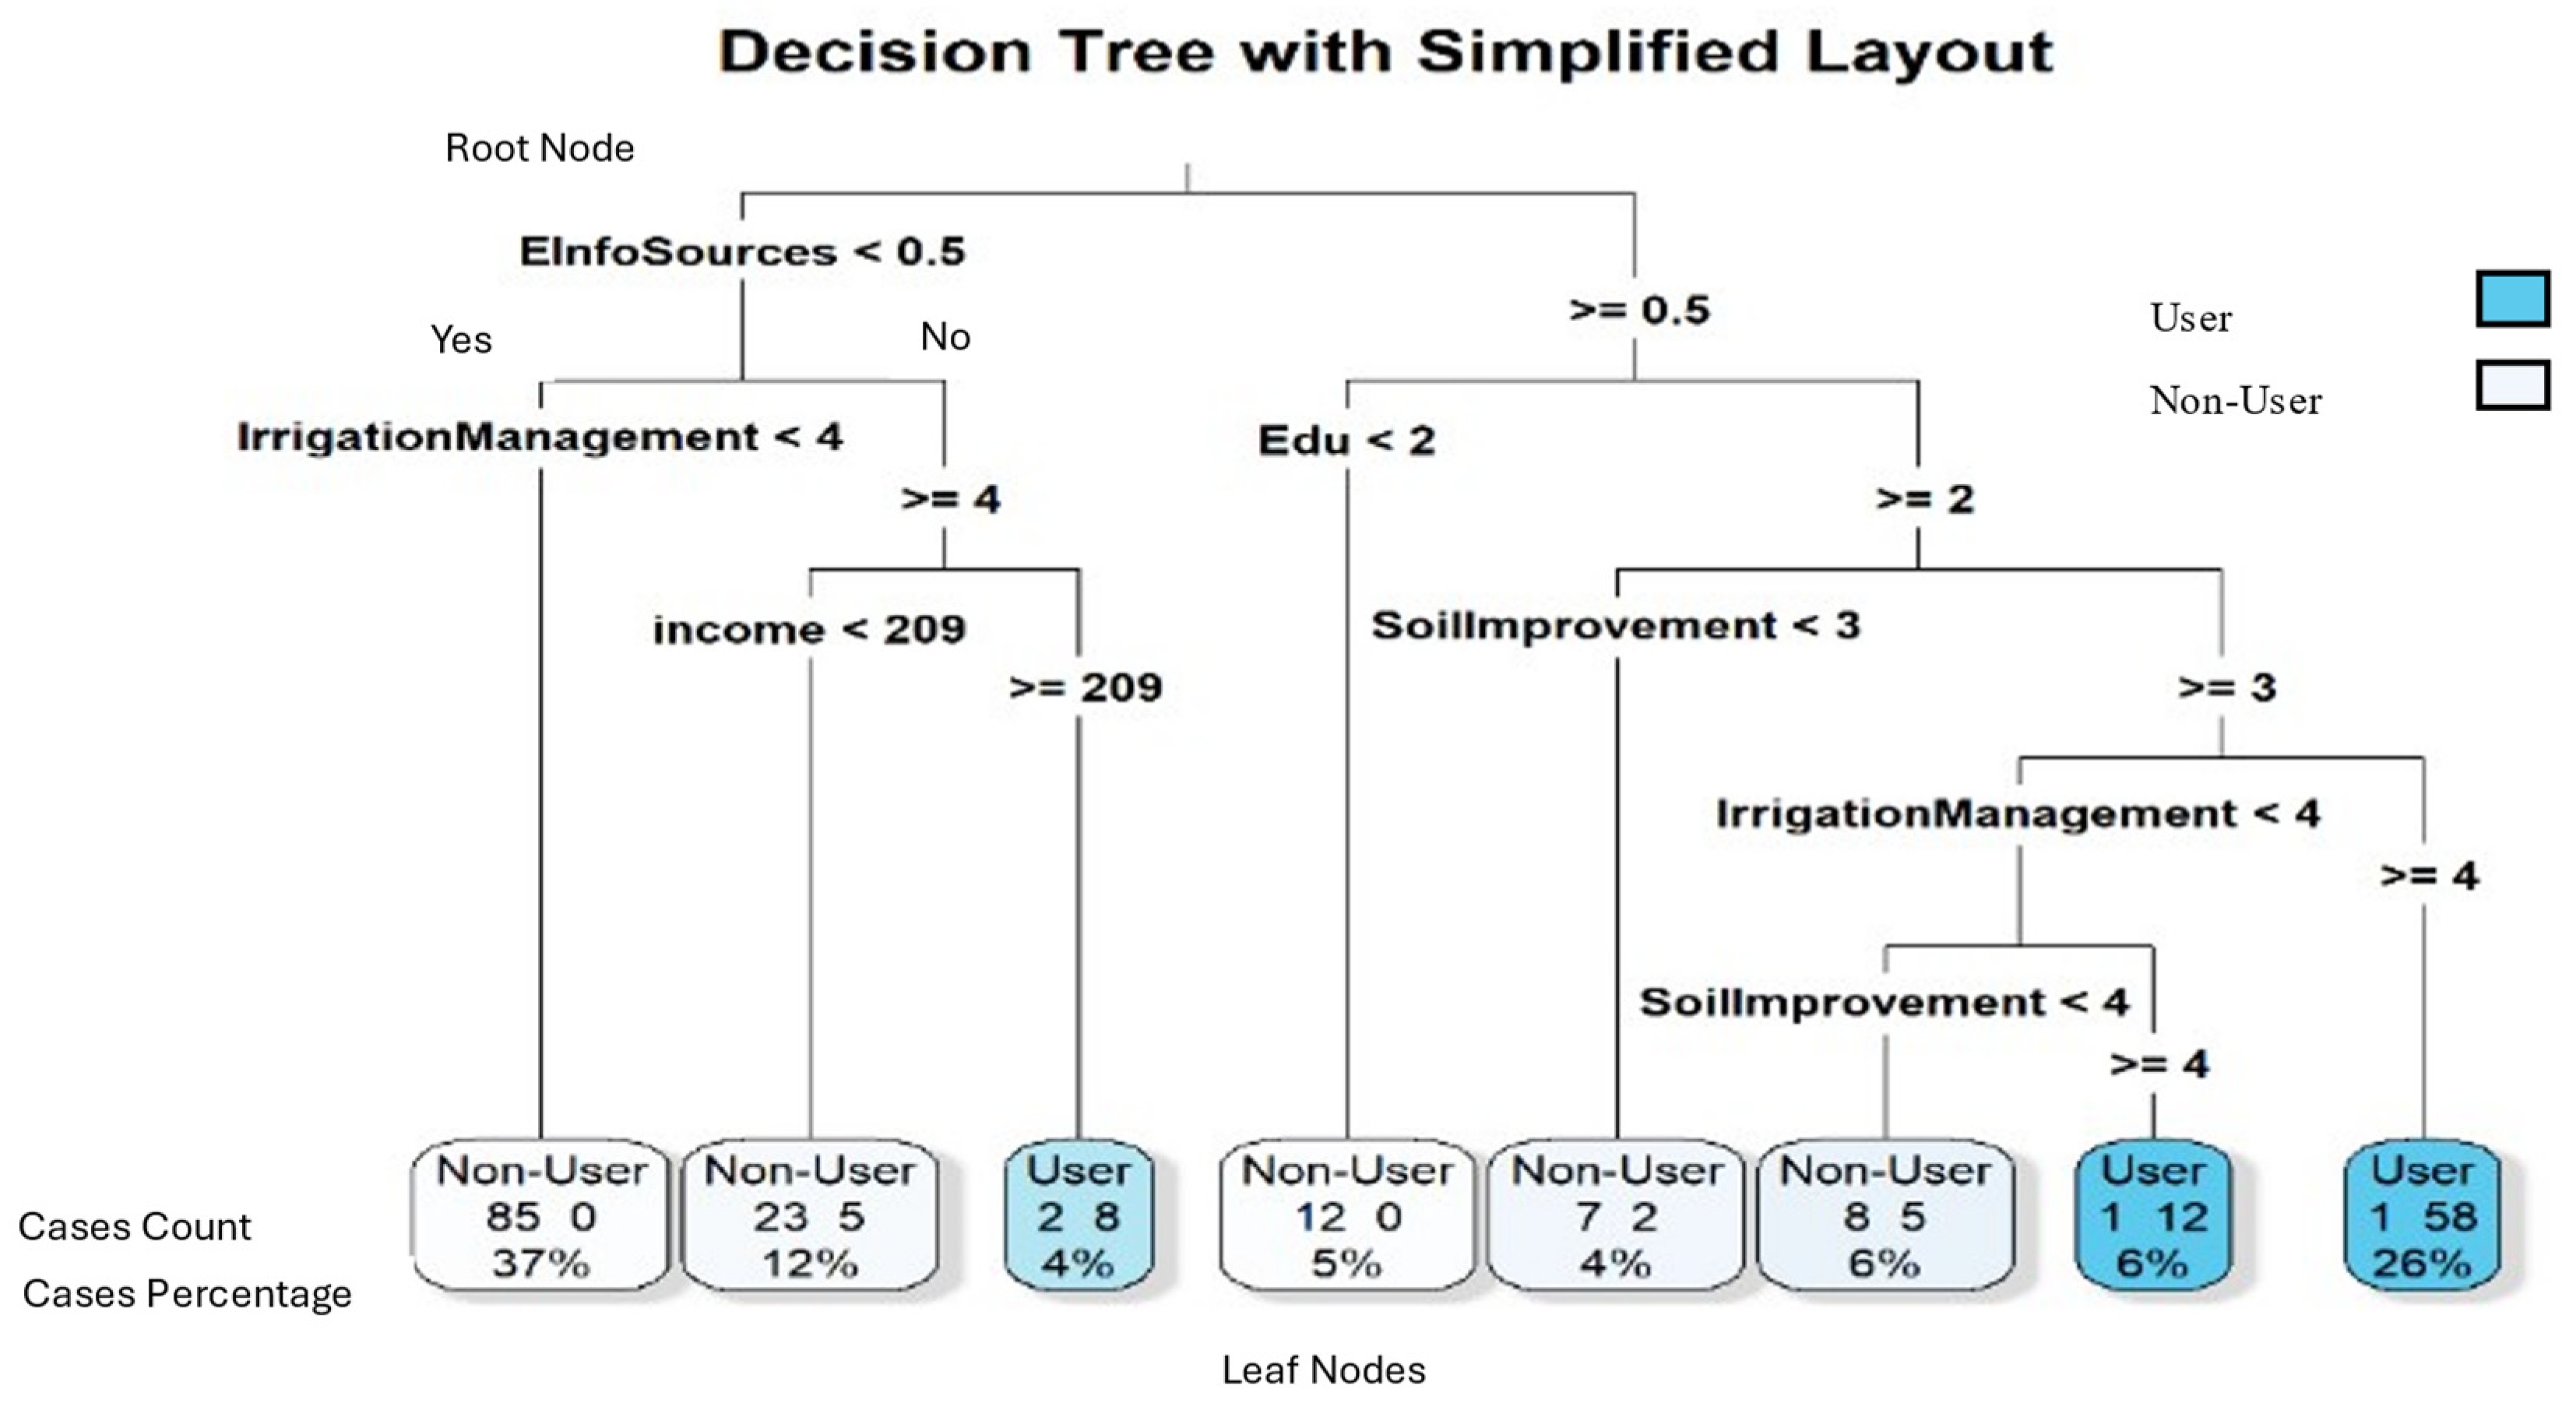
Figure 2 presents a decision tree generated during the analysis, illustrating the model’s operational mechanism by partitioning the data. The figure represents one instance from the ensemble of 500 randomly generated trees in this study.
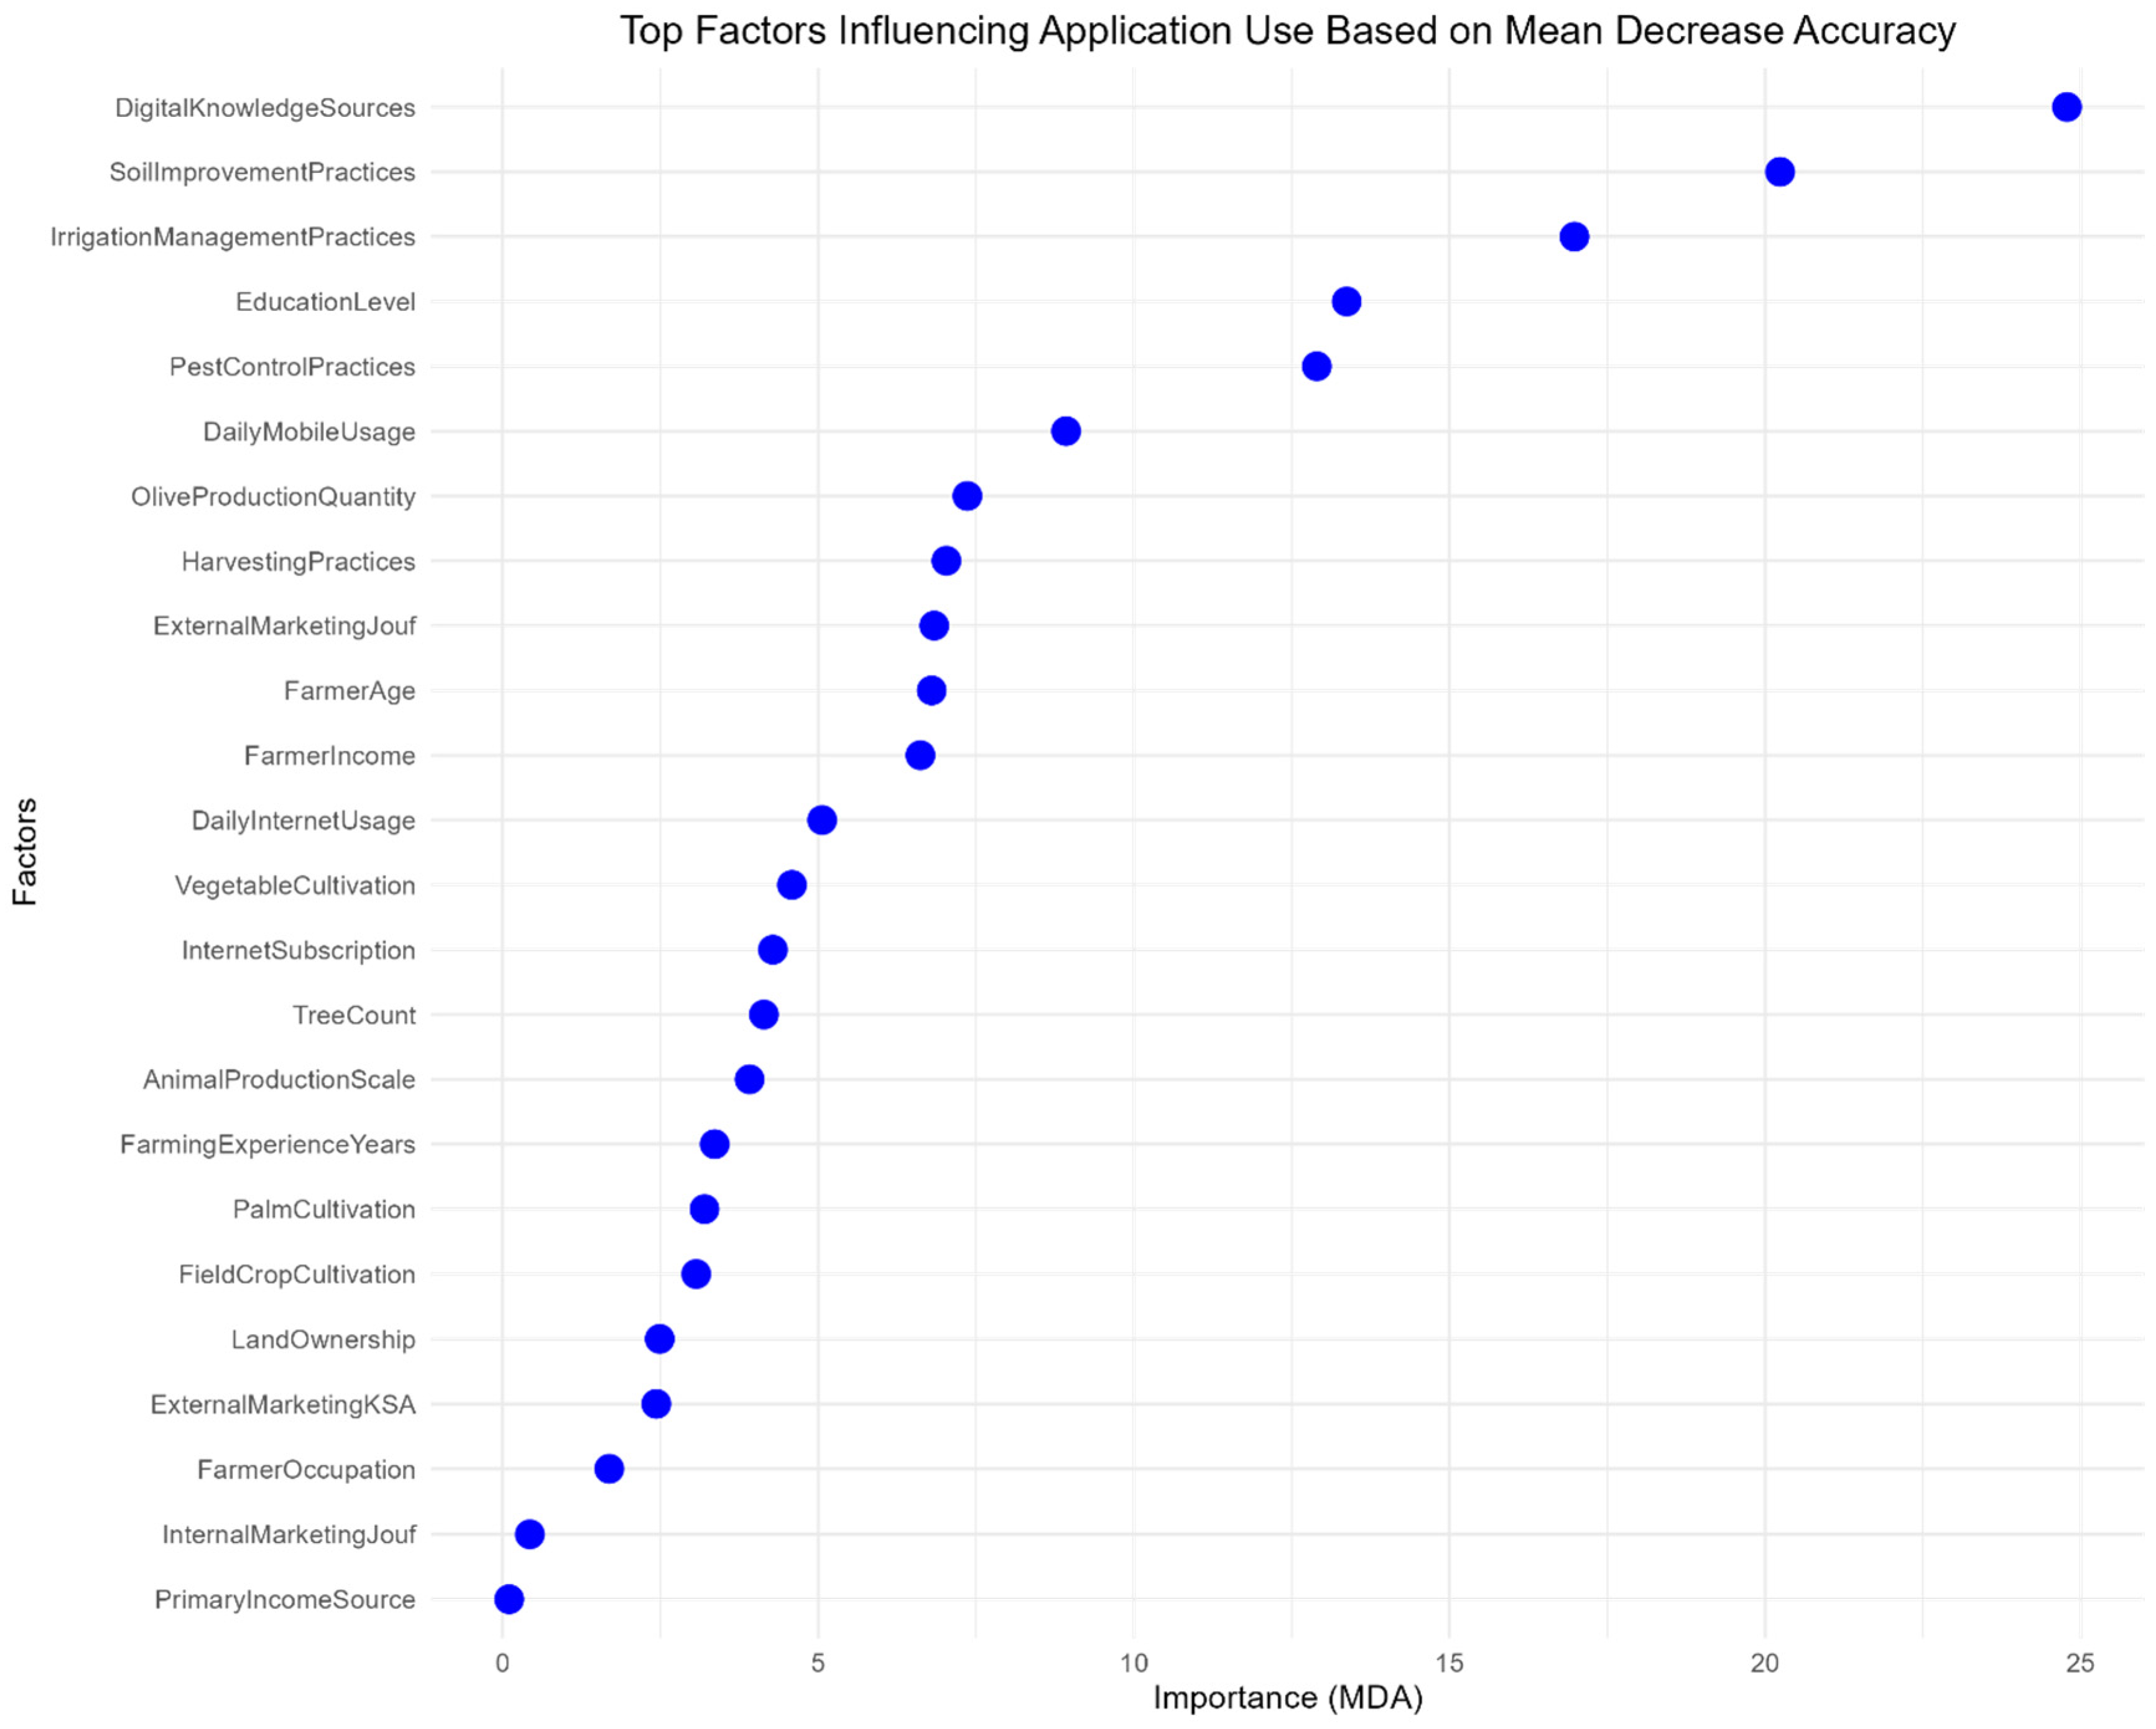
The random forest approach is a machine learning approach. It can calculate the importance of variables using measures such as average drops in accuracy, providing insights into the relative influence of different factors. It can generate robust classifications [
34]. The random forest approach was used to analyze the impact of smartphone applications on behavior. This approach proved effective by providing classifications and calculating the most critical changes accurately [
39].
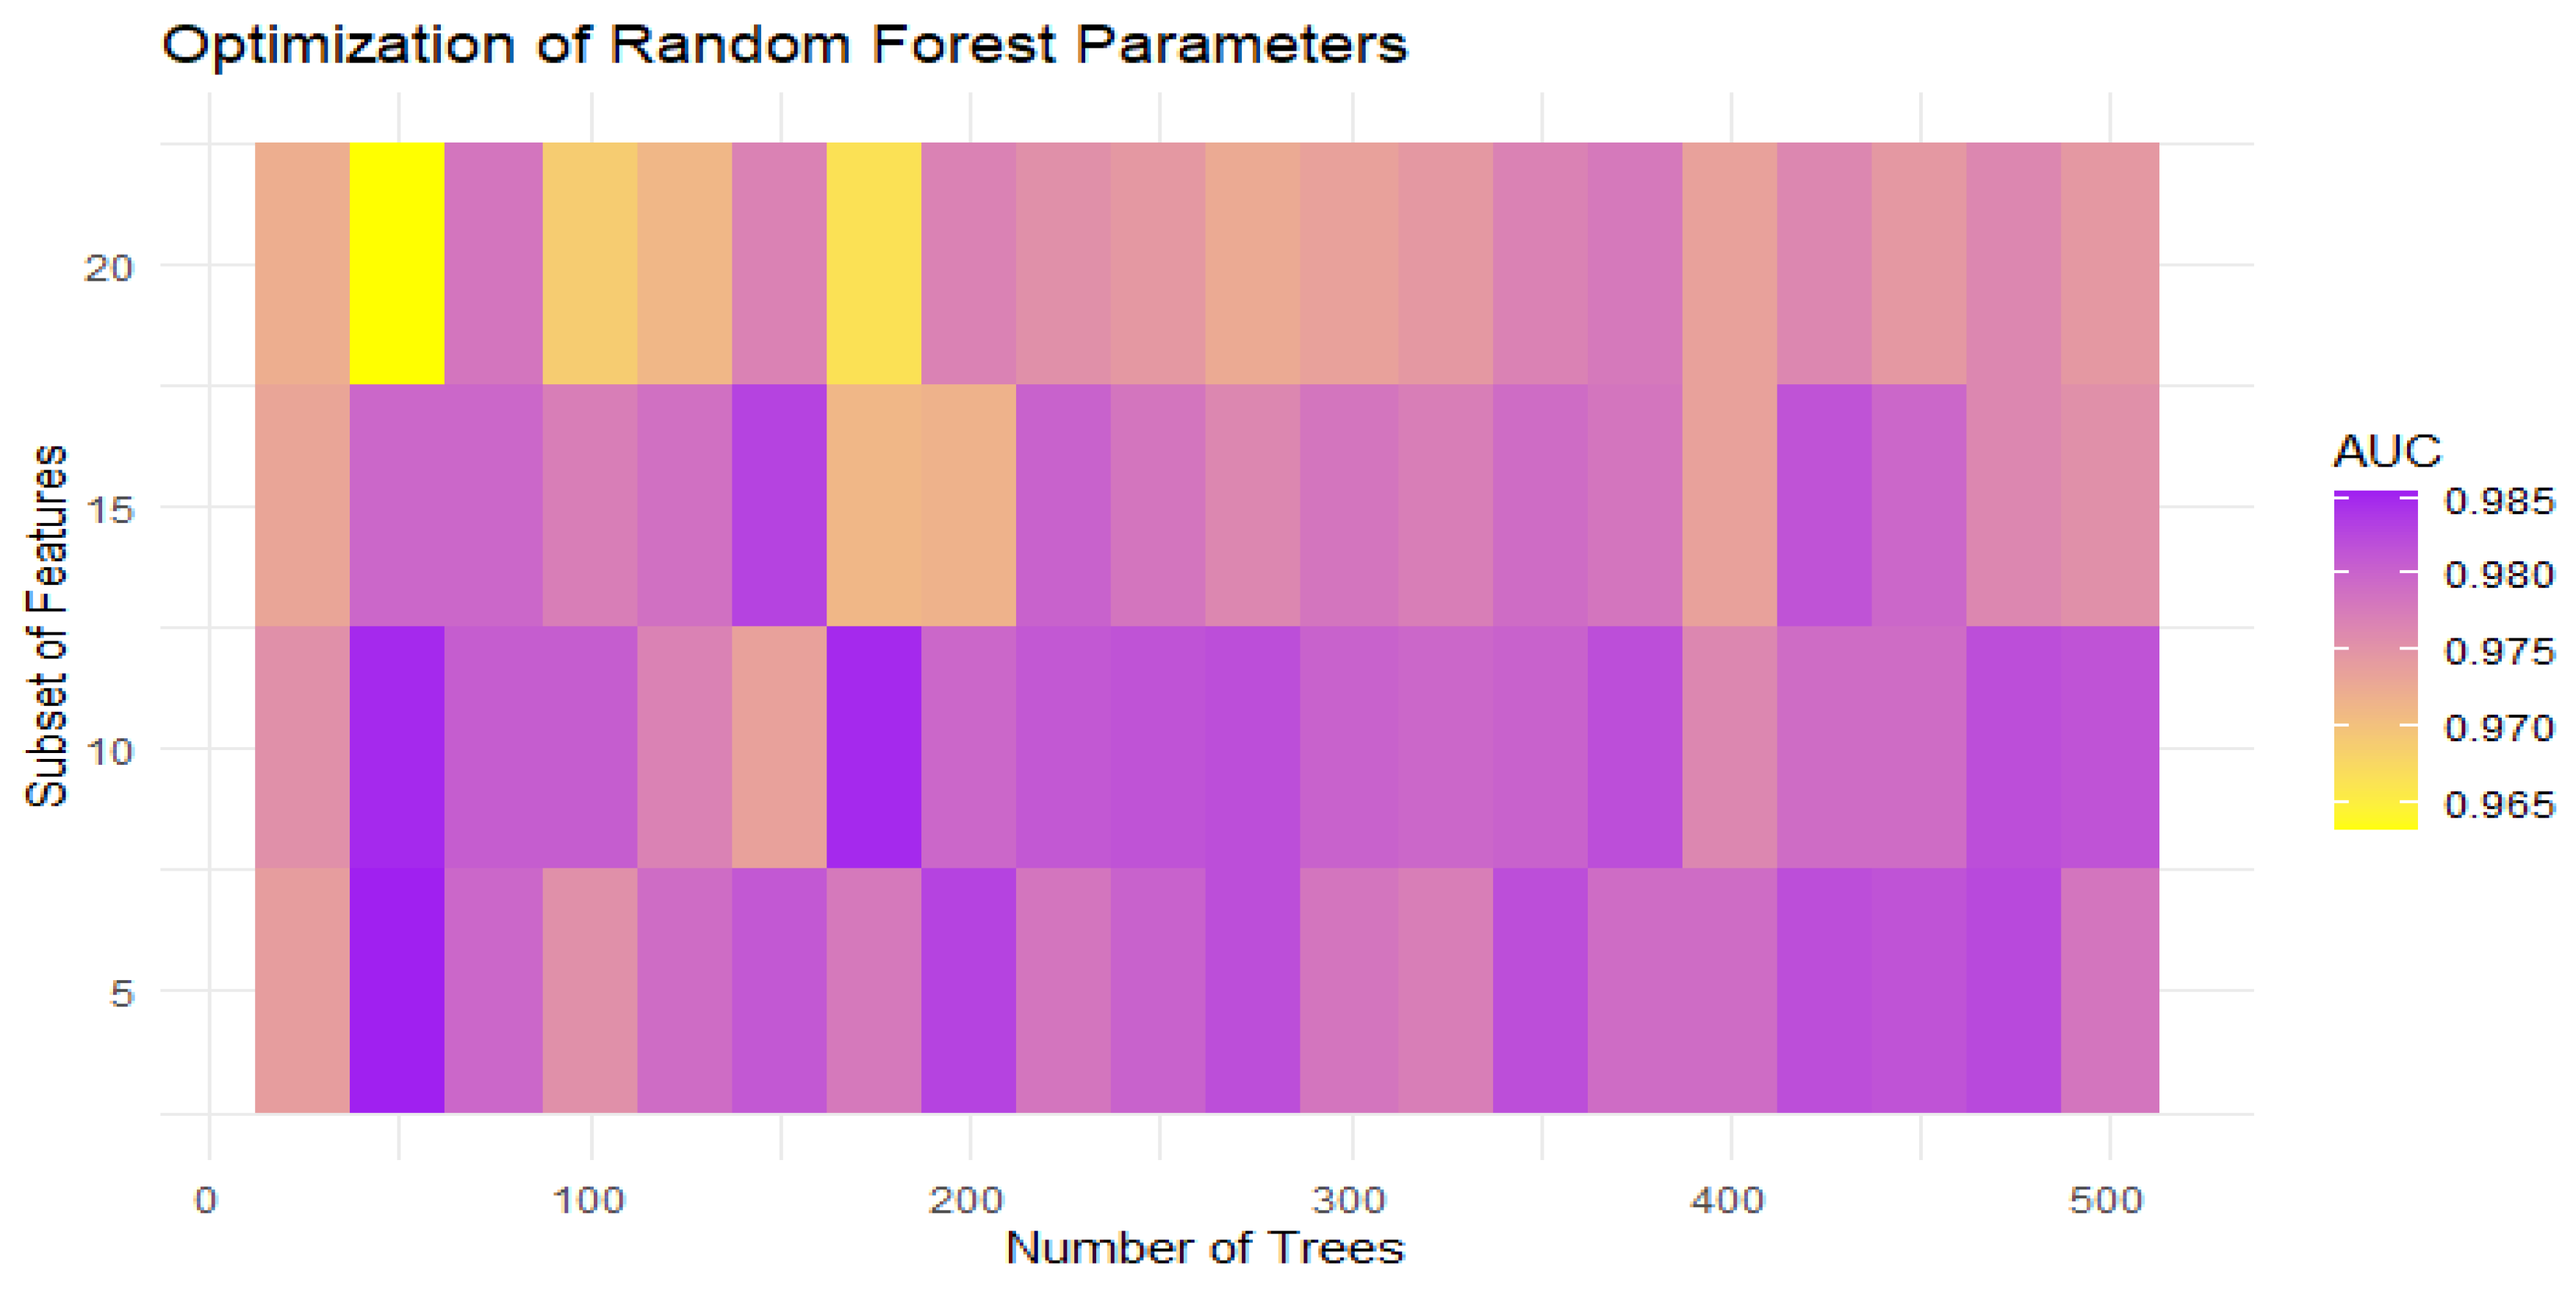
A stratified sample of data were taken from the datasets representing two groups of users and non-users due to their different numbers. Then, 70% of the data were allocated for training the model and 30% for testing the model after training. Five hundred decision trees were used after the model showed stability at this number, with randomly selected features in each division. Then, the necessary statistical criteria were applied to evaluate the performance and ensure the stability of the model [
35,
40].
2.6. Mathematical Formulation of the Model
Final prediction in the random forest model [
34]:
This equation shows the final output of the model prediction , which is calculated by adding all the individual predictions for each tree in the model by adding the votes resulting from each tree T, where represents the individual prediction of the tree.
Objective function for error minimization [
41]:
This equation is divided into two parts: the first part calculates the difference between the true values and the predicted values using the loss function, while the second part expresses the regularization function, which works to reduce the tree repetition and overfitting and make the model more efficient and stable.
Mean decrease in accuracy equation [
34]:
This equation measures the degree of importance of each variable based on its impact on the model’s performance by measuring the original prediction accuracy and the model’s accuracy after rearranging the variable values . The change was performed randomly. If the decrease in accuracy is large, it indicates that the variable is important in the model.
2.7. Model Evaluation
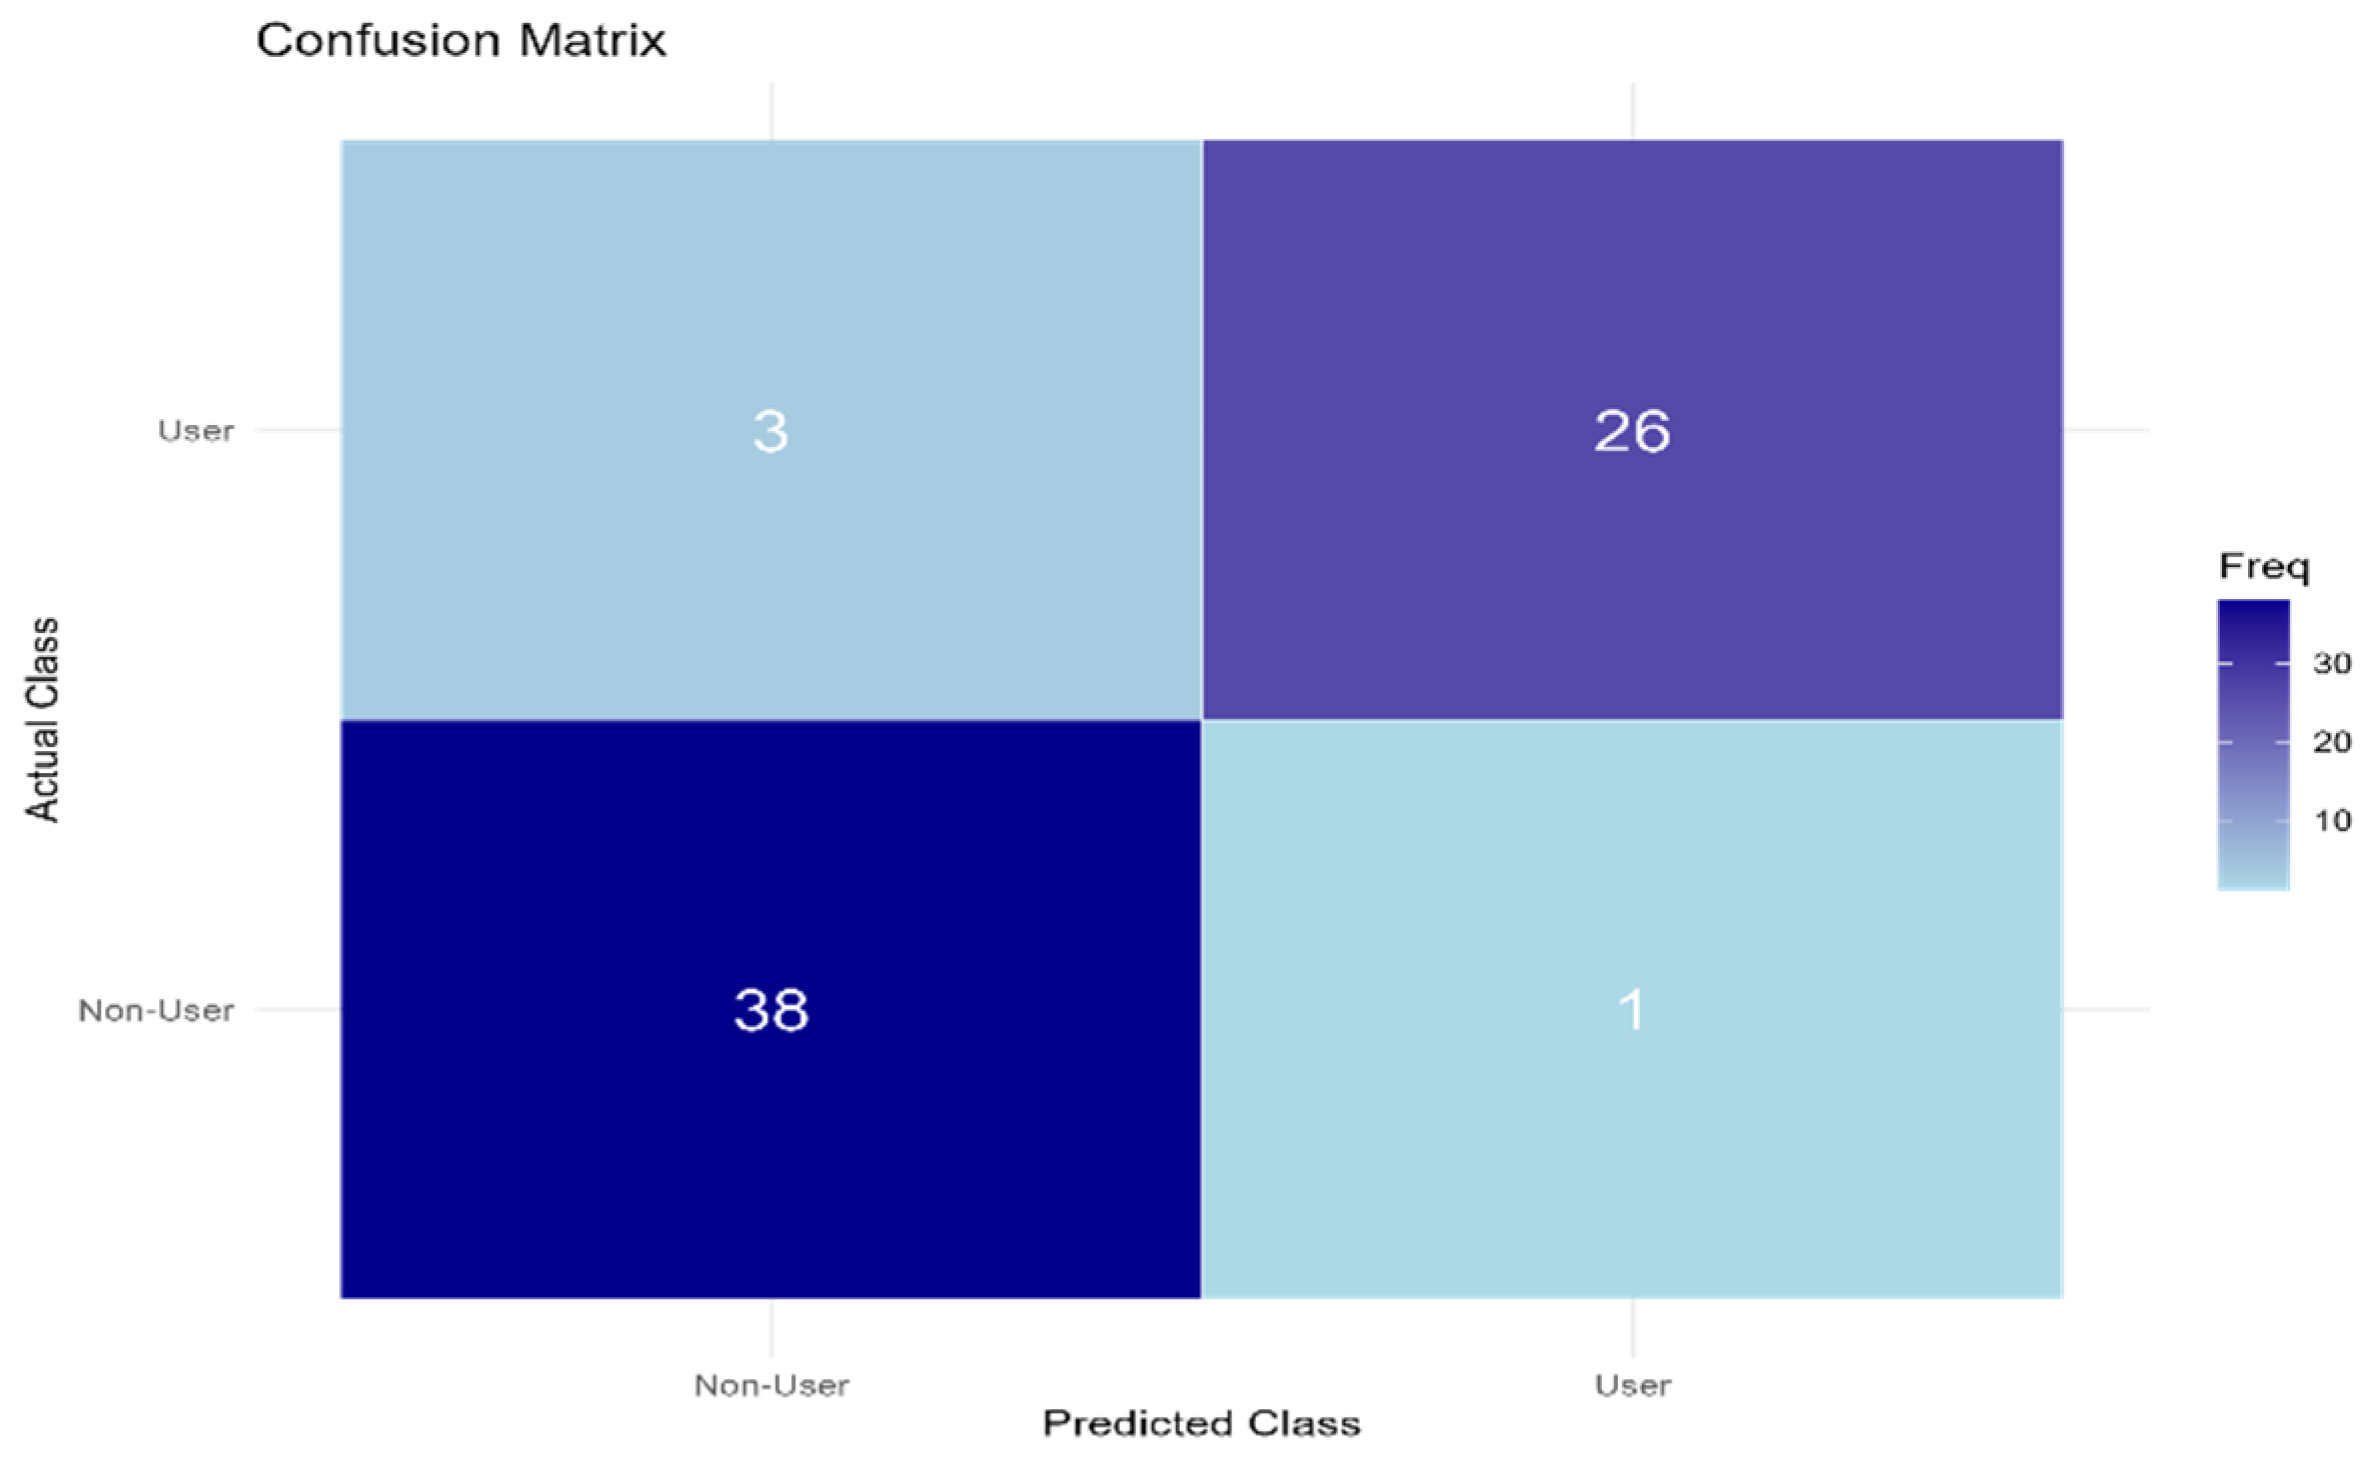
The model was evaluated using the following performance metrics:
The main packages used in the analysis were
random forest [
40] for model construction and significance,
caret [
45], for data classification and analysis,
pROC and AUC [
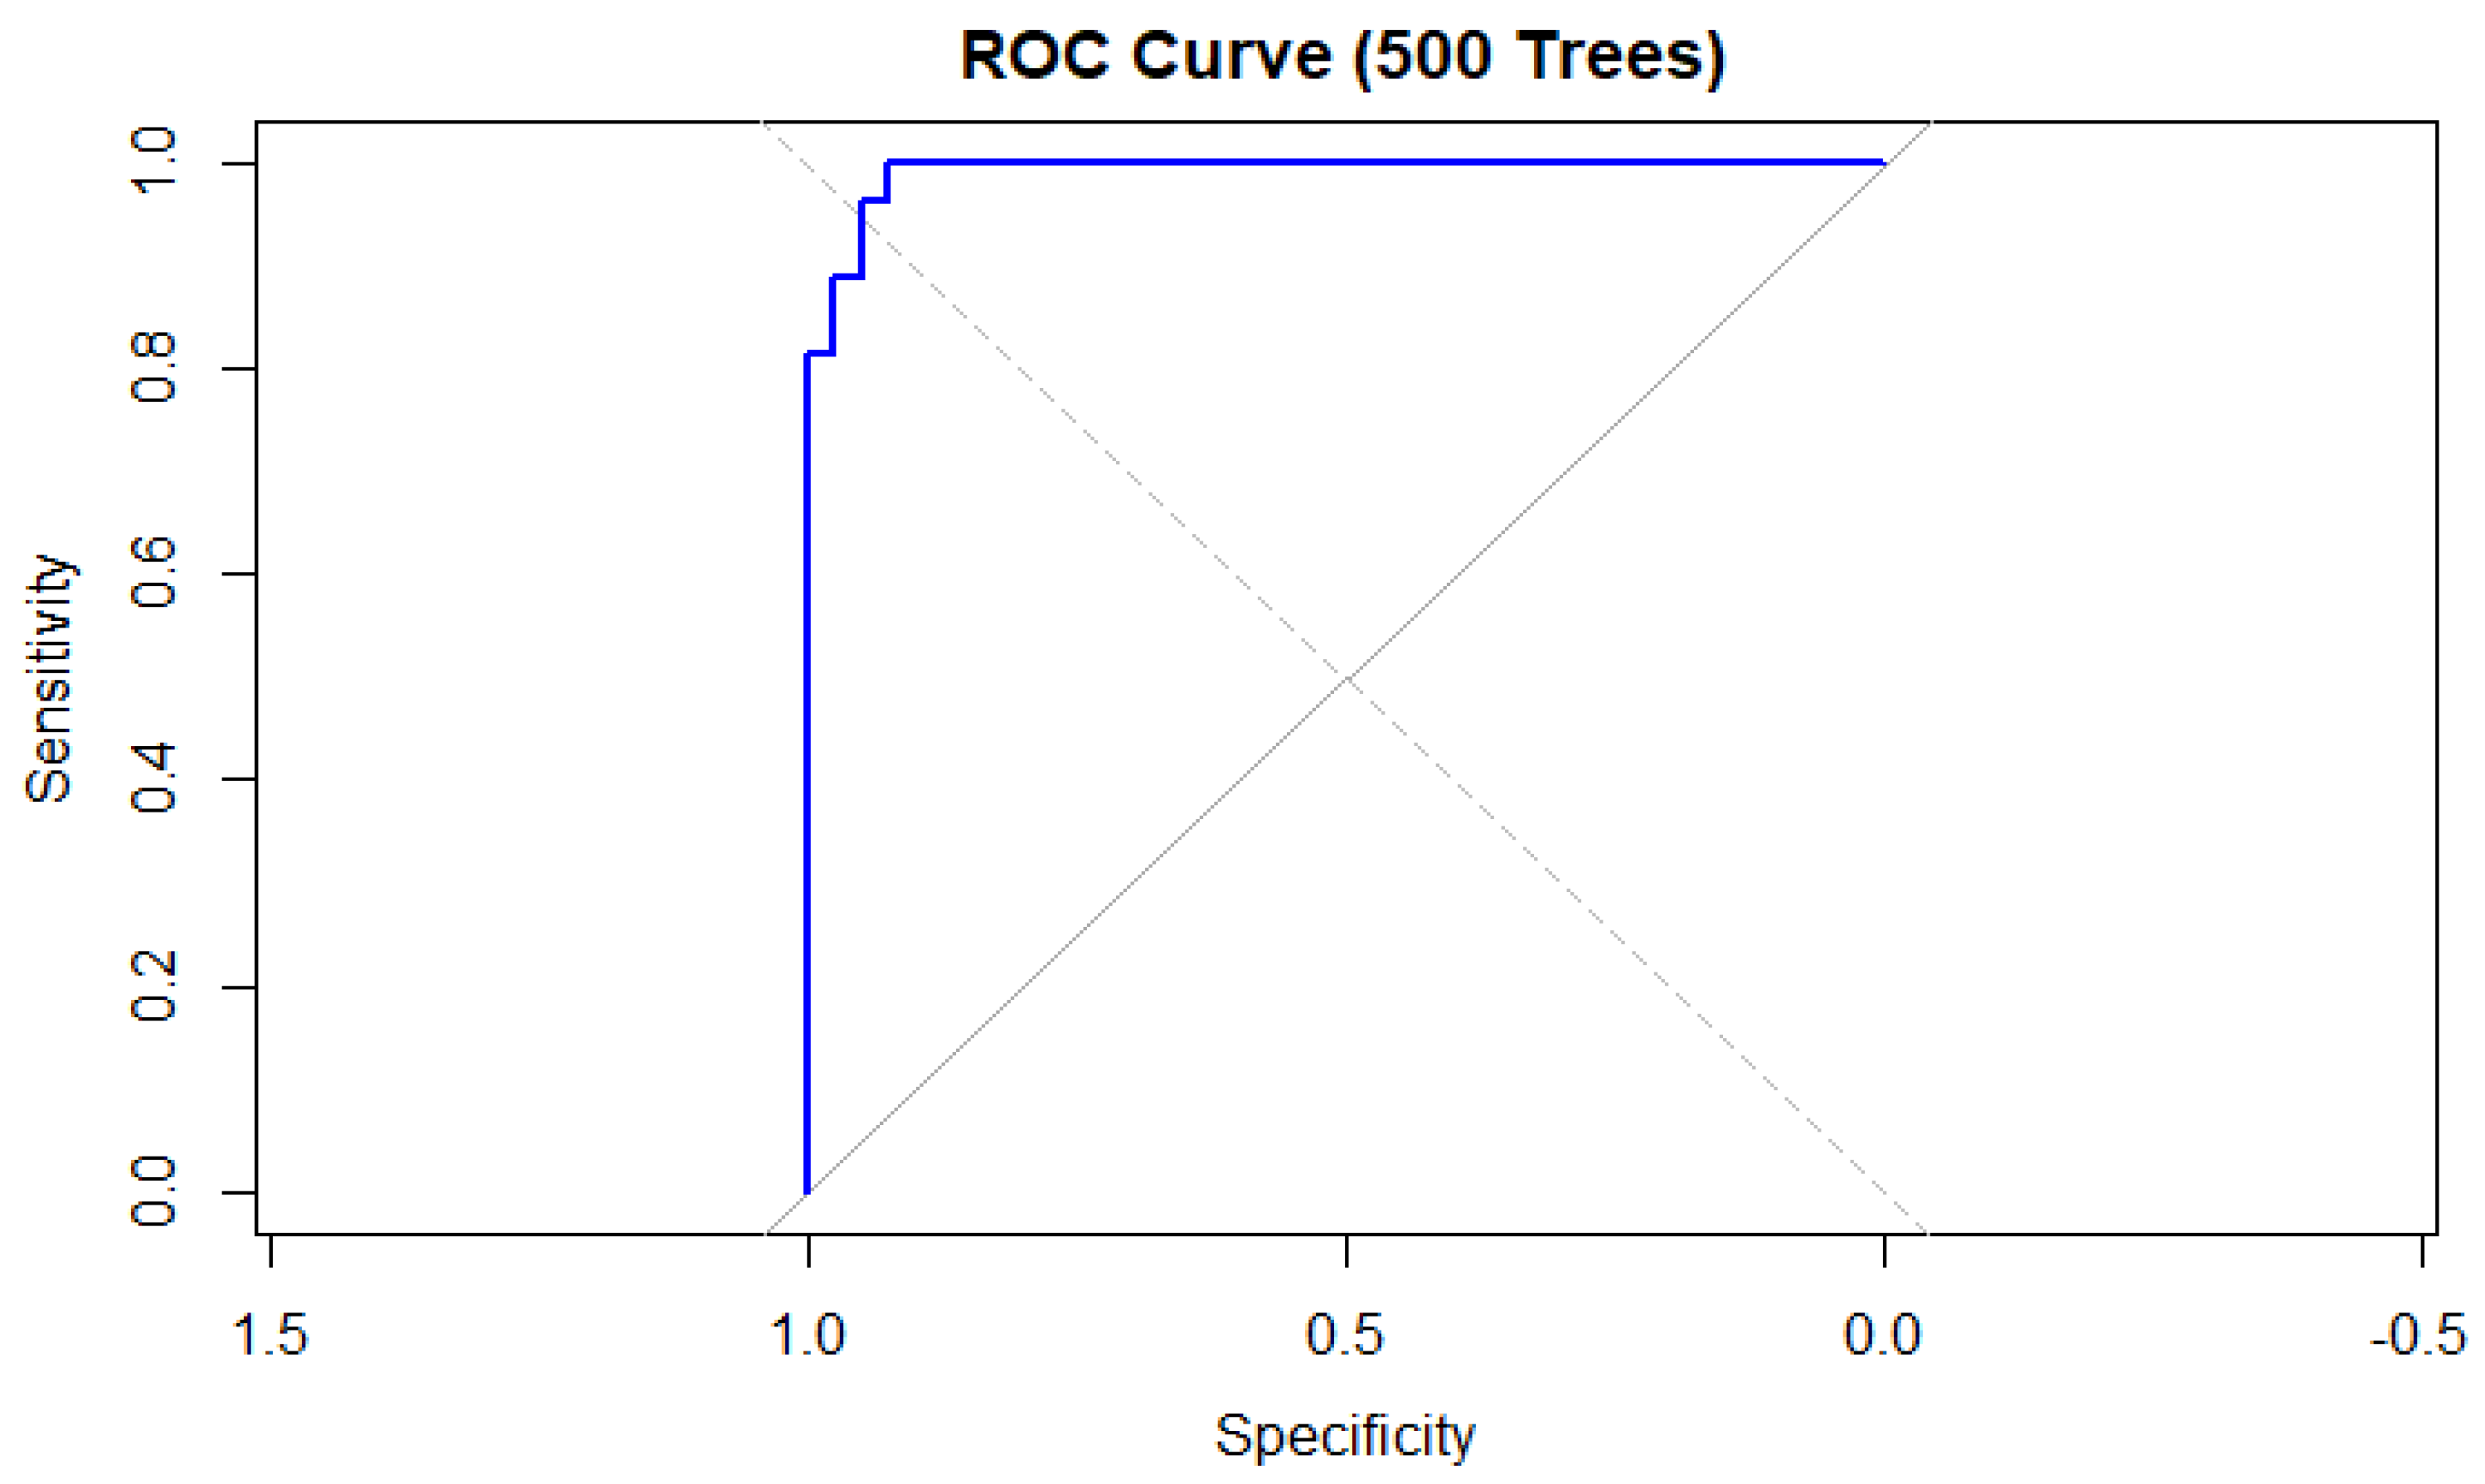
46] for ROC curve analysis, and
ggplot2 for data visualization [
47]. They were used to generate the random forest and analyze the data.
