Article

Leveraging Spectral Clustering and Long Short-Term Memory Techniques for Green Hotel Recommendations in Saudi Arabia

by
Abdullah Alghamdi
1,2
1
Information Systems Department, College of Computer Science and Information Systems, Najran University, Najran 61441, Saudi Arabia
2
AI Lab, Science and Engineering Research Center (SERC), Najran University, Najran 61441, Saudi Arabia
Sustainability 2025, 17(5), 2328; https://doi.org/10.3390/su17052328
Submission received: 13 January 2025 / Revised: 28 January 2025 / Accepted: 17 February 2025 / Published: 6 March 2025

Abstract

:
Online recommendation agents have demonstrated their value in various contexts by helping users navigate information overload, supporting decision-making, and influencing user behavior. There is a lack of studies focusing on recommendation systems for green hotels that utilize user-generated content from social networking and e-commerce platforms. While numerous studies have explored the use of real-world datasets for hotel recommendations, the development of recommendation systems specifically for green hotels remains underexplored, particularly in the context of Saudi Arabia. This study attempts to develop a new approach for green hotel recommendations using text mining and Long Short-Term Memory techniques. Latent Dirichlet Allocation is used to identify the main aspects of users’ preferences from the user-generated content, which will help the recommender system to provide more accurate recommendations to the users. Long Short-Term Memory is used for preference prediction based on numerical ratings. To better perform recommendations, a clustering technique is used to overcome the scalability issue of the proposed recommender system, specifically when there is a large amount of data in the datasets. Specifically, a spectral clustering algorithm is used to cluster the users’ ratings on green hotels. To evaluate the proposed recommendation method, 4684 reviews were collected from Saudi Arabia’s green hotels on the TripAdvisor platform. The method was evaluated for its effectiveness in solving sparsity issues, recommendation accuracy, and scalability. It was found that Long Short-Term Memory better predicts the customers’ overall ratings on green hotels. The comparison results demonstrated that the proposed method provides the highest precision (Precision at Top @5 = 89.44, Precision at Top @7 = 88.21) and lowest prediction error (Mean Absolute Error = 0.84) in hotel recommendations. The author discusses the results and presents the research implications based on the findings of the proposed method.

1. Introduction

The latest developments in information technology have transformed marketing. The information explosion complicates the search for chosen products in digital marketplaces [1]. Research on information retrieval and filtering systems is led by Artificial Intelligence (AI) techniques. Recommendation systems provide a clear illustration of how AI is used in various fields [2,3,4]. According to previous research, online recommendation systems have helped users manage vast amounts of information [5,6] and decision-making [7]. However, the prediction of these systems largely depends on the availability and quality of data in different contexts. Thus, the accurate prediction of user interests has traditionally been the primary goal of developing recommendation algorithms and technologies [8]. This issue has been widely investigated in previous studies [9,10]. As feedback mechanisms are explicit or implicit within recommendation systems, both algorithm selection and evaluation methods are influenced by this mechanism [11]. Thus, this issue is considered in the design of recommendation algorithms for specific domains. In addition, the nature of the data is also an important aspect of this design. In many contexts, relying solely on numerical ratings may not be effective in developing robust recommendation systems; accordingly, textual reviews are used as complementary data to strengthen the efficiency of the recommendation engine. Although ratings and reviews provide good insights into what users want, they are also relatively complex data and may require more advanced processing techniques, like Natural Language Processing (NLP). These assumptions mean that implicit feedback from clicks or play counts, which are easier to collect, is uncertain. The combination of implicit and explicit feedback gives many systems the opportunity to benefit from each respective strength and achieve greater recommendation accuracy.
Recommendation systems are categorized into content-based filtering and Collaborative Filtering (CF) [12]. Sufficient data are essential for these systems to function effectively. Utilizing the power of open databases, recommendation agents analyze, delineate, and mirror the characteristics of tourists in order to generate meaningful associations between human profiles and the needs of different groups of people. This is performed in order to address the problems that are prevalent in the tourism industry [13]. Due to the higher credibility of the former in comparison to the latter, recommendations derived from consumer reviews and user profiles have greater sway than marketing-generated promotional content [14].
There are several factors that make green hotel recommendations challenging. Predicting users’ preferences for booking accommodations is often complex and influenced by cultural and contextual factors [15,16]. In other words, users tend to have intricate and specific needs when choosing where to stay during their travels. In addition, the volume of data input to hotel recommendation systems is rapidly increasing as the number of users and hotel listings grows. For popular platforms, user behavior data can easily reach terabytes daily. Despite this, most hotel recommendation systems aim to provide responses in under a second to maintain user engagement and ensure a seamless experience. The challenge lies in developing efficient learning algorithms capable of handling such large-scale datasets. Collaborative filtering algorithms, commonly used for hotel recommendations, must analyze users collectively [16], which becomes time-intensive with a high user count. For instance, the kNN method calculates similarities among all user pairs to identify a neighborhood [17], then predicts preferences using a weighted average of neighbors’ ratings, resulting in quadratic running time based on the number of users.
Furthermore, traditional collaborative filtering systems often rely on overall ratings provided by customers, such as a 5-star rating system. Thus, the majority of the algorithms for recommendation systems have relied on single ratings. These ratings may not effectively consider users’ preferences in some contexts such as tourism. In addition, businesses increasingly emphasize the importance of detailed feedback. Consequently, many platforms now facilitate user evaluations across multiple dimensions. While granular feedback provides richer insights, it complicates the recommendation process, especially in areas like hotel booking, where user preferences vary and are context-dependent. Integrating detailed feedback into CF algorithms is a major challenge for providing accurate and personalized recommendations. Moreover, with the growing focus on sustainability and customer-specific preferences, particularly in green hotel recommendations, these systems face limitations. Many businesses are adopting multi-dimensional feedback systems, allowing users to rate hotels based on factors such as energy efficiency, eco-friendly amenities, and waste management practices. While this approach offers deeper insights into user preferences, it also makes the recommendation process more complex.
In Saudi Arabia, green initiatives are advancing in alignment with Vision 2030. The Kingdom of Saudi Arabia is striving for more environmentally friendly travel habits and attitudes [18,19]. However, the diversity of user preferences and the context-specific nature of eco-friendly practices add complexity to personalization through the use of AI systems such as recommendation systems. In fact, unlike traditional domains, recommending green hotels demands algorithms that can handle and integrate detailed criteria like carbon footprint reductions, use of renewable energy, or locally sourced materials. Traditional recommendation systems such as CF-based algorithms, which rely on sign-rating approaches, may not be effective in these contexts. Thus, it is believed that AI-based systems based on multi-criteria approaches may solve this issue by considering users’ preferences in multiple quality dimensions. Adomavicius and Kwon’s pioneering work on multi-criteria recommendation systems [20] highlighted how incorporating granular feedback could enhance predictive accuracy. While their early experiments in the movie domain demonstrated the potential of multi-criteria CF, applying similar methodologies to green hotel recommendations introduces new challenges. The domain-specific nature of eco-friendly ratings, cultural differences in sustainability priorities, and the scarcity of comprehensive data pose significant hurdles. In addition, the scalability and sparsity issues are challenges within multi-criteria CF, which must be overcome through sophisticated algorithms. These algorithms must be able to handle large datasets for effective recommendations. Furthermore, as users are mainly unwilling to provide ratings on specific items [21,22], there will be sparse datasets, which cannot be handled by traditional CF-based algorithms.
This paper builds upon existing research to propose a new recommendation method by integrating multi-criteria ratings into CF algorithms. By addressing domain-specific challenges, such as the varying definitions of sustainability across different user groups, the proposed approach aims to improve the predictive accuracy and scalability of green hotel recommendation systems in Saudi Arabia. This study attempts to develop a new approach for green hotel recommendations using text mining and Long Short-Term Memory (LSTM). Latent Dirichlet Allocation (LDA) is used to identify the main aspects of users’ preferences from the user-generated content that will help the recommender system provide more accurate recommendations to the users. LSTM is used for preference prediction based on numerical ratings. To better perform recommendations, a clustering technique is used to overcome the scalability issue of the proposed recommender system, specifically when there is a large amount of data in the datasets. Specifically, a spectral clustering algorithm is used for the clustering of the users’ ratings on green hotels. The proposed method is critical to fostering a sustainable tourism ecosystem while meeting the diverse needs of eco-conscious travelers. Overall, the contributions in this work are as follows:
  • The author integrated multi-criteria ratings into CF algorithms to address domain-specific challenges in recommending green hotels in Saudi Arabia.
  • Text mining and LSTM are utilized by combining LDA for identifying user preferences from user-generated content and LSTM for numerical rating predictions to enhance recommendation accuracy.
  • Spectral clustering has been employed to overcome scalability issues in handling large datasets, enabling efficient and effective user segmentation for green hotel recommendations.
This study is organized as follows. In Section 2, the recommendation systems in tourism and hospitality are investigated. In Section 3, the proposed recommendation method is explained. In Section 4, the author provides the complete results of method evaluation. In Section 5, the discussion, limitations, and future works are presented. Finally, this study is concluded in Section 6.

2. Recommendation Systems in Tourism and Hospitality

Tourism service providers have experienced significant growth in data volume and user numbers over the past decade [23]. Although the value of data is evident, they can also pose a significant challenge for recommendation systems. In fact, the information is especially useful for users planning to travel to a new place; however, in terms of processing vast amounts of diverse data, robust algorithms and methods are needed for accurate and scalable recommendations. Tourists frequently search for information about travel destinations and related needs. Web search engines and specialized tourism sites provide a wide range of options, which can be overwhelming. Tourists must analyze numerous options to determine the best fit for their needs. Thus, recommendation algorithms are suggested by researchers in AI fields to combat this issue and help tourists in their decision-making.
Previous studies have demonstrated that CF-based recommendation systems are more effective in tourism and hospitality. One of the advantages of these systems is the ability to handle numerical ratings in a comprehensive way to generate recommendations. Thus, almost the majority of tourism recommendation systems have been based on a collaborative filtering approach [24,25,26]. Additionally, in some cases, hybrid approaches have been utilized to overcome the shortcomings of the CF-based algorithms [27,28]. In the following, some of the research on recommendation systems in tourism are summarized.
A new algorithm was proposed by [29] using user-based CF and item-based CF. The authors performed sentiment analysis techniques, a subset of NLP, to extract sentiment data from hotel reviews. By this approach, the imputation of missing values was effectively performed. A new method was proposed by [30], which was based on a CF approach. It utilized the interests of users and their ratings of attractions in an explicit manner, while also implicitly utilizing the information of users’ social networks. The proposed system was sensitive to six different characteristics: user preferences, real-time location, time weather forecast, history, and friends’ recommendations. In their study, ref. [31] highlighted the limitations of traditional recommendation systems in tourism. The authors proposed the integration of forecasting mechanisms that helped the system to address the previous system’s shortcomings. Ref. [32] focused on the TDSG (Tourism Destinations Serious Game) to regulate responses visualized through serious game scenarios. The MCRS (Multi-Criteria Recommender System) was employed to generate destination recommendations. To ensure decentralized, distributed, and secure data sharing, the authors proposed the Ethereum blockchain platform for handling data circulation within the system.
The effectiveness of the Probabilistic Language Term Set (PLTS) theory was investigated by [33] to explain the meaning of different terms and overcome the ambiguity in customers’ online review information and proposed a hotel recommendation algorithm. Their method was evaluated on the selected 10 hotels in Zhuhai City as case studies. Ref. [34] developed a new recommendation algorithm using neuro-fuzzy and Support Vector Regression. They used SOM (Self-Organizing-Map) together with EM (Expectation–Maximization) for data clustering to enhance the recommendation quality. In addition, the Hypergraph Partitioning Algorithm technique was used for ensemble learning. The outcomes of their study showed that ensemble learning can significantly improve recommendation efficiency in a tourism context. In another study by [35], the authors proposed an algorithm based on dimensionality reduction, neuro-fuzzy, and clustering techniques. They evaluated the method on the data for eco-friendly hotels on TripAdvisor. They found that the use of the dimensionality reduction technique is valuable for handling large datasets in the tourism context.
Ref. [36] investigated knowledge-based topic retrieval for recommendations and tourism promotions. The authors suggested an automated system to carry out three subtasks: a knowledge-based recommendation system, a feedback model, and a star rating prediction using online evaluations of customers. They found that DT (Decision Tree) and RF (Random Forest) classifiers can provide high-accuracy results in the prediction of numerical ratings. This research also used k-means to improve the quality of recommendations. In the study by [37], a smart tourism system architecture was developed that integrated tourists’ needs and scenario characteristics. The authors used enhanced heuristic search algorithms and a selective tour path recommendation algorithm for optimized path planning. Their findings showed that the system significantly reduced node visits and achieved the fastest convergence in 39 iterations compared to genetic and particle swarm algorithms. Ref. [38] investigated the tourist decision-making process via a knowledge graph. They found that excellent interpretability boosts the recommendation robustness on sparse datasets.
Ref. [10] considered the CF approach in the development of a hotel recommender system using Capsule Networks (CapsNets) to enhance the interpretability, accuracy, and robustness of the recommendations. In 2021, a new hotel recommendation system was developed by [39] that leveraged sentiment analysis of online reviews and aspect-based review categorization. The study aimed to help users make better decisions based on their needs and budget. To build the system, the authors used an ensemble model that combined BERT with three steps for sentiment classification. Then, they added an RF classifier to handle word embeddings and other text features. They also used fuzzy logic and cosine similarity to sort the reviews. The system achieved a Macro F1-score of 84% and a test accuracy of 92.36% for sentiment classification. In a study by [40], the authors proposed a recommendation model for cultural tourism attraction using an optimized weighted association rule approach in overcoming challenges in selecting rich tourism resources. The model incorporated time and seasonal weights to improve traditional recommendation methods. The improved algorithm demonstrated strong performance, with an F1 value of 0.952. The findings highlighted the model’s effectiveness in recommending tourist destinations. In a study by [41], the authors addressed the challenge of reflecting diverse customer preferences in restaurant recommendations by proposing a personalized recommendation system based on aspect-based sentiment analysis. In 2022, a hotel recommendation algorithm was proposed by [42] using the Probabilistic Linguistic Term Set (PLTS) to address the ambiguity and uncertainty in user reviews for e-commerce platforms. The algorithm analyzed online hotel reviews using Jieba and TF-IDF, translated review statements into PLTSs, and stored them in an evaluation matrix.
In a study by [43], the authors introduced a social-hybrid recommender system designed for Social Commerce. The system was primarily created for the tourism sector to deal with the problem of too many travel options. The proposed system was able to provide personalized recommendations for tourist attractions by incorporating user interests, trust, reputation, social relationships, and community dynamics. In a study by [44], the authors proposed two “single tensor” models to address the challenge of incorporating multi-criteria ratings and cultural differences into tourism recommendation systems. The models integrated users, items, multi-criteria ratings, and cultural groups to account for the interrelations and structure of these factors. The authors gathered data from the Tripadvisor platform, covering 13,000 users across 120 countries. Their proposed models showed a 21.31% improvement in Mean Absolute Error (MAE) for users and 7.11% for countries compared to other CF and multi-criteria techniques. This study emphasized that multi-criteria ratings and cultural group factors positively influenced recommendation performance.
As seen from the above discussion on the previous literature, these papers have widely attempted to develop recommendation algorithms based on CF-based approaches. A small number of papers have focused on the use of multi-criteria ratings to improve recommendation systems’ predicted accuracy in the travel and hospitality industries. In fact, there is a limited amount of research on the development of algorithms for green hotel recommendations using social data. Thus, considering this shortcoming in the literature, this study aims to fill this gap by incorporating a multi-criteria rating into the process of CF-based recommendation systems to show how this incorporation will aid in improving the predictive accuracy and recommendation quality of green hotels. In addition, this study attempts to use deep learning and text mining approaches with the aid of clustering to improve the efficiency of previous methods for green hotel recommendations. The proposed methodology involves the collection of real-world social data from platforms such as online travel reviews and social media to ensure the system is grounded in authentic user experiences. Multi-criteria ratings are aimed to be leveraged to capture diverse aspects of user preferences, such as environmental sustainability, which are critical in the context of green hotel selection. Deep learning models, particularly those specializing in Natural Language Processing (NLP), are employed to extract valuable insights from textual reviews, while clustering techniques aim to segment users based on shared preferences and behaviors. Through performing several evaluations on real-world data and comparing them with previous methods, this study demonstrates the advantages of multi-criteria ratings in the development of recommendation algorithms in tourism and hospitality. The findings seek to deliver practical insights for both scholars and professionals, emphasizing the capacity of sophisticated computational techniques to tackle sustainability issues within the tourism sector.

3. Proposed Method

In this study, a new recommendation system is proposed using machine learning approaches. The author relies on the use of prediction learning and clustering (unsupervised learning) techniques to improve the accuracy and scalability of the proposed system. The accuracy of predictions in the recommender system is an important aspect that is considered in its design. In fact, the development of recommendation algorithms has focused on maximizing accuracy in predicting user interest in green hotels. The type and availability of data are important in the design of the proposed system. Sufficient data are essential for the proposed recommender system to function effectively. This study attempts to consider both textual and numerical ratings in the design of the recommender system. In Figure 1, the proposed method is presented. The collected data are pre-processed in the first stage of the proposed method. In this stage, the null values are predicted to be clustered in the second stage of the proposed method. Then, the data are clustered using the spectral clustering algorithm. To visualize the clusters, the author employed the Principal Component Analysis (PCA) technique and applied it to the data to discover their main dimensions and principal components. As the data also include textual reviews, in the next step, the author uses LDA to discover the main dimensions of green components in each cluster. In the final stage of the offline phase, the author uses LSTM to develop the prediction model in each cluster. In the online phase, to recommend hotels to a new user, based on active ratings of the user, the user is assigned to a cluster. Then, for a given target user u and target hotel i, the author estimates the criteria ratings that u would assign to i. These estimated criteria ratings serve as input parameters for the prediction models associated with the target user and hotel. These models were pre-trained during the offline phase using LSTM. As shown in Figure 1, in the online phase, the prediction models are used when the criteria ratings are predicted for the active user. In the following sections, the machine learning techniques incorporated in the proposed recommendation method are explained.
The rationale for selecting techniques such as LDA, spectral clustering, and LSTM stems from their ability to effectively handle the collected dataset, which comprises both numerical and textual data. Specifically, LDA is well-suited for identifying hidden themes within textual reviews [45], enabling the extraction of user preferences related to sustainability and service quality. Moreover, spectral clustering is ideal for segmenting users based on multi-criteria ratings, as it can manage complex, non-linear relationships better than traditional methods like k-means. Spectral clustering is effective when the number of clusters is known, but it also provides a means to estimate the number of clusters in the data. The algorithm supports various Laplacian matrix normalizations and similarity graph methods, offering flexibility in implementation. This approach provides a powerful tool for cluster analysis across diverse datasets and applications.
In addition, LSTM networks are highly effective for analyzing sequential data, capturing temporal dependencies, and adapting to evolving user preferences. Previous studies have shown that LDA outperforms simpler models like bag-of-words in thematic analysis, while LSTM excels at processing big data, and spectral clustering is superior in identifying meaningful clusters in high-dimensional datasets. In this study, PCA was used to reduce the dimensionality of the data and help visualize the clusters generated by spectral clustering. PCA transforms the data into a lower-dimensional space while retaining as much of the original variance as possible. This enables easier visualization of complex, high-dimensional data. By integrating these techniques, the study addresses the complexities of green hotel recommendation systems, improving both predictive accuracy and personalization.

3.1. LDA

A substantial volume of the datasets poses challenges for thorough and manual analysis. Text mining approaches have been effective in the analysis of textual reviews. Text mining is the process of deriving interesting and non-trivial information from unstructured text documents. This concept is also referred to as knowledge discovery from textual databases, which nowadays can be collected from the customers’ online reviews. One of the machine learning approaches for text mining is LDA. The LDA as represented in Algorithm 1 [46] is a strong method for finding hidden themes in big text data, making it very important for fast and effective extraction of insights [47]. LDA is an unsupervised learning technique. It works well in things like topic finding, document grouping, and summarizing information because it keeps the statistical links that exist in the data. Previous studies have widely used this technique for topic modeling [48,49]. This technique is found to be useful in the analysis of users’ generated content or online reviews provided on social networking sites to discover the customers’ perspectives on the products [50,51].
At its base, LDA is a model that uses probability, and it organizes the data in three main levels, giving probabilities to different parts of the language model. To fully understand how it works, a few main terms need to be explained. A word represents the smallest unit of data, commonly referred to as a “token” or “term”, denoted by w . A document is a sequence of N words and is typically expressed as a vector d = w 1 , w 2 , , w N , where w n is the nth word in the sequence. A corpus is the entire dataset, comprising MMM documents. LDA assumes that each document is composed of multiple topics, where the proportions of topics within a document are drawn from a Dirichlet distribution characterized by a hyperparameter α. Similarly, each topic is represented by a distribution of words, sampled from another Dirichlet distribution with hyperparameter β . The generative process underlying LDA proceeds in a systematic manner to assign words to topics and topics to documents. This structured approach allows LDA to efficiently model the relationships between words, topics, and documents, making it a robust tool for analyzing unstructured text data.
Algorithm 1. LDA Procedure [46]
  1 For each topic k [ 1 , K ] :
    (a) Sample ϕ k from a Dirichlet distribution with parameter β .
  2 For each document d in a corpus D :
    (a) Sample the number of words N from a Poisson distribution with mean ξ .
    (b) Sample θ d from a Dirichlet distribution with parameter α .
    (c) For each word w i in d :
    i. Draw a topic assignment z d , i M u l t i n o m i a l θ d
    ii. Draw a word w d , i M u l t i n o m i a l ϕ z i
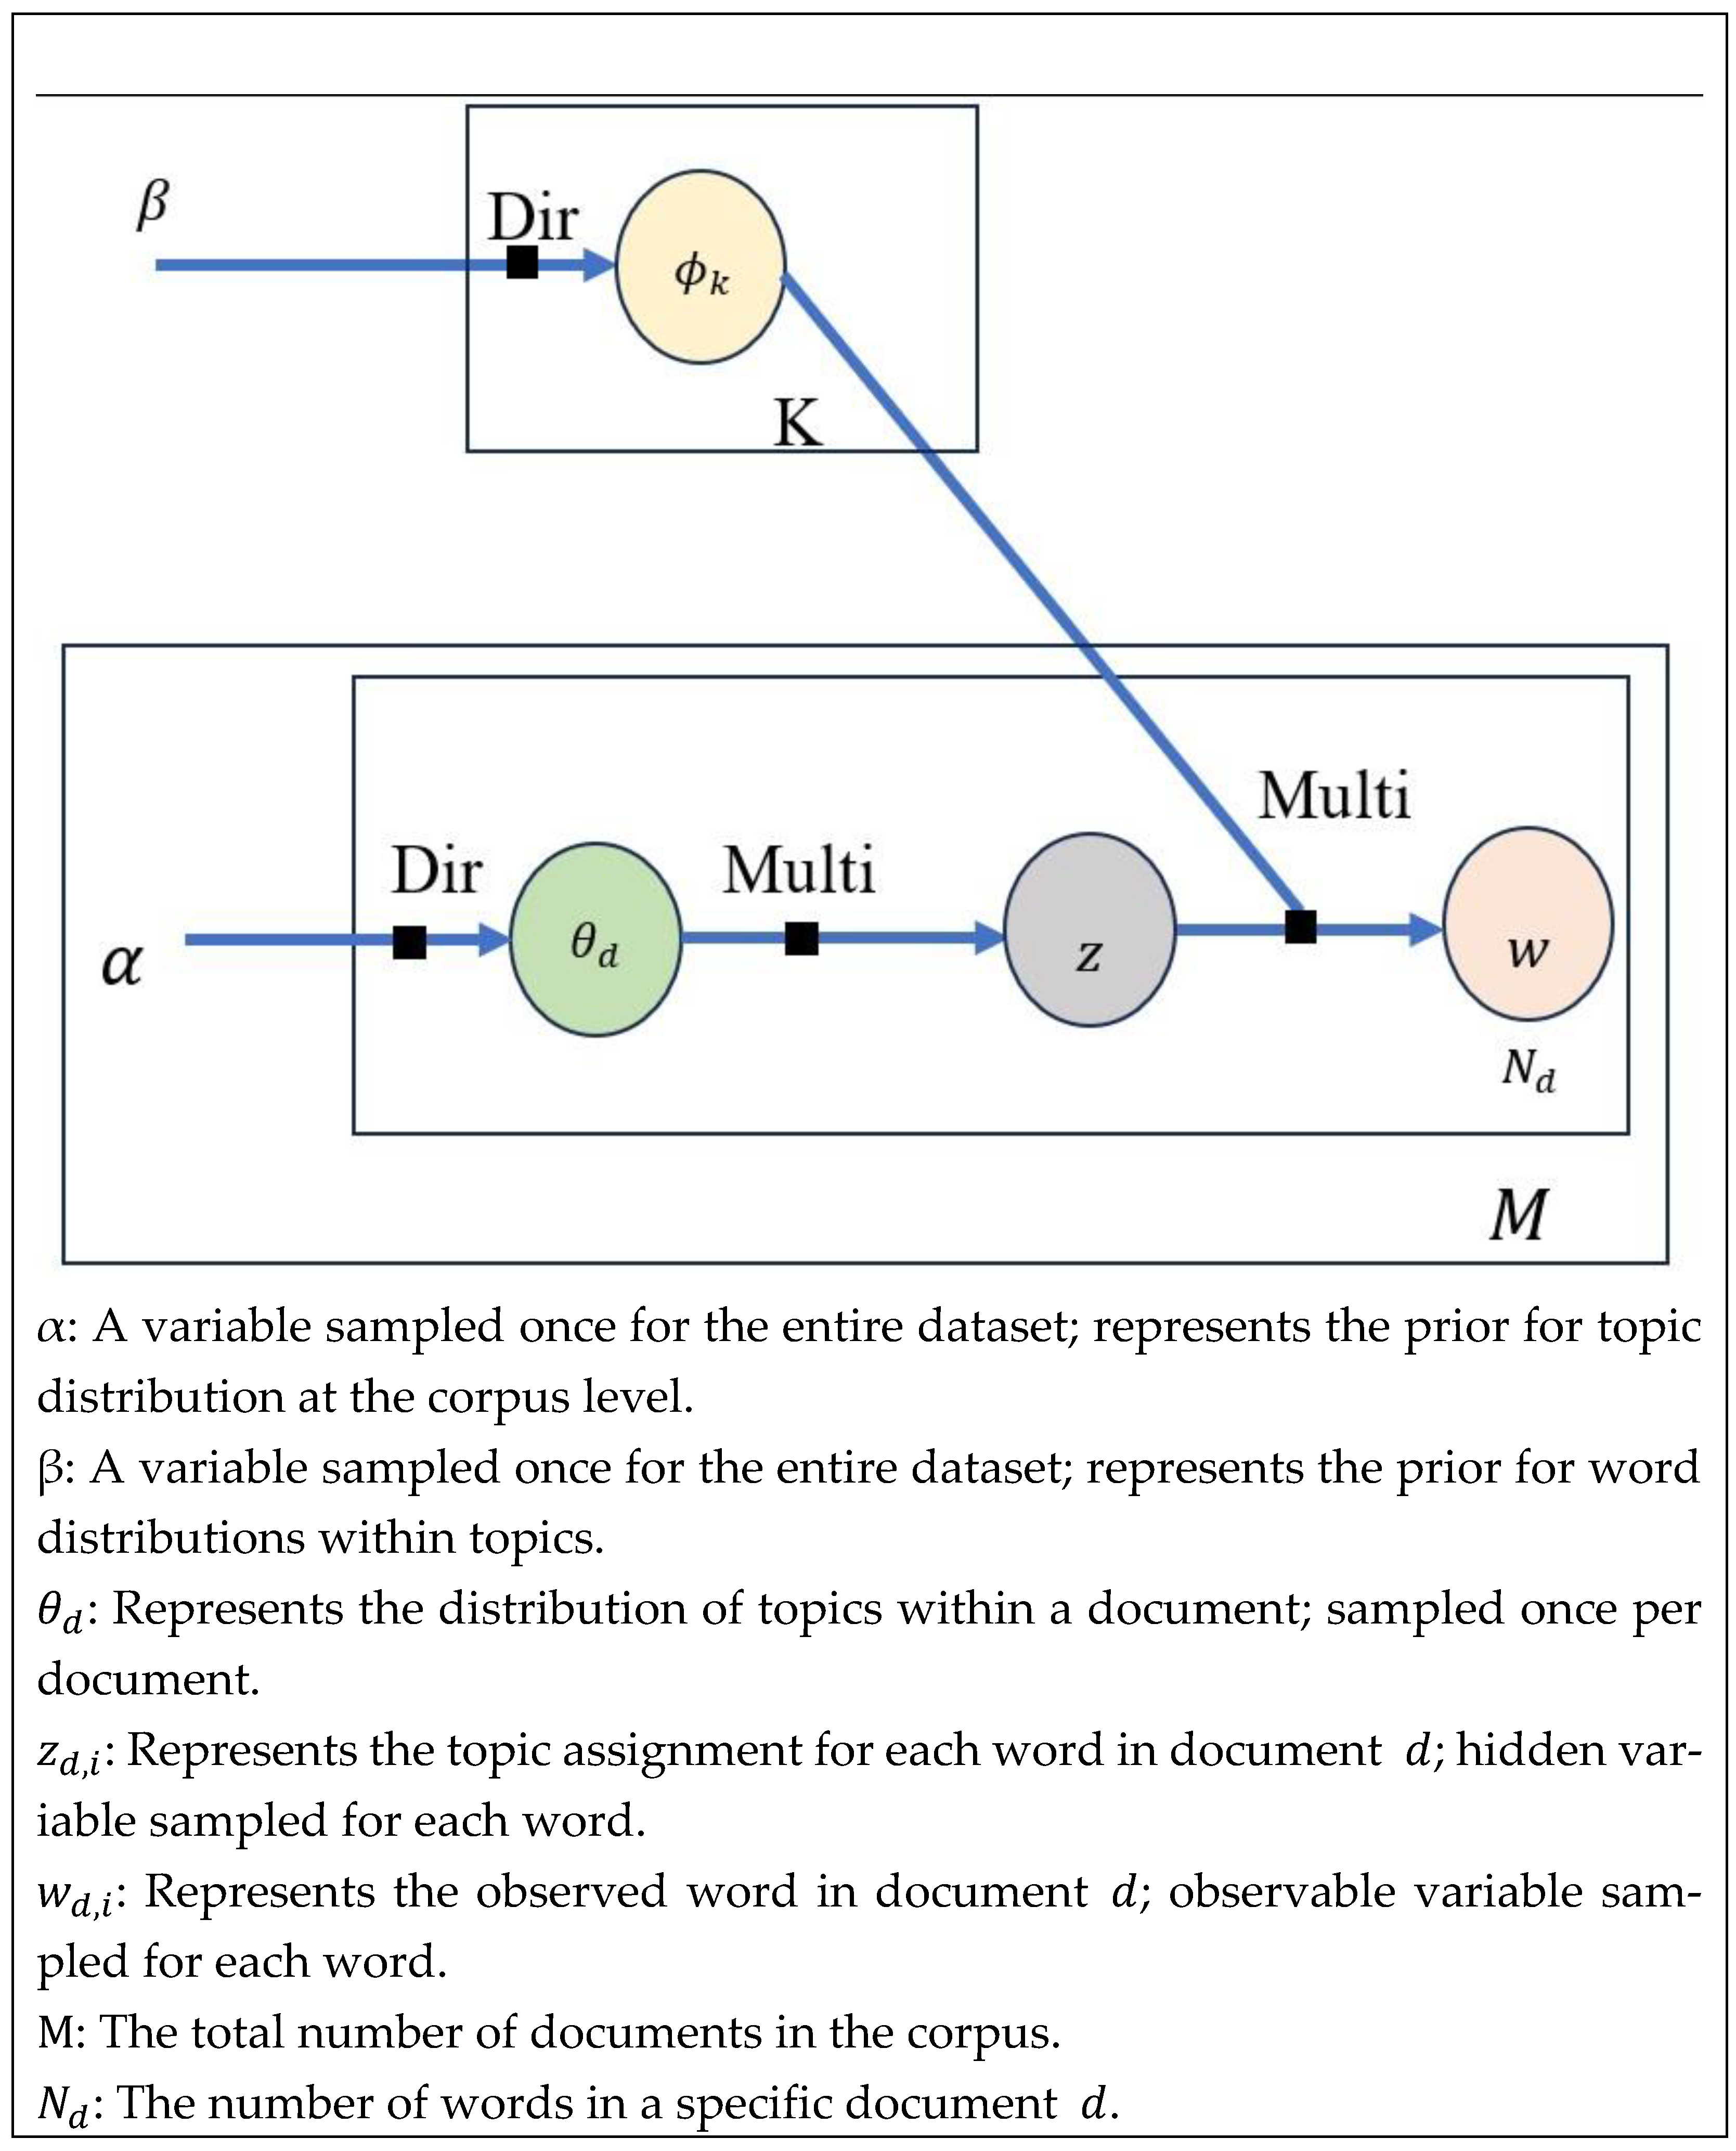
Plate models offer a visual framework for understanding the relationships between random variables in probabilistic models. The generative process, as previously explained, is depicted in Figure 2 using a plate model. In this representation, circles denote random variables: those with a white background represent hidden variables, while those with a grey background are observable. Dependencies between variables are illustrated by arrows, while the surrounding boxes, known as plates, indicate repetition of the process. The number of repetitions for each plate is displayed in the lower right corner. This figure illustrates the hierarchical structure of the model across three levels. At the corpus level, α and β are variables sampled only once for the entire dataset. At the document level, θ d represents the distribution of topics within a document, sampled M times—once for each document in the corpus. Finally, at the word level, z d , i represents the topic assignment for each word, and w d , i denotes the observed word itself. These word-level variables are sampled N d times for each document, where d is the number of words in document d .
The main challenge in topic modeling lies in calculating the posterior distribution of hidden variables based on the observed data. Specifically, in LDA, this requires solving Equation (1):
p ( θ , z w , α , β ) = p ( θ , z , w α , β ) p ( w , α , β )

3.2. LSTM

Neural networks mimic the functioning of the human brain, working as algorithms made up of connecting nodes that imitate the role of neurons [52]. Their DNNs (Deep Neural Networks) are simply NNs when they have more than one hidden layer. A DNN contains one or more hidden layers, as a hidden layer is located between the input and output layers and many of those hidden layers are present. Deep Learning [53], which forms a part of AI, provides a means of machine based on AI. They are notably versatile, as they have several applications including feature extraction from text, image, and sound datasets. Also, these networks perform classification and regression tasks effectively.
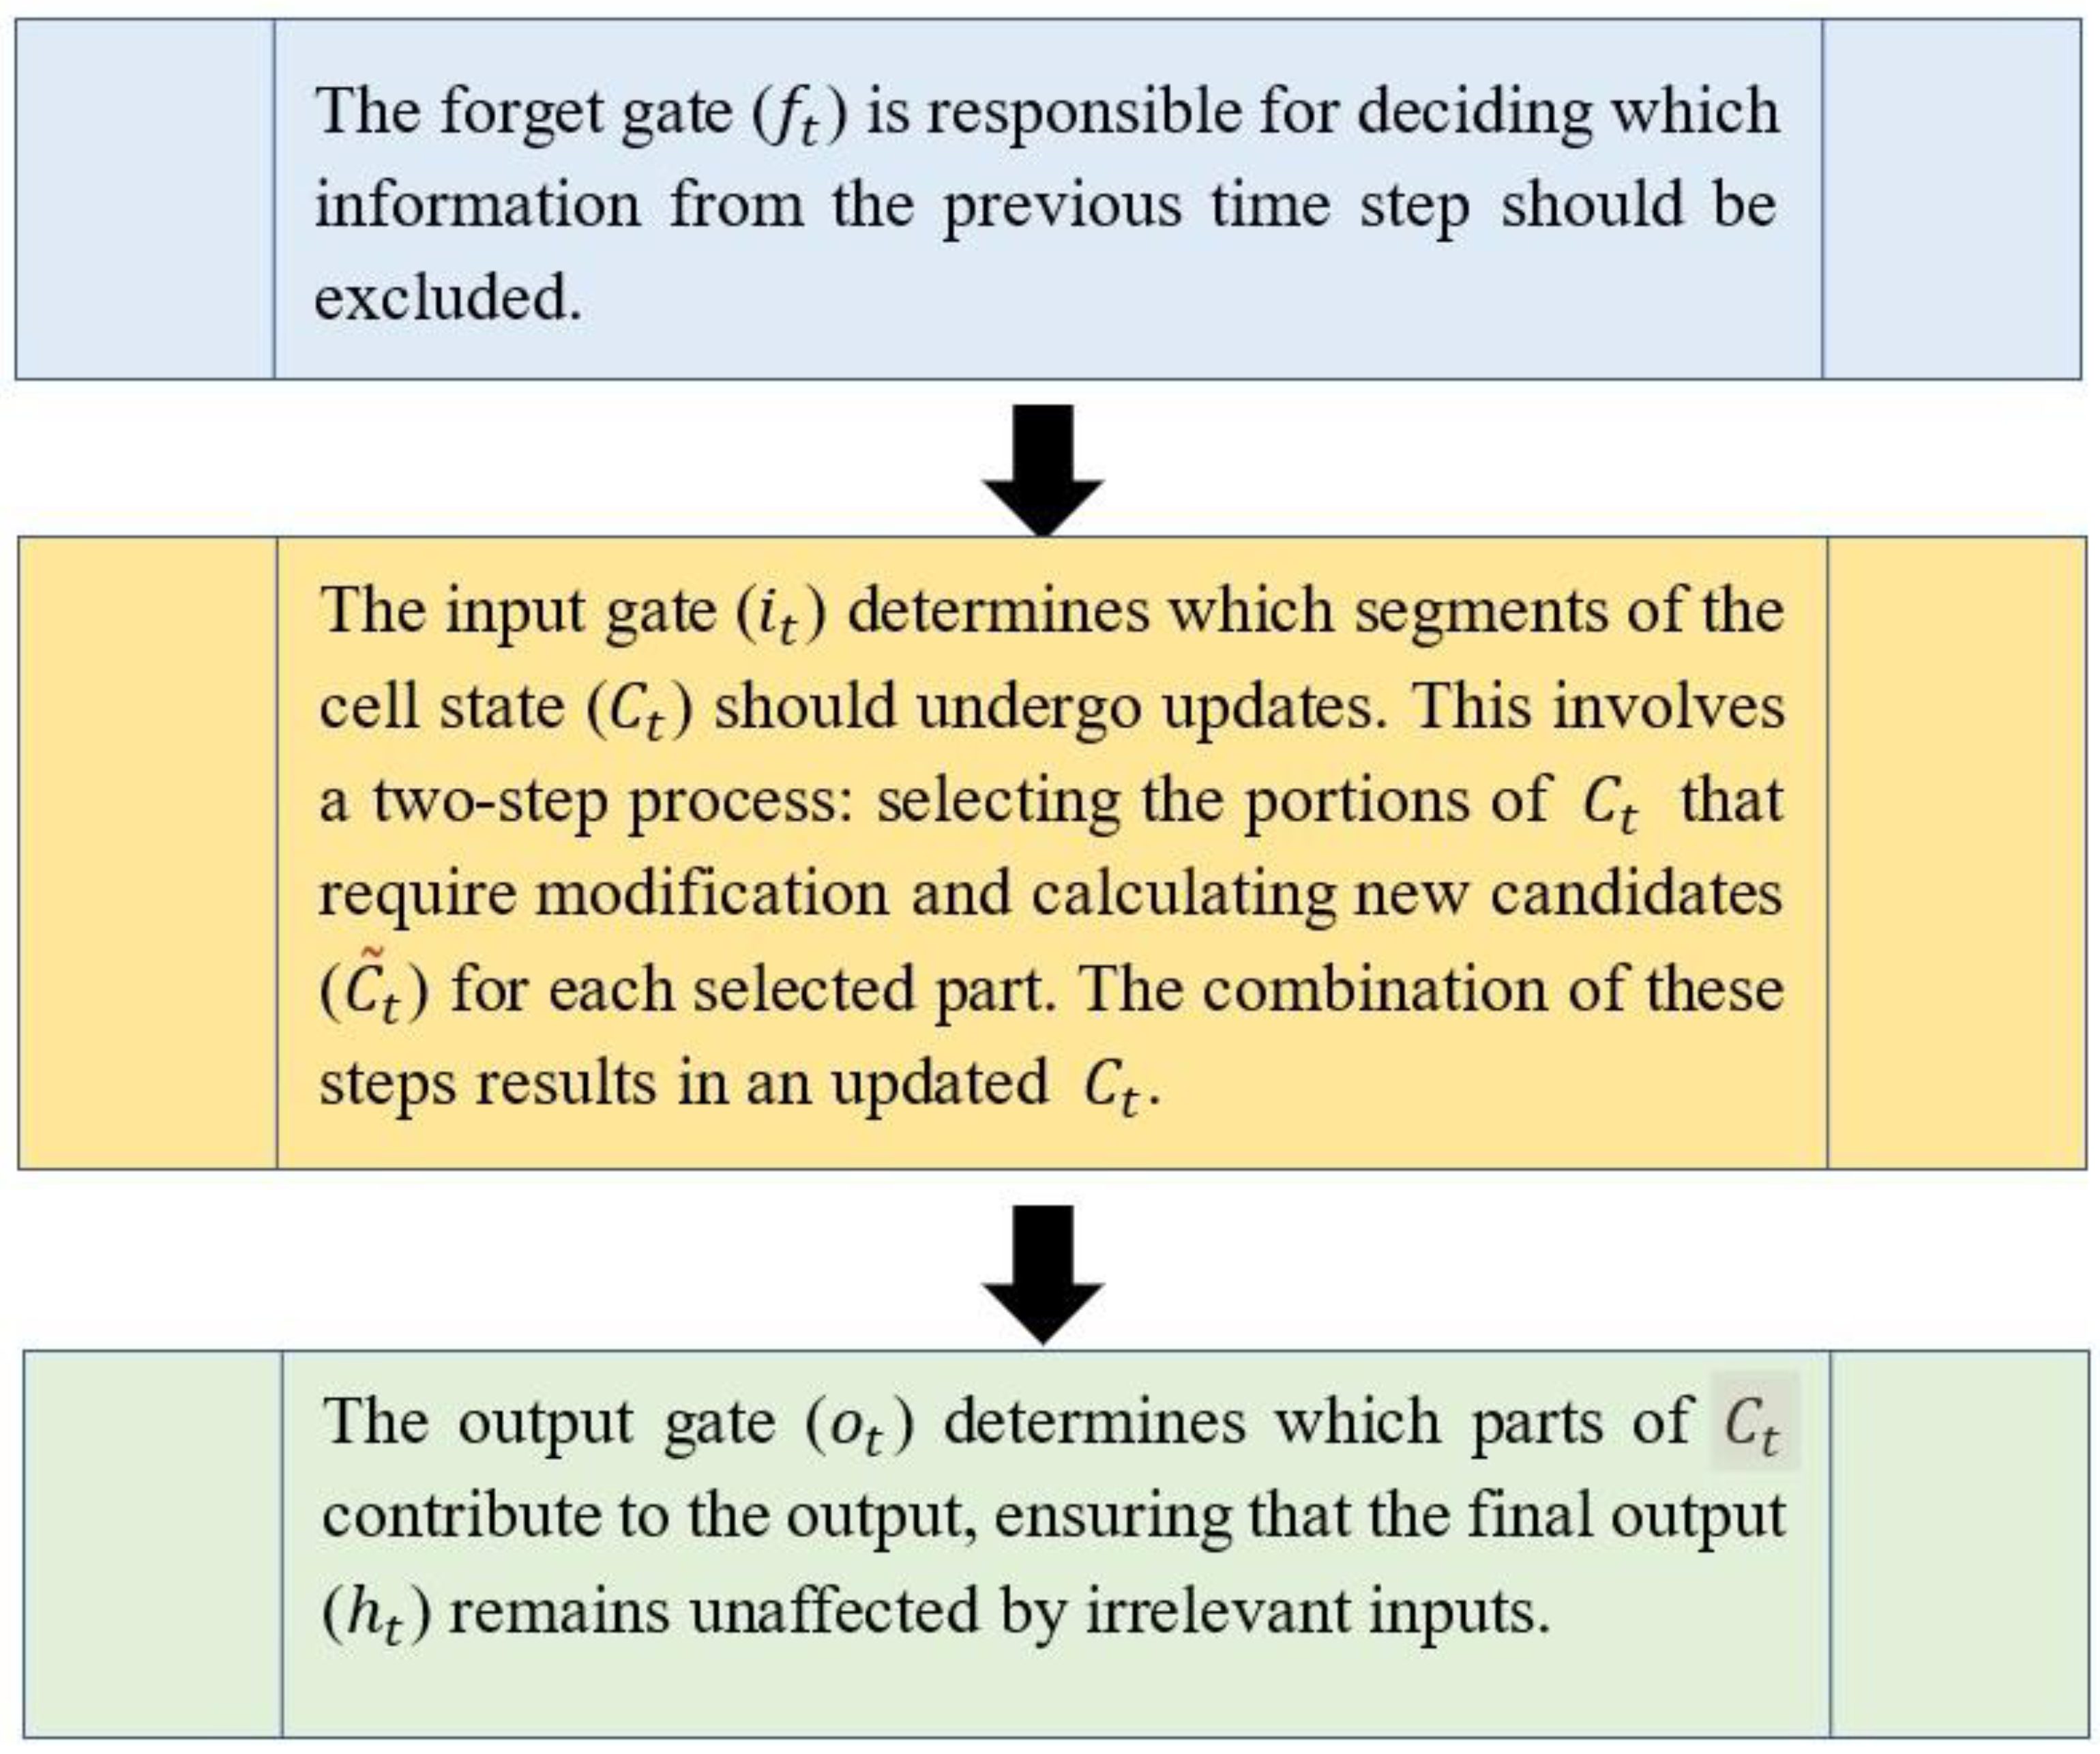
LSTM networks, an advanced form of RNNs (Recurrent Neural Networks), were introduced by Hochreiter and Schmidthuber in 1997 [54]. Unlike simple RNNs, LSTMs are designed to address the vanishing/exploding gradient problem and effectively model both long and short-term dependencies in sequential data. Their distinctive architecture involves the use of multiple layers for the computation of the hidden state, incorporating a cell state ( C t ) that is modified during the process. This unique structure gives rise to the term “memory cell” for an LSTM unit. As shown in Figure 3, three essential gates—the input gate, output gate, and forget gate—manage the flow of information to and from the cell state, enhancing the network’s ability to capture intricate dependencies within sequential data.
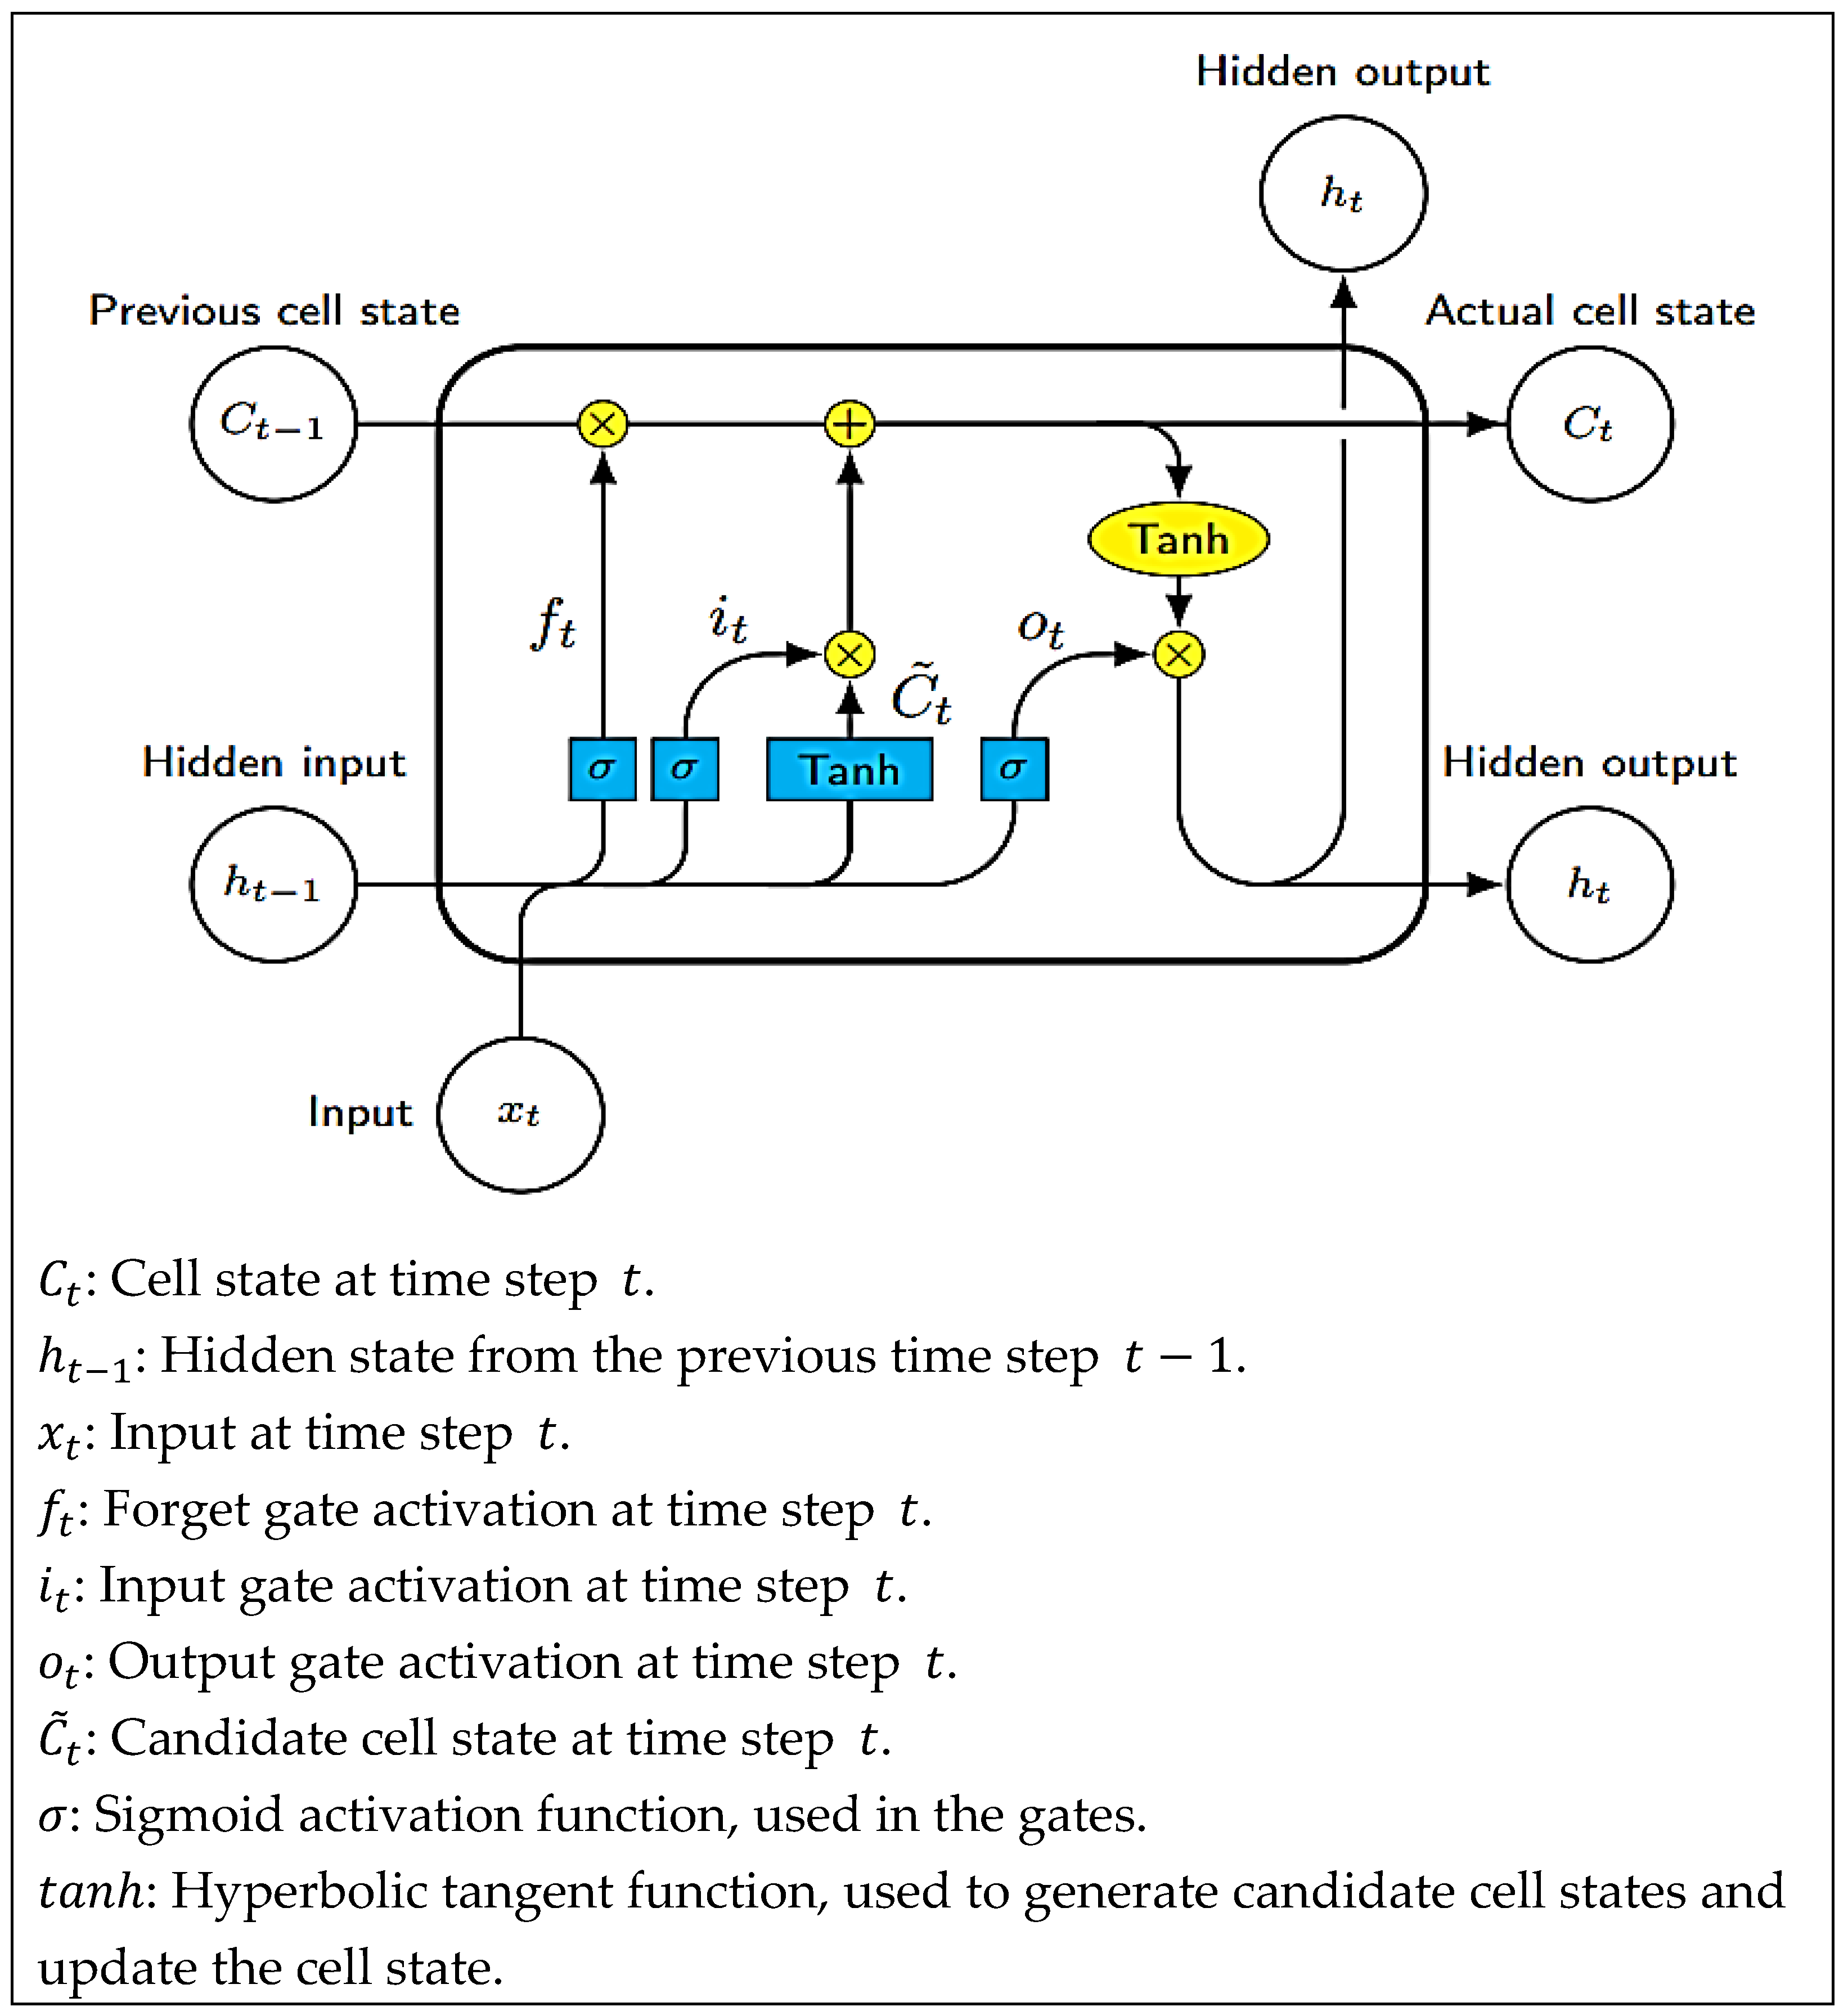
In Figure 4 [55], depicting an LSTM unit, blue rectangles represent layer operations, while yellow circles/ellipses indicate pointwise operations for combining outputs from multiple layers with the cell state. The symbols × and + represent multiplication and addition, respectively. The process involves concatenating the hidden input ( h t 1 ) and input ( x t ) at each time step. Different layers activate these concatenated inputs. The gates ( f t , i t , o t ) are typically activated by a sigmoid function ( σ ), and a hyperbolic tangent function is employed to generate new candidates ( C ~ t ) and update the cell state ( C t ). LSTMs effectively address the vanishing/exploding gradient problem by incorporating gates. These gates enable the gradients to persist unchanged and flow through the memory, ensuring stability and preventing issues associated with vanishing or exploding gradients, as long as the gates remain shut.

3.3. Partition Data Using Spectral Clustering

Clustering stands as a cornerstone in exploratory data analysis [56], widely employed across diverse domains such as computer science, healthcare, statistics, transportation, biology, and social sciences. In virtually every scientific discipline dealing with empirical data, practitioners seek a preliminary understanding by identifying groups demonstrating “similar behavior” within their datasets. Diverging from “traditional algorithms” like single linkage or k-means, spectral clustering offers several fundamental advantages. Notably, results achieved through spectral clustering often surpass those obtained through traditional methods. Additionally, implementing spectral clustering is quite simple, and its solutions are efficiently obtained using standard methods from linear algebra. This combination of versatility and computational efficiency makes spectral clustering a highly attractive and robust tool for data analysis in many scientific domains.
Spectral clustering is considered a graph-based algorithm [57] that aims to identify k arbitrarily shaped clusters within data. Graph clustering is grouping related objects into distinct groups on the same graph. The way that graph-based clustering methods utilize graphs for data segmentation varies. Data points are viewed as graph nodes in spectral clustering. By converting the data into a lower-dimensional space, spectral clustering makes clusters easier to see. This lower-dimensional representation is derived from the eigenvectors associated with the k smallest eigenvalues of a Laplacian matrix, which encodes the similarity graph of local neighborhood relationships between data points. In Algorithm 2, the steps for clustering data using spectral clustering are presented.
Algorithm 2. Clustering Data Using Spectral Clustering
  • Define local neighborhoods for each data point using radius search or nearest neighbor methods.
  • Calculate pairwise distances within the neighborhoods and transform them into similarity measures using a kernel transformation.
  • Determine the Laplacian matrix (unnormalized, normalized random-walk, or normalized symmetric) based on specified preferences.
  • Create a matrix containing eigenvectors corresponding to the k smallest eigenvalues of the Laplacian matrix.
  • Cluster the points using k-means or k-medoids clustering.
  • Assign the original data points to the same clusters as their corresponding rows in the eigenvector matrix.

4. Method Evaluation

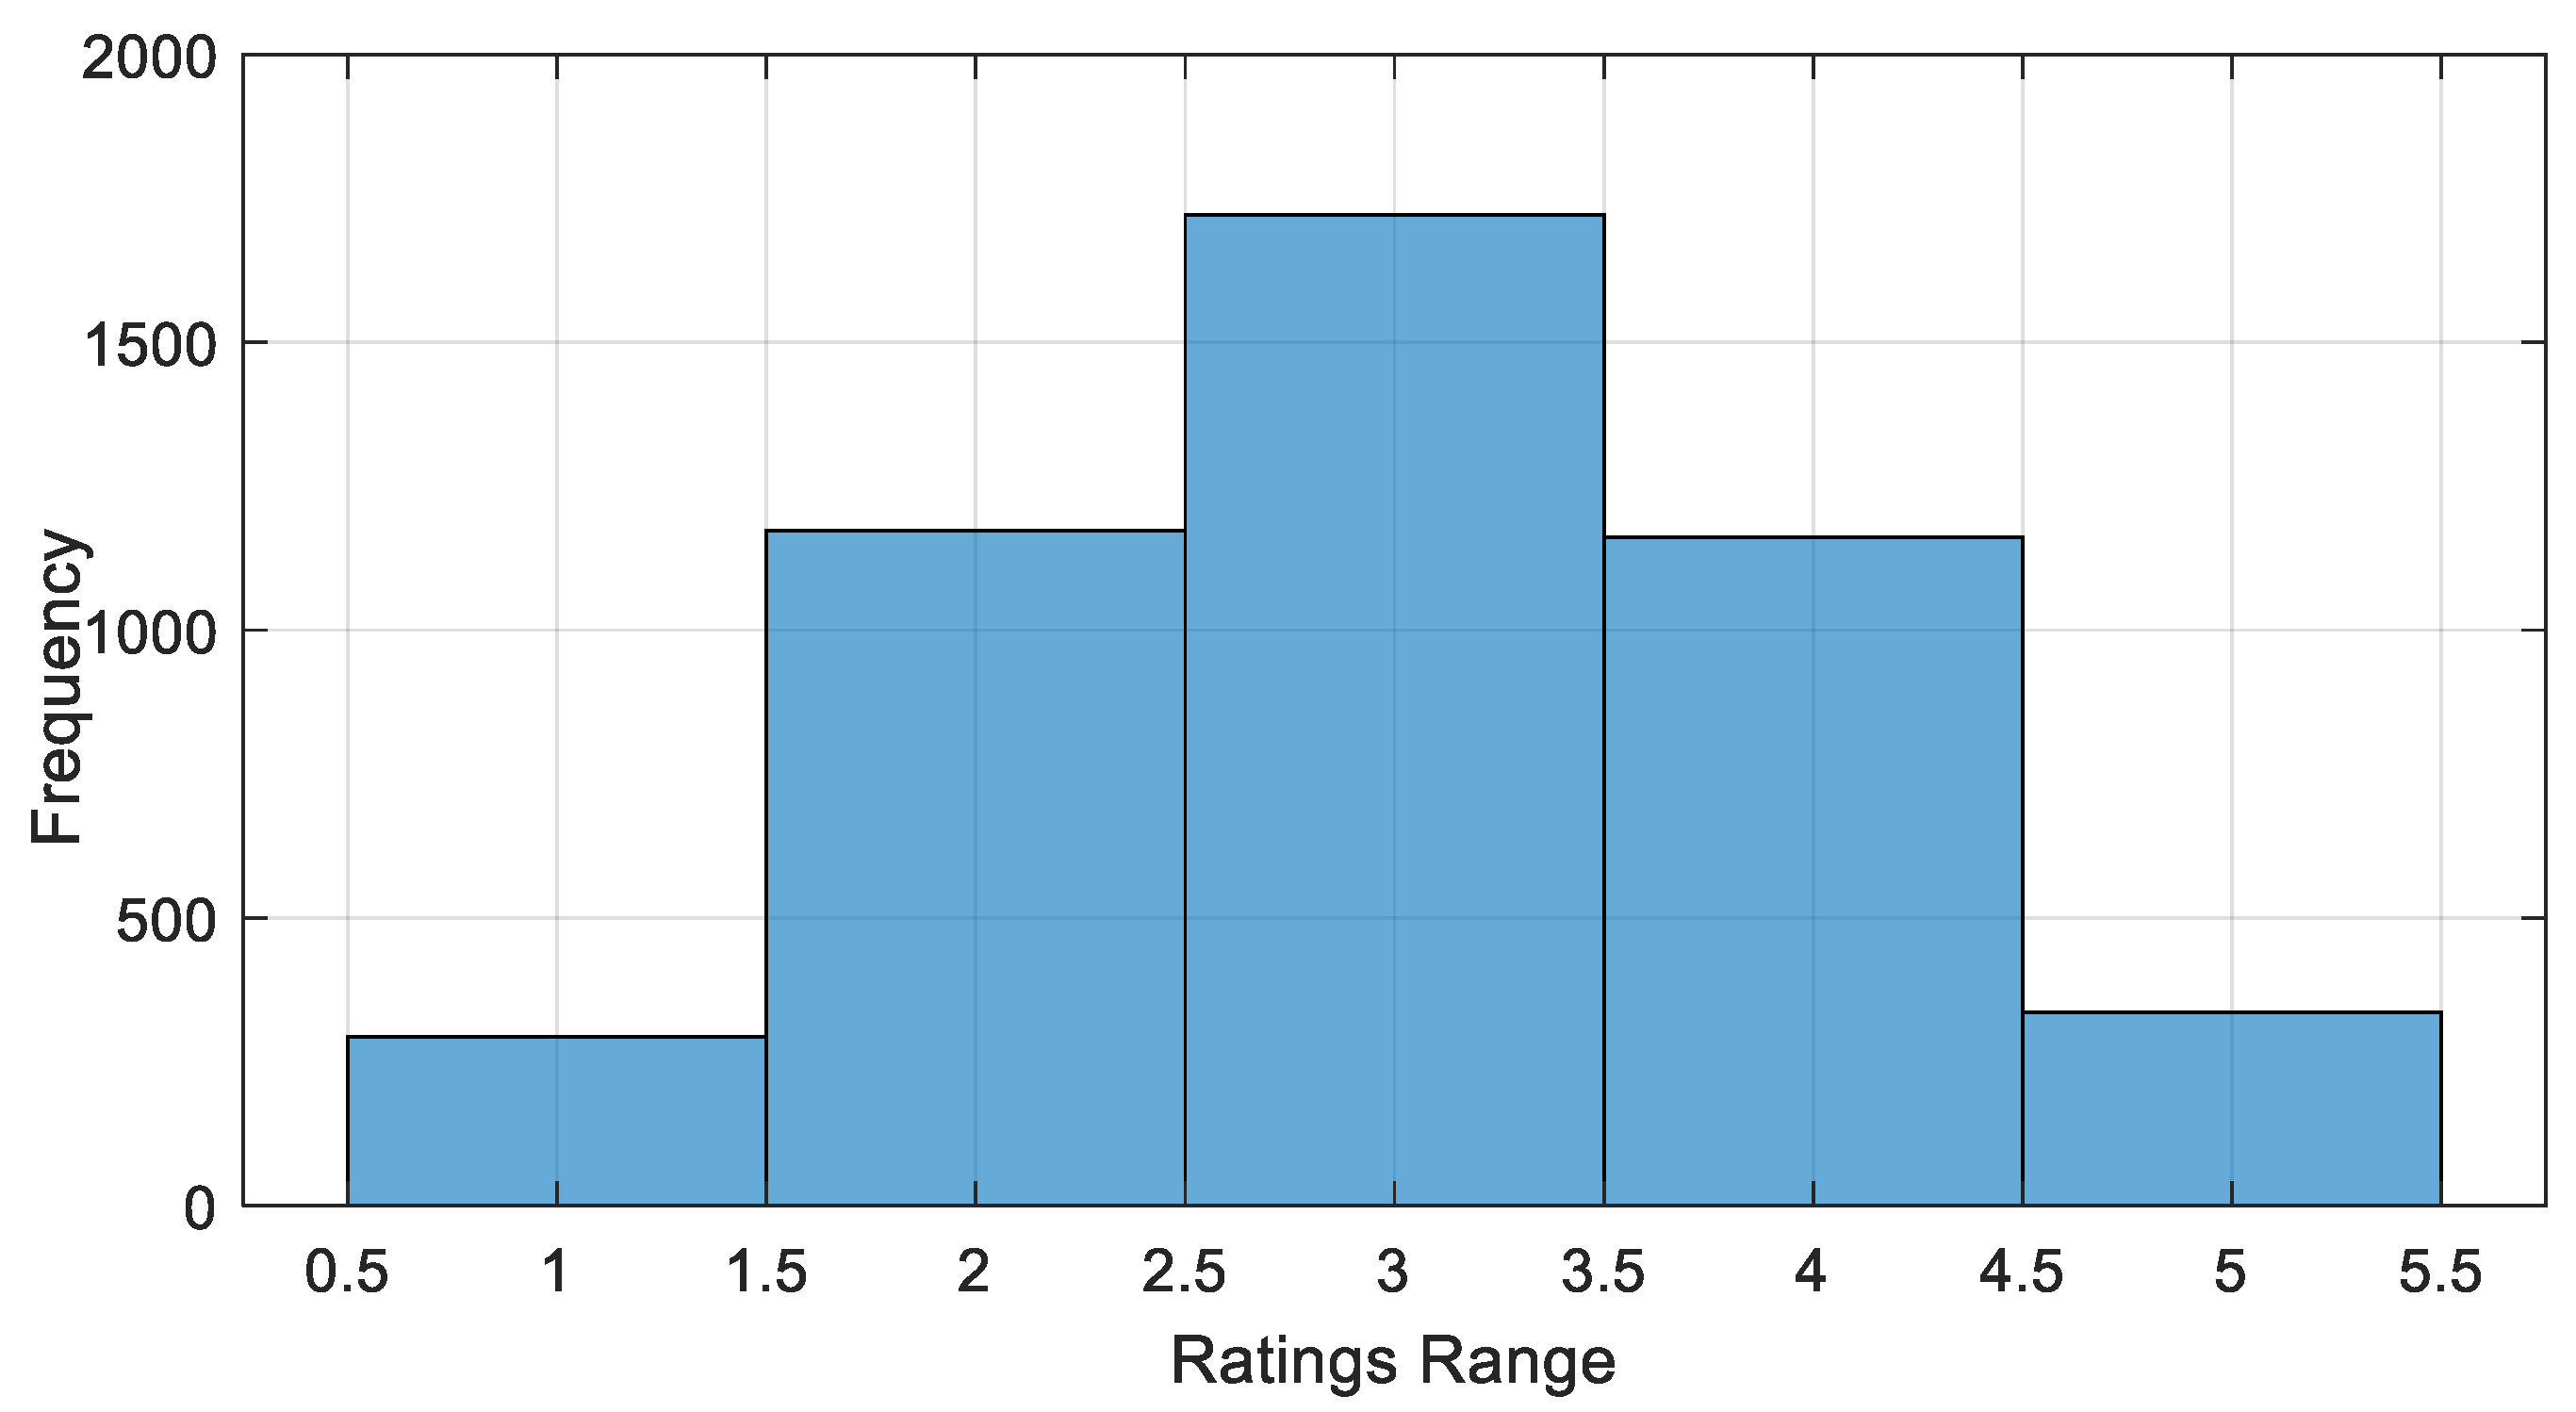
The proposed methodology was rigorously tested on a real-world dataset, collected from the TripAdvisor platform (see Figure A1 in Appendix A). This dataset offers valuable insights into the users’ preferences for green hotels in Saudi Arabia. In total, 5423 data were collected from 64 green hotels. After data cleaning, 4684 reviews were used in the data analysis phases. There were 6 criteria in the dataset: Location, Rooms, Value, Cleanliness, Service, and Sleep Quality. These criteria were rated by the travelers in the ranges of 1 to 5. All records included an overall rating, in the range of 1–5, which was considered the satisfaction level. There were many missing values in the criteria ratings, which were imputed by the mean values in each criterion. This could help run the clustering and prediction learning techniques in the next steps of data analysis. In Figure 5, the overall ratings range and frequency are provided. In addition to the numerical ratings, the dataset also included textual data for each traveler. These reviews were analyzed with the LDA technique to discover the travelers’ preferences in green hotels.
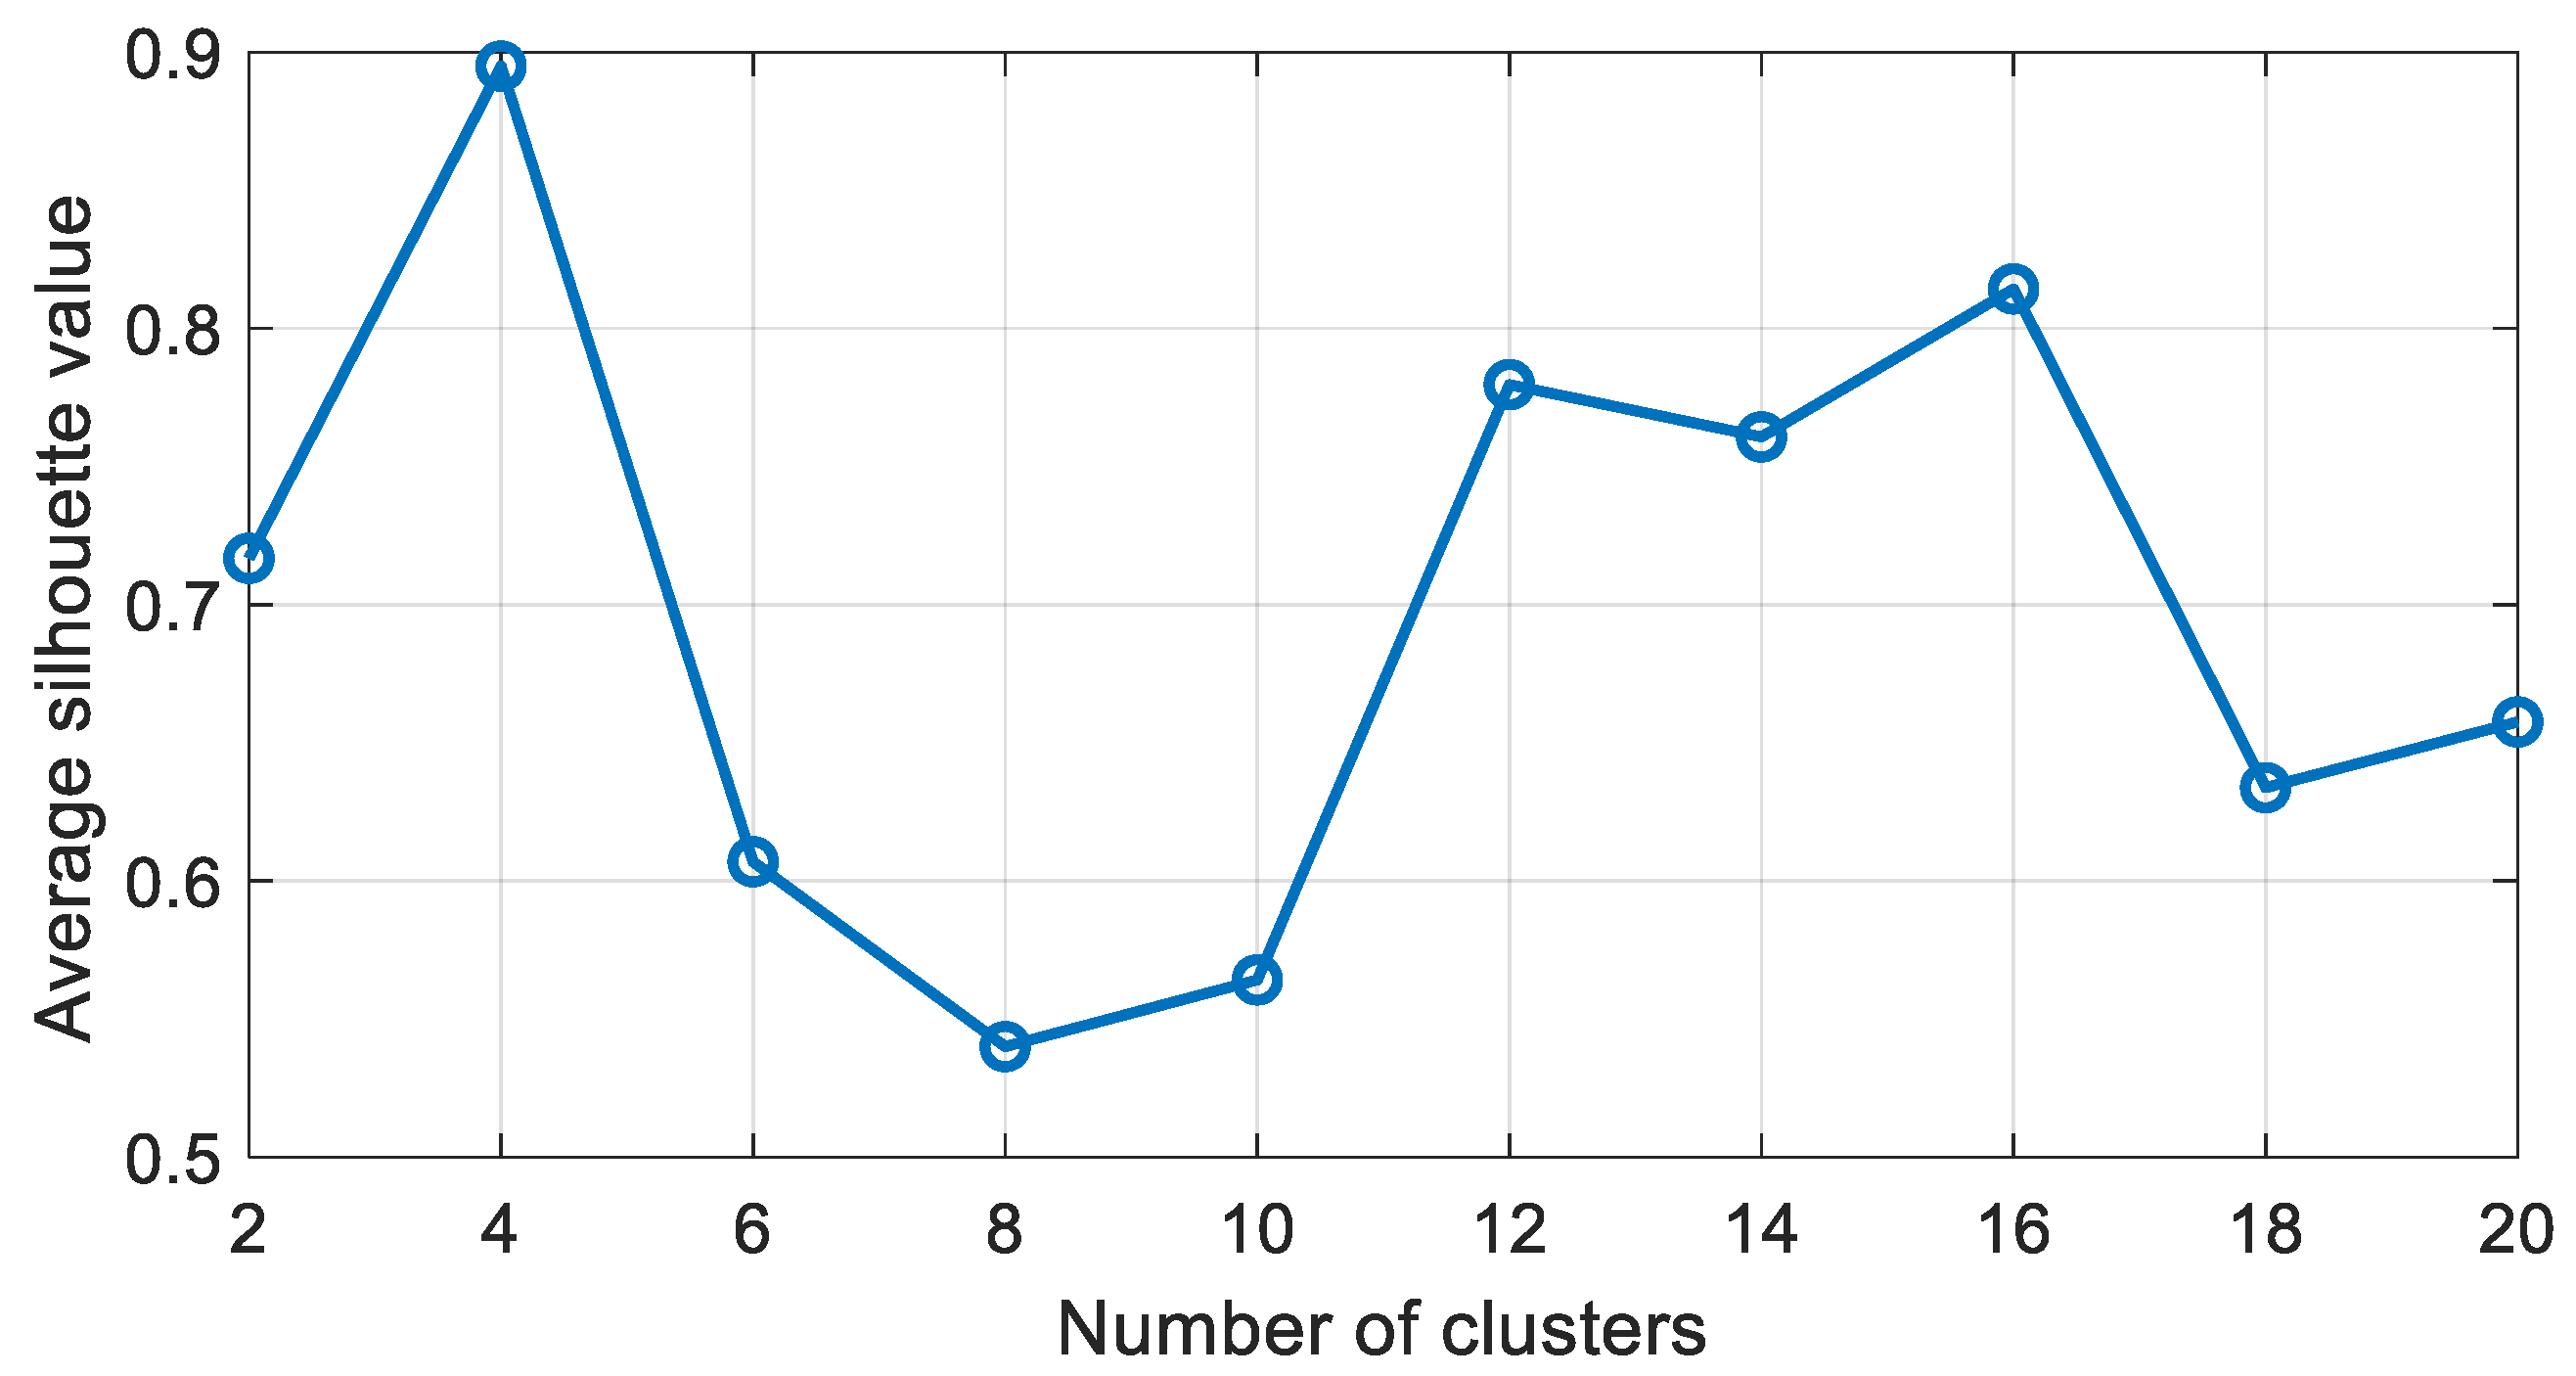
The author conducted multiple experiments on the data using MATLAB 2023b and IBM SPSS Statistics V21.0 software on a system equipped with an Intel Core i7 7500U CPU @ 2.7 GHz, running Windows 10 (64-bit). In the initial phase of the data analysis, the author applied spectral clustering to partition the data into four segments. To identify the optimal number of clusters ( K ) for the most effective clustering outcome, the author utilized the Silhouette Coefficient (SC) method [58,59]. This method assesses the overall quality of the clustering by measuring the coherence of the partitioning. Given n data points x 1 , x n , and a partitioning into K clusters C 1 , C K , along with a defined distance metric d , the silhouette score for each point x i in cluster C l is calculated through Equation (2):
a x i = 1 C l 1 x j C l , i j d x i , x j .
In this context, a x i denotes the average dissimilarity of a point x i to all other points within its assigned cluster. For each point x i belonging to cluster C l , the following definition in Equation (3) is applied:
b x i = m i n p { 1 , K } , p l   1 C p x j C p d x i , x j .
Here, b x i represents the lowest average dissimilarity between x i and all points within a cluster C p that does not include x i . In simpler terms, b x i measures the average dissimilarity to the nearest cluster to which x i does not belong. The SC value for each point x i in cluster C l is then defined by Equations (4) and (5):
s x i = b x i a x i m a x b x i , a x i   if   C l > 1 0   if   C l = 1
or
s x i = 1 a x i b x i   if   a x i < b x i 0   if   a x i = b x i b x i a x i 1   if   a x i > b x i
The SC value, s x i , ranges from [ 1 , 1 ] . A value close to 1 denotes that a x i , the within-cluster mean dissimilarity, is much smaller than b x i , the smallest mean dissimilarity to points in other clusters. This suggests that clustering effectively groups similar points. Conversely, a value near 0 implies that a x i is significantly larger than b x i , indicating poor clustering performance as within-cluster dissimilarity exceeds the closest between-cluster dissimilarity. The overall clustering performance is evaluated by averaging the SC values across all points, as shown in Equation (6).
s = 1 n i = 1 n   s x i
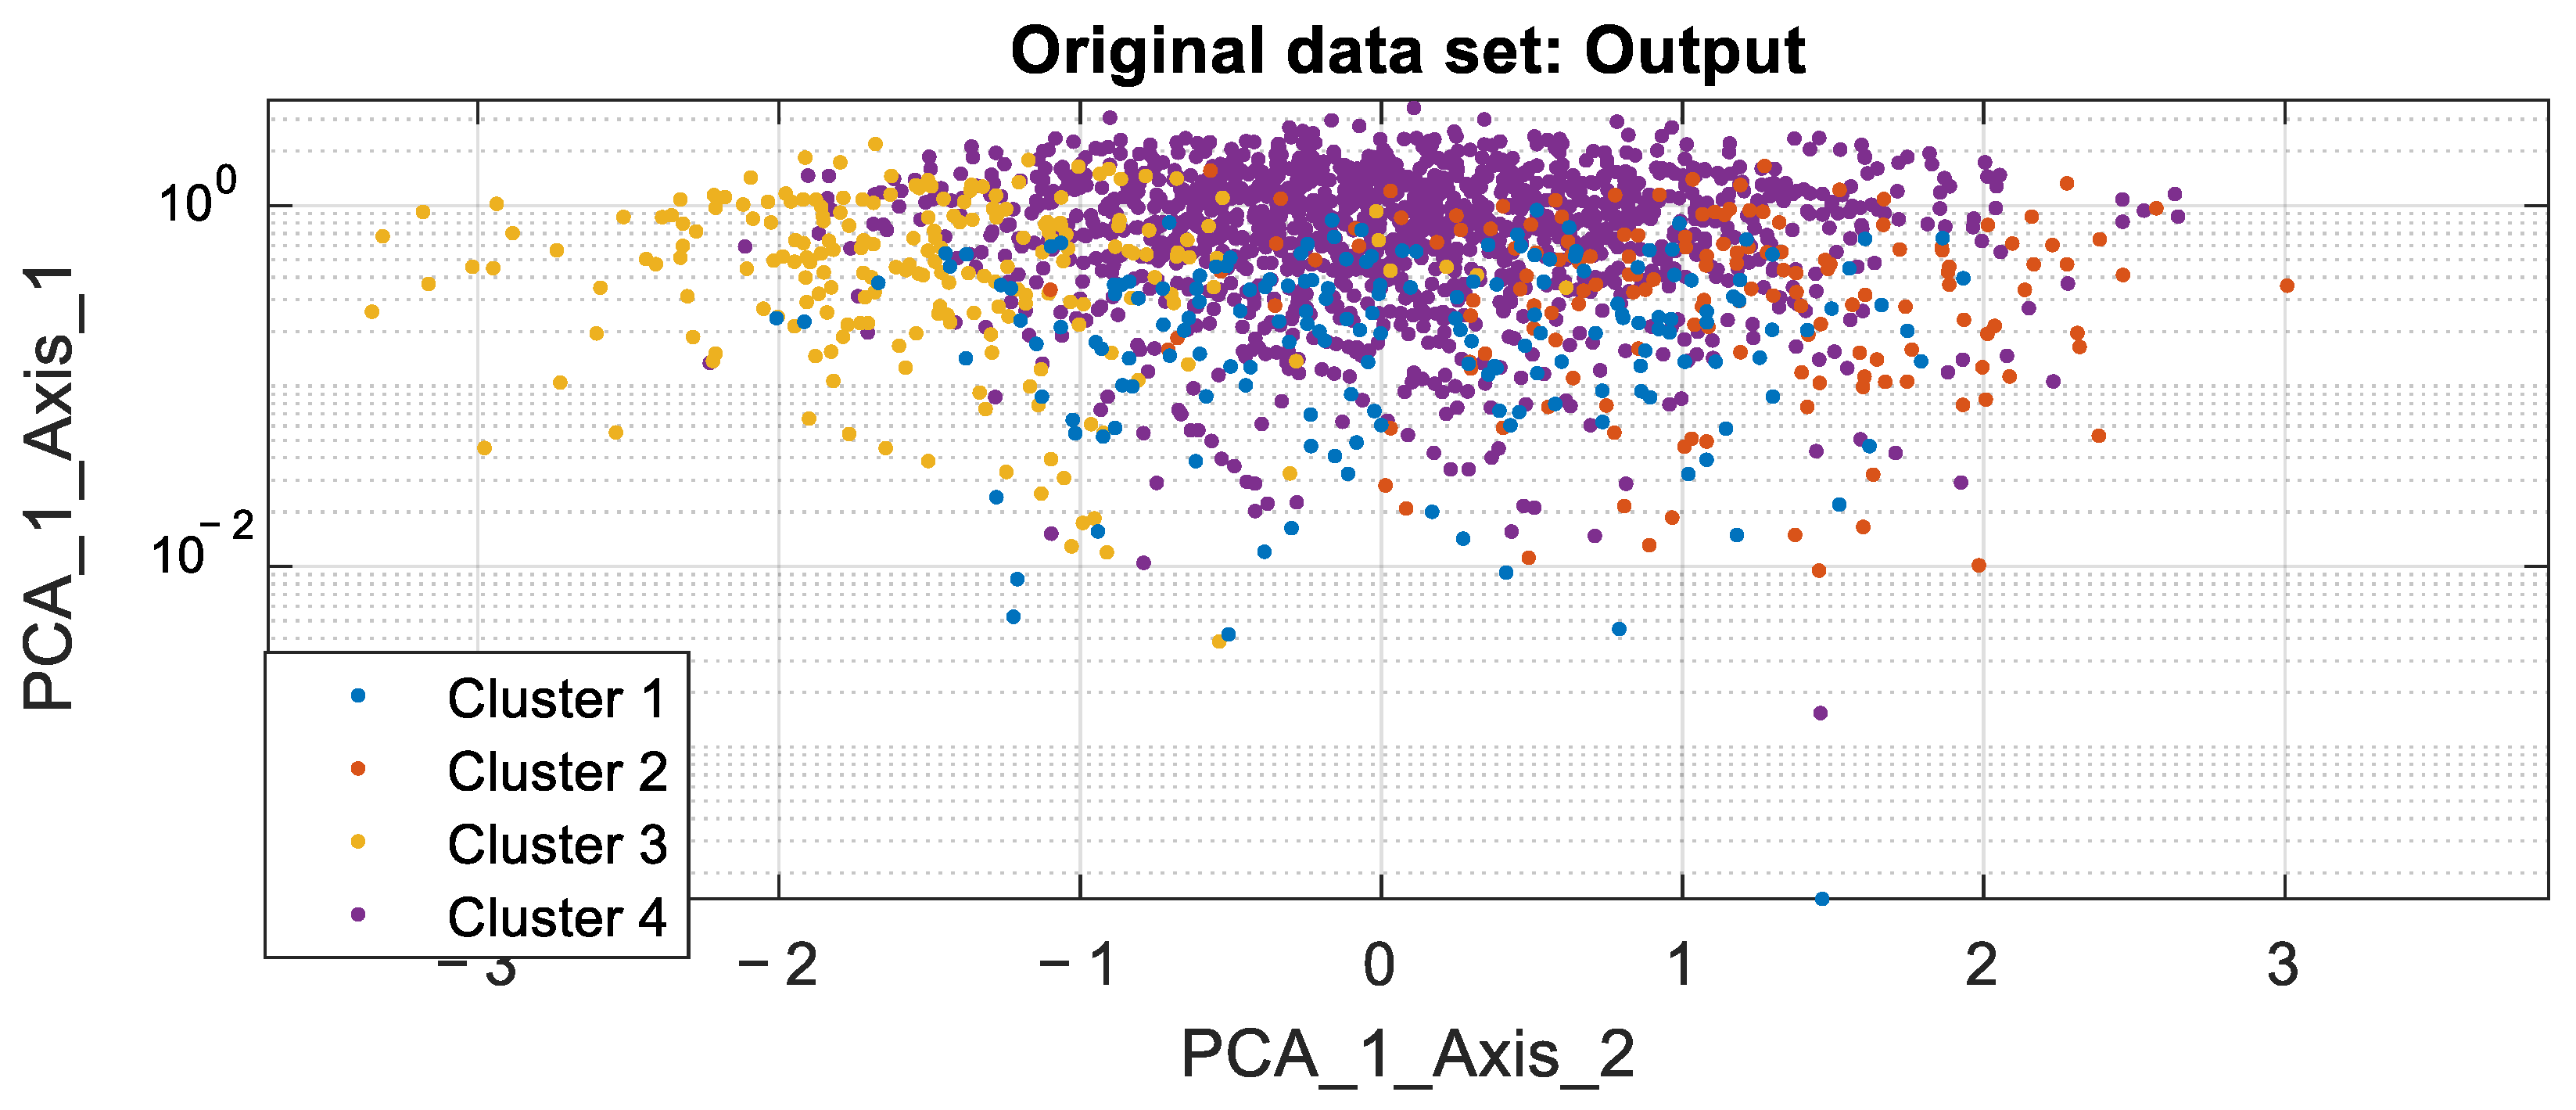
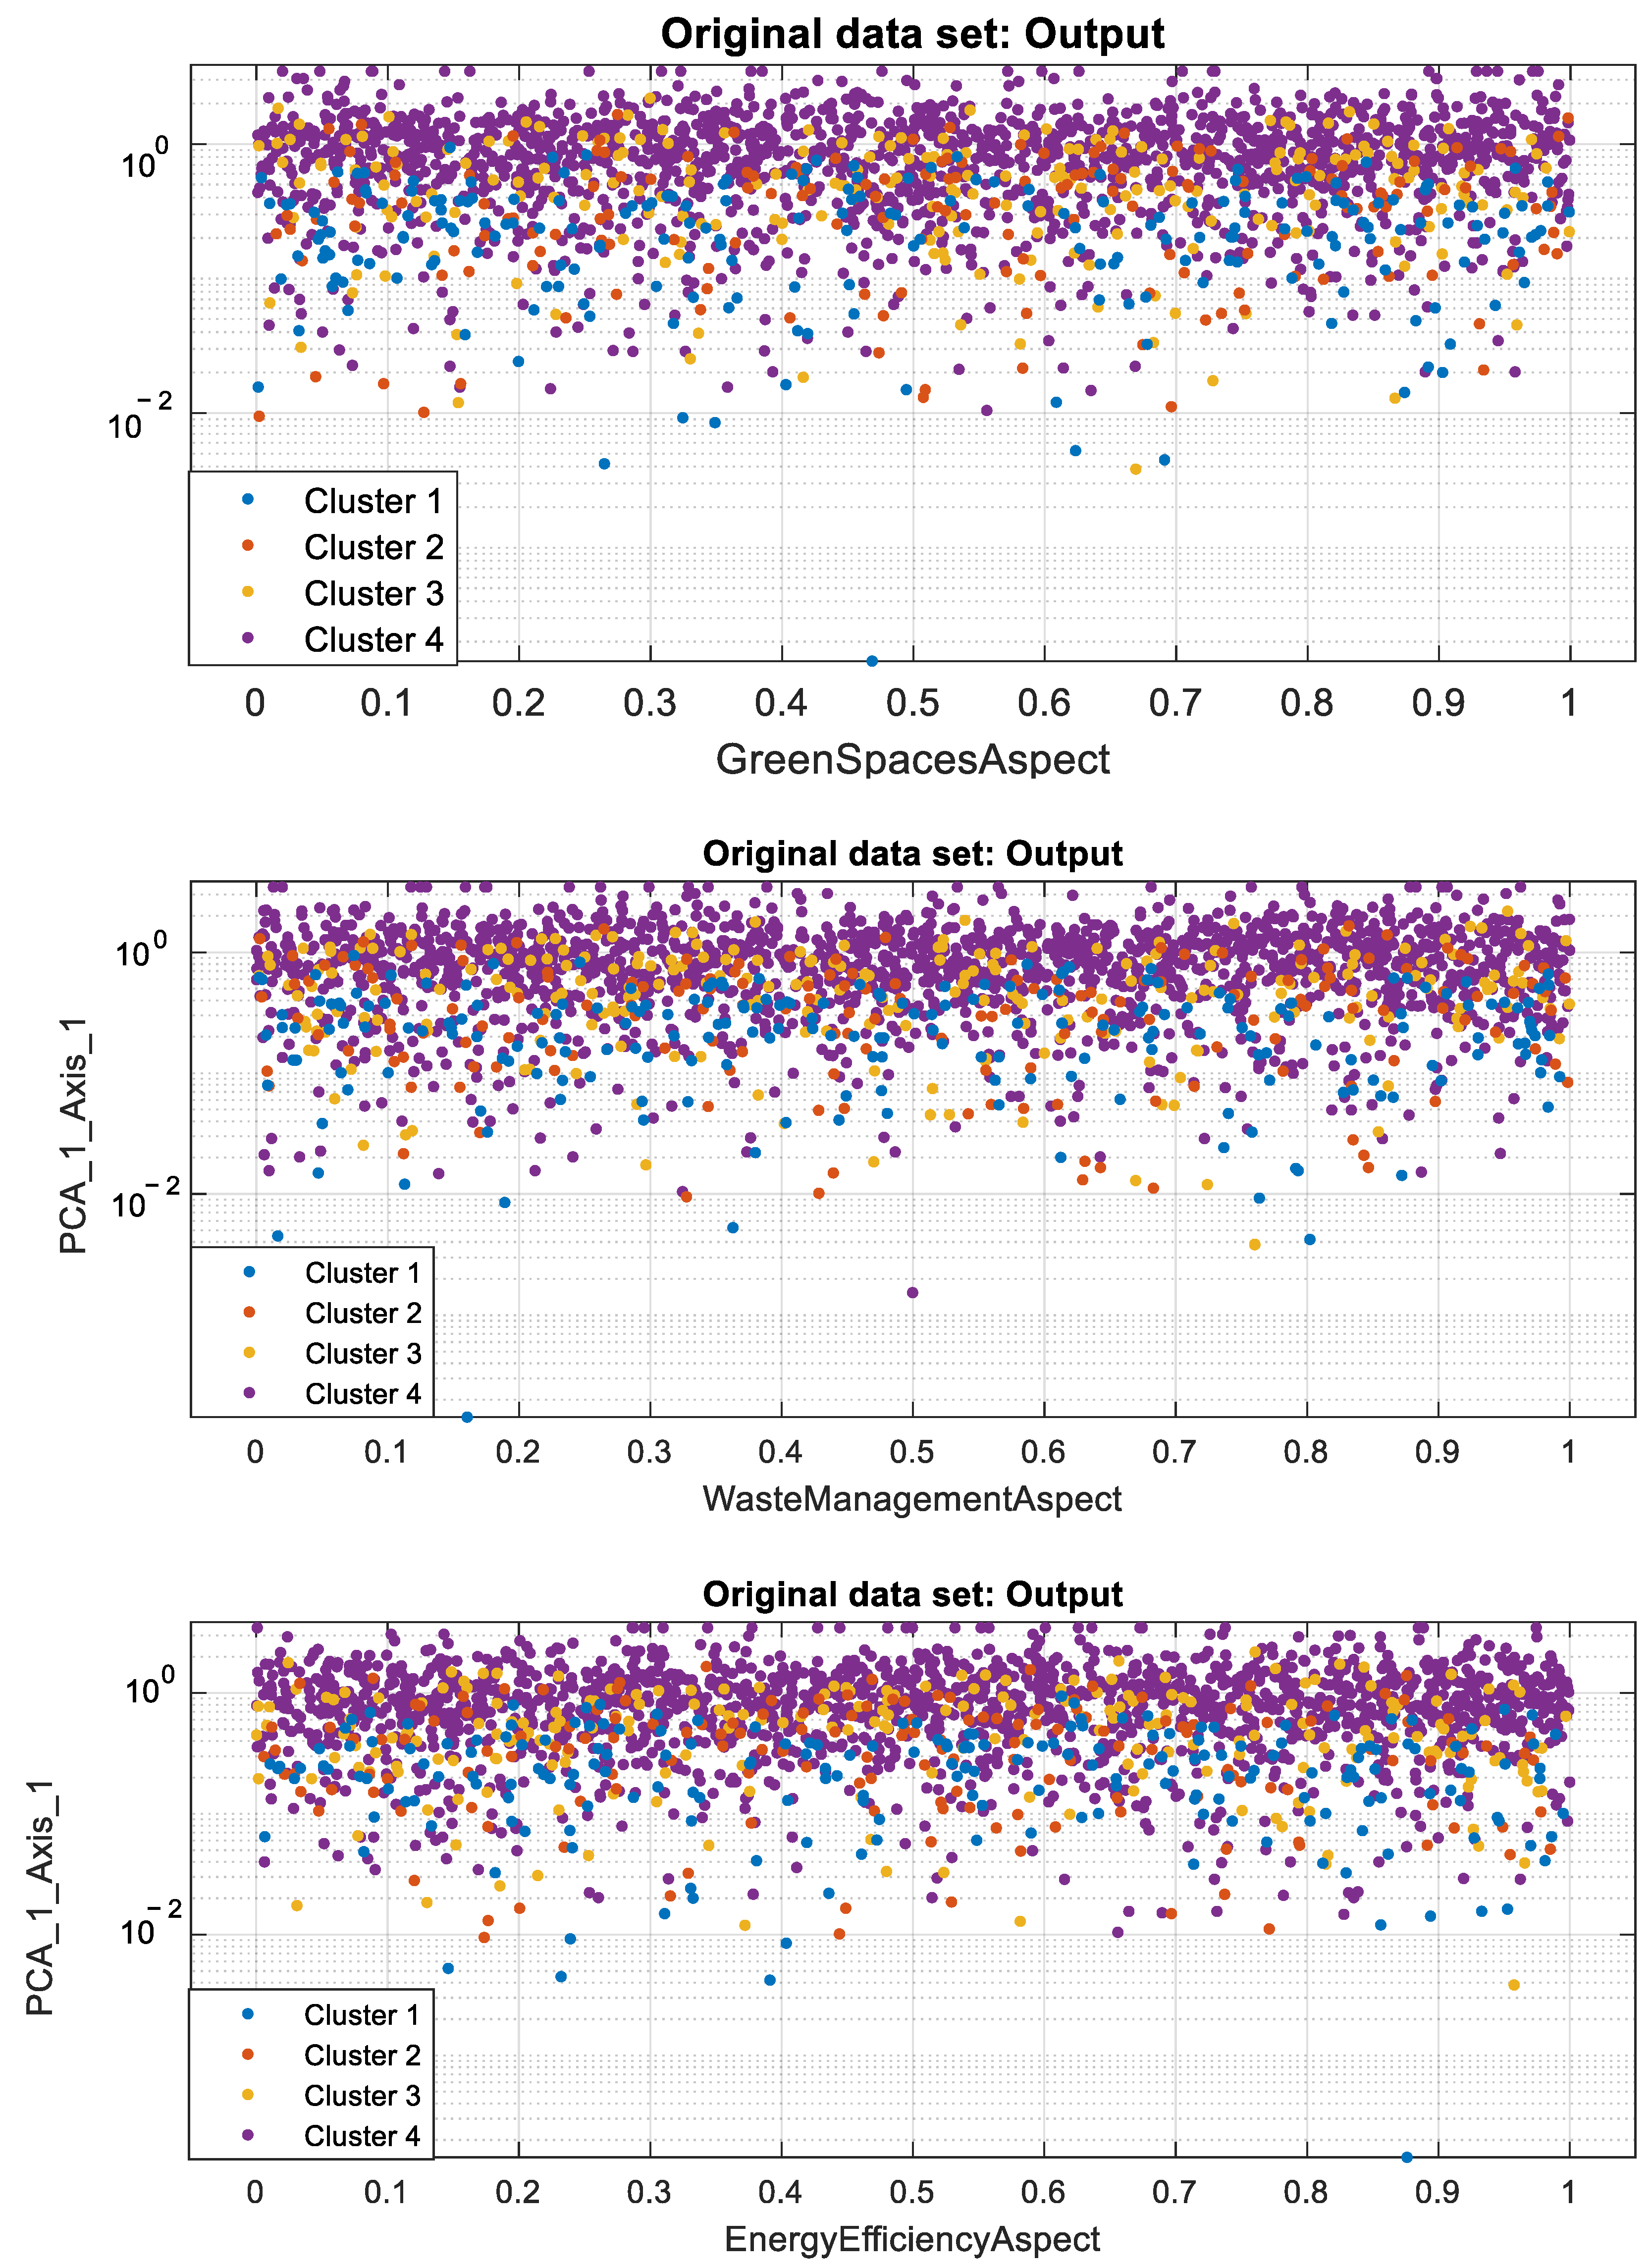
The average SC value is computed for various K values [60]. While the K corresponding to the highest average SC value typically indicates the lowest within-cluster dissimilarity, the final choice of K balances a high silhouette score with the practical relevance of the number of clusters. In Figure 6, the average silhouette value for different numbers of clusters is presented. To visualize the clusters, PCA was employed (see Table A1 and Table A2 in Appendix B). Clusters generated by spectral clustering are presented in Figure 7 using the PCA technique. The mean values of general dimensions in 4 clusters are shown in Table 1.
Table 1 highlights key differences in user satisfaction across four clusters. Cluster 4 consistently shows the highest satisfaction, especially for Rooms (mean = 3.79957), Value (mean = 4), and Sleep Quality (mean = 3.89688). Cluster 3 also performs well, except for Cleanliness (mean = 2). In contrast, Cluster 2 has notably poor ratings for Sleep Quality (mean = 1.63483), despite high scores in other areas. Cluster 1 generally shows moderate satisfaction but lags behind in Rooms (mean = 3.24396) and Service (mean = 3).
The LDA was employed and applied for text mining on each cluster before constructing prediction models by LSTM. Overall, three topics were generated by LDA: Green Spaces Aspect, Waste Management Aspect, and Energy Efficiency Aspect. These aspects were combined with the general criteria (Table 1). The mean values for the generated dimensions by LDA in four clusters are presented in Table 2. For the Green Spaces Aspect, Cluster 3 has the highest rating (mean = 0.512453), while Cluster 4 has the lowest (mean = 0.501618). In the Waste Management Aspect, Cluster 4 leads with a mean of 0.506771, and Cluster 3 scores the lowest (mean = 0.483136). Regarding the Energy Efficiency Aspect, Cluster 4 again shows the highest satisfaction (mean = 0.51057), while Cluster 3 has the lowest rating (mean = 0.48553). Overall, Cluster 4 performs best in most green dimensions, whereas Cluster 3 shows lower ratings. In Table 3, the mean values of green dimensions in four clusters versus overall ratings are presented.
In each cluster, the LSTM technique is employed to construct predictive models for the prediction of overall ratings. The architectural details of the LSTM network are delineated initially, followed by the training phase executed over 200 epochs. Notably, the gradient threshold is meticulously set at 1, while the primary learning rate is fine-tuned to 0.01.
The evaluation of predictor performance is conducted through a comprehensive set of metrics, namely, MAE [61], Root Mean Squared Error (RMSE) [62], and the adjusted coefficient of determination ( R a d j u s t e d 2 ) [63], as established in previous studies. A higher value of R a d j u s t e d 2 ) is indicative of superior predictive accuracy, signifying closer alignment with the ideal model. Conversely, lower values of RMSE and MAE underscore enhanced performance by the predictor. The computation of RMSE and MAE is encapsulated in Equation (7) and Equation (8), respectively. These metrics play a pivotal role in quantifying the predictive precision of the LSTM-based models, providing valuable insights into the overall effectiveness of the predictive framework.
R M S E = n = 1 N 1 N ( o v e r a l l r a t i n g ^ n o v e r a l l r a t i n g n ) 2
M A E = 1 N n = 1 N o v e r a l l r a t i n g ^ ( n ) o v e r a l l r a t i n g ( n )
These evaluation metrics are specifically defined for a testing vector of length N , comprising actual o v e r a l l r a t i n g values and their corresponding forecasted values o v e r a l l r a t i n g ^ .
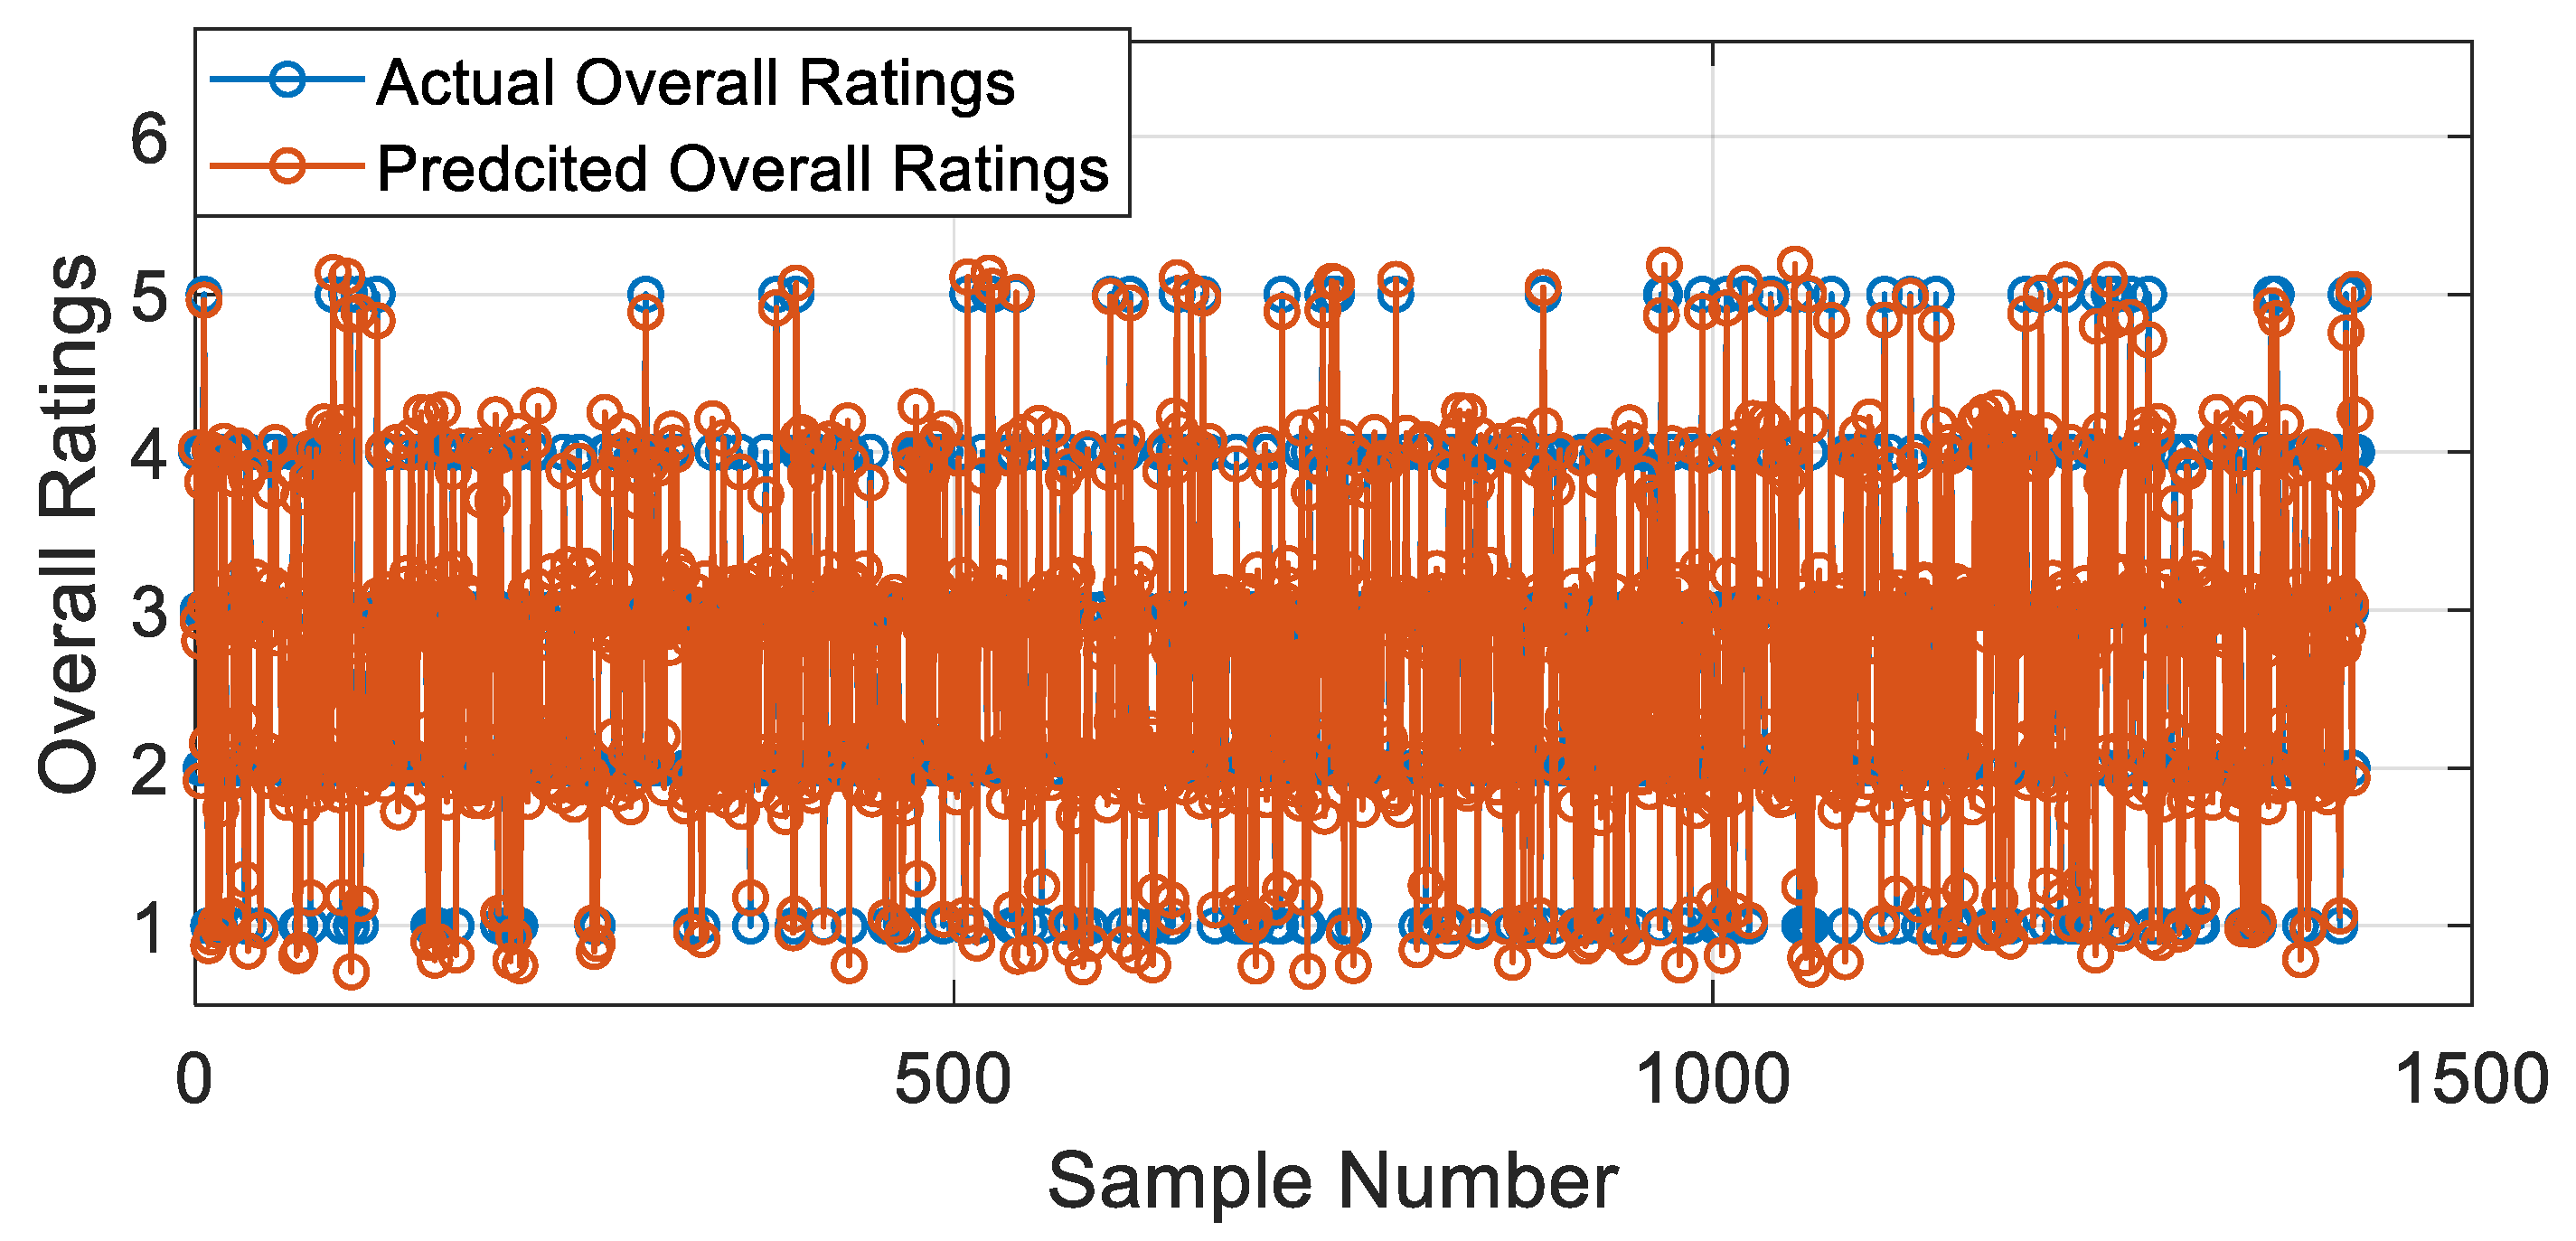
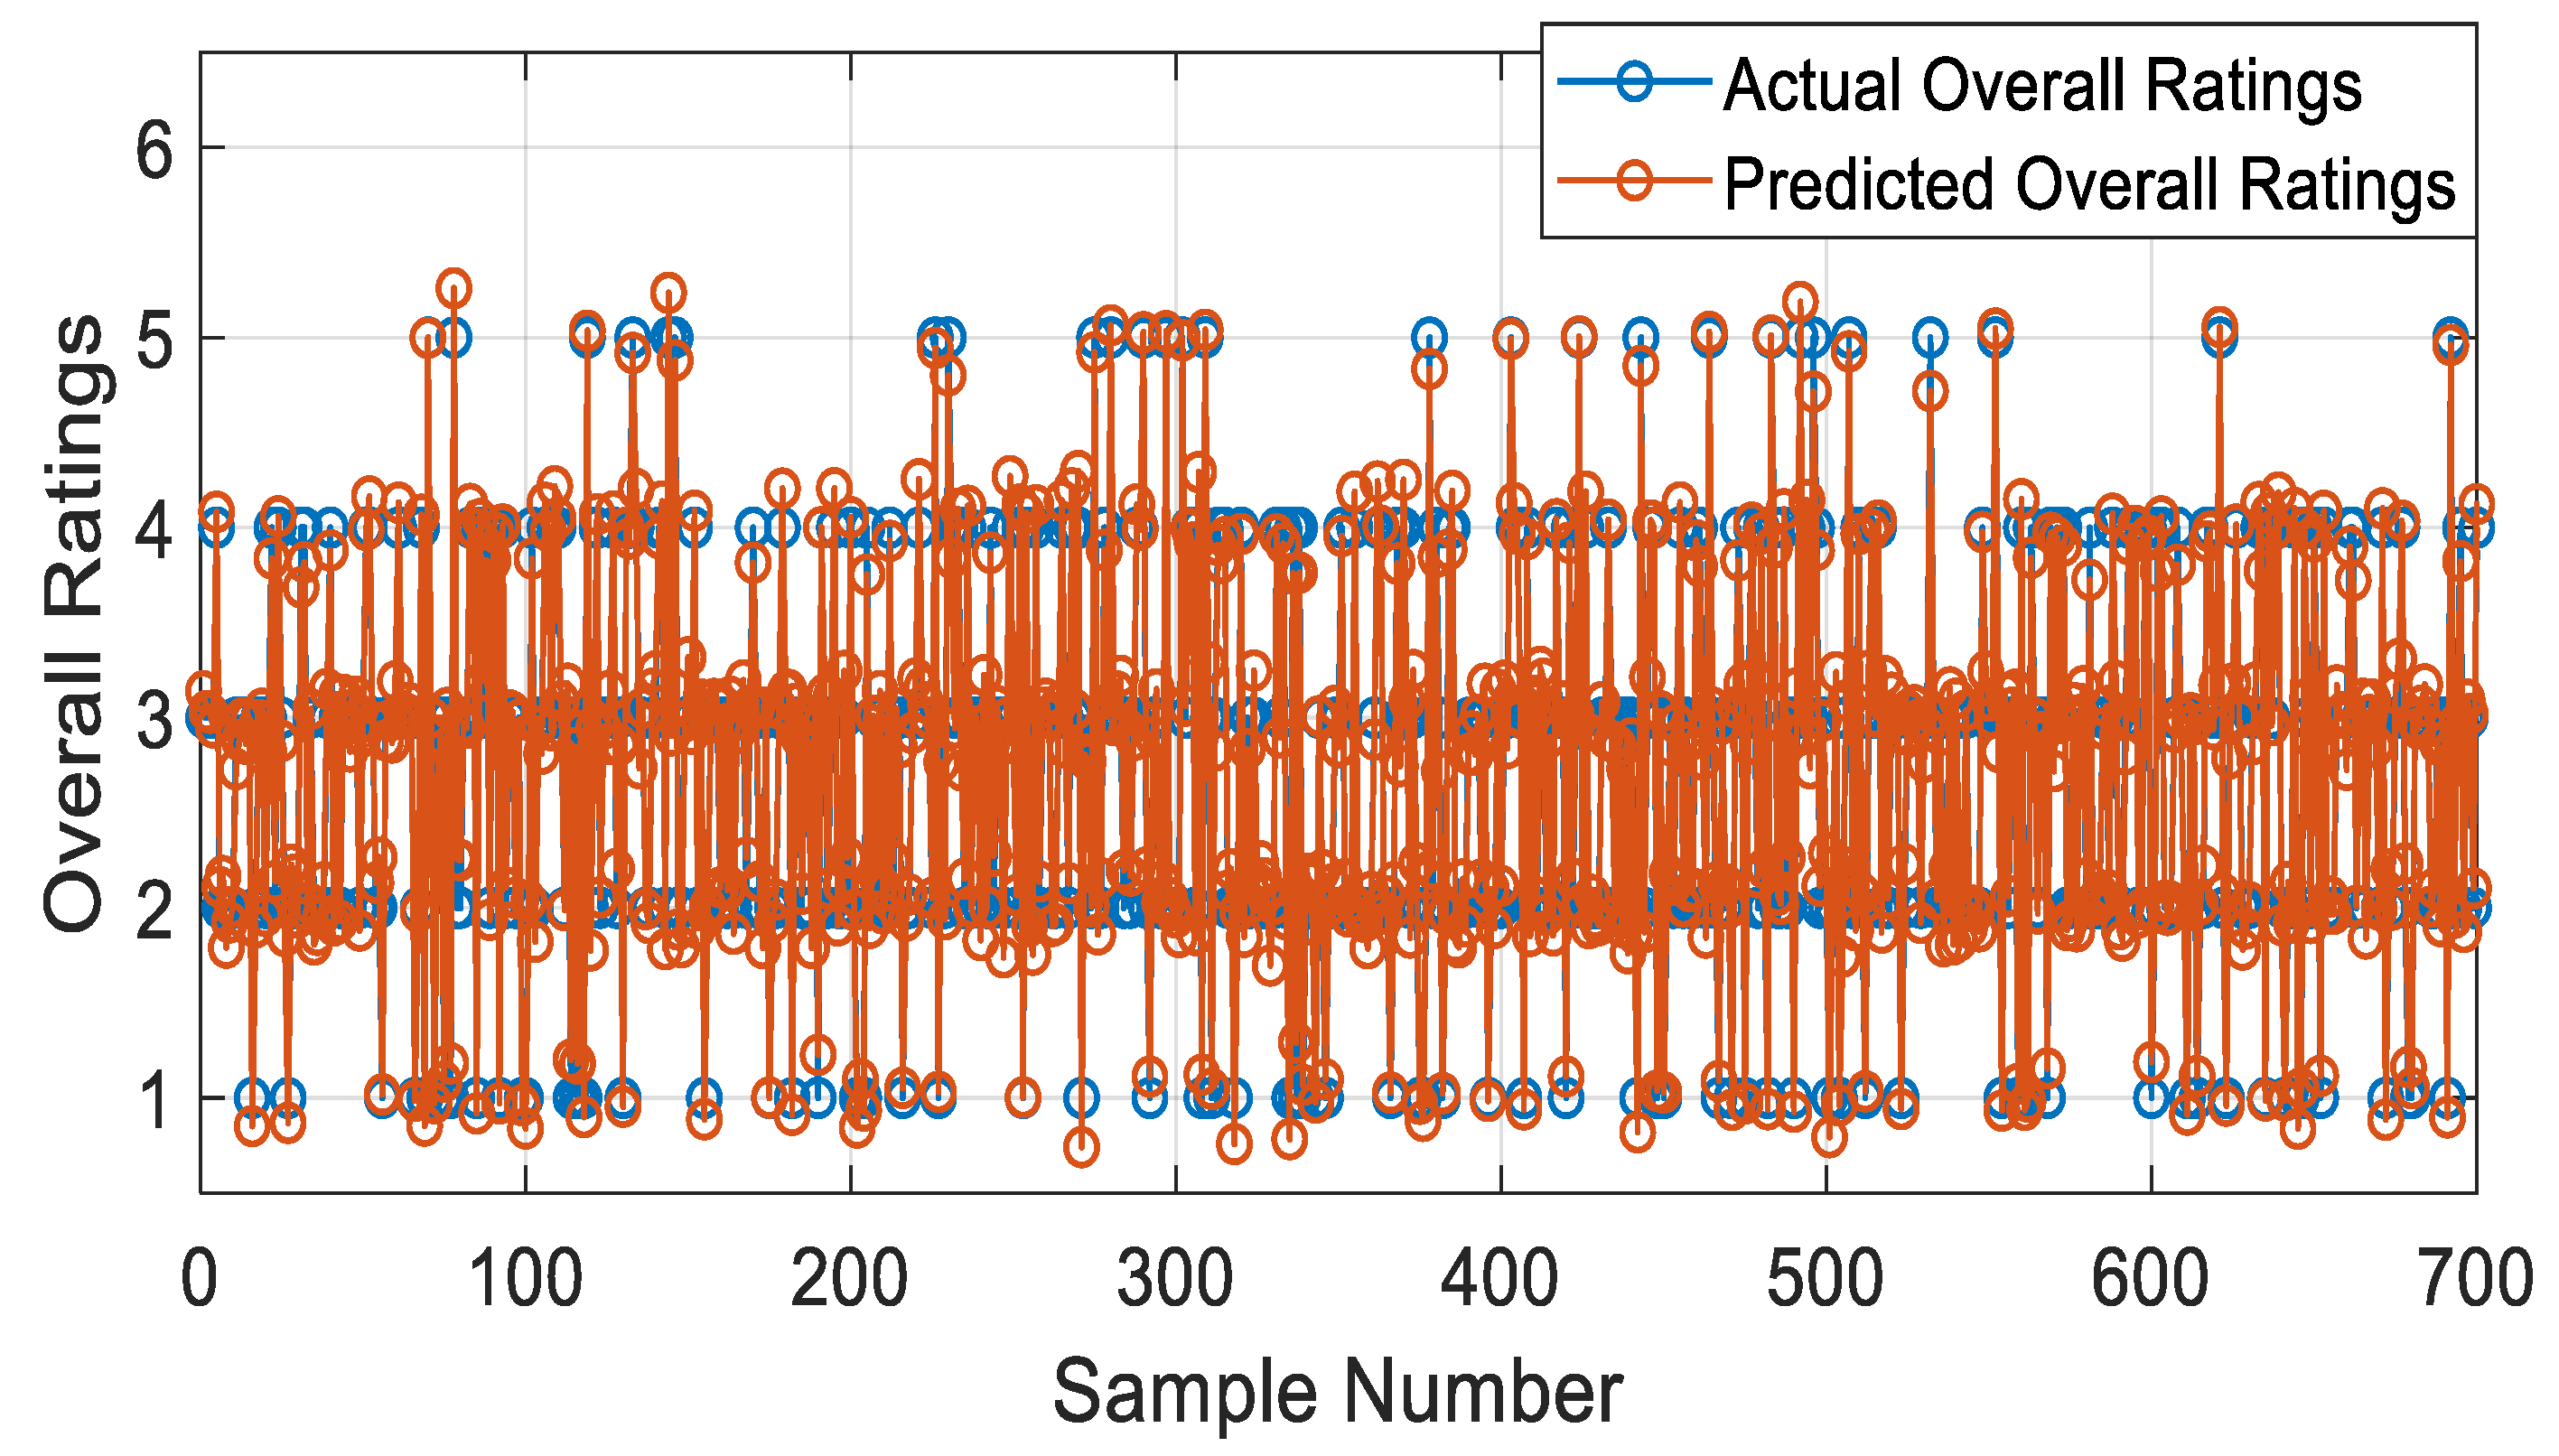
As presented in Table 4, the evaluation results for various prediction methods are as follows: Long Short-Term Memory achieved (MAE = 0.82, RMSE = 0.99, R a d j u s t e d 2 = 0.98), showing excellent performance. Support Vector Regression yielded (MAE = 0.98, RMSE = 1.10, R a d j u s t e d 2 = 0.94), which also performed well, though slightly lower than LSTM. Gaussian Process Regression returned (MAE = 0.99, RMSE = 1.12, R a d j u s t e d 2 = 0.91), indicating competitive accuracy. Artificial Neural Network Regression (ANN) showed (MAE = 1.02, RMSE = 1.15, R a d j u s t e d 2 = 0.85), which is still strong but lower in performance compared to the other methods. Decision Tree Regression produced (MAE = 1.13, RMSE = 1.18, R a d j u s t e d 2 = 0.82), reflecting a moderate accuracy. Linear Regression provided (MAE = 1.09, RMSE = 1.20, R a d j u s t e d 2 = 0.80), which is relatively less accurate. Finally, Stepwise Regression had (MAE = 1.16, RMSE = 1.22, R a d j u s t e d 2 = 0.78), indicating the lowest performance among the methods tested. Prediction of overall ratings by LSTM for only Cluster 1 and Cluster 2 is respectively shown in Figure 8 and Figure 9.
Various metrics can be utilized to evaluate the prediction accuracy of a recommender system, including precision, recall, and F1-score. A true positive (TP) refers to an item that is both recommended and relevant. A false negative (FN) occurs when an item is not recommended but is relevant. Conversely, a false positive (FP) represents an item that is recommended but not relevant, while a true negative (TN) describes an item that is neither recommended nor relevant.
Precision measures the proportion of correctly predicted relevant items out of all items recommended. It is also referred to as the positive predictive value and is calculated by Equation (9):
P r e c i s i o n = # T P # T P + F P
High precision indicates that a greater percentage of recommended items are truly relevant. For scenarios where the number of recommendations is fixed, Precision @k is used. Here, k represents the number of recommendations, and Precision @k is the fraction of relevant items within the top-k recommended list.
Recall, often called hit rate, sensitivity, or coverage, evaluates the proportion of relevant items correctly recommended. It is defined by Equation (10):
R e c a l l = # T P # T P + F N
In contexts with a fixed number of recommendations, Recall @k measures the fraction of relevant items identified within the top-k recommendations. Increasing the recommendation list length can boost recall but often decreases precision.
F1-Score, which is an important measure for the evaluation of recommendation quality, is the harmonic mean of recall and precision. It is designed to balance recall and precision. The formula is shown in Equation (11):
F 1 = 2 P r e c i s i o n × R e c a l l P r e c i s i o n + R e c a l l
To show the effectiveness of the proposed recommendation approach incorporating LDA, Spectral Clustering, and LSTM, experiments were conducted using the dataset of this study. The objective was to evaluate the precision of recommendations and the prediction accuracy, measured by MAE, of the proposed method (refer to Table 5). The author compared LDA + Spectral Clustering + LSTM with PCA [64], Standard-CF [20] and Total-Reg [20], LDA + LSTM, Spectral Clustering + Stepwise Regression, Spectral Clustering + Gaussian Process Regression, Spectral Clustering + Linear Regression, Spectral Clustering + Artificial Neural Network Regression, Spectral Clustering + Decision Tree Regression, Spectral Clustering + Support Vector Regression and LDA + Spectral Clustering + LSTM through Precision at Top @5 (PTop @5), Precision at Top @7 (PTop @7), and Mean Absolute Error (MAE).
The LDA + Spectral Clustering + LSTM model presents the highest performance among all evaluated methods, achieving PTop @5 = 89.44, PTop @7 = 88.21, and a minimal MAE = 0.84, confirming its exceptional accuracy and reliability in recommendation tasks. In comparison, the LDA + LSTM model, with PTop @5 = 78.33, PTop @7 = 76.77, and MAE = 0.96, while effective, falls short of the enhanced capabilities provided by the integration of Spectral Clustering into the framework. Among hybrid approaches incorporating Spectral Clustering, Spectral Clustering + Support Vector Regression achieves strong results (PTop @5 = 77.44, PTop @7 = 75.75, MAE = 0.98), followed by Spectral Clustering + Gaussian Process Regression (PTop @5 = 75.32, PTop @7 = 74.67, MAE = 0.99). Other combinations, such as Spectral Clustering + Decision Tree Regression (PTop @5 = 72.85, PTop @7 = 71.99, MAE = 1.13) and Spectral Clustering + Artificial Neural Network Regression (PTop @5 = 73.17, PTop @7 = 72.11, MAE = 1.02), also show competitive but slightly lower performance. Methods like Spectral Clustering + Stepwise Regression (PTop @5 = 71.45, PTop @7 = 70.12, MAE = 1.16) and Spectral Clustering + Linear Regression (PTop @5 = 72.12, PTop @7 = 71.18, MAE = 1.09) demonstrate moderate effectiveness but lag behind more advanced combinations. Conventional approaches such as PCA (PTop @5 = 69.11, PTop @7 = 68.15, MAE = 1.18), Total-Reg (PTop @5 = 66.31, PTop @7 = 64.33, MAE = 1.21), and Standard CF (PTop @5 = 63.22, PTop @7 = 62.99, MAE = 1.41) illustrate clear limitations in handling complex recommendation scenarios, emphasizing the superior performance of modern hybrid methods, particularly LDA + Spectral Clustering + LSTM.
To show how well the proposed multi-criteria recommender system works, the author used the F1 metric to measure recommendation accuracy and ran experiments on the TripAdvisor dataset for different sizes of neighbors. In these evaluations, the author changed the number of neighbors, N, to see how it affects recommendation results. N indicates the number of items the Top-N recommender system suggests, and the author sets it to values like 1, 20, 40, 60, 80, and 100. For each N, the author calculated the F1 score to understand how the system handles both precision and recall. This variation allows for a more robust evaluation of the system’s ability to recommend relevant items while minimizing irrelevant suggestions. From the results presented in Table 6, it is evident that the LDA + Spectral Clustering + LSTM achieves a high level of accuracy as the number of neighbors increases. Notably, the method maintains an F1 value above 0.90 across all neighborhood sizes from Top-1 to Top-100 recommendations. Furthermore, the optimal neighbor size is identified by selecting the neighborhood size corresponding to the maximum F1 value. These results affirm the effectiveness of integrating Spectral Clustering into the LDA + LSTM framework, especially in maintaining scalability and recommendation precision as the neighborhood size grows.
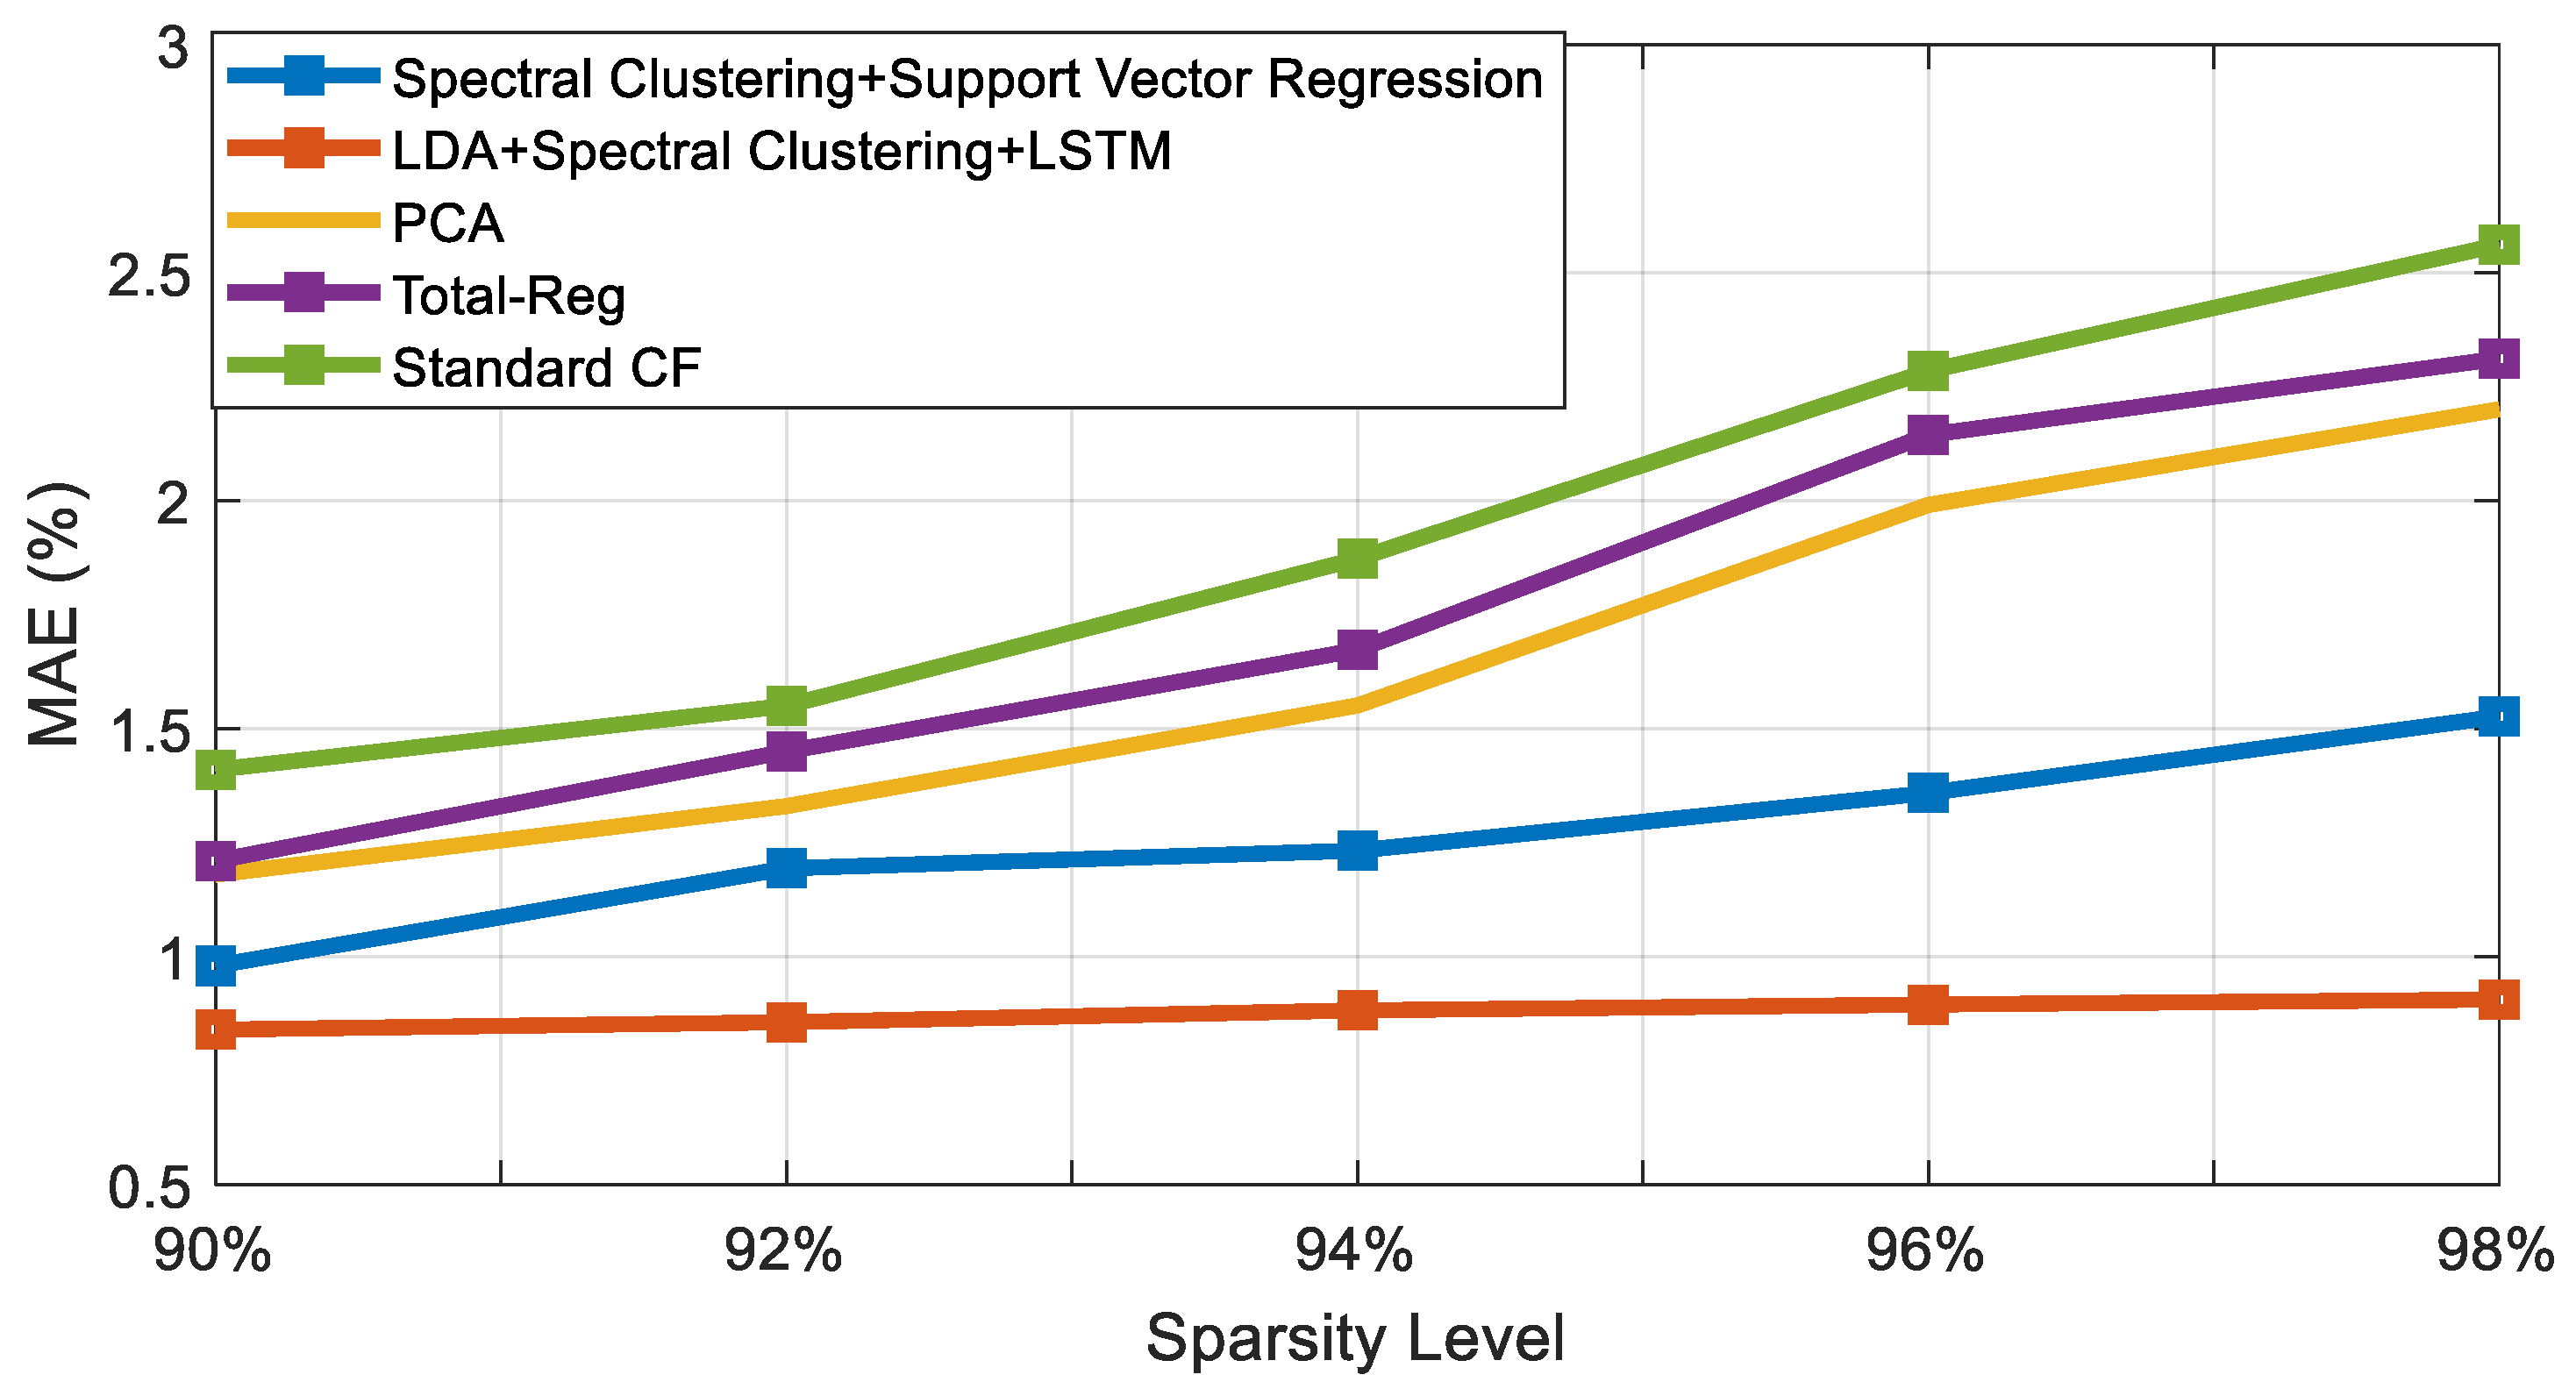
The author evaluated the performance of the method across various sparsity levels, calculating the average MAE for each to show how the proposed method is effective in solving sparsity issues. To deepen the evaluation, the author generated five datasets with varying sparsity levels (98%, 96%, 94%, 92%, and 90%) for the TripAdvisor dataset. The method was applied to the datasets, and the results were compared with other recommendation algorithms. As illustrated in Figure 10, the MAE values for the LDA + Spectral Clustering + LSTM methods were consistently lower across all sparsity levels compared to PCA [64], Standard CF [20] and Total-Reg [20], and Spectral Clustering + Support Vector Regression methods. Notably, the Standard-CF [20] method exhibited a steep increase in MAE as sparsity levels rose. These findings highlight those methods incorporating spectral clustering demonstrated superior prediction accuracy, especially with sparser datasets. This improvement is attributed to clustering approaches being more effective in addressing sparsity challenges, resulting in enhanced accuracy.

5. Discussion, Limitations, and Future Work

Tourism is an important economic sector for developing and developed countries. As a developing country, Saudi Arabia set up the Supreme Commission for Tourism (SCT) in 2000 to develop tourism in the country, aiming for big growth in this sector [65]. According to WTTC Report [66], travel and tourism made up 9.5% of Saudi Arabia’s GDP in 2019. Saudi Arabia is now one of the world’s leading tourist-generating markets. Based on reports, in 2018, an estimated 21.8 million Saudis traveled internationally, ranking fifteenth globally as a tourist outbound market [67]. In 2019, the tourism sector contributed approximately 11.4% of the Arab countries’ GDP, which amounted to SAR 313.6 billion. The Kingdom of Saudi Arabia accounted for approximately SAR 79.5 billion of this total [19]. However, recently, sustainability has been a major focus of countries in tourism development. In 2010, tourism and travel constituted 4.9% of worldwide CO2 emissions, with more than half from air transport [68]. Sustainability and competitiveness are the two primary concepts in tourism policy from a contemporary perspective, as the equilibrium between economic growth and sustainability is a significant factor [69]. The development of green hotels can be a major step toward promoting sustainable tourism. It has been shown that green hotels not only contribute to environmental sustainability but also attract environmentally conscious travelers, enhancing their market competitiveness. The Kingdom of Saudi Arabia is also working toward achieving more sustainable travel behaviors and attitudes [18,19]. One of the major contributors to sustainability development in the tourism sector is AI. In this context, research investigating AI and machine learning tends to highlight the potential benefits for travelers [70,71]. There have been many studies that highlighted the potential benefits of AI for tourism and hospitality [70,72]. In the case of sustainable tourism, from a system optimization perspective, AI can minimize waste, reducing the environmental footprint of tourism activities. This has been widely demonstrated in previous studies. From the perspective of tourist experience and decision-making, predictive analytics from big datasets can discover the shortcomings of stakeholders for sustainability practice in the tourism and hospitality industry. The vast amount of the data includes valuable insights into the customers’ perspectives on preferences, behaviors, and satisfaction levels. This enables businesses to tailor services and enhance customer experience. Thus, there have been many developments in AI-based recommendation systems to handle these datasets for customers’ decision-making.
However, these systems have several major issues, such as scalability, sparsity, and quality of recommendations, which previous research and this study have highlighted. This study found that, in the context of green hotel recommendations, the quality of the recommendations can be significantly improved with the use of a multi-criteria recommendation system. The author found that incorporating multi-criteria ratings into the recommendation engine can provide more tailored and accurate recommendations. In fact, multi-criteria ratings can be a suitable option for green hotel recommendations when online reviews are available on tourism platforms. In addition, this study attempted to develop a new recommendation algorithm through the use of clustering, deep learning, and text mining algorithms. The results of the study demonstrated that the combination of these techniques can enhance the accuracy and relevance of recommendations. In addition, the method demonstrated remarkable robustness in the management of sparse datasets, as evidenced by experiments carried out at varying levels of sparsity. The results showed that the proposed method provides lower MAE values and stable outcomes compared to other models with rising sparsity in the dataset. This is because of the fact that the clustering approach, which effectively groups similar users, may better mitigate sparsity-related issues in large datasets. Scalability assessment is an important aspect of this research. From the presented evaluations, it is found that the integration of spectral clustering within the LDA + LSTM framework can significantly enhance the scalability as neighborhood sizes increased. This advantage was evident in the F-measure scores, where LDA + Spectral Clustering + LSTM consistently outperformed LDA + LSTM across all tested configurations. Overall, although this research demonstrated that the proposed method is well-suited for recommendation tasks in the tourism domain for green hotels, several limitations of the proposed methods could be overcome in future studies. First, the method can be developed by ensemble learning approaches for both LSTM and spectral clustering. Previous studies have demonstrated that ensemble learning approaches can provide more stable results compared with single-learning approaches. Furthermore, other text mining (e.g., Latent Semantic Analysis) [73] and deep learning techniques (e.g., Deep Belief Networks) [74] can be incorporated into the proposed system and evaluated by the collected data. Second, the TripAdvisor data can be combined with datasets in other tourism platforms for its effectiveness in dealing with sparsity and scalability issues in recommendation systems. Third, for more robust recommendation systems, the development of the proposed method for its incremental learning ability is suggested when there are big datasets in tourism.
Finally, the proposed recommendation system enhances customer decision-making by providing tailored, accurate suggestions, simplifying the selection of hotels, particularly green hotels, aligned with their preferences. For businesses, this automated approach streamlines operations, enabling decision-makers to optimize offerings, attract eco-conscious travelers, and drive profits, similar to the success seen in large shopping platforms. Additionally, the system promotes sustainable development in tourism by encouraging environmentally responsible choices, benefiting both businesses and the planet.

6. Conclusions

The development of robust algorithms has been a major focus of researchers in the context of information retrieval. Although previous studies have largely focused on the use of machine learning in the context of recommendation systems, this issue is unexplored in the context of green hotel recommendations. In addition, the use of green hotels’ online reviews in this development has not been investigated to evaluate recommendation systems. This study developed a new recommendation method using text mining, clustering, and prediction learning techniques for green hotel recommendations. The proposed method, LDA + Spectral Clustering + LSTM, was designed to enhance predictive accuracy and efficiency in multi-criteria recommendation systems. The proposed approach integrated spectral clustering to group user ratings, achieving more accurate and scalable recommendations. LDA was employed as a text mining technique to uncover hidden patterns in user preferences from online reviews. LSTM models were then developed from these identified patterns within each spectral clustering group. The hybrid method was evaluated for its performance in addressing key challenges in recommendation systems, including accuracy, sparsity, and scalability. To demonstrate the method’s effectiveness, experiments were conducted using the TripAdvisor dataset, which included 4684 reviews of 64 green hotels in Saudi Arabia. In total, spectral clustering discovered four clusters from the data. The quality of these clusters was assessed using silhouette values. In addition, LDA discovered three main topics from the online reviews: green spaces aspect, waste management aspect, and energy efficiency aspect. These topics were combined with the main criteria for the proposed method evaluations. Several metrics were used in the evaluation of the recommender system. The author evaluated the recommendations precision at Top-5 (PTop @5) and Precision at Top-7 (PTop @7). In addition, the F1 measure was used to assess the performance of the recommendations. To show the robustness of the proposed method, comparisons were made with previous methods: PCA, Standard CF, and Total-Reg, as well as hybrid models including Spectral Clustering + Support Vector Regression and LDA + LSTM. The results highlighted the superior performance of LDA + Spectral Clustering + LSTM, achieving PTop @5 = 89.44, PTop @7 = 88.21, and a minimal MAE = 0.84.

Funding

The author is thankful to the Deanship of Graduate Studies and Scientific Research at Najran University for funding this work under the Easy Funding Program.

Institutional Review Board Statement

Not applicable.

Informed Consent Statement

Not applicable.

Data Availability Statement

Datasets generated during the current study are available from the corresponding author on reasonable request.

Conflicts of Interest

The author declares no conflicts of interest.

Appendix A

Figure A1. An example of reviews on the hotels in Saudi Arabia.
Sustainability 17 02328 g0a1aSustainability 17 02328 g0a1b

Appendix B

Table A1. PCA results: eigenvalues.
AxisEigenvalueDifferenceProportion (%)Cumulative (%)
11.1073090.08136818.46%18.46%
21.0259410.03288717.10%35.55%
30.9930540.01211816.55%52.11%
40.9809350.02452816.35%68.45%
50.9564070.02005315.94%84.39%
60.936354-15.61%100.00%
Tot.6.000000---
Note: Minor deviations in cumulative percentages and totals are due to rounding.
Table A2. PCA results: factor Score Coefficients.
AttributeMeanStd-devAxis_1Axis_2Axis_3Axis_4Axis_5
Location3.46721051.04110180.3198855−0.1585517−0.73743860.51517160.2481270
Rooms3.55357721.02315040.4036334−0.41686750.48239200.3933022−0.0821824
Value3.44771341.04153710.47689780.1217295−0.3576557−0.5008108−0.4995153
Cleanliness3.50213191.02781930.27621350.69260120.1373064−0.01169970.5716770
Service3.48738681.05186870.53028160.28792910.26179030.2299057−0.3081530
Sleep Quality3.49744901.05445050.3870780−0.47293260.0904292−0.52545850.5102849

References

  1. Bag, S.; Ghadge, A.; Tiwari, M.K. An integrated recommender system for improved accuracy and aggregate diversity. Comput. Ind. Eng. 2019, 130, 187–197. [Google Scholar] [CrossRef]
  2. Zhao, Z.; Fan, W.; Li, J.; Liu, Y.; Mei, X.; Wang, Y.; Wen, Z.; Wang, F.; Zhao, X.; Tang, J.; et al. Recommender systems in the era of large language models (llms). IEEE Trans. Knowl. Data Eng. 2024, 36, 6889–6907. [Google Scholar] [CrossRef]
  3. Moawad, A.; Li, Z.; Pancorbo, I.; Gurumurthy, K.M.; Freyermuth, V.; Islam, E.; Vijayagopal, R.; Stinson, M.; Rousseau, A. A real-time energy and cost efficient vehicle route assignment neural recommender system. Expert Syst. Appl. 2025, 263, 125634. [Google Scholar] [CrossRef]
  4. Shi, X.; Zhang, Y.; Pujahari, A.; Mishra, S.K. When latent features meet side information: A preference relation based graph neural network for collaborative filtering. Expert Syst. Appl. 2025, 260, 125423. [Google Scholar] [CrossRef]
  5. Fayyaz, Z.; Ebrahimian, M.; Nawara, D.; Ibrahim, A.; Kashef, R. Recommendation systems: Algorithms, challenges, metrics, and business opportunities. Appl. Sci. 2020, 10, 7748. [Google Scholar] [CrossRef]
  6. Herlocker, J.L.; Konstan, J.A.; Terveen, L.G.; Riedl, J.T. Evaluating collaborative filtering recommender systems. ACM Trans. Inf. Syst. (TOIS) 2004, 22, 5–53. [Google Scholar] [CrossRef]
  7. Atas, M.; Felfernig, A.; Polat-Erdeniz, S.; Popescu, A.; Tran, T.N.T.; Uta, M. Towards psychology-aware preference construction in recommender systems: Overview and research issues. J. Intell. Inf. Syst. 2021, 57, 467–489. [Google Scholar] [CrossRef]
  8. Pu, P.; Chen, L.; Hu, R. Evaluating recommender systems from the user’s perspective: Survey of the state of the art. User Model. User-Adapt. Interact. 2012, 22, 317–355. [Google Scholar] [CrossRef]
  9. Maslowska, E.; Malthouse, E.C.; Hollebeek, L.D. The role of recommender systems in fostering consumers’ long-term platform engagement. J. Serv. Manag. 2022, 33, 721–732. [Google Scholar] [CrossRef]
  10. Ahammad, S.H.; Dwarkanath, S.; Joshi, R.; Madhav, B.T.P.; Priya, P.P.; Faragallah, O.S.; Eid, M.M.A.; Rashed, A.N.Z. Social media reviews based hotel recommendation system using collaborative filtering and big data. Multimed. Tools Appl. 2024, 83, 29569–29582. [Google Scholar] [CrossRef]
  11. Saito, Y.; Yaginuma, S.; Nishino, Y.; Sakata, H.; Nakata, K. Unbiased recommender learning from missing-not-at-random implicit feedback. In Proceedings of the 13th International Conference on Web Search and Data Mining, Houston, TX, USA, 3–7 February 2020; pp. 501–509. [Google Scholar] [CrossRef]
  12. Afoudi, Y.; Lazaar, M.; Al Achhab, M. Hybrid recommendation system combined content-based filtering and collaborative prediction using artificial neural network. Simul. Model. Pract. Theory 2021, 113, 102375. [Google Scholar] [CrossRef]
  13. Pantano, E.; Priporas, C.-V.; Stylos, N. ‘You will like it!’using open data to predict tourists’ response to a tourist attraction. Tour. Manag. 2017, 60, 430–438. [Google Scholar] [CrossRef]
  14. Harris, L.; Dennis, C. Engaging customers on Facebook: Challenges for e-retailers. J. Consum. Behav. 2011, 10, 338–346. [Google Scholar] [CrossRef]
  15. Li, R.; Li, Y.-Q.; Ruan, W.-Q.; Zhang, S.-N.; Wang, M.-Y. Sentiment mining of online reviews of peer-to-peer accommodations: Customer emotional heterogeneity and its influencing factors. Tour. Manag. 2023, 96, 104704. [Google Scholar] [CrossRef]
  16. Karabila, I.; Darraz, N.; El-Ansari, A.; Alami, N.; El Mallahi, M. Enhancing collaborative filtering-based recommender system using sentiment analysis. Future Internet 2023, 15, 235. [Google Scholar] [CrossRef]
  17. Khojamli, H.; Razmara, J. Survey of similarity functions on neighborhood-based collaborative filtering. Expert Syst. Appl. 2021, 185, 115482. [Google Scholar] [CrossRef]
  18. Alturif, G.; Saleh, W. Attitudes and Behaviour towards More Sustainable Travel Options in the Kingdom of Saudi Arabia: An Emerging Social Change? Sustainability 2023, 15, 12548. [Google Scholar] [CrossRef]
  19. Altassan, A. Sustainability of heritage villages through eco-tourism investment (case study: Al-Khabra Village, Saudi Arabia). Sustainability 2023, 15, 7172. [Google Scholar] [CrossRef]
  20. Adomavicius, G.; Kwon, Y. New recommendation techniques for multicriteria rating systems. IEEE Intell. Syst. 2007, 22, 48–55. [Google Scholar] [CrossRef]
  21. Guan, X.; Li, C.-T.; Guan, Y. Matrix factorization with rating completion: An enhanced SVD model for collaborative filtering recommender systems. IEEE Access 2017, 5, 27668–27678. [Google Scholar] [CrossRef]
  22. Ormándi, R.; Hegedus, I.; Csernai, K.; Jelasity, M. Towards inferring ratings from user behavior in BitTorrent communities. In Proceedings of the 2010 19th IEEE International Workshops on Enabling Technologies: Infrastructures for Collaborative Enterprises, Larissa, Greece, 28–30 June 2010; pp. 217–222. [Google Scholar] [CrossRef]
  23. Esmaeili, L.; Nasiri, M.; Minaei-Bidgoli, B. Personalizing group recommendation to social network users. In Web Information Systems and Mining, Proceedings of the International Conference, WISM 2011, Taiyuan, China, 24–25 September 2011, Proceedings, Part I; Springer: Berlin/Heidelberg, Germany, 2011; pp. 124–133. [Google Scholar] [CrossRef]
  24. Shelar, S.; Kamat, P.; Varpe, A.; Birajdar, A. TRAVELMATE travel package recommendation system. Int. Res. J. Eng. Technol. (IRJET) 2018, 5, 4095–4097. [Google Scholar] [CrossRef]
  25. Jia, Z.; Yang, Y.; Gao, W.; Chen, X. User-based collaborative filtering for tourist attraction recommendations. In Proceedings of the 2015 IEEE International Conference on Computational Intelligence & Communication Technology, Ghaziabad, India, 13–14 February 2015; pp. 22–25. [Google Scholar] [CrossRef]
  26. Aldayel, M.; Al-Nafjan, A.; Al-Nuwaiser, W.M.; Alrehaili, G.; Alyahya, G. Collaborative Filtering-Based Recommendation Systems for Touristic Businesses, Attractions, and Destinations. Electronics 2023, 12, 4047. [Google Scholar] [CrossRef]
  27. Lucas, J.P.; Luz, N.; Moreno, M.N.; Anacleto, R.; Figueiredo, A.A.; Martins, C. A hybrid recommendation approach for a tourism system. Expert Syst. Appl. 2013, 40, 3532–3550. [Google Scholar] [CrossRef]
  28. Chalkiadakis, G.; Ziogas, I.; Koutsmanis, M.; Streviniotis, E.; Panagiotakis, C.; Papadakis, H. A novel hybrid recommender system for the tourism domain. Algorithms 2023, 16, 215. [Google Scholar] [CrossRef]
  29. Hu, Y.-H.; Tsai, C.-F.; Sun, Y.-C. A novel hotel recommender system incorporating review sentiment and contextual information. Int. J. Data Sci. Anal. 2024, 1–12. [Google Scholar] [CrossRef]
  30. García-Crespo, A.; Chamizo, J.; Rivera, I.; Mencke, M.; Colomo-Palacios, R.; Gómez-Berbís, J.M. SPETA: Social pervasive e-Tourism advisor. Telemat. Inform. 2009, 26, 306–315. [Google Scholar] [CrossRef]
  31. Li, C.; Zheng, W. Nipping trouble in the bud: A proactive tourism recommender system. Inf. Manag. 2025, 62, 104062. [Google Scholar] [CrossRef]
  32. Arif, Y.M.; Putra, D.D.; Wardani, D.; Nugroho, S.M.S.; Hariadi, M. Decentralized recommender system for ambient intelligence of tourism destinations serious game using known and unknown rating approach. Heliyon 2023, 9, e14267. [Google Scholar] [CrossRef] [PubMed]
  33. Wang, E.; Li, D.; Lan, S.; Li, Y. Personalized Hotel Recommendation Algorithms Based on Online Reviews. In Proceedings of the 2023 IEEE 11th International Conference on Information, Communication and Networks (ICICN), Xi’an, China, 17–20 August 2023; pp. 823–829. [Google Scholar] [CrossRef]
  34. Nilashi, M.; Bagherifard, K.; Rahmani, M.; Rafe, V. A recommender system for tourism industry using cluster ensemble and prediction machine learning techniques. Comput. Ind. Eng. 2017, 109, 357–368. [Google Scholar] [CrossRef]
  35. Nilashi, M.; Ahani, A.; Esfahani, M.D.; Yadegaridehkordi, E.; Samad, S.; Ibrahim, O.; Sharef, N.M.; Akbari, E. Preference learning for eco-friendly hotels recommendation: A multi-criteria collaborative filtering approach. J. Clean. Prod. 2019, 215, 767–783. [Google Scholar] [CrossRef]
  36. Mishra, R.K.; Jothi, J.A.A.; Urolagin, S.; Irani, K. Knowledge based topic retrieval for recommendations and tourism promotions. Int. J. Inf. Manag. Data Insights 2023, 3, 100145. [Google Scholar] [CrossRef]
  37. Wang, X. Construction of smart tourism system integrating tourist needs and scene characteristics. Syst. Soft Comput. 2024, 6, 200168. [Google Scholar] [CrossRef]
  38. Gao, J.; Peng, P.; Lu, F.; Claramunt, C.; Xu, Y. Towards travel recommendation interpretability: Disentangling tourist decision-making process via knowledge graph. Inf. Process. Manag. 2023, 60, 103369. [Google Scholar] [CrossRef]
  39. Ray, B.; Garain, A.; Sarkar, R. An ensemble-based hotel recommender system using sentiment analysis and aspect categorization of hotel reviews. Appl. Soft Comput. 2021, 98, 106935. [Google Scholar] [CrossRef]
  40. Jiang, R.; Dai, B. Cultural tourism attraction recommendation model based on optimized weighted association rule algorithm. Syst. Soft Comput. 2024, 6, 200094. [Google Scholar] [CrossRef]
  41. Yang, S.; Li, Q.; Jang, D.; Kim, J. Deep learning mechanism and big data in hospitality and tourism: Developing personalized restaurant recommendation model to customer decision-making. Int. J. Hosp. Manag. 2024, 121, 103803. [Google Scholar] [CrossRef]
  42. Cui, C.; Wei, M.; Che, L.; Wu, S.; Wang, E. Hotel recommendation algorithms based on online reviews and probabilistic linguistic term sets. Expert Syst. Appl. 2022, 210, 118503. [Google Scholar] [CrossRef]
  43. Esmaeili, L.; Mardani, S.; Golpayegani, S.A.H.; Madar, Z.Z. A novel tourism recommender system in the context of social commerce. Expert Syst. Appl. 2020, 149, 113301. [Google Scholar] [CrossRef]
  44. Hong, M.; Jung, J.J. Multi-criteria tensor model for tourism recommender systems. Expert Syst. Appl. 2021, 170, 114537. [Google Scholar] [CrossRef]
  45. Pérez, J.; Pérez, A.; Casillas, A.; Gojenola, K. Cardiology record multi-label classification using latent Dirichlet allocation. Comput. Methods Programs Biomed. 2018, 164, 111–119. [Google Scholar] [CrossRef]
  46. Blei, D.M.; Ng, A.Y.; Jordan, M.I. Latent dirichlet allocation. J. Mach. Learn. Res. 2003, 3, 993–1022. [Google Scholar] [CrossRef]
  47. Jelodar, H.; Wang, Y.; Yuan, C.; Feng, X. Latent Dirichlet allocation (LDA) and topic modeling: Models, applications, a survey. Multimed. Tools Appl. 2019, 78, 15169–15211. [Google Scholar] [CrossRef]
  48. Yu, D.; Xiang, B. Discovering topics and trends in the field of Artificial Intelligence: Using LDA topic modeling. Expert Syst. Appl. 2023, 225, 120114. [Google Scholar] [CrossRef]
  49. Kukreja, V. Comic exploration and Insights: Recent trends in LDA-Based recognition studies. Expert Syst. Appl. 2024, 255, 124732. [Google Scholar] [CrossRef]
  50. Ali, T.; Omar, B.; Soulaimane, K. Analyzing tourism reviews using an LDA topic-based sentiment analysis approach. MethodsX 2022, 9, 101894. [Google Scholar] [CrossRef]
  51. Wang, W.; Feng, Y.; Dai, W. Topic analysis of online reviews for two competitive products using latent Dirichlet allocation. Electron. Commer. Res. Appl. 2018, 29, 142–156. [Google Scholar] [CrossRef]
  52. Prieto, A.; Prieto, B.; Ortigosa, E.M.; Ros, E.; Pelayo, F.; Ortega, J.; Rojas, I. Neural networks: An overview of early research, current frameworks and new challenges. Neurocomputing 2016, 214, 242–268. [Google Scholar] [CrossRef]
  53. Cichy, R.M.; Kaiser, D. Deep neural networks as scientific models. Trends Cogn. Sci. 2019, 23, 305–317. [Google Scholar] [CrossRef]
  54. Hochreiter, S.; Schmidhuber, J. Long short-term memory. Neural Comput. 1997, 9, 1735–1780. [Google Scholar] [CrossRef] [PubMed]
  55. Saleh, H.; Amer, E.; Abuhmed, T.; Ali, A.; Al-Fuqaha, A.; El-Sappagh, S. Computer aided progression detection model based on optimized deep LSTM ensemble model and the fusion of multivariate time series data. Sci. Rep. 2023, 13, 16336. [Google Scholar] [CrossRef]
  56. Xu, D.; Tian, Y. A comprehensive survey of clustering algorithms. Ann. Data Sci. 2015, 2, 165–193. [Google Scholar] [CrossRef]
  57. Von Luxburg, U. A tutorial on spectral clustering. Stat. Comput. 2007, 17, 395–416. [Google Scholar] [CrossRef]
  58. Et-Taleby, A.; Boussetta, M.; Benslimane, M. Faults Detection for Photovoltaic Field Based on K-Means, Elbow, and Average Silhouette Techniques through the Segmentation of a Thermal Image. Int. J. Photoenergy 2020, 2020, 6617597. [Google Scholar] [CrossRef]
  59. Frahling, G.; Sohler, C. A fast k-means implementation using coresets. In Proceedings of the Twenty-Second Annual Symposium on Computational Geometry, Sedona, AZ, USA, 5–7 June 2006; pp. 135–143. [Google Scholar] [CrossRef]
  60. Adhau, S.; Moharil, R.; Adhau, P. K-Means clustering technique applied to availability of micro hydro power. Sustain. Energy Technol. Assess. 2014, 8, 191–201. [Google Scholar] [CrossRef]
  61. Das, K.; Kumar, R.; Krishna, A. Analyzing electric vehicle battery health performance using supervised machine learning. Renew. Sustain. Energy Rev. 2024, 189, 113967. [Google Scholar] [CrossRef]
  62. Hu, Z.; Gao, Y.; Ji, S.; Mae, M.; Imaizumi, T. Improved multistep ahead photovoltaic power prediction model based on LSTM and self-attention with weather forecast data. Appl. Energy 2024, 359, 122709. [Google Scholar] [CrossRef]
  63. de Oliveira, J.T.; de Carvalho Costa, L.R.; Agnol, G.D.; Féris, L.A. Experimental design and data prediction by Bayesian statistics for adsorption of tetracycline in a GAC fixed-bed column. Sep. Purif. Technol. 2023, 319, 124097. [Google Scholar] [CrossRef]
  64. Yin, C.-X.; Peng, Q.-K. A careful assessment of recommendation algorithms related to dimension reduction techniques. Knowl.-Based Syst. 2012, 27, 407–423. [Google Scholar] [CrossRef]
  65. Faraj, T.; Tarawneh, Q.; Oroud, I. The applicability of the tourism climate index in a hot arid environment: Saudi Arabia as a case study. Int. J. Environ. Sci. Technol. 2023, 20, 3849–3860. [Google Scholar] [CrossRef]
  66. World Travel & Tourism Council, “Saudi Arabia Travel & Tourism Economic Impact Research”, World Travel & Tourism Council, June 2024. Available online: https://researchhub.wttc.org/product/saudi-arabia-economic-impact-report (accessed on 16 February 2025).
  67. Tabash, M.I.; Farooq, U.; El Refae, G.A.; Al-Faryan, M.A.S.; Athamena, B. Impact of religious tourism on the economic development, energy consumption and environmental degradation: Evidence from the Kingdom of Saudi Arabia. Tour. Rev. 2023, 78, 1004–1018. [Google Scholar] [CrossRef]
  68. Gössling, S.; Peeters, P. Assessing tourism’s global environmental impact 1900–2050. J. Sustain. Tour. 2015, 23, 639–659. [Google Scholar] [CrossRef]
  69. Vanhove, N. Tourism policy—Between competitiveness and sustainability: The case of Bruges. Tour. Rev. 2002, 57, 34–40. [Google Scholar] [CrossRef]
  70. Alegre, J.; Sard, M. When demand drops and prices rise. Tourist packages in the Balearic Islands during the economic crisis. Tour. Manag. 2015, 46, 375–385. [Google Scholar] [CrossRef]
  71. Lai, L.-h.; Graefe, A.R. Identifying market potential and destination choice factors of Taiwanese overseas travelers. J. Hosp. Leis. Mark. 1999, 6, 45–65. [Google Scholar] [CrossRef]
  72. Calveras, A. All-inclusive and value creation in hospitality: Evidence from a mature destination, 2001–2017. Tour. Manag. 2019, 74, 234–246. [Google Scholar] [CrossRef]
  73. Evangelopoulos, N.E. Latent semantic analysis. Wiley Interdiscip. Rev. Cogn. Sci. 2013, 4, 683–692. [Google Scholar] [CrossRef]
  74. Hinton, G.E. Deep belief networks. Scholarpedia 2009, 4, 5947. [Google Scholar] [CrossRef]
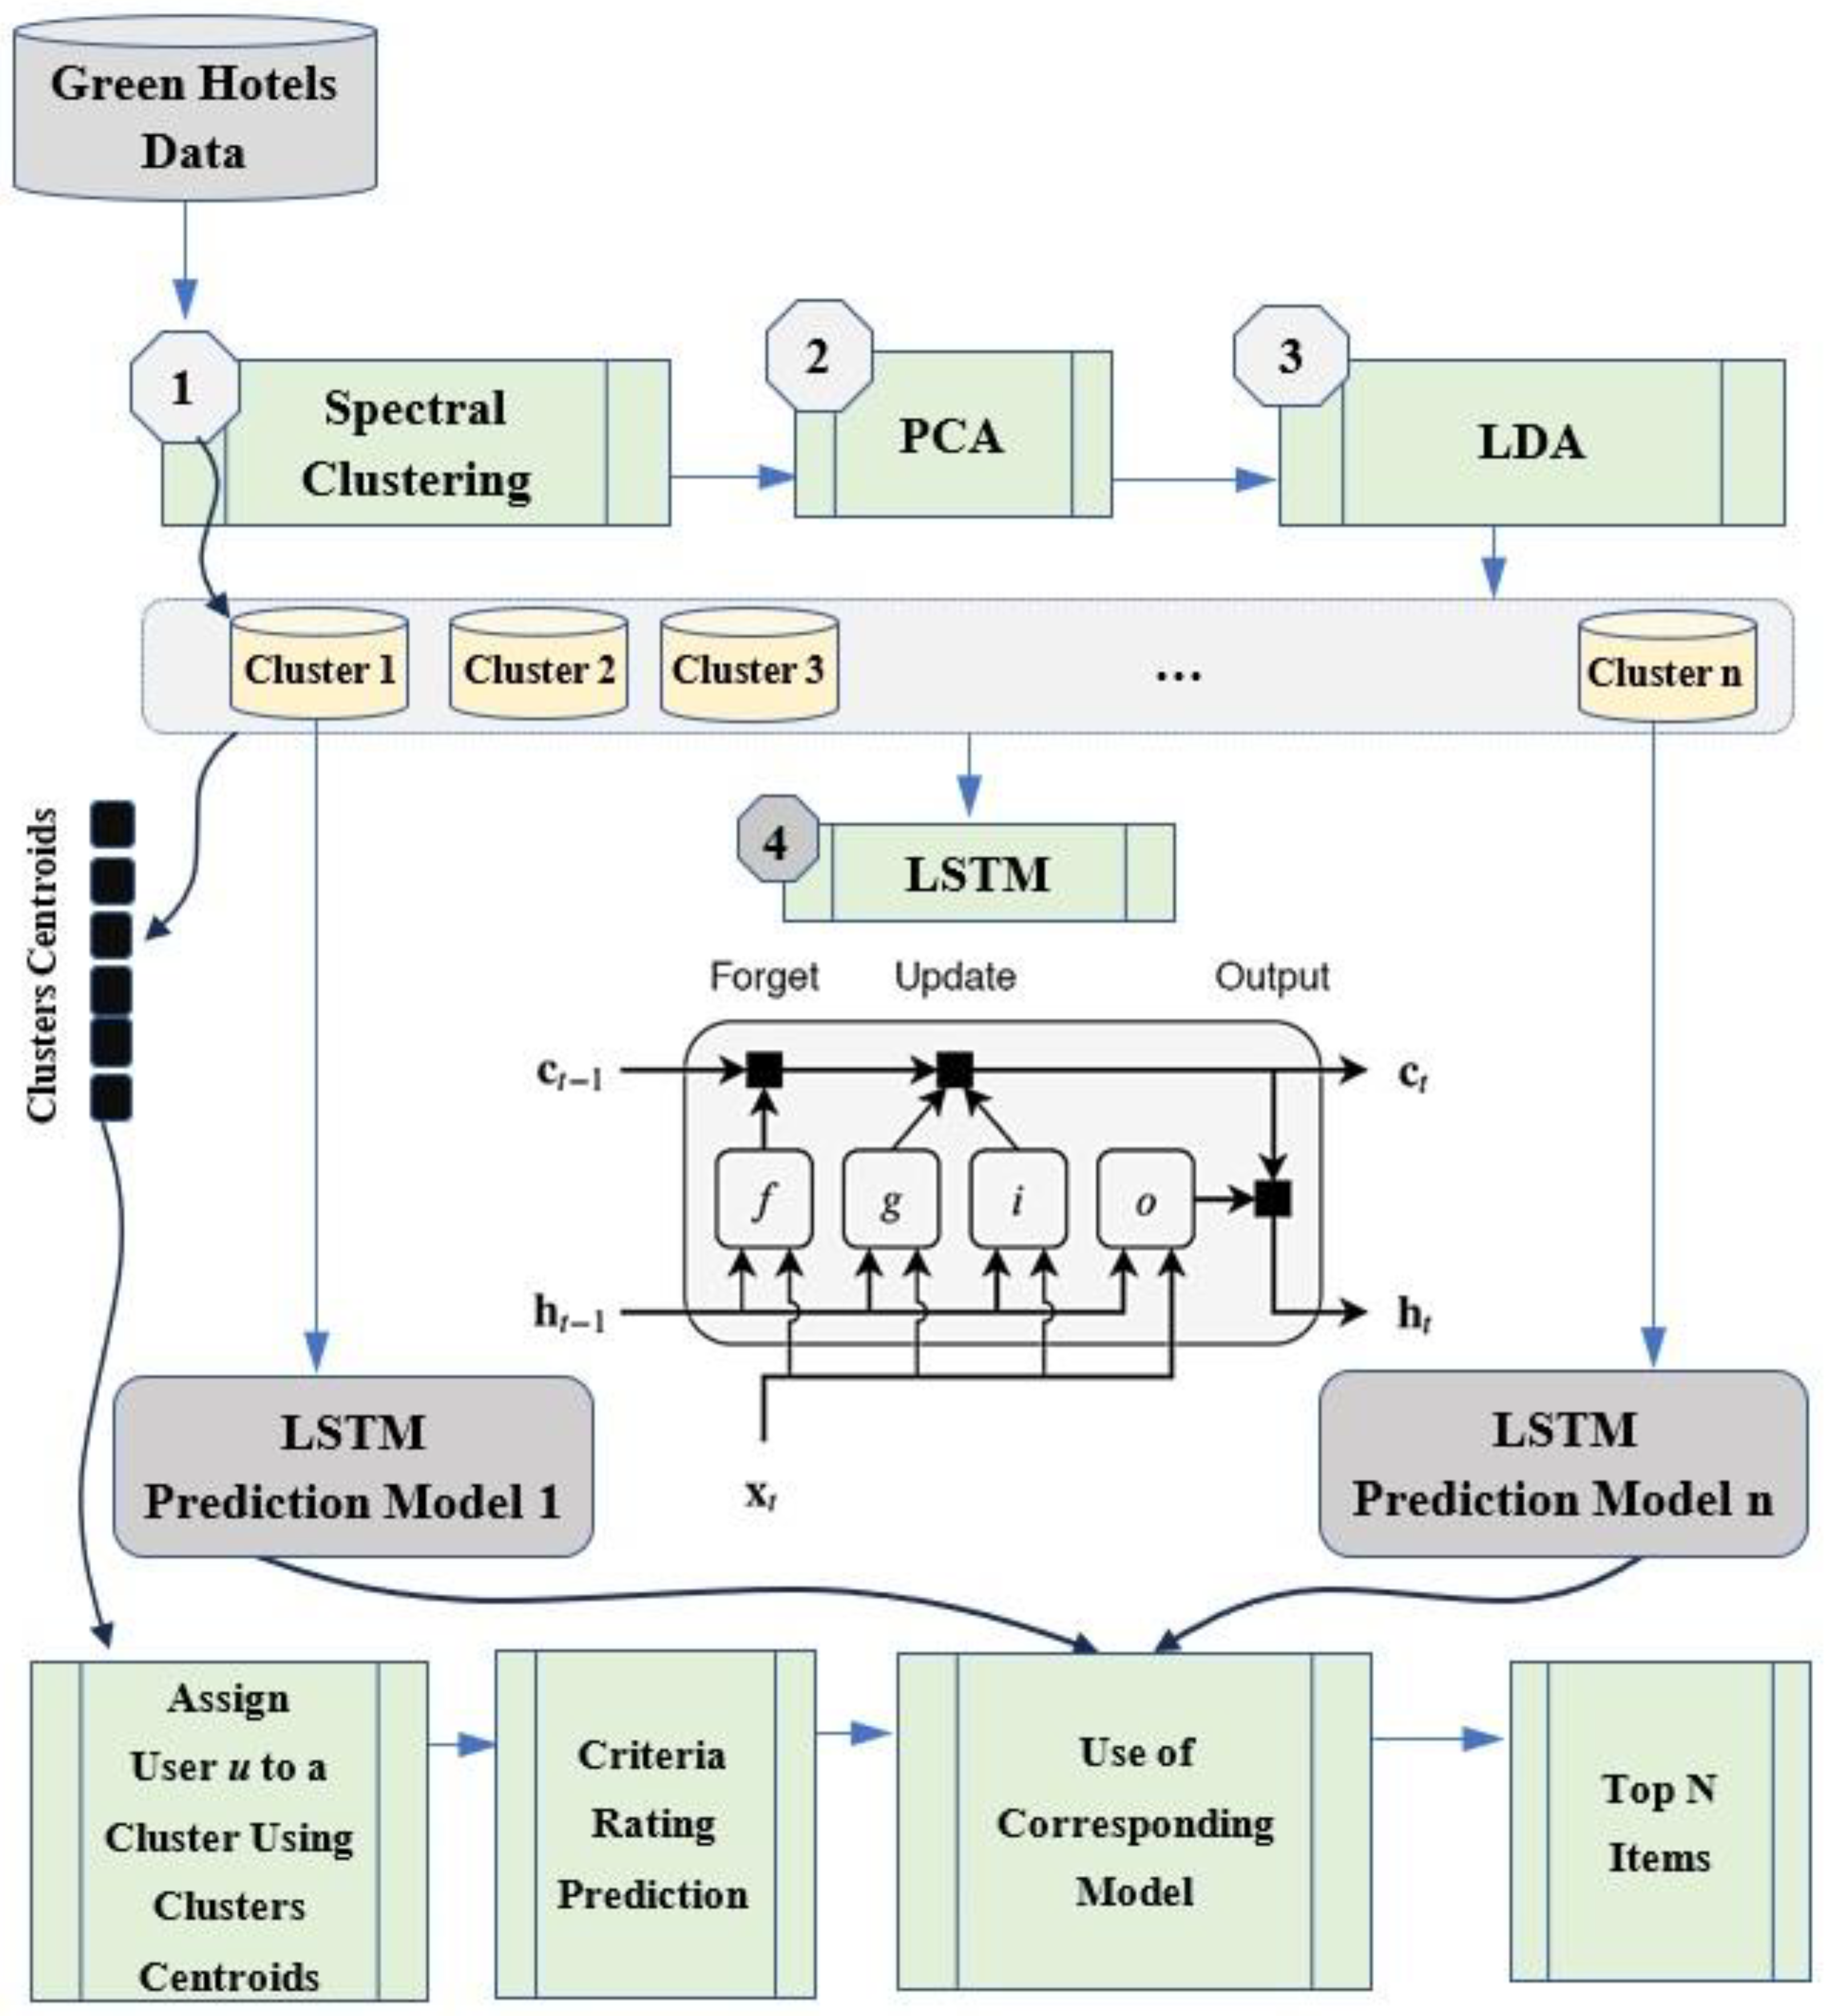
Figure 1. Research Method.
Sustainability 17 02328 g001
Figure 2. The generative process of LDA.
Sustainability 17 02328 g002
Figure 3. Three essential gates in LSTM.
Sustainability 17 02328 g003
Figure 4. LSTM unit.
Sustainability 17 02328 g004
Figure 5. Overall ratings range and frequency.
Sustainability 17 02328 g005
Figure 6. The average SC value for different numbers of clusters.
Sustainability 17 02328 g006
Figure 7. Clusters generated by spectral clustering.
Sustainability 17 02328 g007aSustainability 17 02328 g007b
Figure 8. Prediction of overall ratings by LSTM in Cluster 1.
Sustainability 17 02328 g008
Figure 9. Prediction of overall ratings by LSTM in Cluster 2.
Sustainability 17 02328 g009
Figure 10. The MAE results for different levels of sparsity.
Sustainability 17 02328 g010
Table 1. The mean values of general dimensions in 4 clusters.
Clusters
Cluster 1Cluster 2Cluster 3Cluster 4
MeanMeanMeanMean
Location3444
Rooms3.243963.489773.565483.79957
Value3334
Cleanliness4424
Service3444
Sleep Quality3.749301.634833.813213.89688
Table 2. The mean values of green dimensions in 4 clusters.
AspectsClusters
Cluster 1Cluster 2Cluster 3Cluster 4
MeanMeanMeanMean
Green Spaces Aspect0.5081620.5085210.5124530.501618
Waste Management Aspect0.5059020.5027550.4831360.506771
Energy Efficiency Aspect0.497880.493910.485530.51057
Table 3. The mean values of green dimensions in 4 clusters versus overall ratings.
Green Spaces AspectWaste Management AspectEnergy Efficiency Aspect
ClustersClustersClusters
Cluster 1Cluster 2Cluster 3Cluster 4Cluster 1Cluster 2Cluster 3Cluster 4Cluster 1Cluster 2Cluster 3Cluster 4
MeanMeanMeanMeanMeanMeanMeanMeanMeanMeanMeanMean
Overall Ratings1.0000.4540.4160.4510.4180.4360.4310.4210.3540.4630.4680.4320.309
2.0000.4800.5010.4880.4580.4700.4900.4570.4490.4720.5020.4500.475
3.0000.5110.5100.5240.5000.5290.4830.4650.5080.4920.4880.4920.511
4.0000.5510.5680.5470.5140.5430.5830.5840.5210.5610.4870.5300.532
5.0000.6920.5260.5700.5310.6260.6050.5910.5510.6050.5850.6300.517
Table 4. The evaluation results for various prediction methods for overall ratings prediction.
Prediction MethodsRMSEMAE R a d j u s t e d 2
Long Short-Term Memory0.990.820.98
Support Vector Regression1.100.980.94
Gaussian Process Regression1.120.990.91
Artificial Neural Network Regression1.151.020.85
Decision Tree Regression1.181.130.82
Linear Regression1.201.090.80
Stepwise Regression1.221.160.78
Table 5. Precision at Top @7, Top @5, and MAE results.
MethodPrecision at Top @5Precision at Top @7MAE
PCA [64]69.1168.151.18
Total-Reg [20]66.3164.331.21
Standard-CF [20]63.2262.99 1.41
Spectral Clustering + Stepwise Regression72.1271.181.09
Spectral Clustering + Gaussian Process Regression75.3274.670.99
Spectral Clustering + Linear Regression71.4570.121.16
Spectral Clustering + Artificial Neural Network Regression73.1772.111.02
Spectral Clustering + Decision Tree Regression72.8571.991.13
Spectral Clustering + Support Vector Regression77.4475.750.98
LDA + LSTM78.3376.770.96
LDA + Spectral Clustering + LSTM89.4488.210.84
Table 6. The evaluation of the Top-N recommendation accuracy using the F-measure for LDA + LSTM.
LDA + LSTM4 Neighbor8 Neighbor12 Neighbor16 Neighbor20 Neighbor
Top-10.88570.86440.82360.76750.7491
Top-200.87130.83170.79640.73930.7143
Top-400.83440.79540.74480.72690.7082
Top-600.81610.78550.72590.70680.6953
Top-800.79120.77500.69690.68030.6591
Top-1000.79040.76290.66250.64920.6235
LDA + Spectral Clustering + LSTM4 Neighbor8 Neighbor12 Neighbor16 Neighbor20 Neighbor
Top-10.90890.88760.83680.79070.7723
Top-200.89450.85490.80960.75250.7245
Top-400.84760.81860.75800.74010.7204
Top-600.82930.79870.73910.72000.7185
Top-800.81440.78220.71010.70350.6713
Top-1000.80360.77610.67570.66240.6367
Disclaimer/Publisher’s Note: The statements, opinions and data contained in all publications are solely those of the individual author(s) and contributor(s) and not of MDPI and/or the editor(s). MDPI and/or the editor(s) disclaim responsibility for any injury to people or property resulting from any ideas, methods, instructions or products referred to in the content.