


Spatial Morphology of Urban Residential Space: A Complex Network Analysis Integrating Social and Physical Space


Abstract
1. Introduction
2. Literature Review
2.1. Formation of Residential Space and Its Fabric
2.2. Studies on Residential Spatial Structure
2.3. Studies on the Urban Spatial Network
2.4. Complex Network Analysis Applied to the Study of Urban Spatial Fabric
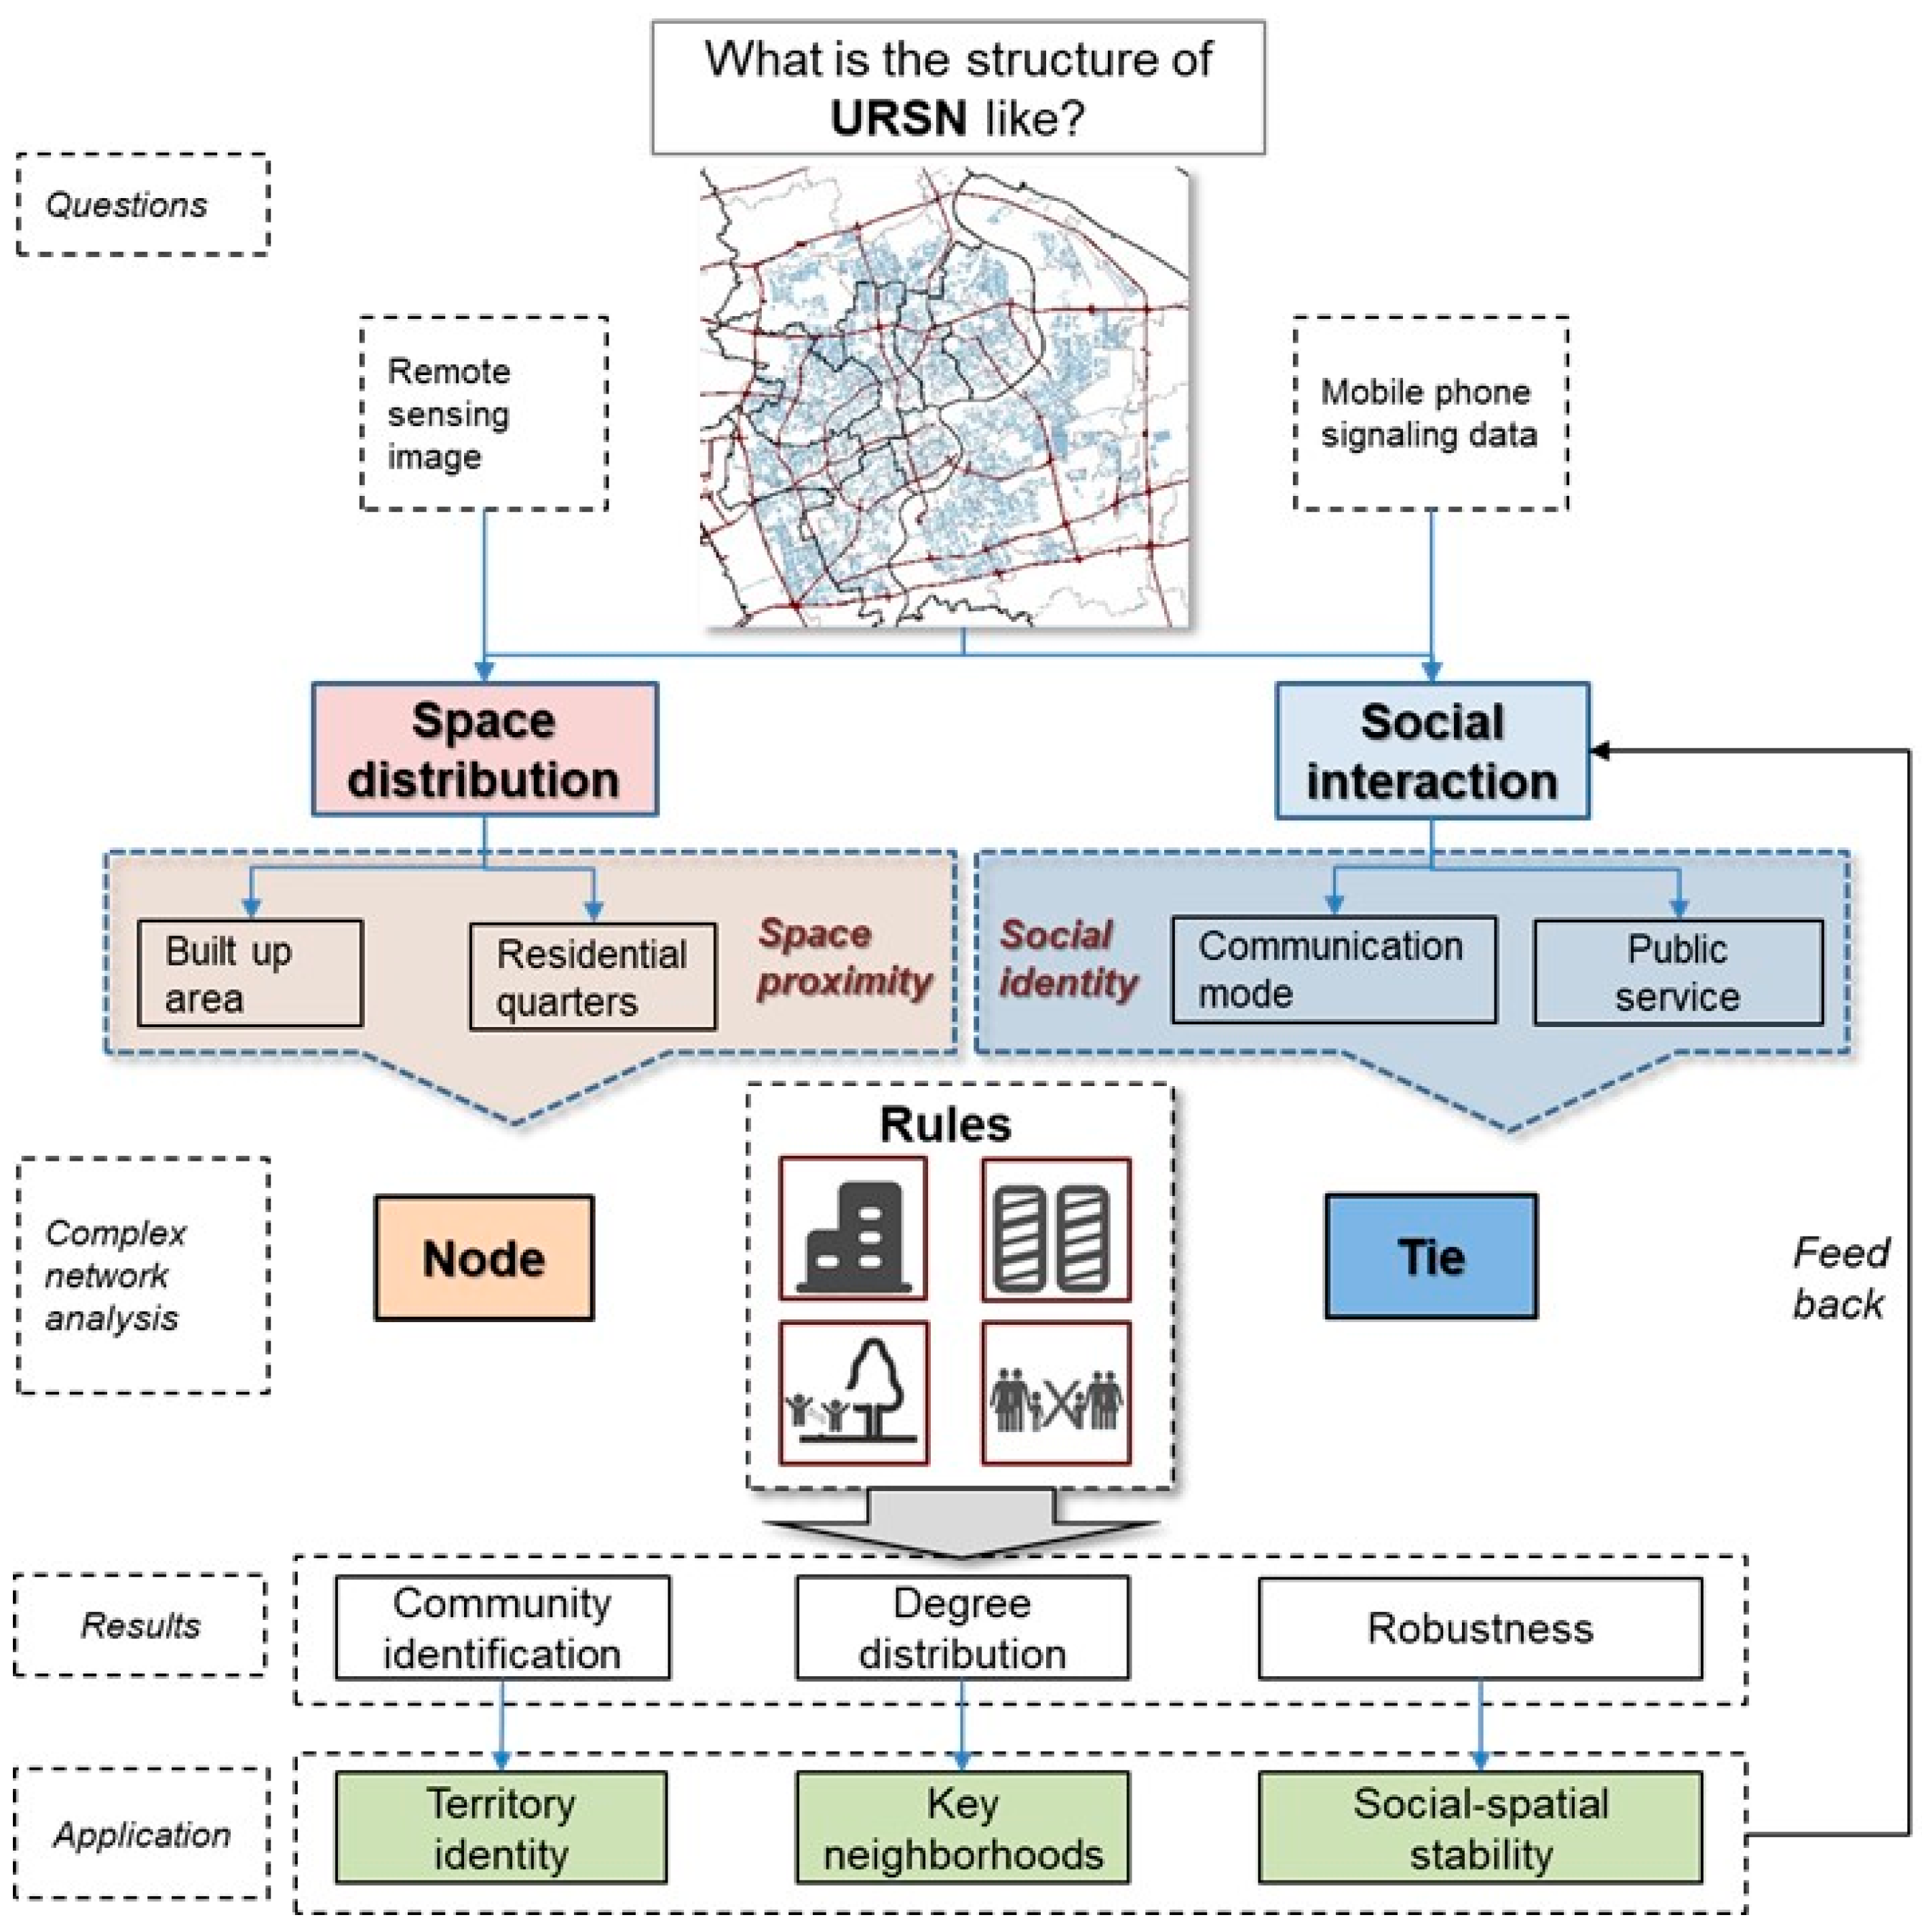
3. Data and Methods
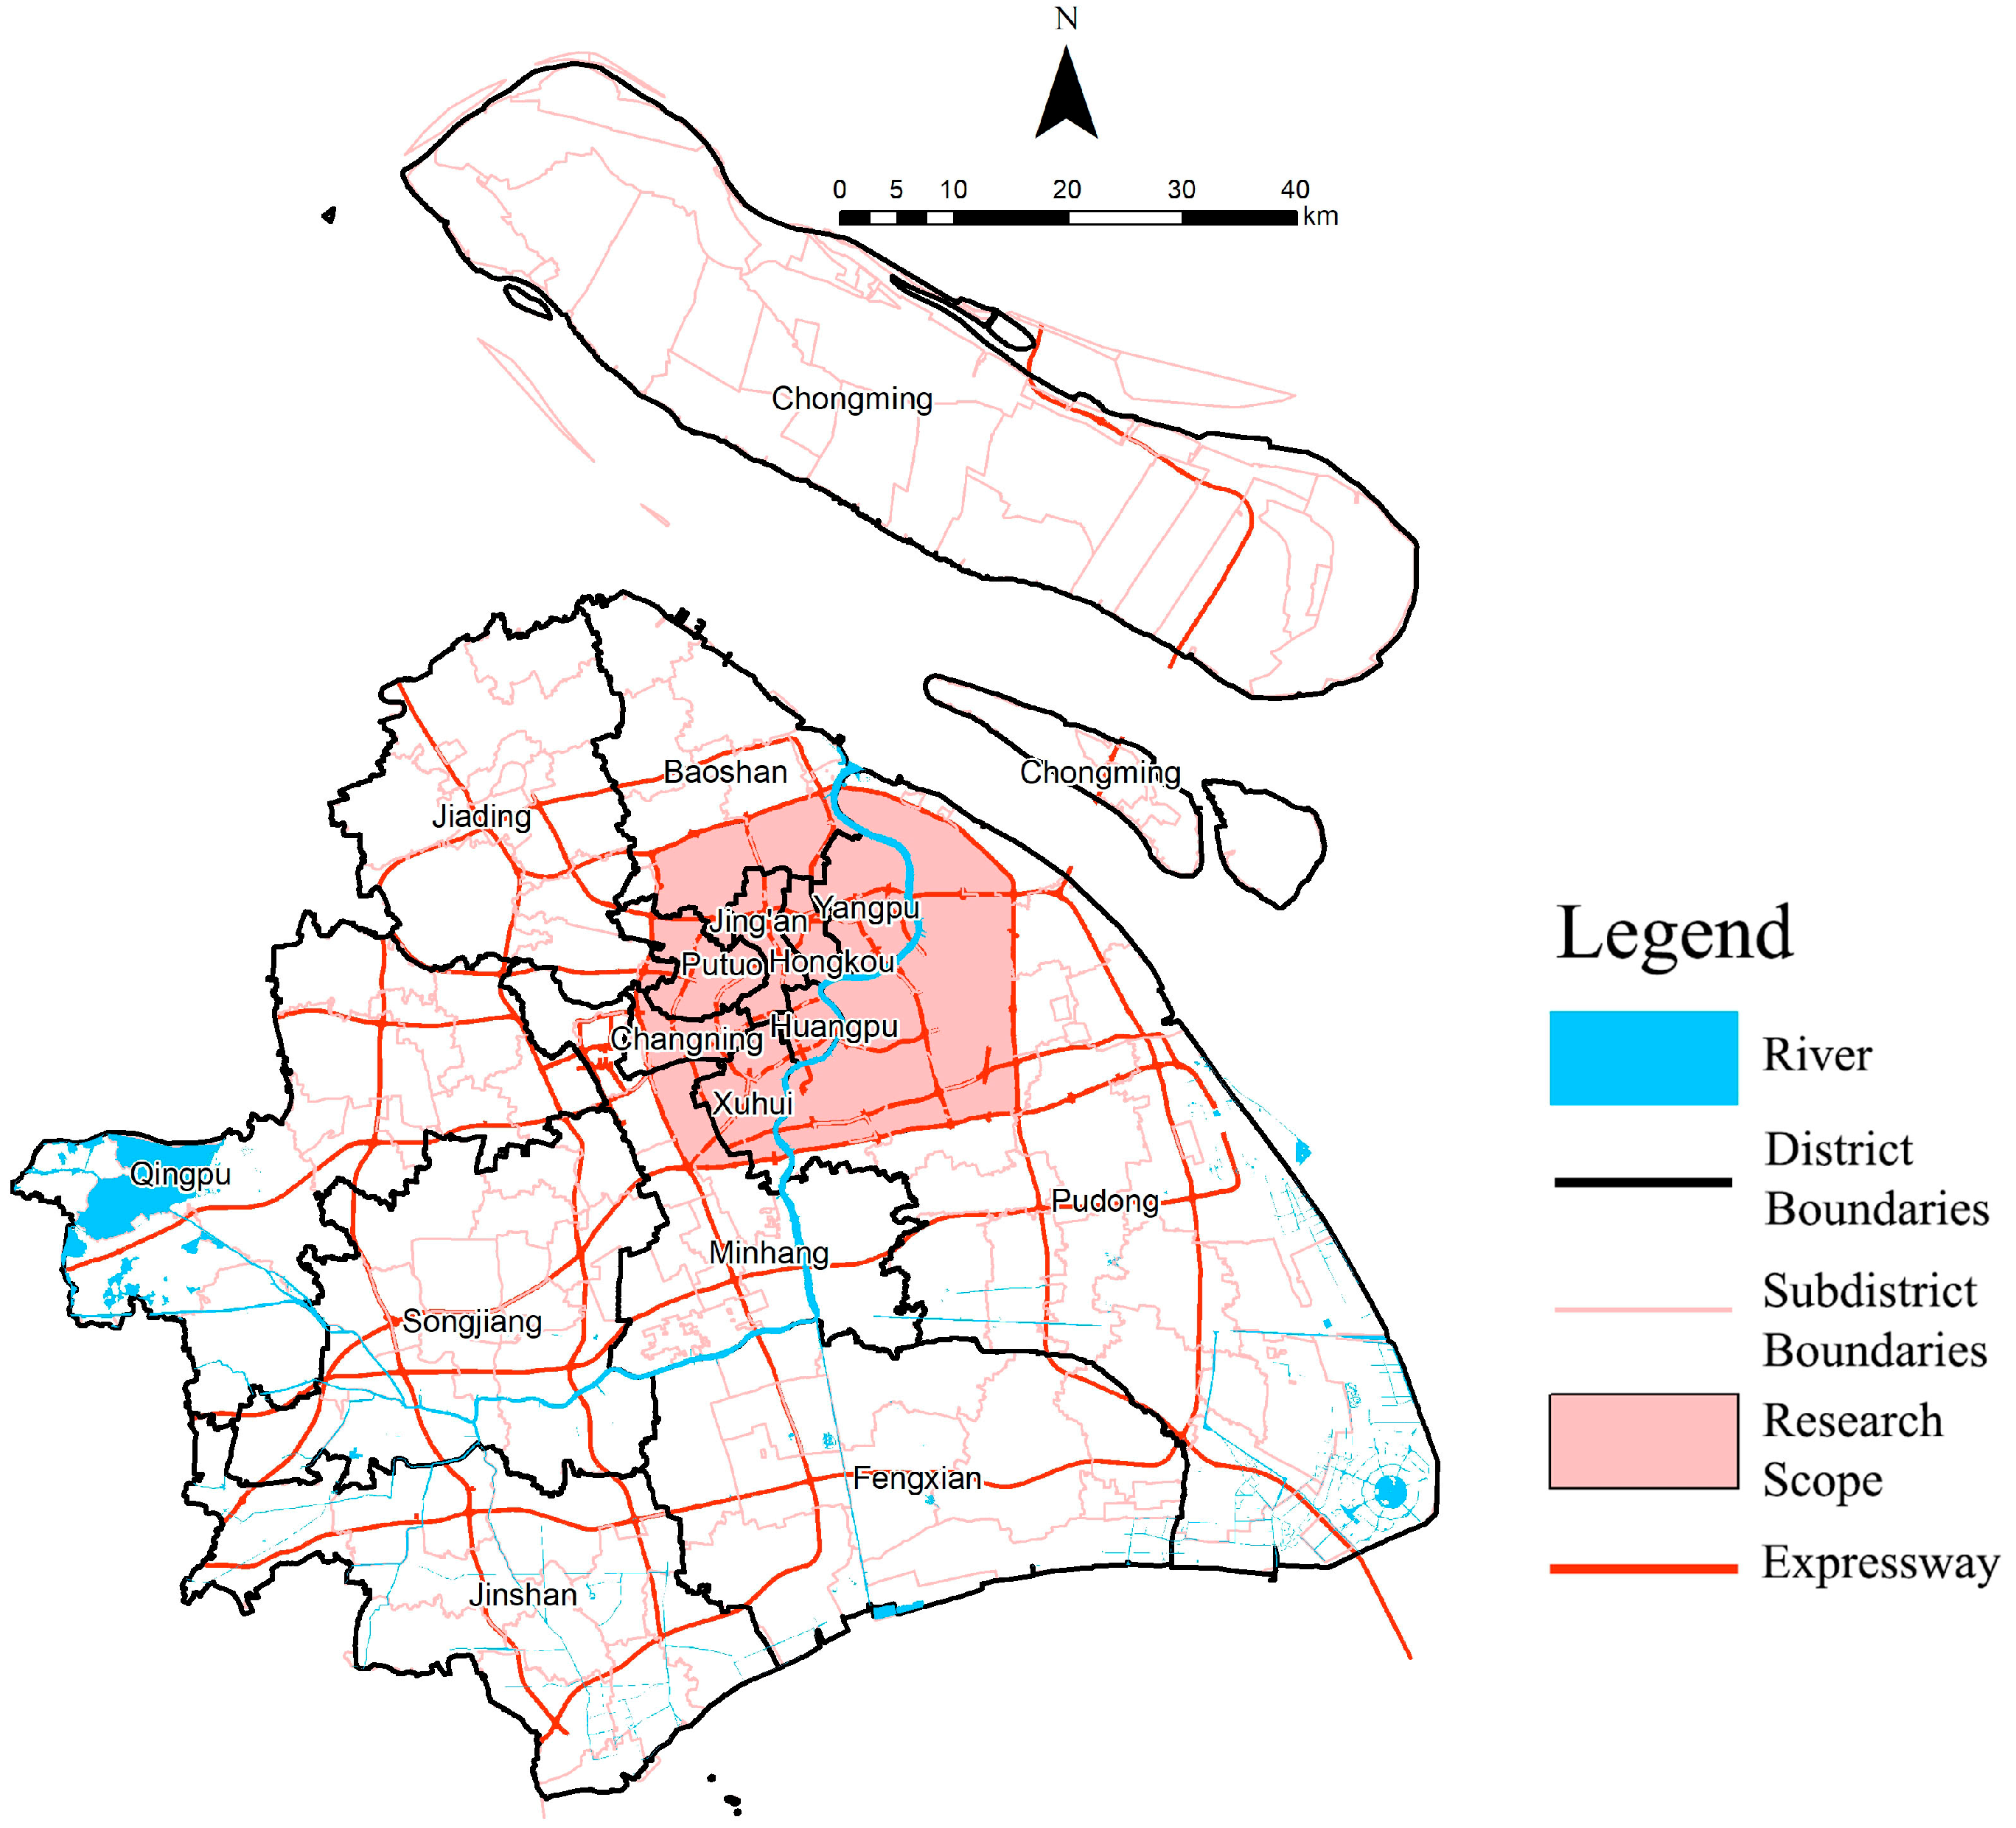
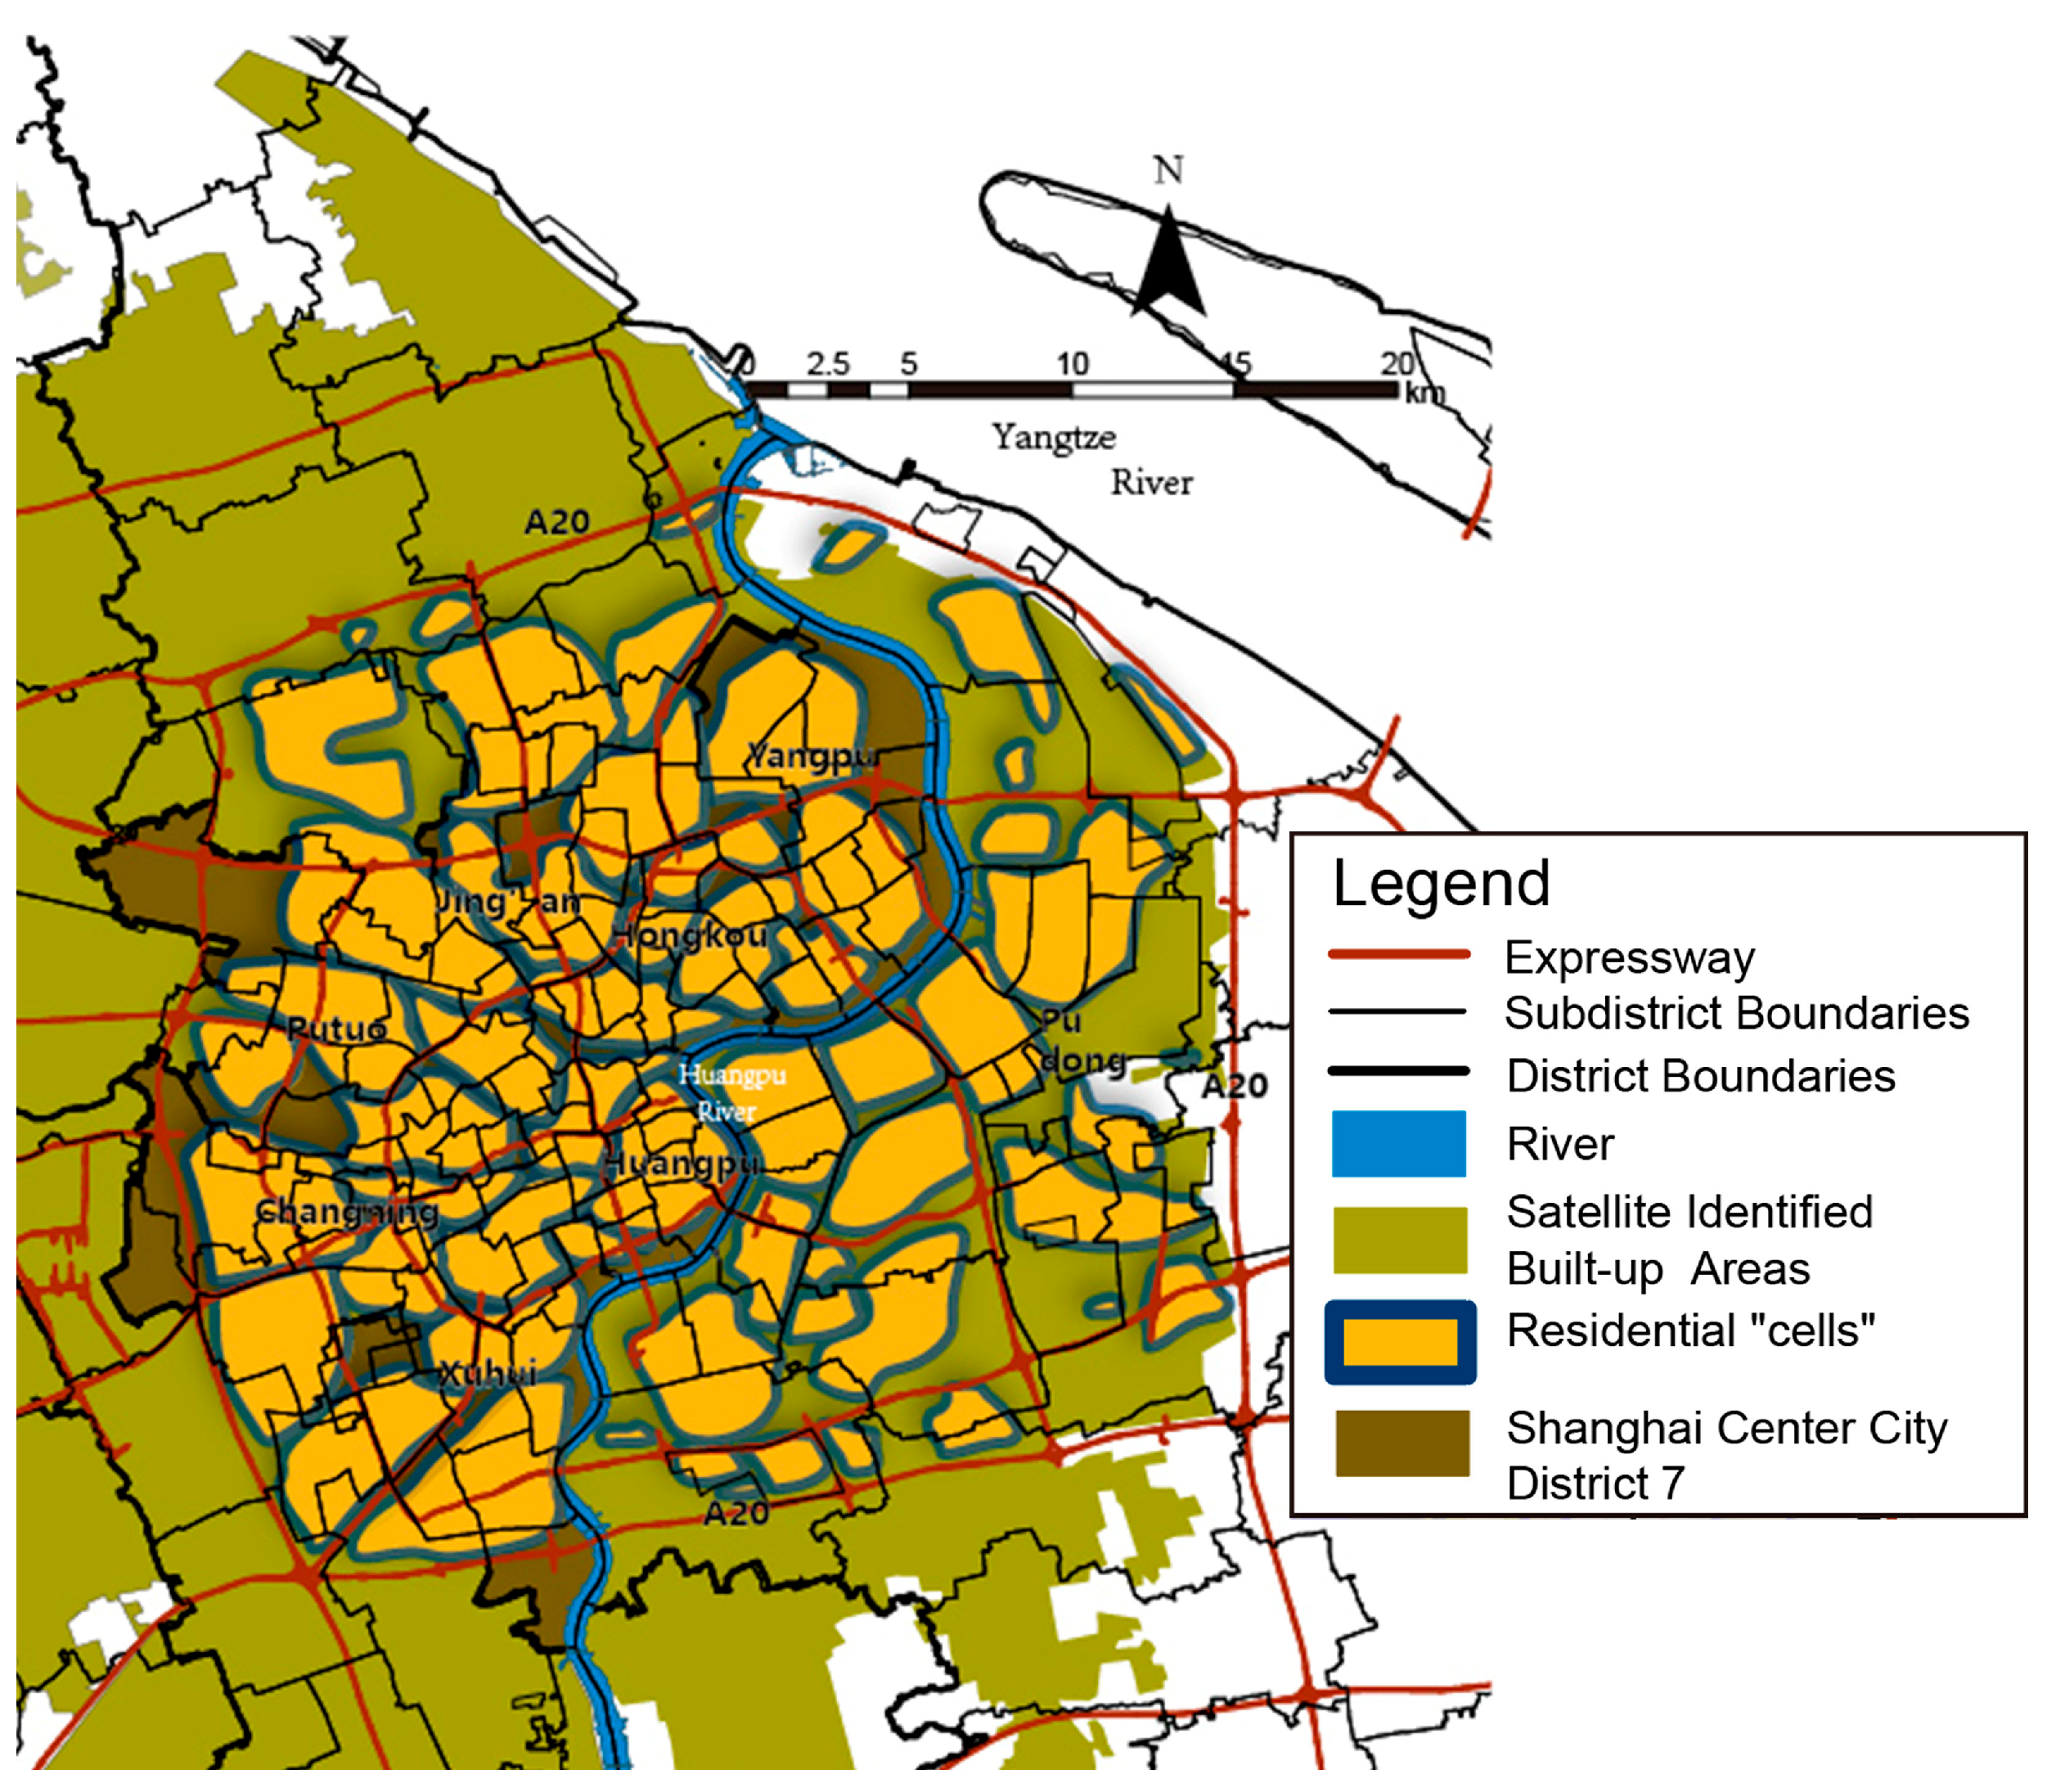
3.1. Study Area
3.2. Study Data Materials
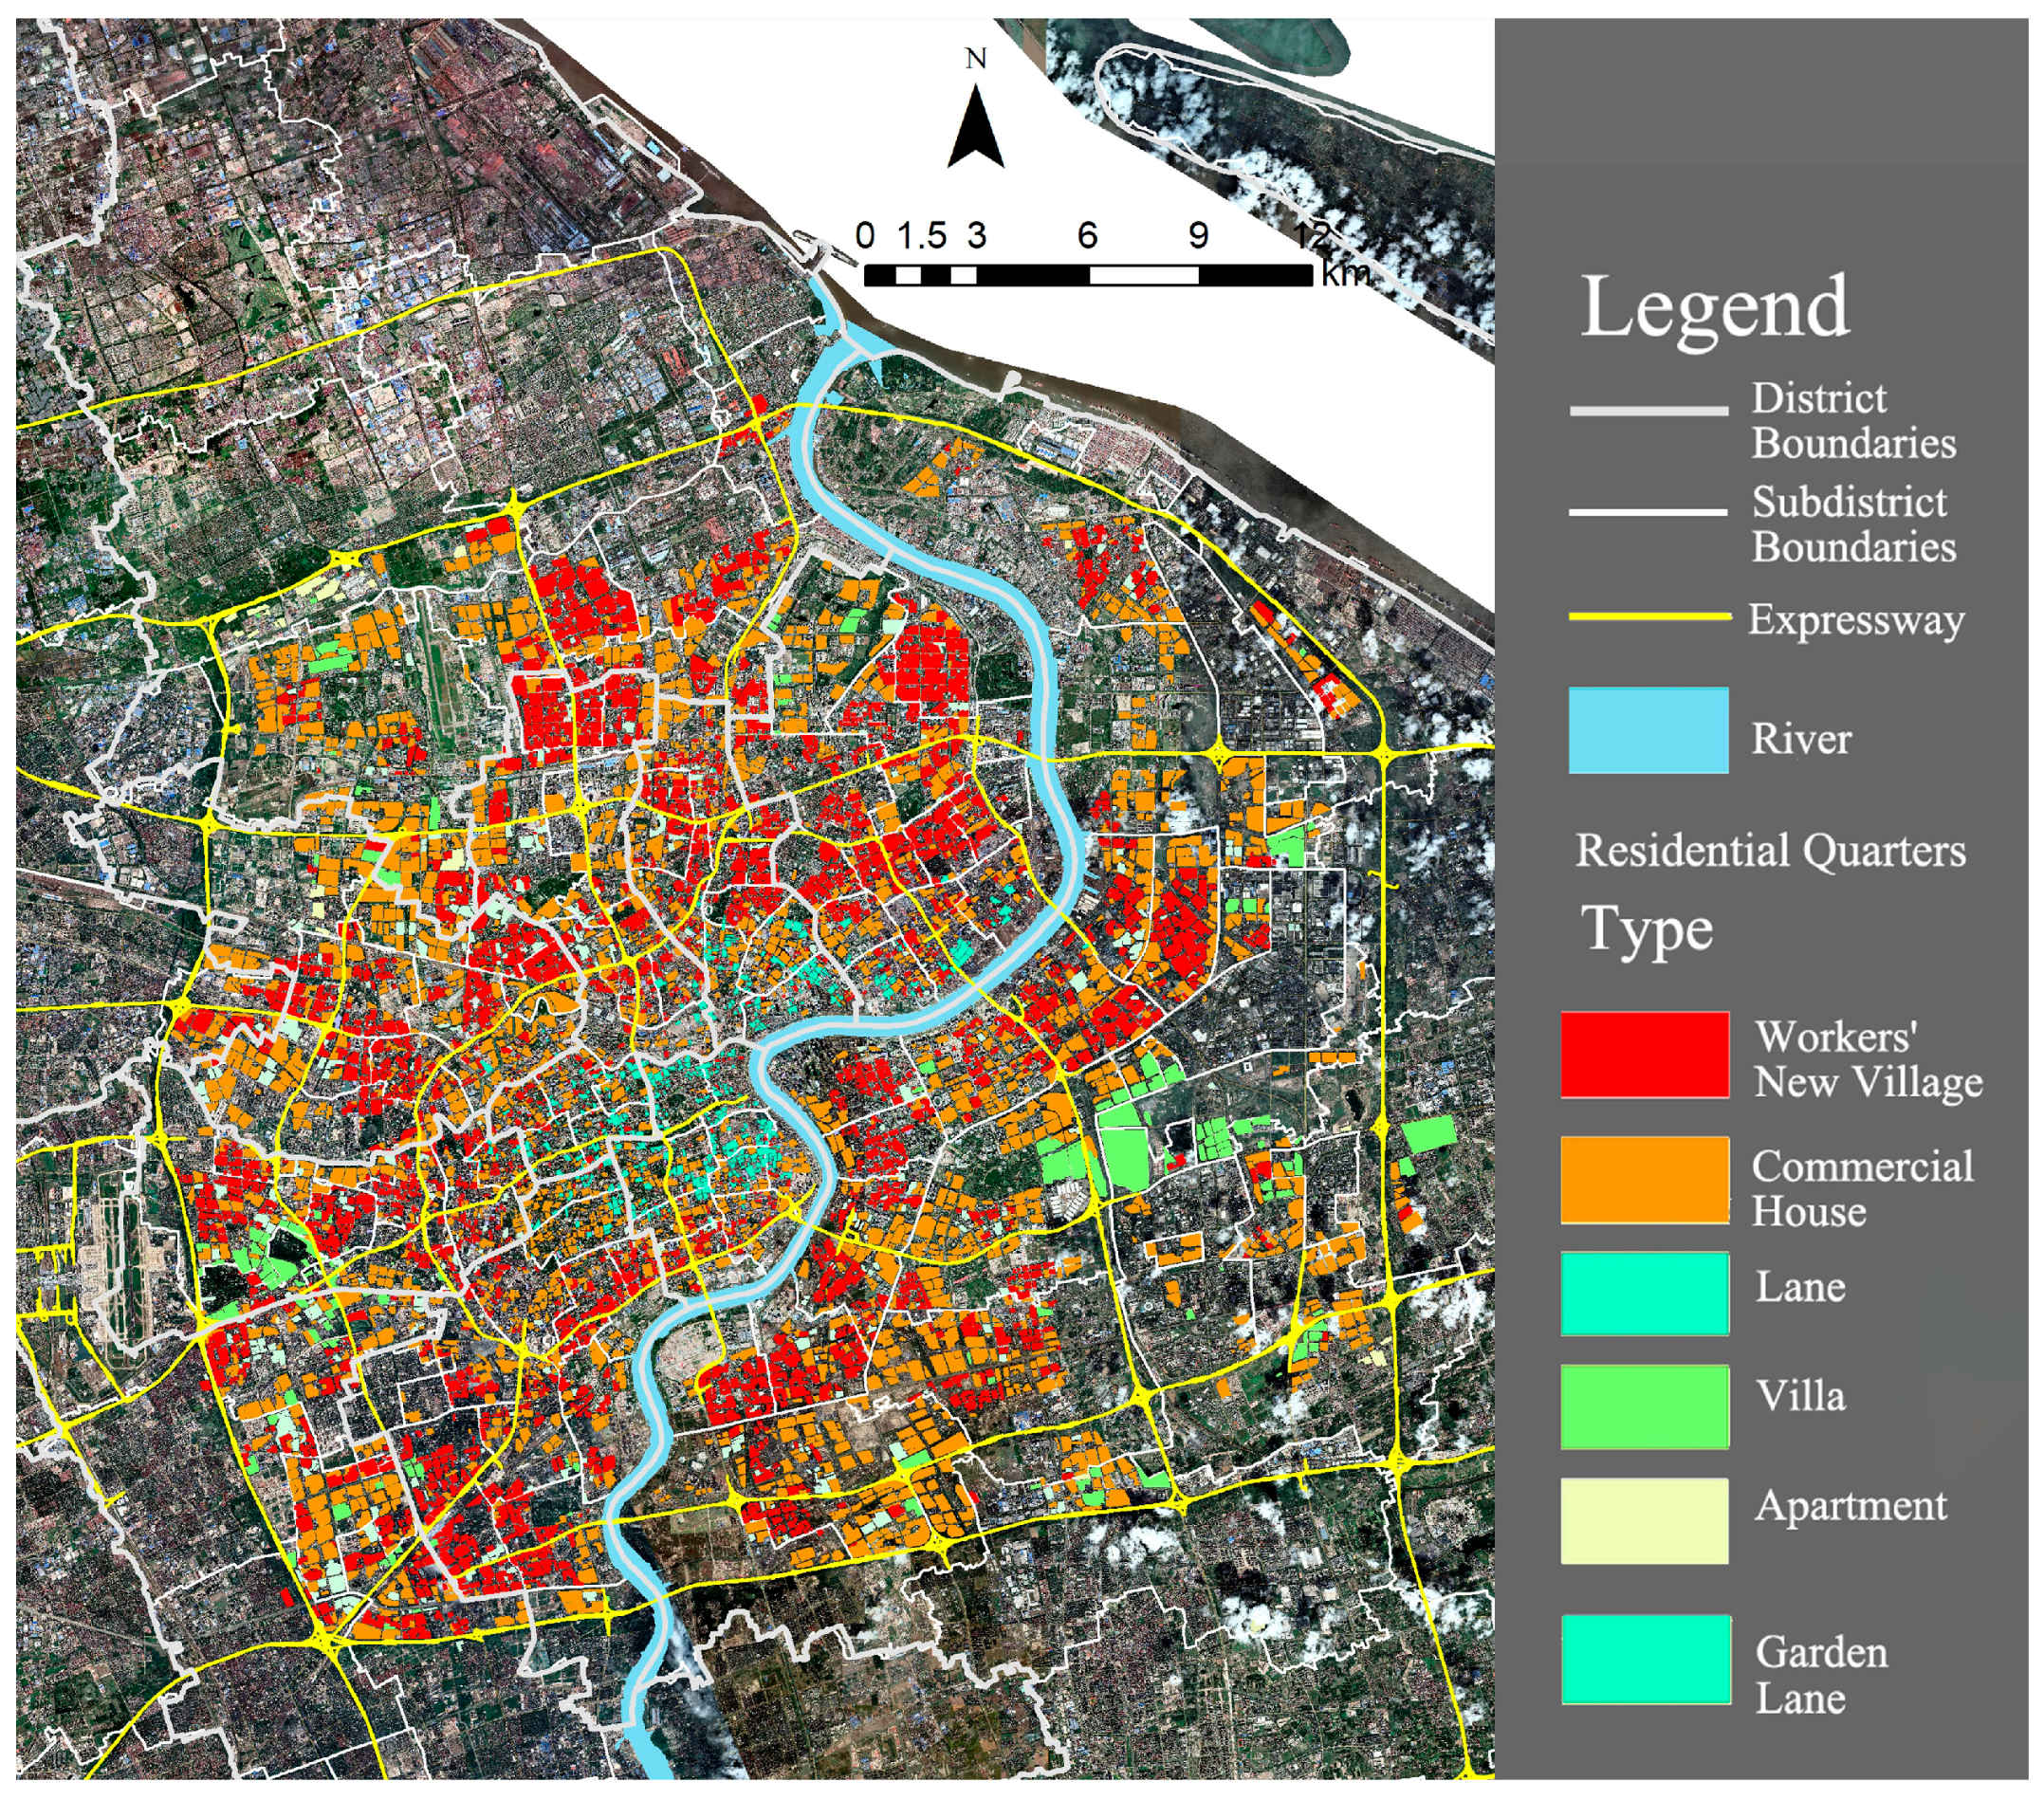
3.2.1. Scope Identification and Type Classification of Different Types of Residential Quarters
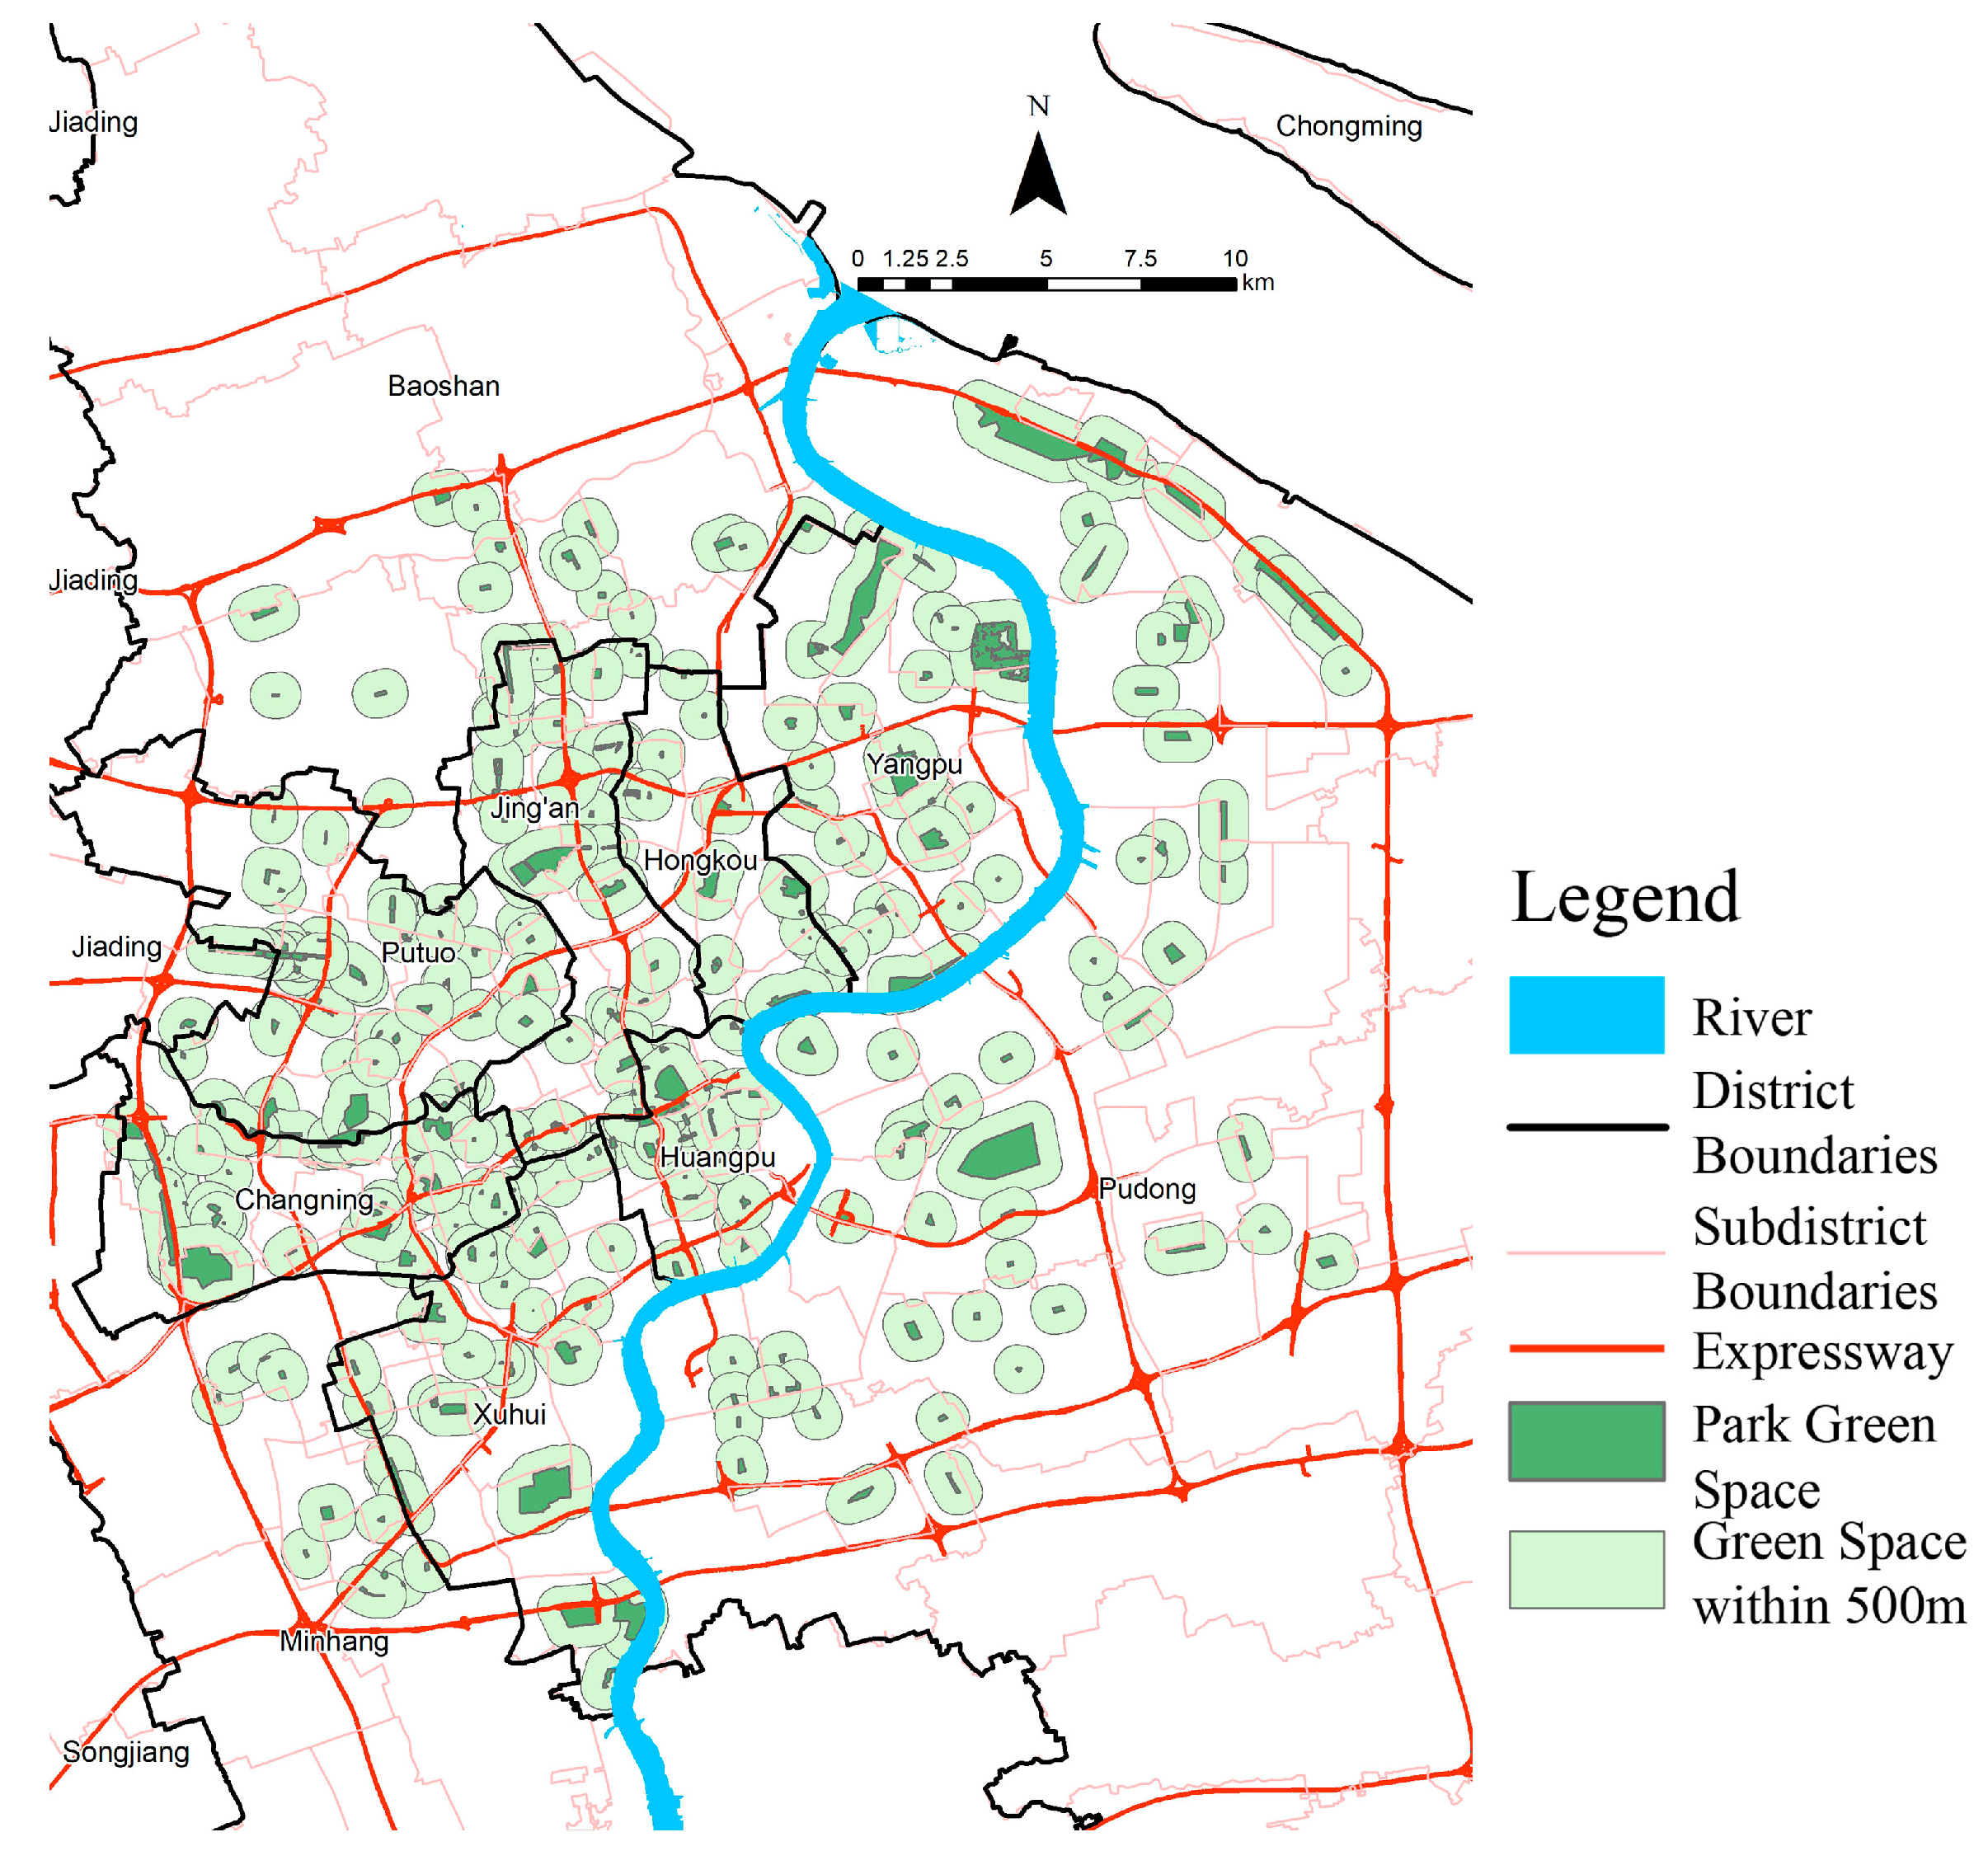
3.2.2. Spatial Distribution of Park Green Spaces
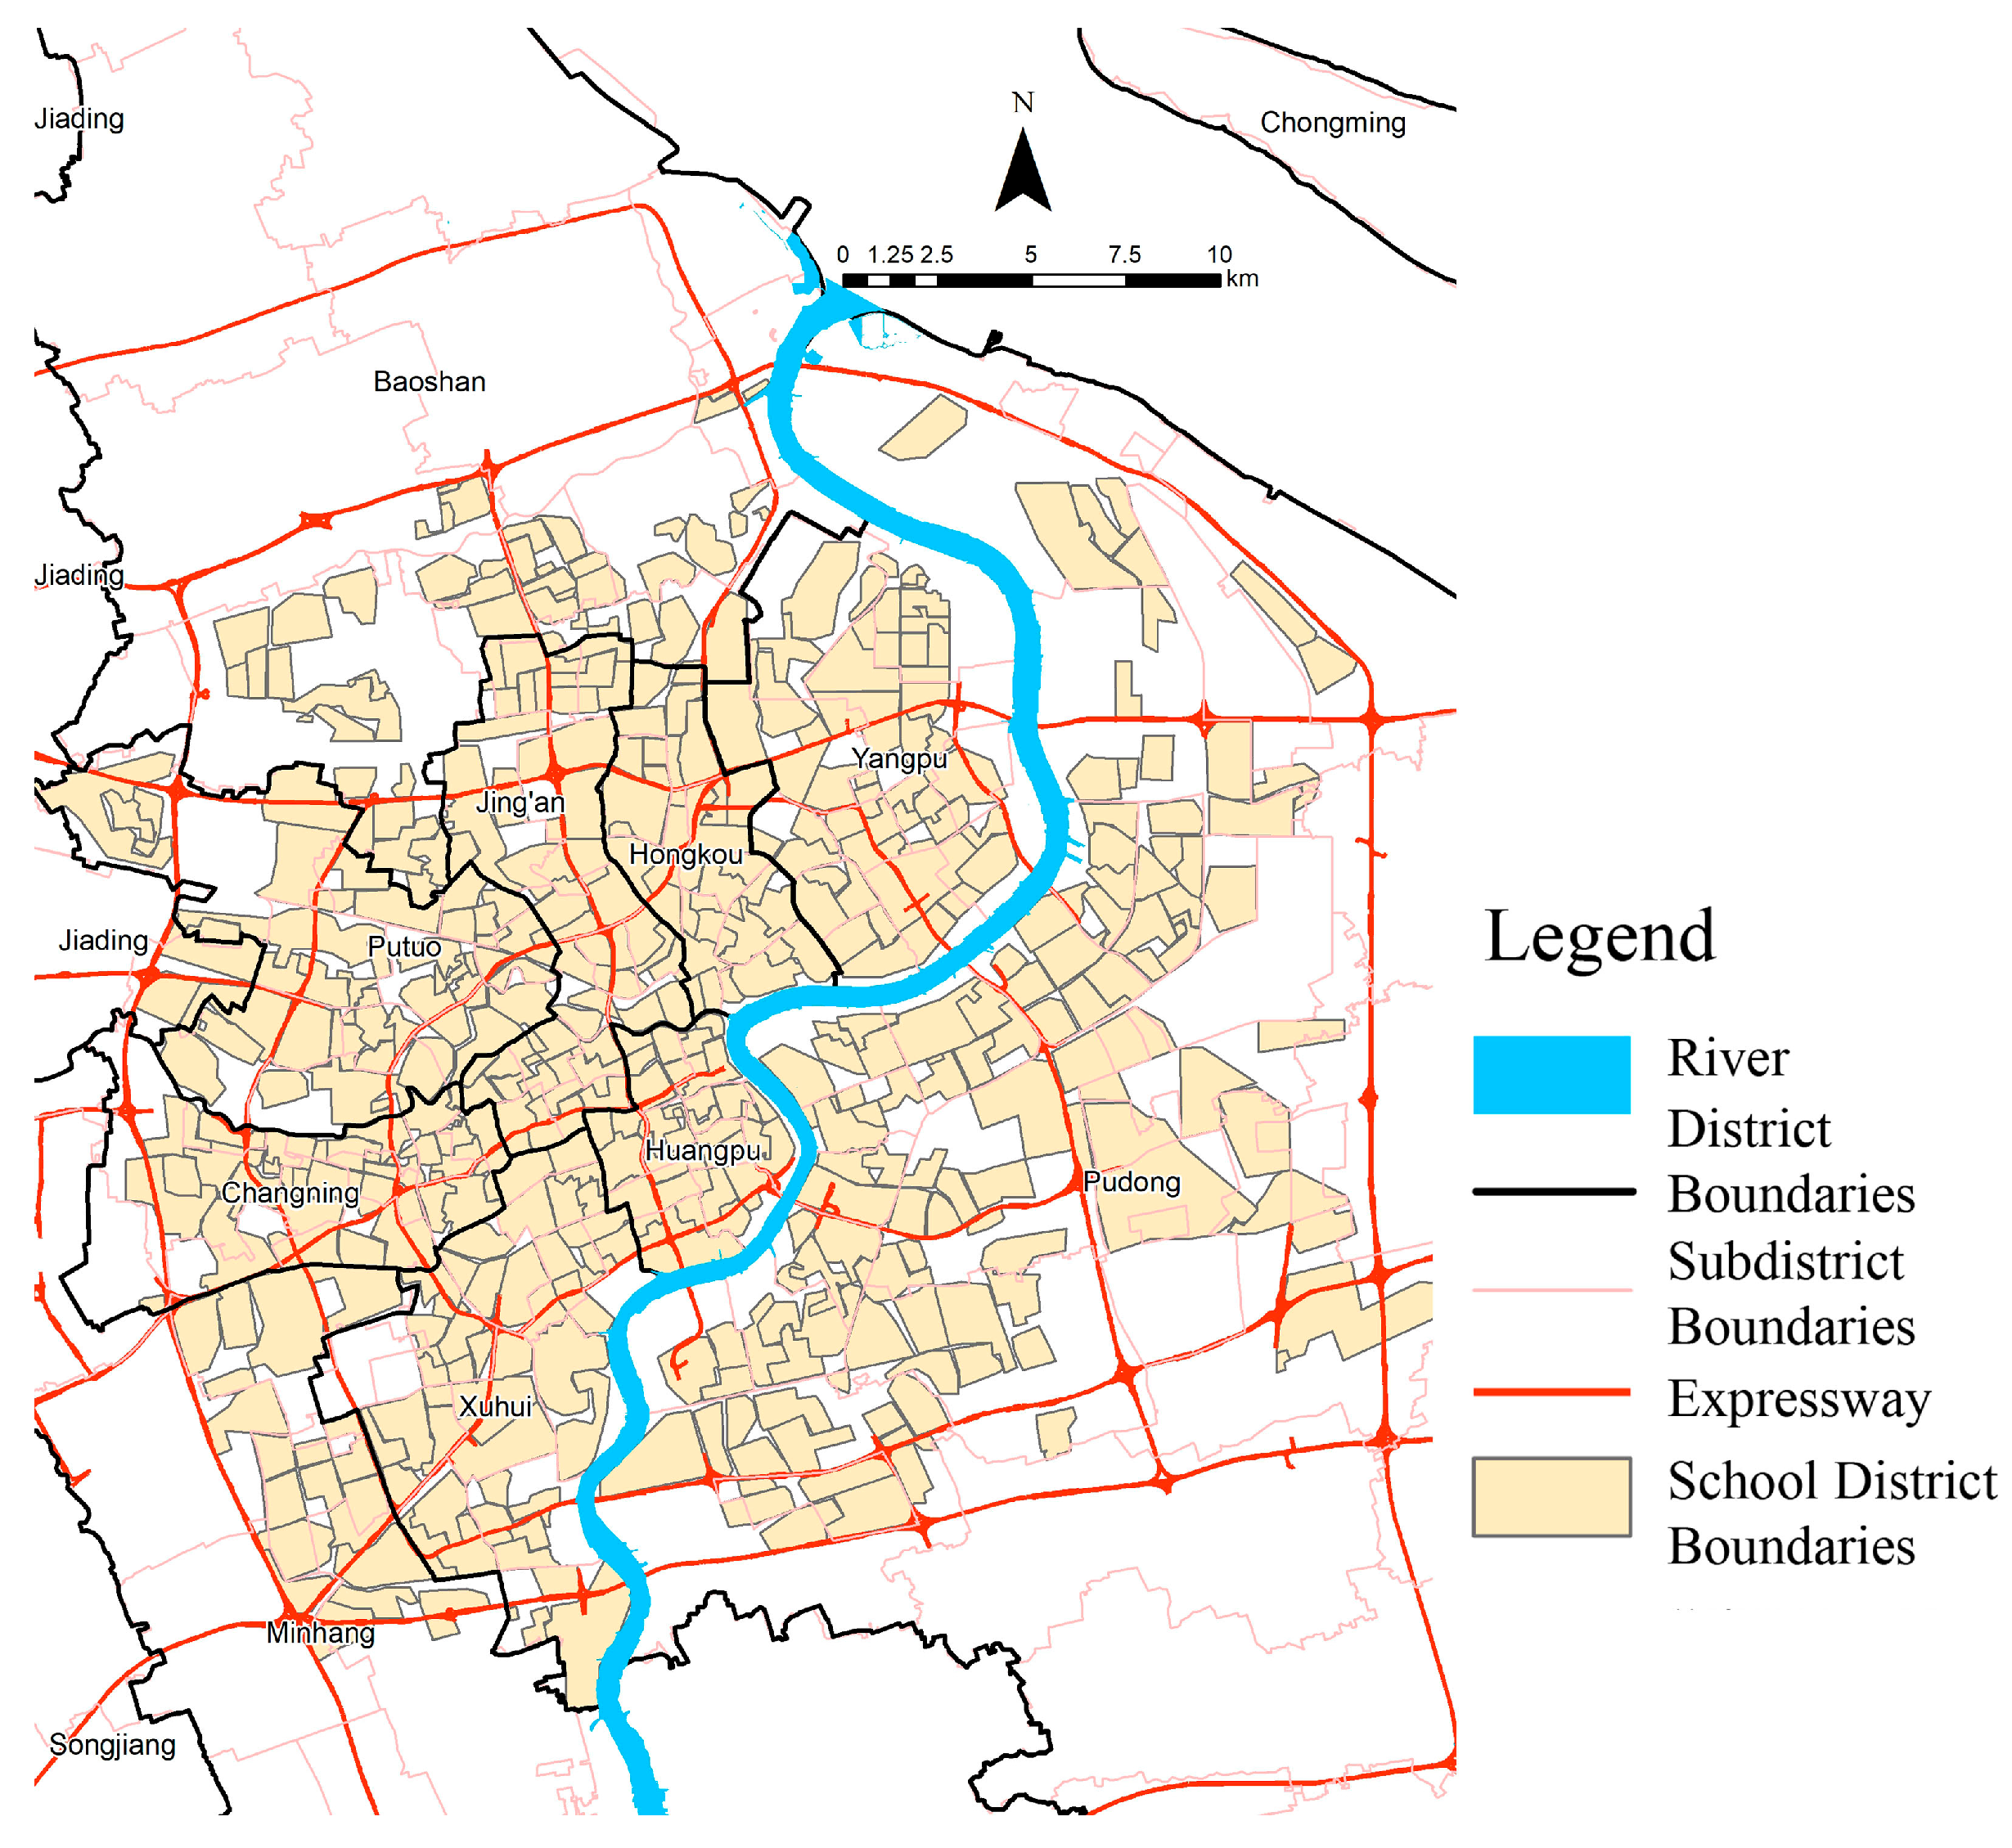
3.2.3. Primary School District Boundaries
3.3. Methodology
3.3.1. Semi-Supervised Learning Based on Spatial Recognition of Satellite Images
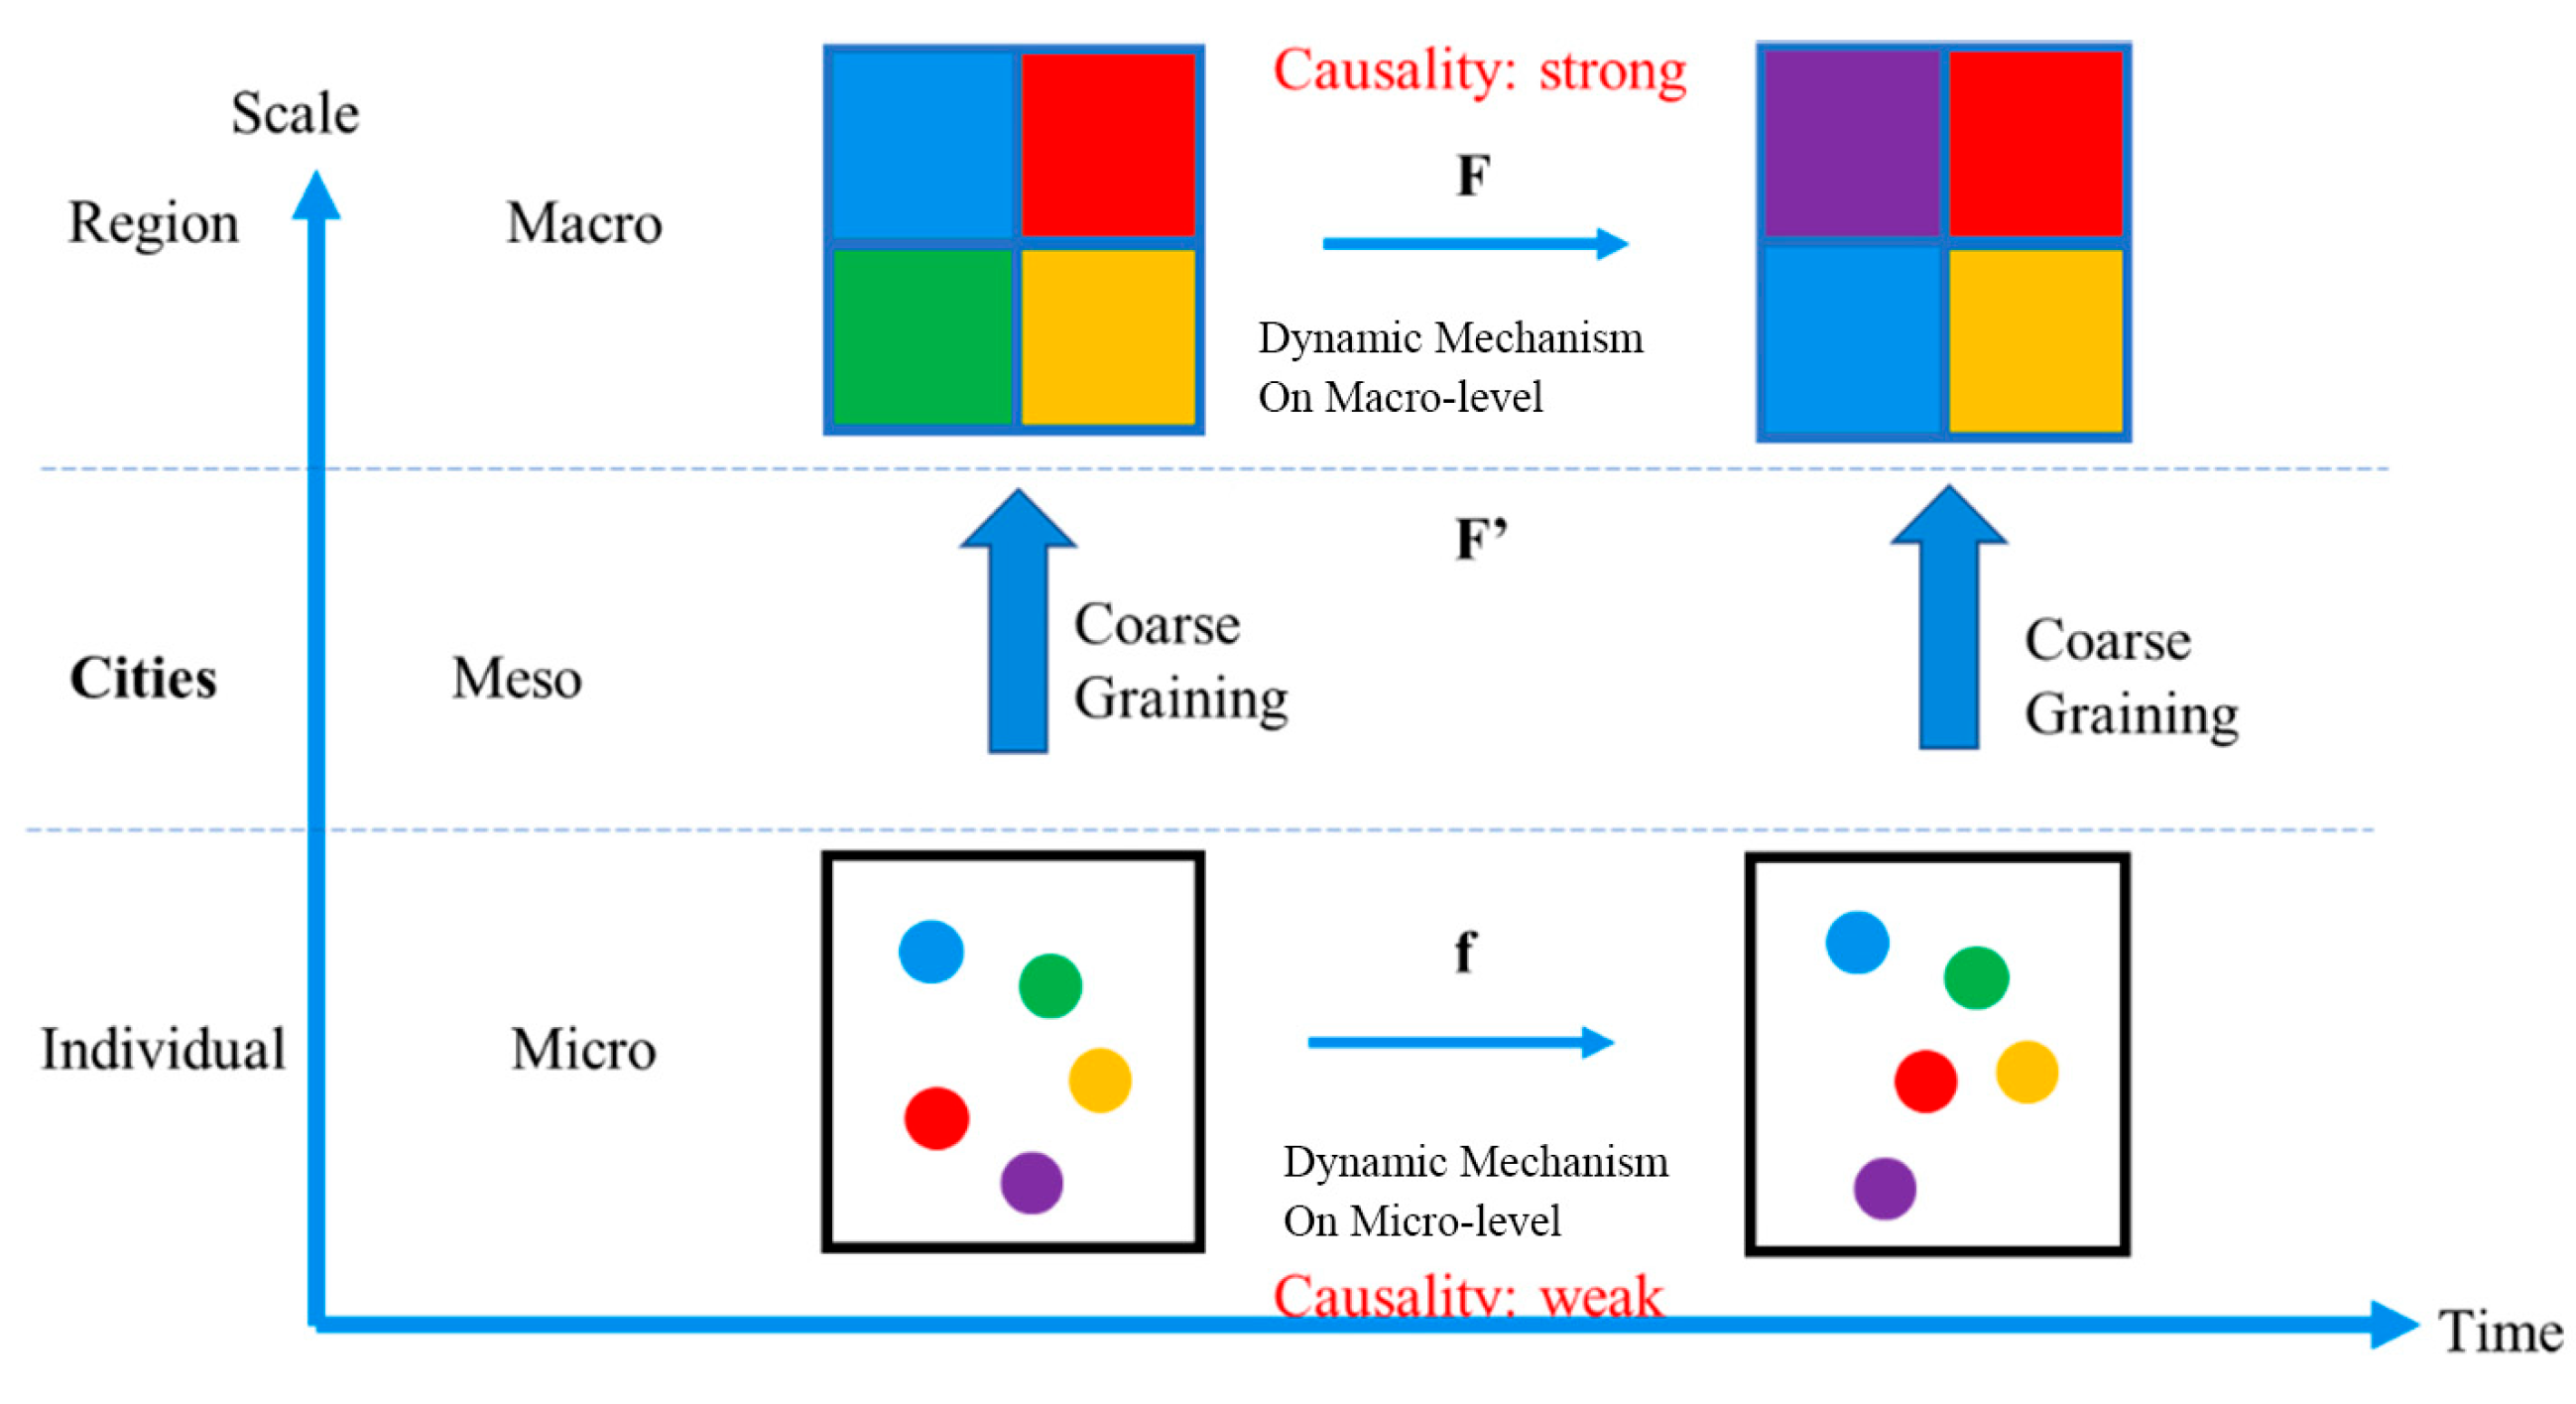
3.3.2. Analysis of Complex Networks
- Network construction
- Network analysis
4. Results
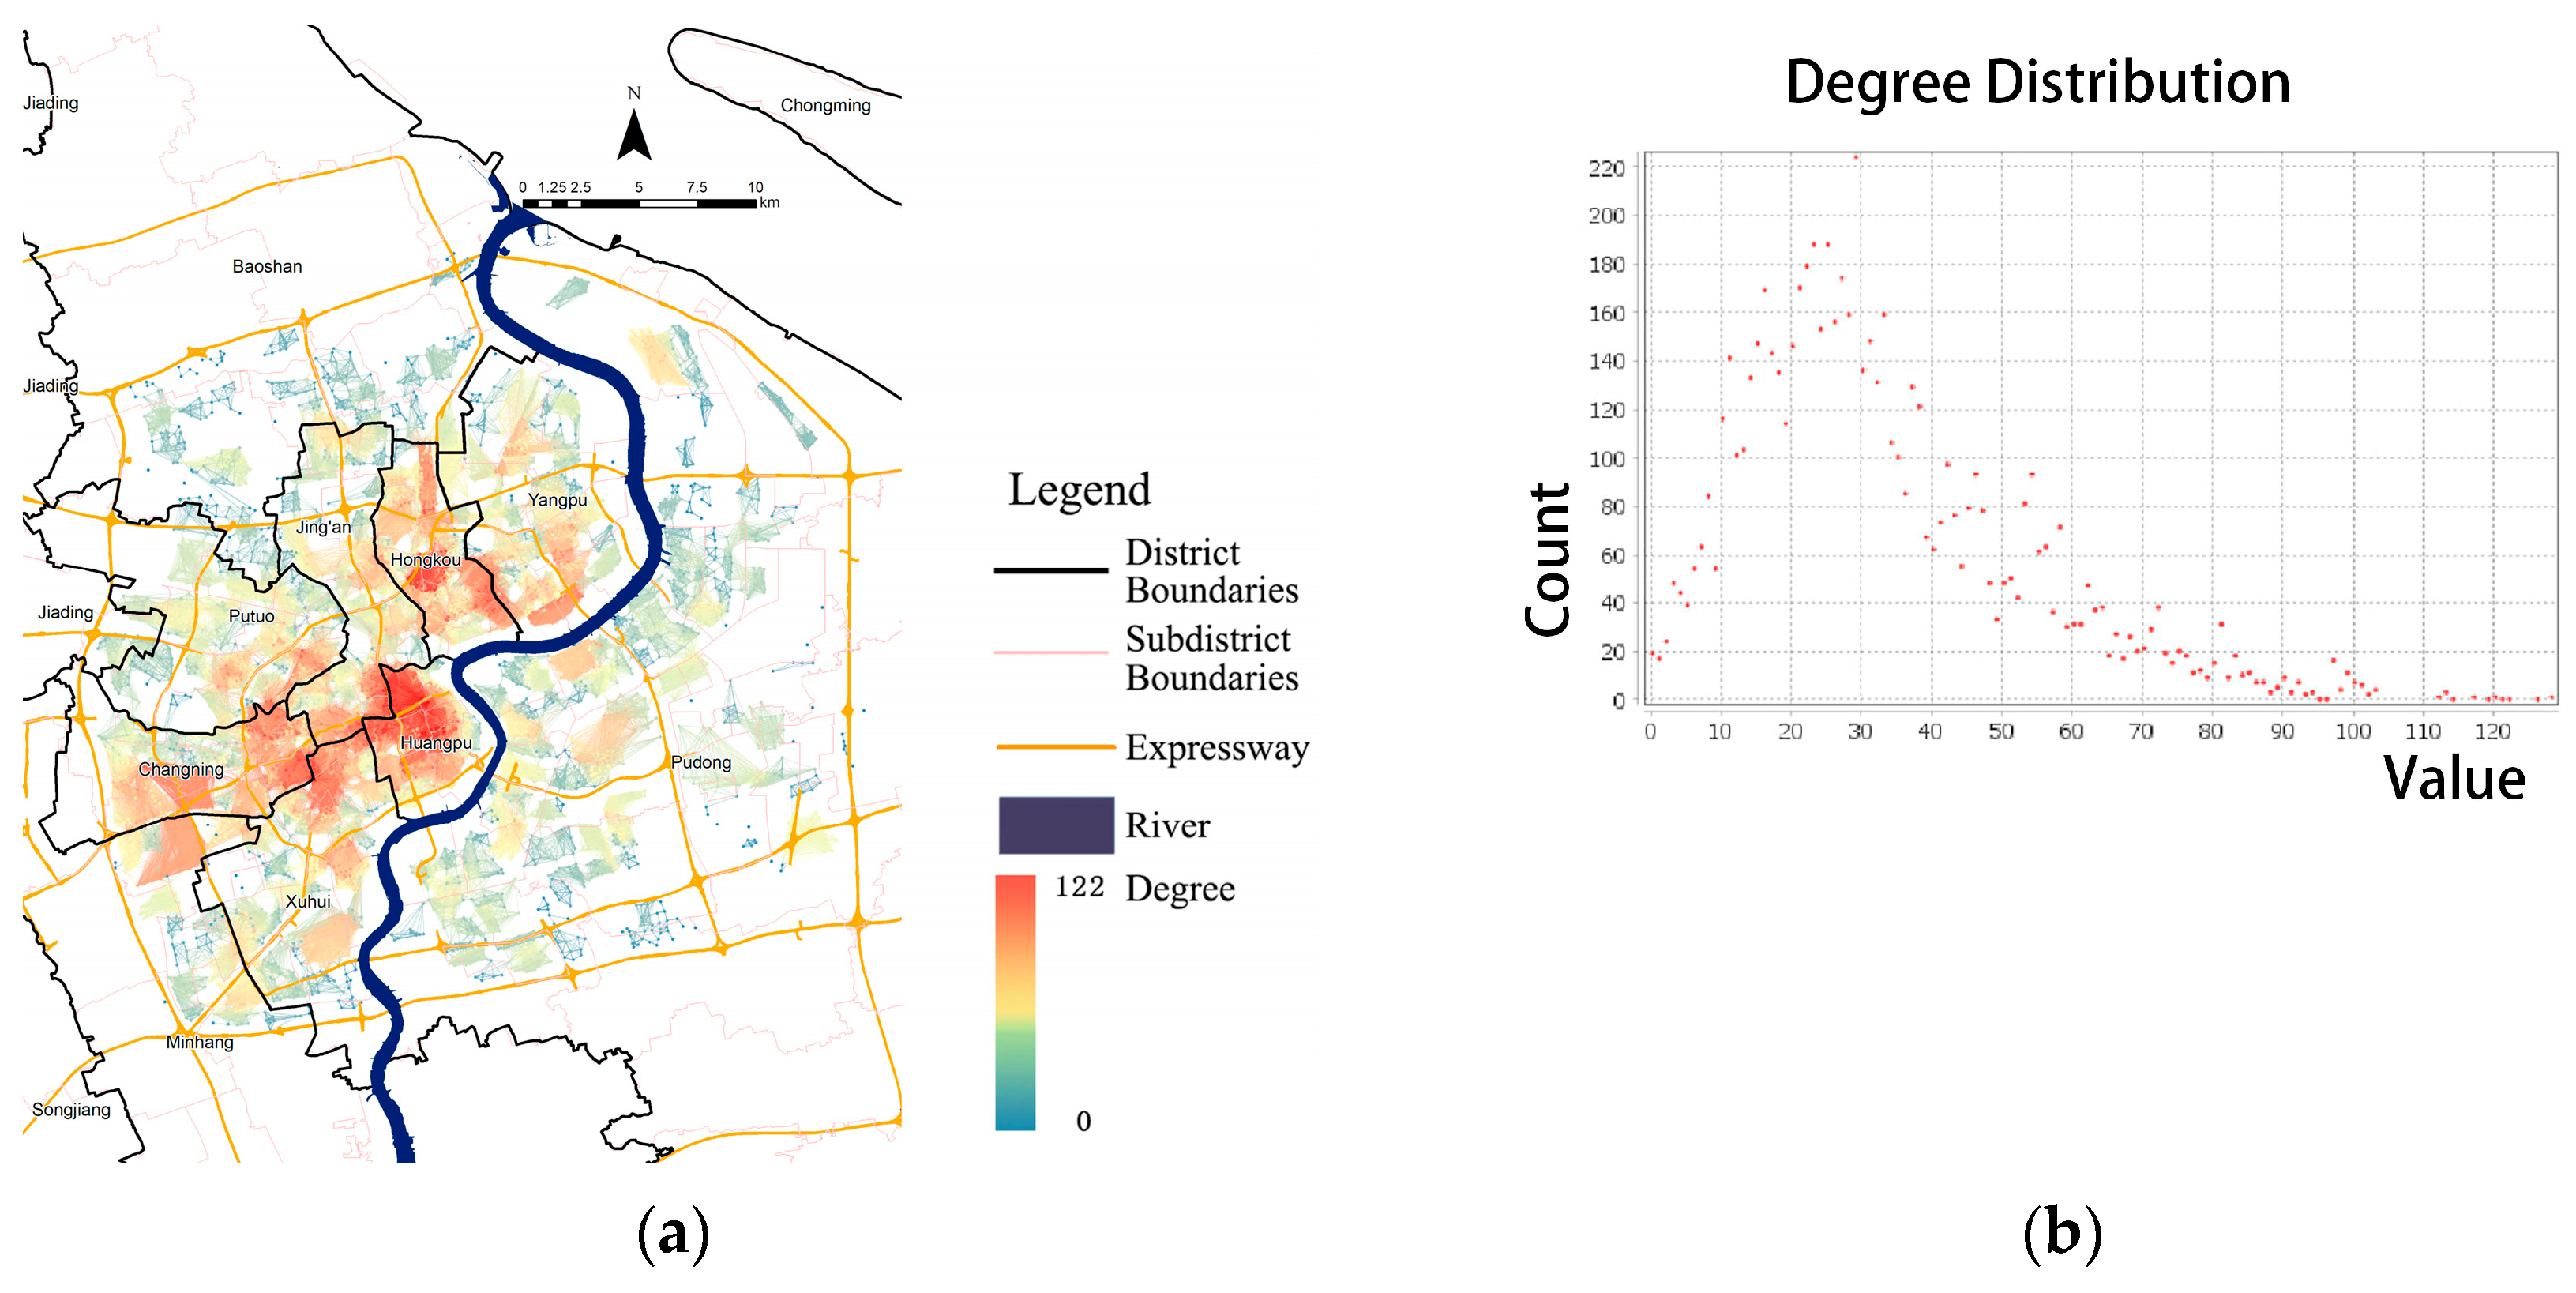
4.1. Significant Differences in the “Degrees” of Residential Quarters in the Study Area
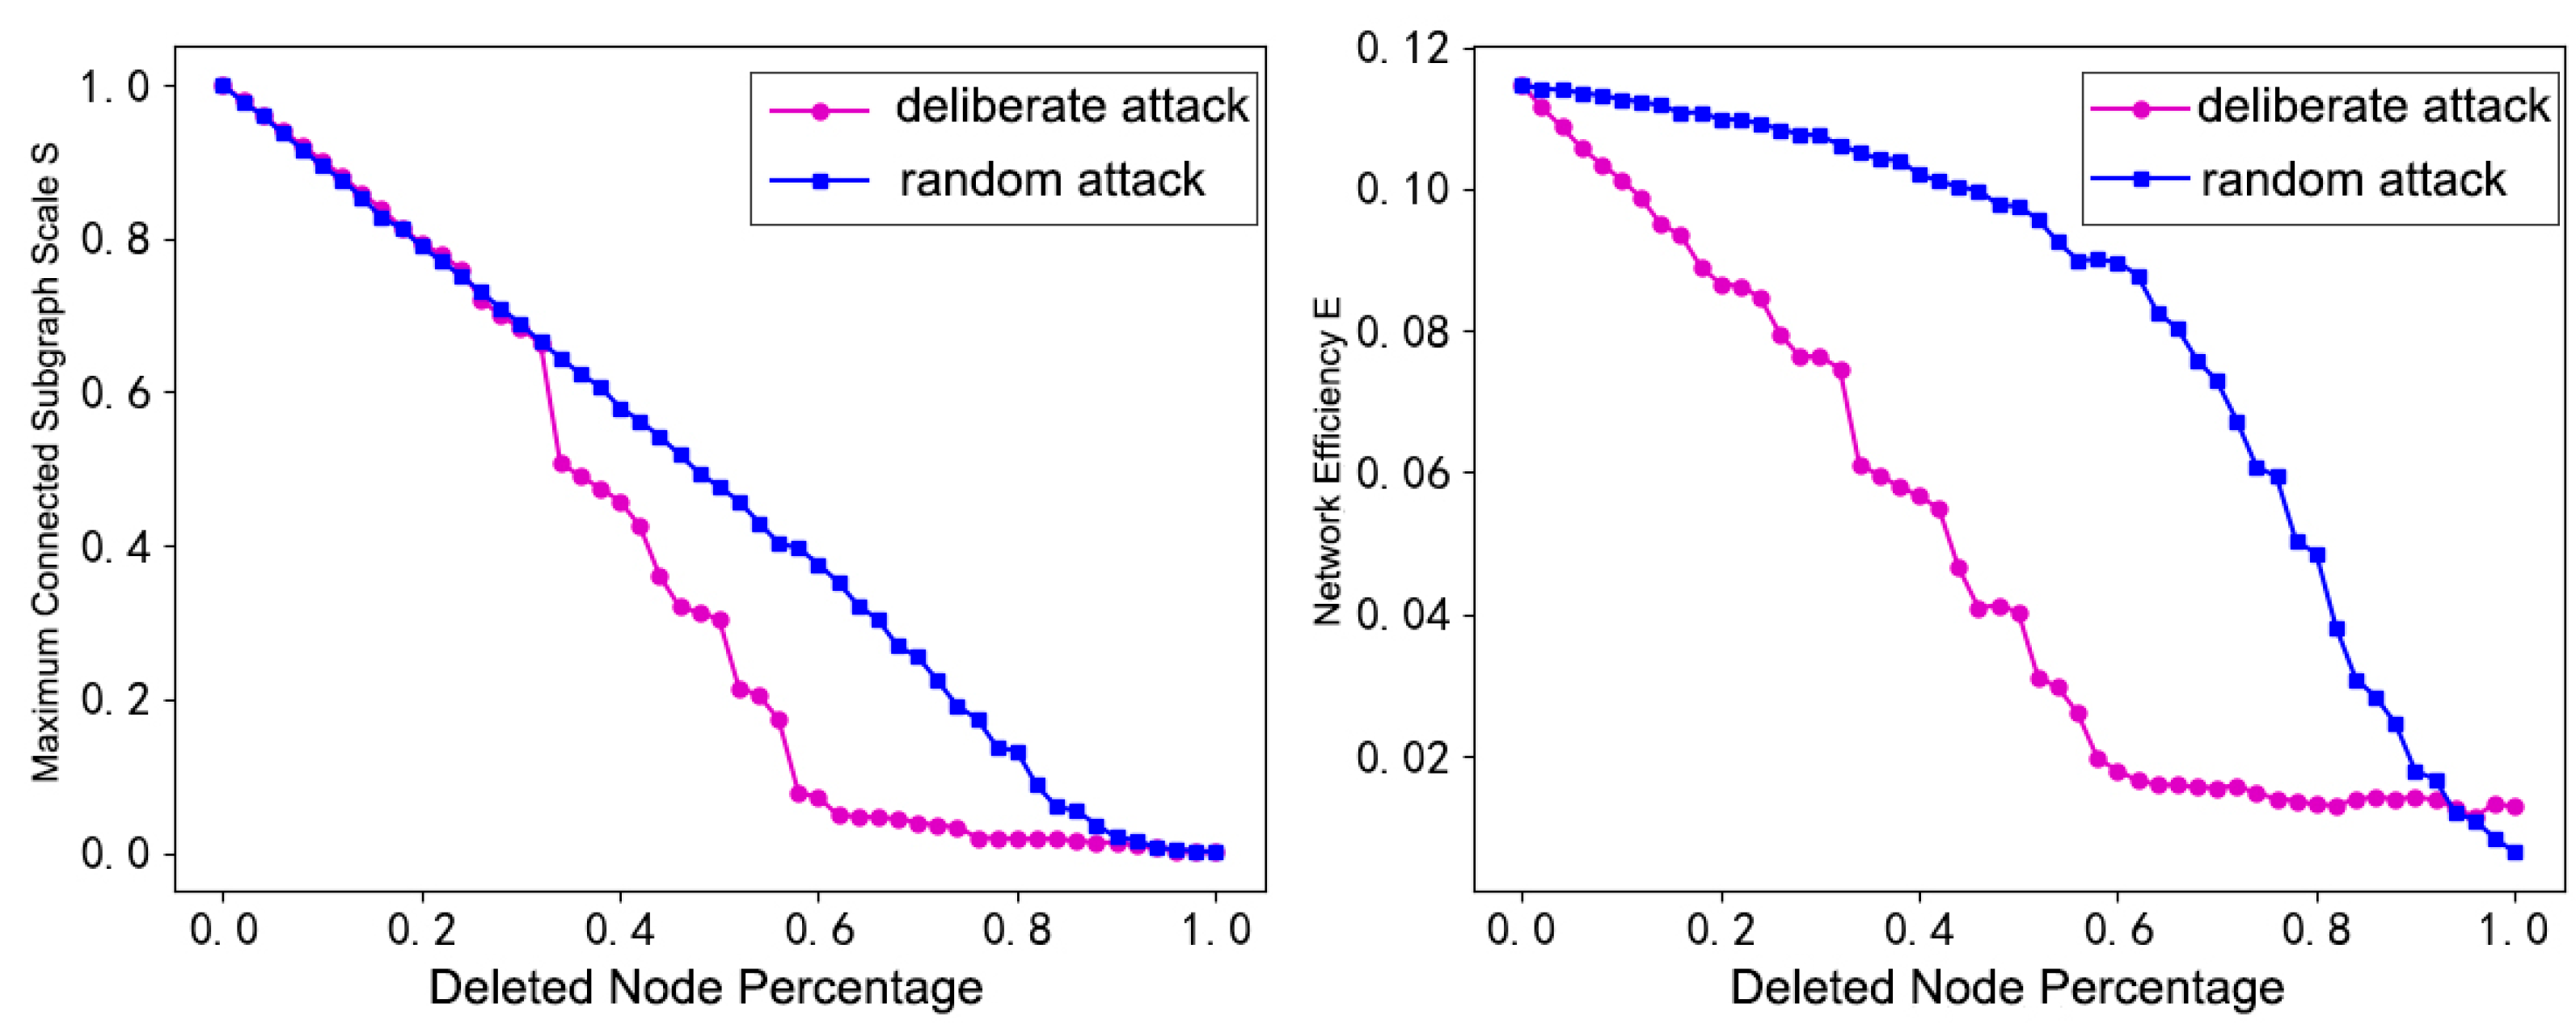
4.2. High-“Degree” Nodes and Robustness Measures for URSNs
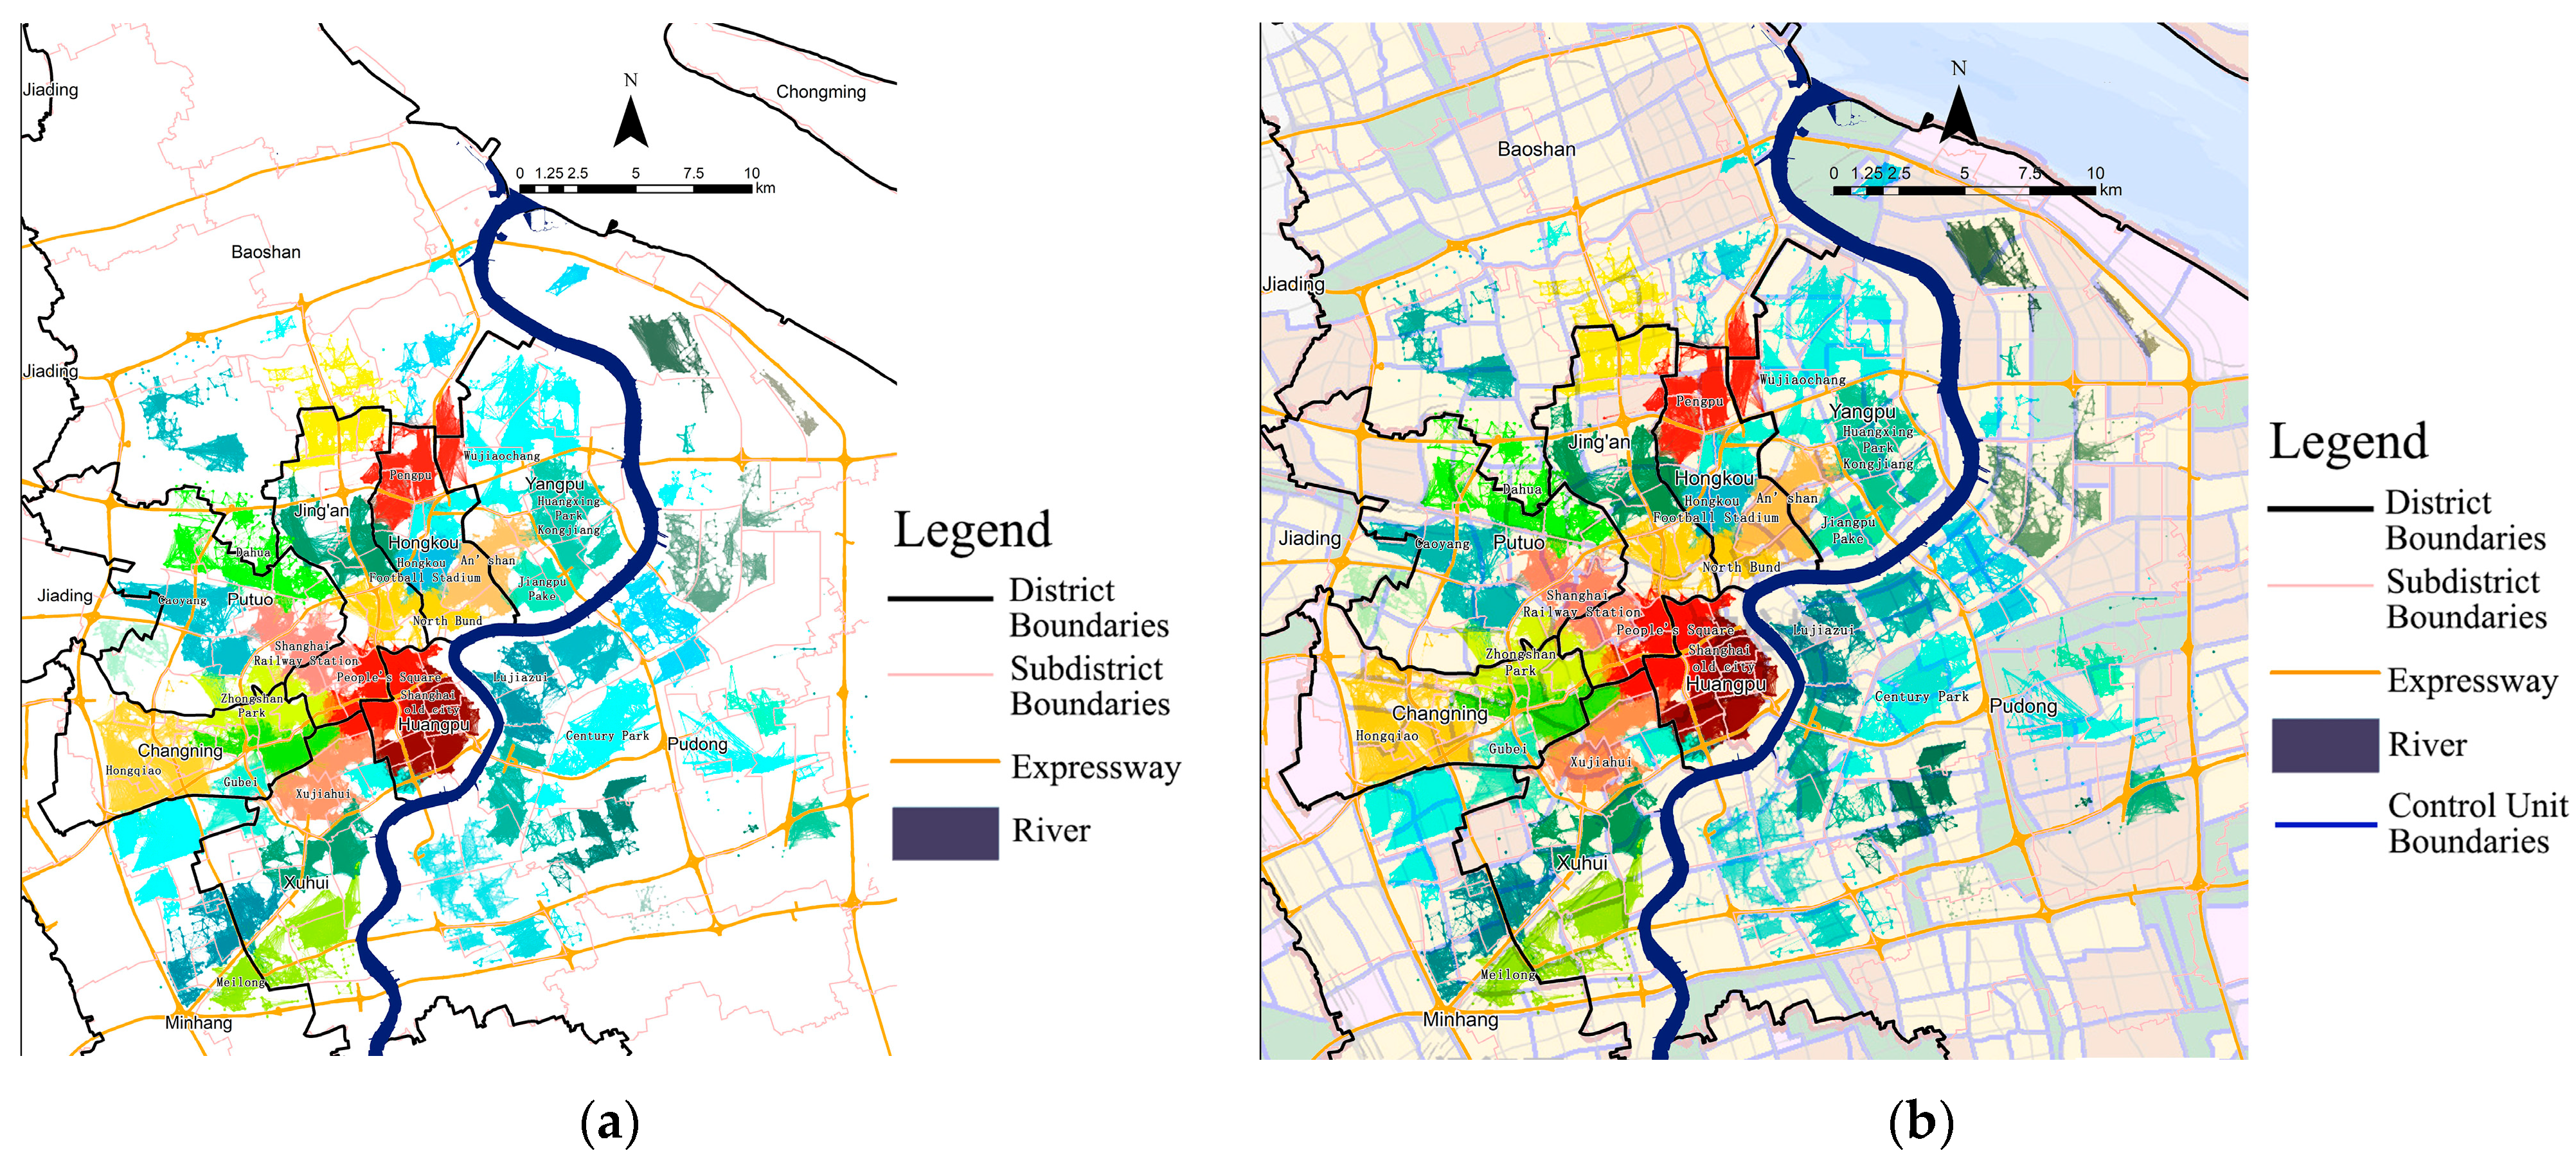
4.3. Identification and Distribution of “Communities” in Residential Spaces
5. Conclusions and Discussion
5.1. Main Conclusions
5.2. URSN Analysis Helps Reveal the Spatial Patterns of Urban Residential Space
5.3. Identification of Online “Associations” Contribute to the Investigation of Place Identity in Built-Up Areas
5.4. Limitations and Prospects
Author Contributions
Funding
Institutional Review Board Statement
Informed Consent Statement
Data Availability Statement
Conflicts of Interest
Abbreviations
| SF | spatial fabric |
| URSN | urban residential spatial network |
| GNs | gated neighborhoods |
| CNT | complex network theory |
| AOI | area of interest |
| SSL | semi-supervised learning |
References
- Otero, G.; Volker, B.; Rozer, J. Space and social capital: Social contacts in a segregated city. Urban Geogr. 2022, 43, 1638–1661. [Google Scholar] [CrossRef]
- Wang, Y.; Kemeny, T. Are mixed neighborhoods more socially cohesive? Evidence from Nanjing, China. Urban Geogr. 2023, 44, 803–823. [Google Scholar] [CrossRef]
- Liao, K.; Breitung, W.; Wehrhahn, R. Debordering and rebordering in the residential borderlands of suburban Guangzhou. Urban Geogr. 2018, 39, 1092–1112. [Google Scholar] [CrossRef]
- Akimov, A.V.; Gemueva, K.A.; Semenova, N.K. The Seventh Population Census in the PRC: Results and Prospects of the Country’s Demographic Development. Her. Russ. Acad. Sci. 2021, 91, 724–735. [Google Scholar] [CrossRef]
- Zhang, F.; Loo, B.P.; Wang, B. Aging in place: From the neighborhood environment, sense of community, to life satisfaction. Ann. Am. Assoc. Geogr. 2022, 112, 1484–1499. [Google Scholar] [CrossRef]
- Cosacov, N. “Residential choices” in Orum (ed). In The Wiley-Blackwell Encyclopedia of Urban and Regional Studies; Wiley: Hoboken, NJ, USA, 2019. [Google Scholar] [CrossRef]
- Sánchez-Moral, S.; Arellano, A.; Díez-Pisonero, R. Understanding the role of neighbourhood characteristics and distance to workplace in the residential location patterns of knowledge workers in large cities. Cities 2022, 127, 103764. [Google Scholar] [CrossRef]
- Newman, M.E.J. Communities, modules and large-scale structure in networks. Nat. Phys. 2012, 8, 25–31. [Google Scholar] [CrossRef]
- Kwan, M.P. Beyond Space (As We Knew It): Toward Temporally Integrated Geographies of Segregation, Health, and Accessibility. Ann. Assoc. Am. Geogr. 2013, 103, 1078–1086. [Google Scholar] [CrossRef]
- Tsukai, M.; Ohno, S.; Tsukano, Y. Transition of socio-demographic characteristics in urban areas by applying a topic model to small area units. Sustainability 2022, 14, 1010. [Google Scholar] [CrossRef]
- Zhong, S.; Lee, C.; Lee, H. The role of community environments in older adults’ intergenerational and peer social interactions. Cities 2022, 129, 103785. [Google Scholar] [CrossRef]
- Niu, N.; Li, L.; Li, X.; He, J. The structural dimensions and community vibrancy: An exploratory analysis in Guangzhou, China. Cities 2022, 127, 103771. [Google Scholar] [CrossRef]
- Li, M.; Xie, J. Social and spatial governance: The history of enclosed neighborhoods in urban China. J. Urban Hist. 2023, 49, 723–744. [Google Scholar] [CrossRef]
- Bao, R.; Wei, Y.; Guan, R.; Li, X.; Lu, X.; Rong, S.; Zuo, X.; Yuan, H. High-solids anaerobic co-digestion performances and microbial community dynamics in co-digestion of different mixing ratios with food waste and highland barley straw. Energy 2023, 262, 125529. [Google Scholar] [CrossRef]
- Benson, M. Trajectories of middle-class belonging: The dynamics of place attachment and classed identities. Urban Stud. 2014, 51, 3097–3112. [Google Scholar] [CrossRef]
- Pastene, A.N.; Link, F. Housing typologies, neighborhood perceptions, and neighborhood social ties. An examination of the michaihue neighborhood, metropolitan area of concepcion, chile. Urbano 2023, 26, 8–21. [Google Scholar] [CrossRef]
- Du, T.Y.; Fertner, C.; Jiang, W.; Andersen, L.M.; Vejre, H. Understanding the change in the social networks of residential groups affected by urban renewal. Environ. Impact Assess. Rev. 2023, 98, 106970. [Google Scholar] [CrossRef]
- Zhang, H.; Cong, C.; Chakraborty, A. Exploring the institutional dilemma and governance transformation in China’s urban regeneration: Based on the case of Shanghai Old Town. Cities 2022, 131, 103915. [Google Scholar] [CrossRef]
- Fang, Y.P.; Liu, Z.L.; Chen, Y.L. Housing Inequality in Urban China: Theoretical Debates, Empirical Evidences, and Future Directions. J. Plan. Lit. 2020, 35, 41–53. [Google Scholar] [CrossRef]
- Shi, Y.L.; Huang, Y.; Hu, D.Y.; Wan, D. Evaluation of social network conservation in historical areas of mountainous towns in Chongqing, China. J. Mt. Sci. 2020, 17, 1763–1775. [Google Scholar] [CrossRef]
- Goldman, A.W.; York Cornwell, E.; Cornwell, B. Neighborhood conditions and social network turnover among older adults. Soc. Netw. 2023, 73, 114–129. [Google Scholar] [CrossRef]
- Yao, Z.; Jiang, C.; Shan-Shan, F. Effects of urban growth boundaries on urban spatial structural and ecological functional optimization in the Jining Metropolitan Area, China. Land Use Policy 2022, 117, 106–113. [Google Scholar] [CrossRef]
- Roberto, E.; Korver-Glenn, E. The spatial structure and local experience of residential segregation. Spat. Demogr. 2021, 9, 277–307. [Google Scholar] [CrossRef]
- Hipp, J.R.; Lee, S.; Kim, J.H.; Forthun, B. Employment deconcentration and spatial dispersion in metropolitan areas: Consequences for commuting patterns. Cities 2022, 131, 103947. [Google Scholar] [CrossRef]
- Lee, J.; Vojnovic, I.; Grady, S.C. What lies beyond the built environment? Exploring “walkability” across the Detroit region. Appl. Geogr. 2022, 141, 102670. [Google Scholar] [CrossRef]
- Zhang, R.; Sun, F.; Shen, Y.; Peng, S.; Che, Y. Accessibility of urban park benefits with different spatial coverage: Spatial and social inequity. Appl. Geogr. 2021, 135, 102555. [Google Scholar] [CrossRef]
- Yasinian, H.; Esmaeilpour, M. Distributed learning automata based approach to inferring urban structure via traffic flow. Appl. Intell. 2022, 52, 1338–1350. [Google Scholar] [CrossRef]
- Ferrari, T.K.; Feitosa, F.D.; Tomasiello, D.B.; Monteiro, A.M.V. Household structure and urban opportunities: Evaluating differences in the accessibility to jobs, education and leisure in Sao Paulo. J. Transp. Land Use 2021, 14, 841–862. [Google Scholar] [CrossRef]
- Grandclement, A.; Boulay, G. From the uneven de-diversification of local financial resources to planning policies: The residentialization hypothesis. Environ. Plan. A-Econ. Space 2021, 53, 1454–1472. [Google Scholar] [CrossRef]
- Ding, R.; Ujang, N.; Bin Hamid, H.; Abd Manan, M.S.; Li, R.; Albadareen, S.S.M.; Nochian, A.; Wu, J.J. Application of Complex Networks Theory in Urban Traffic Network Researches. Netw. Spat. Econ. 2019, 19, 1281–1317. [Google Scholar] [CrossRef]
- Boeing, G. Street network models and indicators for every urban area in the world. Geogr. Anal. 2022, 54, 519–535. [Google Scholar] [CrossRef]
- Boeing, G. Urban spatial order: Street network orientation, configuration, and entropy. Appl. Netw. Sci. 2019, 4, 67. [Google Scholar] [CrossRef]
- Barthélemy, M. Spatial networks. Phys. Rep. 2010, 499, 1–101. [Google Scholar] [CrossRef]
- Pan, H.Z.; Deal, B.; Chen, Y.; Hewings, G.F. A Reassessment of urban structure and land-use patterns: Distance to CBD or network-based?—Evidence from Chicago. Reg. Sci. Urban Econ. 2018, 70, 215–228. [Google Scholar] [CrossRef]
- Batty, M.; Longley, P.A. Fractal-Based Description Of Urban Form. Environ. Plan. B-Plan. Des. 1987, 14, 123–134. [Google Scholar] [CrossRef]
- Robins, G.; Alexander, M. Small Worlds Among Interlocking Directors: Network Structure and Distance in Bipartite Graphs. Comput. Math. Organ. Theory 2004, 10, 69–94. [Google Scholar] [CrossRef]
- Battiston, F.; Iacovacci, J.; Nicosia, V.; Bianconi, G.; Latora, V. Emergence of Multiplex Communities in Collaboration Networks. PLoS ONE 2016, 11, e0147451. [Google Scholar] [CrossRef]
- Boccaletti, S.; De Lellis, P.; Del Genio, C.; Alfaro-Bittner, K.; Criado, R.; Jalan, S.; Romance, M. The structure and dynamics of networks with higher order interactions. Phys. Rep. 2023, 1018, 1–64. [Google Scholar] [CrossRef]
- Kleminski, R.; Kazienko, P.; Kajdanowicz, T. Analysis of direct citation, co-citation and bibliographic coupling in scientific topic identification. J. Inf. Sci. 2022, 48, 349–373. [Google Scholar] [CrossRef]
- Bin, G.; Le, L.; Yang, L.I.; Management, S.O. Simulation Research on Management Modes of Urban Old Residence Community Based on Complex Network. Complex Syst. Complex. Sci. 2019, 16, 41–51. [Google Scholar] [CrossRef]
- Vespignani, A. The fragility of interdependency. Nature 2010, 464, 984–985. [Google Scholar] [CrossRef]
- Zhao, R.; Fang, C.; Liu, H.; Liu, X. Evaluating urban ecosystem resilience using the DPSIR framework and the ENA model: A case study of 35 cities in China. Sustain. Cities Soc. 2021, 72, 102997. [Google Scholar] [CrossRef]
- Watts, D.J.; Strogatz, S.H. Collective dynamics of ‘small-world’ networks. Nature 1998, 393, 440–442. [Google Scholar] [CrossRef] [PubMed]
- Kopsidas, A.; Kepaptsoglou, K. Identification of critical stations in a Metro System: A substitute complex network analysis. Phys. A Stat. Mech. Its Appl. 2022, 596, 123–127. [Google Scholar] [CrossRef]
- HOU, J.; ZHANG, E.; LONG, Y. The Progress and Prospects of the Multi-scale Urban Space Network Research. Urban Plan. Int. 2021, 36, 17–24. [Google Scholar] [CrossRef]
- Wang, X.; Li, X.; Chen, G. Network Science An Introduction; Higher Education Press: Beijing, China, 2020; pp. 37–69. [Google Scholar]
- Gaubatz, P. China’s Urban Transformation: Patterns and Processes of Morphological Change in Beijing, Shanghai and Guangzhou. Urban Stud. 1999, 36, 1495–1521. [Google Scholar] [CrossRef]
- Song, H.; Yang, W. GSCCTL: A general semi-supervised scene classification method for remote sensing images based on clustering and transfer learning. Int. J. Remote Sens. 2022, 43, 5976–6000. [Google Scholar] [CrossRef]
- Gao, X.; Zhu, J.; Liu, J. Density, division and distance: Understanding China’s urban land-use change from an economic geography perspective. Appl. Spat. Anal. Policy 2024, 17, 439–469. [Google Scholar] [CrossRef]
- Gong, C.; Hu, Y.; Yin, Q. Automatic Recognition of Different Types of Urban Residential Areas Using Remote Sensing Images. CN1959703, 9 May 2007. [Google Scholar]
- Finn, K.R.; Silk, M.J.; Porter, M.A.; Pinter-Wollman, N. The use of multilayer network analysis in animal behaviour. Anim. Behav. 2019, 149, 7–22. [Google Scholar] [CrossRef]
- Moreno, C.; Allam, Z.; Chabaud, D.; Gall, C.; Pratlong, F. Introducing the “15-Minute City”: Sustainability, resilience and place identity in future post-pandemic cities. Smart Cities 2021, 4, 93–111. [Google Scholar] [CrossRef]
- Schlapfer, M.; Dong, L.; O’Keeffe, K.; Santi, P.; Szell, M.; Salat, H.; Anklesaria, S.; Vazifeh, M.; Ratti, C.; West, G.B. The universal visitation law of human mobility. Nature 2021, 593, 522–527. [Google Scholar] [CrossRef]
- Small, M.L.; Adler, L. The Role of Space in the Formation of Social Ties. Annu. Rev. Sociol. 2019, 45, 111–132. [Google Scholar] [CrossRef]
- Campos, M.J.Z.; Zapata, P.; Reynosa, J.P. (Re)gaining the urban commons: Everyday, collective, and identity resistance. Urban Geogr. 2023, 44, 1259–1284. [Google Scholar] [CrossRef]
- Moro, E.; Calacci, D.; Dong, X.W.; Pentland, A. Mobility patterns are associated with experienced income segregation in large US cities. Nat. Commun. 2021, 12, 4633. [Google Scholar] [CrossRef] [PubMed]
- Pinchak, N.P.; Browning, C.R.; Calder, C.A.; Boettner, B. Activity locations, residential segregation and the significance of residential neighbourhood boundary perceptions. Urban Stud. 2021, 58, 2758–2781. [Google Scholar] [CrossRef]
- Arthur, P.C. City Planning for Neighborhood Life. Soc. Forces 1929, 8, 98–100. [Google Scholar] [CrossRef]
- Kephart, L. How racial residential segregation structures access and exposure to greenness and green space: A review. Environ. Justice 2022, 15, 204–213. [Google Scholar] [CrossRef]
- Sun, Y.; Tan, S.; He, Q.; Shen, J. Influence mechanisms of community sports parks to enhance social interaction: A bayesian belief network analysis. Int. J. Environ. Res. Public Health 2022, 19, 1466. [Google Scholar] [CrossRef]
- Albert, R.; Jeong, H.; Barabasi, A.L. Error and attack tolerance of complex networks. Nature 2000, 406, 378–382. [Google Scholar] [CrossRef]
- Iacobello, G.; Ridolfi, L.; Scarsoglio, S. A review on turbulent and vortical flow analyses via complex networks. Phys. A Stat. Mech. Its Appl. 2021, 563, 125476. [Google Scholar] [CrossRef]
- Barabasi, A.-L. Network Science; Cambridge University Presss: Cambridge, UK, 2016; pp. 11–97. [Google Scholar]
- Crucitti, P.; Latora, V.; Marchiori, M.; Rapisarda, A. Error and attack tolerance of complex networks. Phys. A Stat. Mech. Its Appl. 2004, 340, 388–394. [Google Scholar] [CrossRef]
- Wang, Y.; Li, H.; Zhang, L.; Zhao, L.; Li, W. Identifying influential nodes in social networks: Centripetal centrality and seed exclusion approach. Chaos Solitons Fractals 2022, 162, 112513. [Google Scholar] [CrossRef]
- Muzio, G.; O’Bray, L.; Borgwardt, K. Biological network analysis with deep learning. Brief. Bioinform. 2021, 22, 1515–1530. [Google Scholar] [CrossRef] [PubMed]
- Jiang, Y.; Liu, X. A construction and empirical research of the journal disruption index based on open citation data. Scientometrics 2023, 128, 3935–3958. [Google Scholar] [CrossRef] [PubMed]
- Li, S.-m.; Mao, S.; Du, H. Residential mobility and neighbourhood attachment in Guangzhou, China. Environ. Plan. A Econ. Space 2019, 51, 761–780. [Google Scholar] [CrossRef]
- Forister, M.L.; Novotny, V.; Panorska, A.K.; Baje, L.; Basset, Y.; Butterill, P.T.; Cizek, L.; Coley, P.D.; Dem, F.; Diniz, I.R.; et al. The global distribution of diet breadth in insect herbivores. Proc. Natl. Acad. Sci. USA 2015, 112, 442–447. [Google Scholar] [CrossRef]
- Barabasi, A.L. Scale-Free Networks: A Decade and Beyond. Science 2009, 325, 412–413. [Google Scholar] [CrossRef]
- Berglund, L.; Butler, S. Community benefits agreements and growth coalitions: Leveraging the growth machine thesis for alternative organizing strategies. Urban Geogr. 2023, 44, 1250–1258. [Google Scholar] [CrossRef]
- Li, J.X.; Cai, T.T.; Deng, K.; Wang, X.J.; Sellis, T.; Xia, F. Community-diversified influence maximization in social networks. Inf. Syst. 2020, 92, 101522. [Google Scholar] [CrossRef]
- Zhang, S.; Wang, M.; Yang, Z.; Zhang, B. Do spatiotemporal units matter for exploring the microgeographies of epidemics? Appl. Geogr. 2022, 142, 102692. [Google Scholar] [CrossRef]
- Batty, M. Planning the 21st Century City—Four Snapshots for a New Science. Int. Rev. Spat. Plan. Sustain. Dev. 2021, 9, 1–9. [Google Scholar] [CrossRef]


| GN Types | Satellite Image | GN Types | Satellite Image |
|---|---|---|---|
| 1. Commercial house | 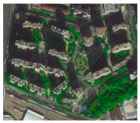 | 4. Garden lanes |  |
| 2. Workers’ new villages | 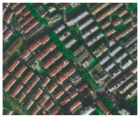 | 5. Lilongs | 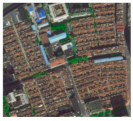 |
| 3. Apartments | 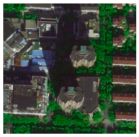 | 6. Villas | 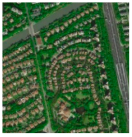 |
| Rules | Illustrations | Scenarios | Rules | Illustrations | Scenarios |
|---|---|---|---|---|---|
| Rule 1 | 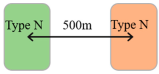 |  | Rule 3 | 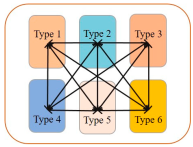 |  |
| Rule 2 |  |  | Rule 4 | 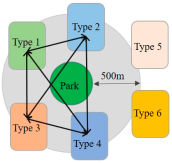 |  |
Disclaimer/Publisher’s Note: The statements, opinions and data contained in all publications are solely those of the individual author(s) and contributor(s) and not of MDPI and/or the editor(s). MDPI and/or the editor(s) disclaim responsibility for any injury to people or property resulting from any ideas, methods, instructions or products referred to in the content. |
© 2025 by the authors. Licensee MDPI, Basel, Switzerland. This article is an open access article distributed under the terms and conditions of the Creative Commons Attribution (CC BY) license (https://creativecommons.org/licenses/by/4.0/).
Share and Cite
Yang, F.; Xu, L.; Wang, J. Spatial Morphology of Urban Residential Space: A Complex Network Analysis Integrating Social and Physical Space. Sustainability 2025, 17, 2327. https://doi.org/10.3390/su17052327
Yang F, Xu L, Wang J. Spatial Morphology of Urban Residential Space: A Complex Network Analysis Integrating Social and Physical Space. Sustainability. 2025; 17(5):2327. https://doi.org/10.3390/su17052327
Chicago/Turabian StyleYang, Fan, Linxi Xu, and Jiayin Wang. 2025. "Spatial Morphology of Urban Residential Space: A Complex Network Analysis Integrating Social and Physical Space" Sustainability 17, no. 5: 2327. https://doi.org/10.3390/su17052327
APA StyleYang, F., Xu, L., & Wang, J. (2025). Spatial Morphology of Urban Residential Space: A Complex Network Analysis Integrating Social and Physical Space. Sustainability, 17(5), 2327. https://doi.org/10.3390/su17052327