Abstract
Resource conflicts constitute a major global issue in areas rich in natural resources. The modeling of factors influencing natural resource conflicts (NRCs), including environmental, health, socio-economic, political, and legal aspects, presents a significant challenge compounded by inadequate data. Quantitative research frequently emphasizes large-scale conflicts. This study presents a novel multilevel approach, SEFLAME-CM—Spatially Explicit Fuzzy Logic-Adapted Model for Conflict Management—for advancing understanding of the relationship between NRCs and drivers under territorial and rebel-based typologies at a community level. SEFLAME-CM is hypothesized to yield a more robust positive correlation between the risk of NRCs and the interacting conflict drivers, provided that the conflict drivers and input variables remain the same. Local knowledge from stakeholders is integrated into spatial decision-making tools to advance sustainable peace initiatives. We compared our model with spatial multi-criteria evaluation for conflict management (SMCE-CM) and spatial statistics. The results from the Moran’s I scatter plots of the overall conflicts of the SEFLAME-CM and SMCE-CM models exhibit substantial values of 0.99 and 0.98, respectively. Territorial resource violence due to environmental drivers increases coast-wards, more than that stemming from rebellion. Weighing fuzzy rules and conflict drivers enables equal comparison. Environmental variables, including proximity to arable land, mangrove ecosystems, polluted water, and oil infrastructures are key factors in NRCs. Conversely, socio-economic and political factors seem to be of lesser importance, contradicting prior research conclusions. In Third World nations, local communities emphasize food security and access to environmental services over local political matters amid competition for resources. The synergistic integration of fuzzy logic analysis and community perception to address sustainable peace while simultaneously connecting environmental and socio-economic factors is SEFLAME-CM’s contribution. This underscores the importance of a holistic approach to resource conflicts in communities and the dissemination of knowledge among specialists and local stakeholders in the sustainable management of resource disputes. The findings can inform national policies and international efforts in addressing the intricate underlying challenges while emphasizing the knowledge and needs of impacted communities. SEFLAME-CM, with improvements, proficiently illustrates the capacity to model intricate real-world issues.
1. Introduction
The United Nations Environment Programme (UNEP) has drawn attention to a concerning worldwide trend over the last 60 years: at least 40% of all wars have a connection to natural resources. These conflicts frequently arise from the extraction of valuable resources, such as oil, or from disagreements over renewable resources [1,2]. Diverse theoretical frameworks have been utilized to examine the determinants of natural resource conflicts (NRCs). These methodologies include notions such as “resource abundance”, “resource curse” [3,4,5,6], “resource scarcity” [3,7,8], and “community management of common pool resources” (CPR) [9], yet the results remain equivocal. This research aims to construct a multi-level model for understanding the risk of natural resource conflicts (NRCs) [10], emphasizing the intricate links among the factors that drive violent resource-related conflicts, in support of sustainability and peacebuilding.
At the national level, the “resource abundance” method makes use of models such as multinomial logistic regression models (MNLRs) and multiple linear regression models (MLRMs) [4,11]. In this context, the concepts of “greed and grievance” [5] suggest a higher likelihood of NRCs in countries with lower GDP. However, advocates of theories of resource scarcity and political ecology have primarily depended on qualitative case studies featuring comprehensive examinations of specific conflict instances. Neo-Malthusian arguments contend that restricting access to renewable resources can heighten community dissatisfaction. In contrast, Cornucopians assert that people can adjust to the negative environmental and social consequences of resource conflicts by technological or institutional advancements. In the twenty-first century, there is a pressing necessity to re-examine and expand upon these prior views. This is crucial in formulating methods that enhance conflict management (CM) and natural resource management (NRM), establishing a basis for sustainable peace [12,13,14].
To attain sustainability and peace, it is essential to integrate the diverse facets of sustainability into our strategy. Nonetheless, large-scale studies encompassing a significant number of cases (termed Large-N studies) have presented obstacles to policy implementation. This mostly results from their restricted spatial resolution at the national level [15,16]. Moreover, scientific research encounters difficulties in ascertaining the degree to which environmental alterations, socio-economic influences, and socio-political elements can be integrated to comprehend disputes or collaboration. This problem encompasses the creation of indices of NRCs that can connect conflict research with actual policy action [16] and guide sustainability. Resource conflicts can potentially transform into cooperation and sustainable peace [12,14,17]. This transformation relies on a deep comprehension of the link between natural resources and conflicts. To exemplify this argument, ref. [18] propose a transition in emphasis from the historical, causal, and detrimental dimensions of natural resources and civil conflicts to a more nuanced viewpoint that includes local stakeholders [19,20,21].
To date, research on integrative modeling in the setting of NRCs has been sparse and unachieved by the Large-N studies earlier mentioned [22,23]. Addressing this gap is the main goal of this work. To fully analyze NRCs, integrative modeling is required as a transdisciplinary, coupled approach that integrates knowledge of local stakeholders and perspectives from both the natural and social science disciplines and sustainability to thoroughly examine NRCs [10,24,25]. The model is tested in the Niger Delta. This is an appropriate case study for evaluating an integrative model for analyzing resource conflicts at a fine-grained scale. This region in West Africa is diversified and possesses considerable bio-physical, socio-economic, and political significance for global extractive resource areas. It is geographically characterized as a delta, where anthropogenic activities substantially influence its water systems, which finally discharge into the Atlantic Ocean. Through community-level analysis, we may quantify and openly evaluate several events thought to affect conflict risks and comprehend their geographical clustering or dispersion [26].
Our approach facilitates a thorough analysis of various forms of organized violence, including high-intensity insurgent violence, social unrest, low-intensity conflicts, and communal violence. Firstly, the process entails evaluating the viewpoints and understandings of the key stakeholders in these conflicts. Secondly, in our analysis of the spatial clustering of NRCs, we recognize that conflicts do not inherently indicate a direct causal relationship, as demonstrated in [27]. The distribution of relevant endogenous traits linked to these conflicts is responsible for the spatial clustering of disputes. Fuzzy models demonstrate significant appropriateness in scenarios characterized by limited data availability. They facilitate the development of fuzzy rules through the integration of linguistic expressions and expert knowledge, as suggested by Zadeh [28,29].
We demonstrate a comprehensive framework that incorporates community knowledge in modeling the links between NRCs and the intricate interactions with environmental, socio-economic, and political conflict factors by developing and testing SEFLAME-CM as a novel algorithm derived from the “Spatially Explicit Fuzzy Logic-Based Adapted Model for Conflict Management (SEFLAME-CM)”. The Nobel Prize-winning writings of Elinor Ostrom [9,30,31] implement an institutional structure at the community level distinct from this methodology. Ostrom’s economic and policy approach predominantly posited that communities would autonomously organize addressing NRC issues. Conversely, the SEFLAME-CM [10] incorporates many elements, such as spatial and temporal dimensions, multiple drivers, and typologies of resource conflict. This research seeks to improve the relationship between natural resources and non-resource-based conflicts by examining intricate linkages of factors. Integrating the local insights and perspectives of experts into spatially explicit decision-making would enhance sustainable peace initiatives.
Previous studies and the novelty of SEFLAME-CM: The application of fuzzy logic models in real-life scenarios is adaptable to a specific problem domain and strategies. SEFLAME-CM’s unique contribution is not only the integration of community perception, expert knowledge, and fuzzy logic models to promote sustainable peace, but it also links the environmental, socio-economic, and political conditions of NRCs. SEFLAME-CM falls under the category of a Multiple Criteria Decision Making (MCDM) tool. When it comes to solving complicated problems in real-world scenarios, MCDMs are essential. According to [32], many MCDM approaches have been created for different problems or ideologies. They perform effectively in situations with little or no data [33,34,35] because they can model and assess imprecision and uncertainty in a variety of scenarios. For making decisions about sustainability and environmental management, SEFLAME-CM is a powerful and practical tool [36].
A substantial body of theoretical literature has conceptualized the model and design of fuzzy logic systems. The application of these established theories to real-world scenarios or their extension into practical contexts appears particularly promising. Researchers have underscored the efficacy of fuzzy logic not only in natural resource conflict analysis but also across diverse environments. For example, ref. [37] used single-valued, neutrosophic, probabilistic, hesitant fuzzy rough aggregate information to select a smart city design plan using a novel, generalized idea of a single-valued, neutrosophic, probabilistic, hesitant fuzzy rough set (SV-NPHFRS) [33,37]. Recently, these authors conducted an analysis of decision-making utilizing neutrosophic Z-values in mobility analysis. This analysis illustrates a multi-objective, multi-variable problem including interval-valued fuzzy variables. With fuzzy logic, we can handle the inherent complexity of decision-making in situations where the variables are vague or unclearly stated, and it functions as an essential instrument for modeling and assessing the viability of incorporating community perspectives, as indicated in [36]. Other real-world situations have encompassed diabetes diagnosis [38], thorough assessment of real estate investment hazards [39], and a communal strategy for sustainable hydropower [36].
The research on the application of fuzzy logic indicates that the hybrid fuzzy modeling approach performs effectively in numerous applications relative to pure fuzzy logic modeling. Numerous recent studies have formulated various conceptual designs for conflict analysis utilizing fuzzy logic models [40,41,42,43]. They have framed conflict as a fuzzy issue through the lens of Pythagorean fuzzy sets and intuitionistic fuzzy sets, alongside multilevel analyses. According to [43], conflict can be conceptualized as a three-way analysis, as developed from Yao and Pawlak [40,44]. These include categories such as strong conflicts, weak conflicts, and non-conflicts. Pawlak’s robust conflict analysis functions as a proficient mathematical instrument capable of managing imprecise, ambiguous, and incomplete data. A discernibility matrix is used in Pawlak’s methodology to evaluate the degree of agent conflict. This approach yields outcomes that are incongruent with established facts [43]. In real-world conflicts, agents usually have to make complex decisions, which makes their attitudes more complex than a three-tiered method. A variety of interests and values may be at play in the unclear and unpredictable viewpoints that agents have on certain subjects. Therefore, the combination of conflict analysis and multi-granulation rough set theory is an interesting topic to research.
In the context of NRCs, novel fuzzy logic systems like SEFLAME-CM can effectively tackle the intricacies of resource disputes that span various levels [41]. Issues pertaining to multilevel conflict analysis utilizing a fuzzy logic paradigm has been identified [41]. A recent meta-analysis indicates that novel methodologies may elucidate hitherto unrecognized correlations between natural resources and conflicts [45]. Schellens and Belyazid [45] demonstrated that prior modeling endeavors adhered to sophisticated adaptations of logistic models. This study employed the frequently criticized Large-N observations and failed to utilize fuzzy logic’s ability to capture intricate, nonlinear variable relationships.
In summary, given the above global literature and the analyses of the problems of NRCs, it is obvious that improving knowledge of the complex socio-environmental and political relationships with NRCs at a fine-grained scale is a key challenge in many parts of the world endowed with natural resources, including the Niger Delta. Considering the spatial, temporal, NRC driver dimensions, a concept thought to be “vulnerability cubes” [46], as well as the actors involved in conflicts concerning natural resources, is critical in this paper. The implementation of complex policy options in areas that are extremely unstable and have vulnerable individuals and places is essential.
What makes SEFLAME-CM novel? The acronym originates from the following: SE—Spatially Explicit; FLAME—Adapted Model for Fuzzy Logic; and CM, which stands for Conflict Management, an idea that operates on a local level. The novelty of SEFLAME-CM is summarized below:
- SEFLAME-CM constructs the Conflict Vulnerability Likelihood Index One and Two (CVL Index 1 and 2), adapted from [10]. The CVL Index is a measurement indicator [47] that guides NRC management towards sustainability by integrating multifaceted dimensions of drivers that had not been considered holistically by NRC management researchers.
- The SEFLAME-CM is based on the integration of external and internal [10] vulnerability assessment components, such as spatial, temporal, and dimensional considerations, within the framework of NRCs. In addition to promoting sustainable peace, this goes beyond earlier research [10,22,46,48].
- In a community-level case study of NRCs, SEFLAME-CM exemplifies a pragmatic application of fuzzy logic that surpasses innovative feasibility methods such as the Pythagorean fuzzy rough set or the intuitionistic approach [42,43]. SEFLAME-CM adeptly manages multiple and frequently conflicting criteria, incorporating the perceptions of conflict drivers and weighing by local stakeholders. This enhances sustainability beyond numerous applications of analogous models in other contexts [34,37,38,39,49,50,51].
- Although prior research on NRCs provides a viable framework for examining the interconnections of drivers, it does not yield an optimal resolution, as a comprehensive understanding of conflicts at their occurrence level is essential. The model presented by [45,52] considered intricate interactions with socio-economic factors yet adhered to a black-box methodology. In contrast, our model demonstrates greater flexibility by addressing micro-level uncertainty through integration.
- SEFLAME-CM transcends the fuzzification of explanatory variables, as evidenced in the study by [53]. In SEFLAME-CM, both the output and explanatory variables were fuzzified. We used fuzzy explanatory and response variables in a spatial context to develop CVL Index 2. This improved the fuzzy common vulnerability scoring system (F-CVSS), which is predicated on a least squares methodology and the fuzzy logistic regression model proposed in [53]. In our case, we examined the spatio-temporal dimensions, main driver parameters encompassing environmental, socio-economic, and political factors, as well as resource–conflict typologies. Our discussion shows great insights into NRC research at a fine-grained scale. Recent studies, possibly constrained by the constraints of machine learning techniques, have not investigated the complex links among the drivers of conflicts [45].
- Our community approach exceeds that of [36], which encountered substantial constraints on data collection owing to protected cultural locations. This differs from our approach, where we coupled stakeholders’ opinions with remotely sensed and fuzzy logic data to guide sustainability.
This is how the article is structured: “Materials and Methods” (Section 2) describes the data collection technique that supports knowledge integration. Three main data sources are covered in this section: secondary data (Section 2.1.1); fieldwork data, which include open interviews, questionnaire surveys, and workshops (Section 2.1.2); and remote sensing data (Section 2.1.3). We describe the model stages according to the data sources in Section 2.2. Section 2.3 examines spatial features and elucidates fuzzy conflict data (FUZZYCONDATA). Section 2.4 thereafter presents a case study. Section 3 and Section 4 delineate the “Results” and “Discussions”, respectively. In Section 4, we define the rules used in our model, explain membership functions, and explore the notion of knowledge integration. Section 4 further explores the results, encompassing comparison of the SEFLAME-CM model with previous methods.
2. Materials and Methods
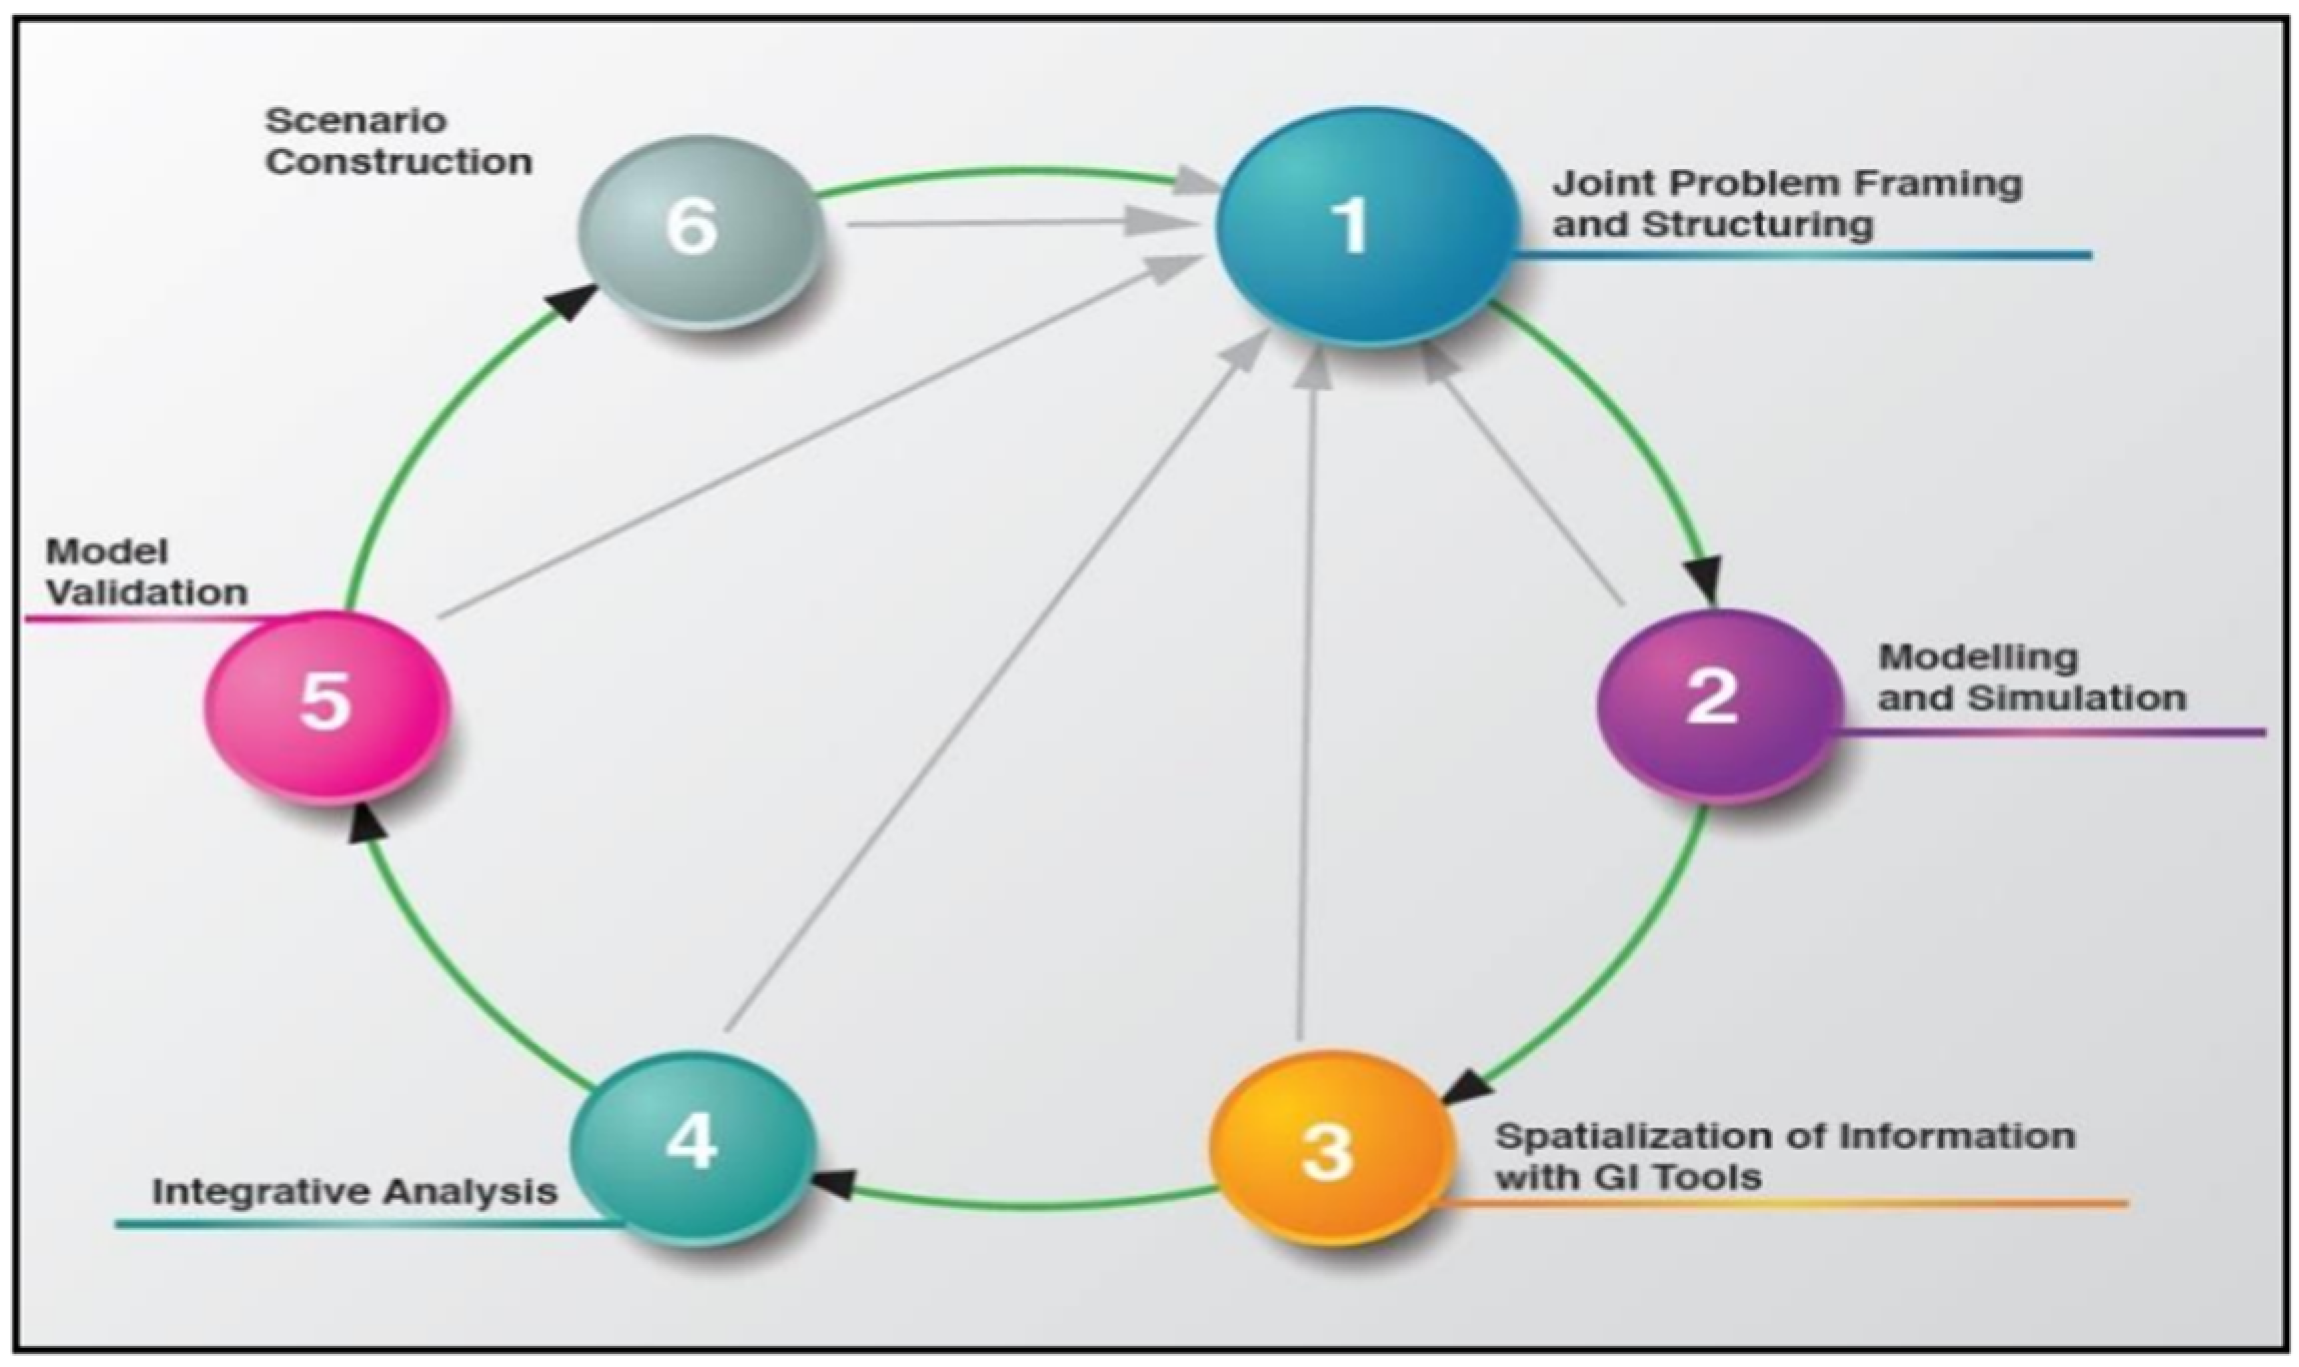
The methodological flow, materials for acquiring spatial information, and the model techniques and procedures are all included in this section. Six interactive and non-linear steps make up our overall methodology (see Figure 1 for the methodical flow described briefly below).
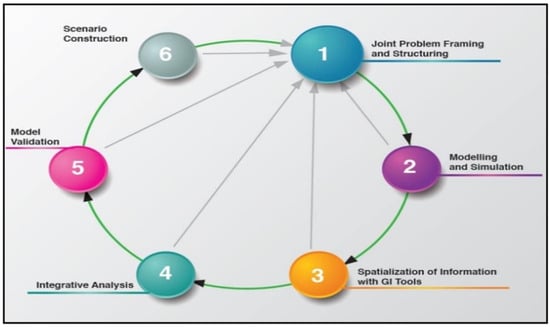
Figure 1.
The overall methodological flow of SEFLAME-CM.
- The first step is joint problem analysis and structuring. The aim is to identify and structure the problem of NRCs within the context of a transdisciplinary coupled approach [10]. This step includes exploratory visits and measurement of biophysical components of the parameters using remote sensing. It also includes problem analysis using interviews, etc.
- The second step is modeling and simulation. As a precursor, FLAME-CM was first developed, followed by SEFLAME-CM, as stated in step 3. Refer to Section 2 for the procedures that led to the steps for the models.
- The third step was spatialization of information with geoinformation (GI) tools: here we used GIs tools to prepare the various spatial layers using state-of-the art geoinformation tools and software. Steps 2 and 3 were based on the multilevel algorithm described in Section 2.2.
- The fourth step is the integrative analysis step: we visualized the results from step three and prepared the data for model comparison with previous methods.
- In the fifth step, we compared our model with previously used models. This was based on the following: First, we conducted a time scale validation. Here we looked at the vulnerability dimensions as different conditions that could influence the occurrence of NRCs. Second, we compared the two types of NRCs studied with the three dimensions. Third, we compared the result of the model SEFLAME-CM with existing models. The results of the fifth step informed the analysis results presented in the Section 4.
- Finally, we proposed the evaluation of possible scenarios, a necessary step that future researchers could take up.
2.1. Materials for Spatial Acquisition, Procedures, and Justification of the Selection of NRC Factors
From the joint problem framing, we selected a total of 12 factors, 4 in each dimension, using local actors and scientists (see Table 1) [10]. In SEFLAME-CM, equal representation made it easier to compare the contributions and trade-offs between the dimensions and improve interpretability [54,55]. We then selected the specific model inputs, considering the availability of data from various data collection sources. We also considered the ease of operationalizing the variables (such as excluding the legal dimension from the model) and instances where previous hypotheses failed to reach consensus. We operationalized and parameterized the model input variables based on globally and locally searched literature on NRCs. Adapted from [10], Table 1 is a summary of all the vulnerability dimensions of NRCs, the conflict drivers/factors, and the operationalization of the variables (the sources of the data are past studies and the scale, and the actual unit of measurement are from the current study).

Table 1.
Overview of drivers, indicators of NRCs from previous studies and operationalization of the SEFLAME-CM variables. Adapted from [10].
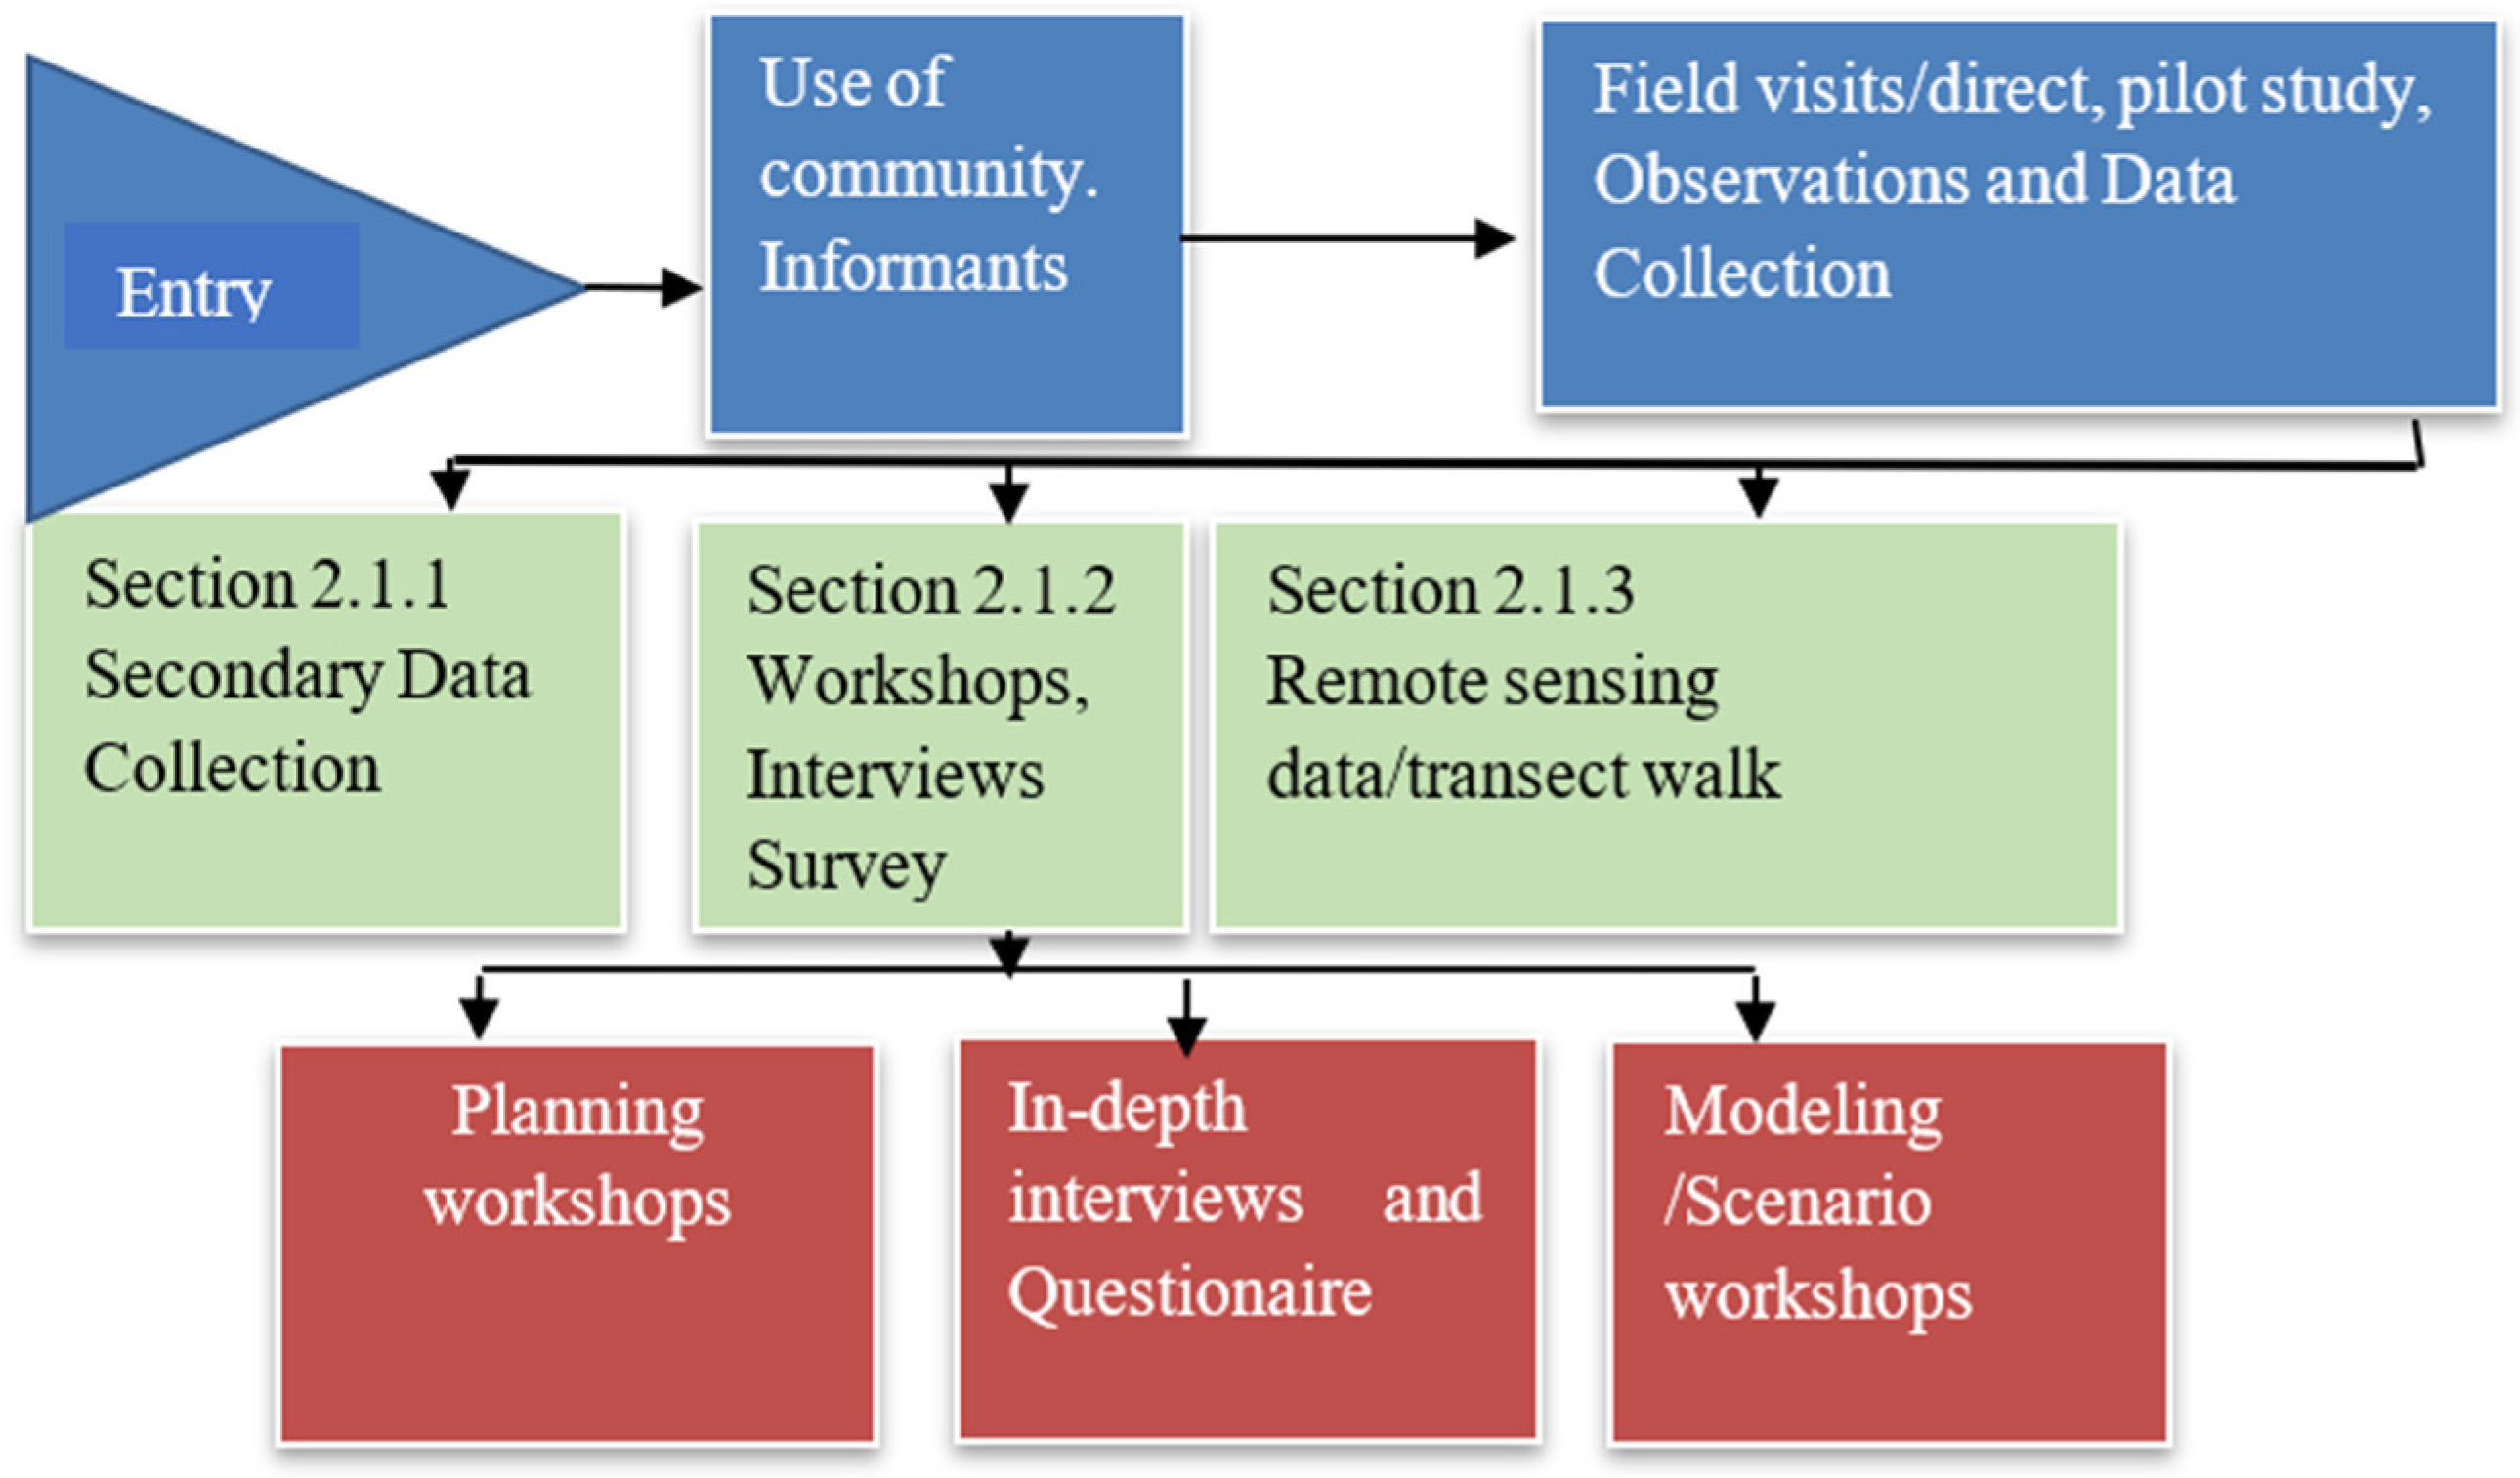
Defining Input Variables and Data Collection Procedures: In advancing our fuzzy logic models for conflict modeling, we adopted a triangulation approach, distinguishing it from the methods employed in previous studies [71,72]. The data collection between 2015 and 2022 began with a pilot study, workshops, and ground truth satellite data collection. Refer to Section 2.1.1, Section 2.1.2, and Section 2.1.3 for the main sources of data collection (Figure 2).
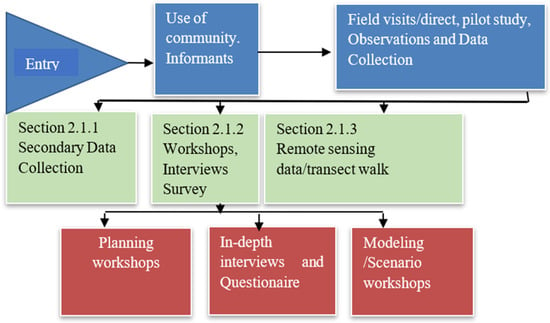
Figure 2.
Fieldwork steps.
The data types (refer to Table 2) used to construct FUZZYCONDATA served as the foundation for modeling (for details on spatial data attributes, refer to Section 2.3). To ensure the robustness of our data, we leveraged data consisting of rebel-based and territorial-based conflict typologies. Rebels and ethnic militias use coordinated violence against governments, oil firms, and security forces. The UCDP compares them to governmental conflicts. Conflicts that are not centered on resources, like violence during elections, are disregarded when separating those that are. In territorial-based conflicts, actors involved include farmers, young people, and people from communities who take part in riots and protests because they are worried about issues including social and political inequality and loss of livelihoods, the benefits of extracting oil resources, and conflicts pertaining to land use. They may primarily occur because of a locality’s historically limited supply of renewable resources. The observed data were downloaded from the following:

Table 2.
List of datasets and sources in vulnerability assessment of natural resource-based conflicts.
- The UCDP Dataset—(refer to the Uppsala Conflict Data Programme (UCDP) on the website: https://www.ucdp.uu.se/downloads/, accessed 1 January 2016.
- The ACLED Dataset—(refer to Armed Conflict Location Event Data (ACLED) on the website: https://www.acleddata.com/data/, accessed on 1 January 2016) [10,73] and to [73] for a discussion of the two types of NRCs.
Additionally, we incorporated remote sensing datasets. Table 2 shows a list of the data sets, adapted from [10]. The use of triangulation and the pilot study bolstered the validity and reliability of the data.
2.1.1. Data from Secondary Sources
We gathered secondary data sets from various diverse sources as summarized in Table 2, including statistical profiles and socio-economic indicators. We considered demographic characteristics, primary health care data, spatial data (such as land cover information), and data pertaining to oil infrastructure, including details on oil pipelines, oil wells, and oil spill incidents.
2.1.2. Workshops, Surveys, and Local Knowledge on Perception of Conflicts
This phase of our data collection process involved collaborative efforts from our research team, which included Ph.D. scholars, MSc researchers from the University of Port-Harcourt, Nigeria and some staff of the Executive Director of the Youths and Environmental Advocacy Center (YEAC) (refer to acknowledgements section). We engaged in a variety of activities during our modeling sessions with field assistants and local community members. We distributed 40 semi-structured surveys to important stakeholders in each community to obtain insightful opinions. Table 3 shows the distribution of questionnaires, adapted from [10]. This resulted in the retrieval of 200 field questionnaires. In contrast to previous studies [71,72] we employed a unique approach during our modeling workshops. In these workshops, we collaborated with research teams from Germany and Nigeria to rate modeling parameters on a scale ranging between 0 and 10.

Table 3.
Distribution of structured questionnaire.
2.1.3. Remote Sensing for Deriving Environmental Parameters
We deployed optical remote sensors to obtain the essential environmental and physical parameters of the model (refer to Table 4, adapted from [10]). The data collection was from two periods: one before the 1980s, during a time marked by intense conflicts in the study area, and the other from the late 1980s to the early 1990s [72]. Transect walk sessions supported the pre-processed data, aiming to incorporate local knowledge.

Table 4.
Characteristics of satellite images used.
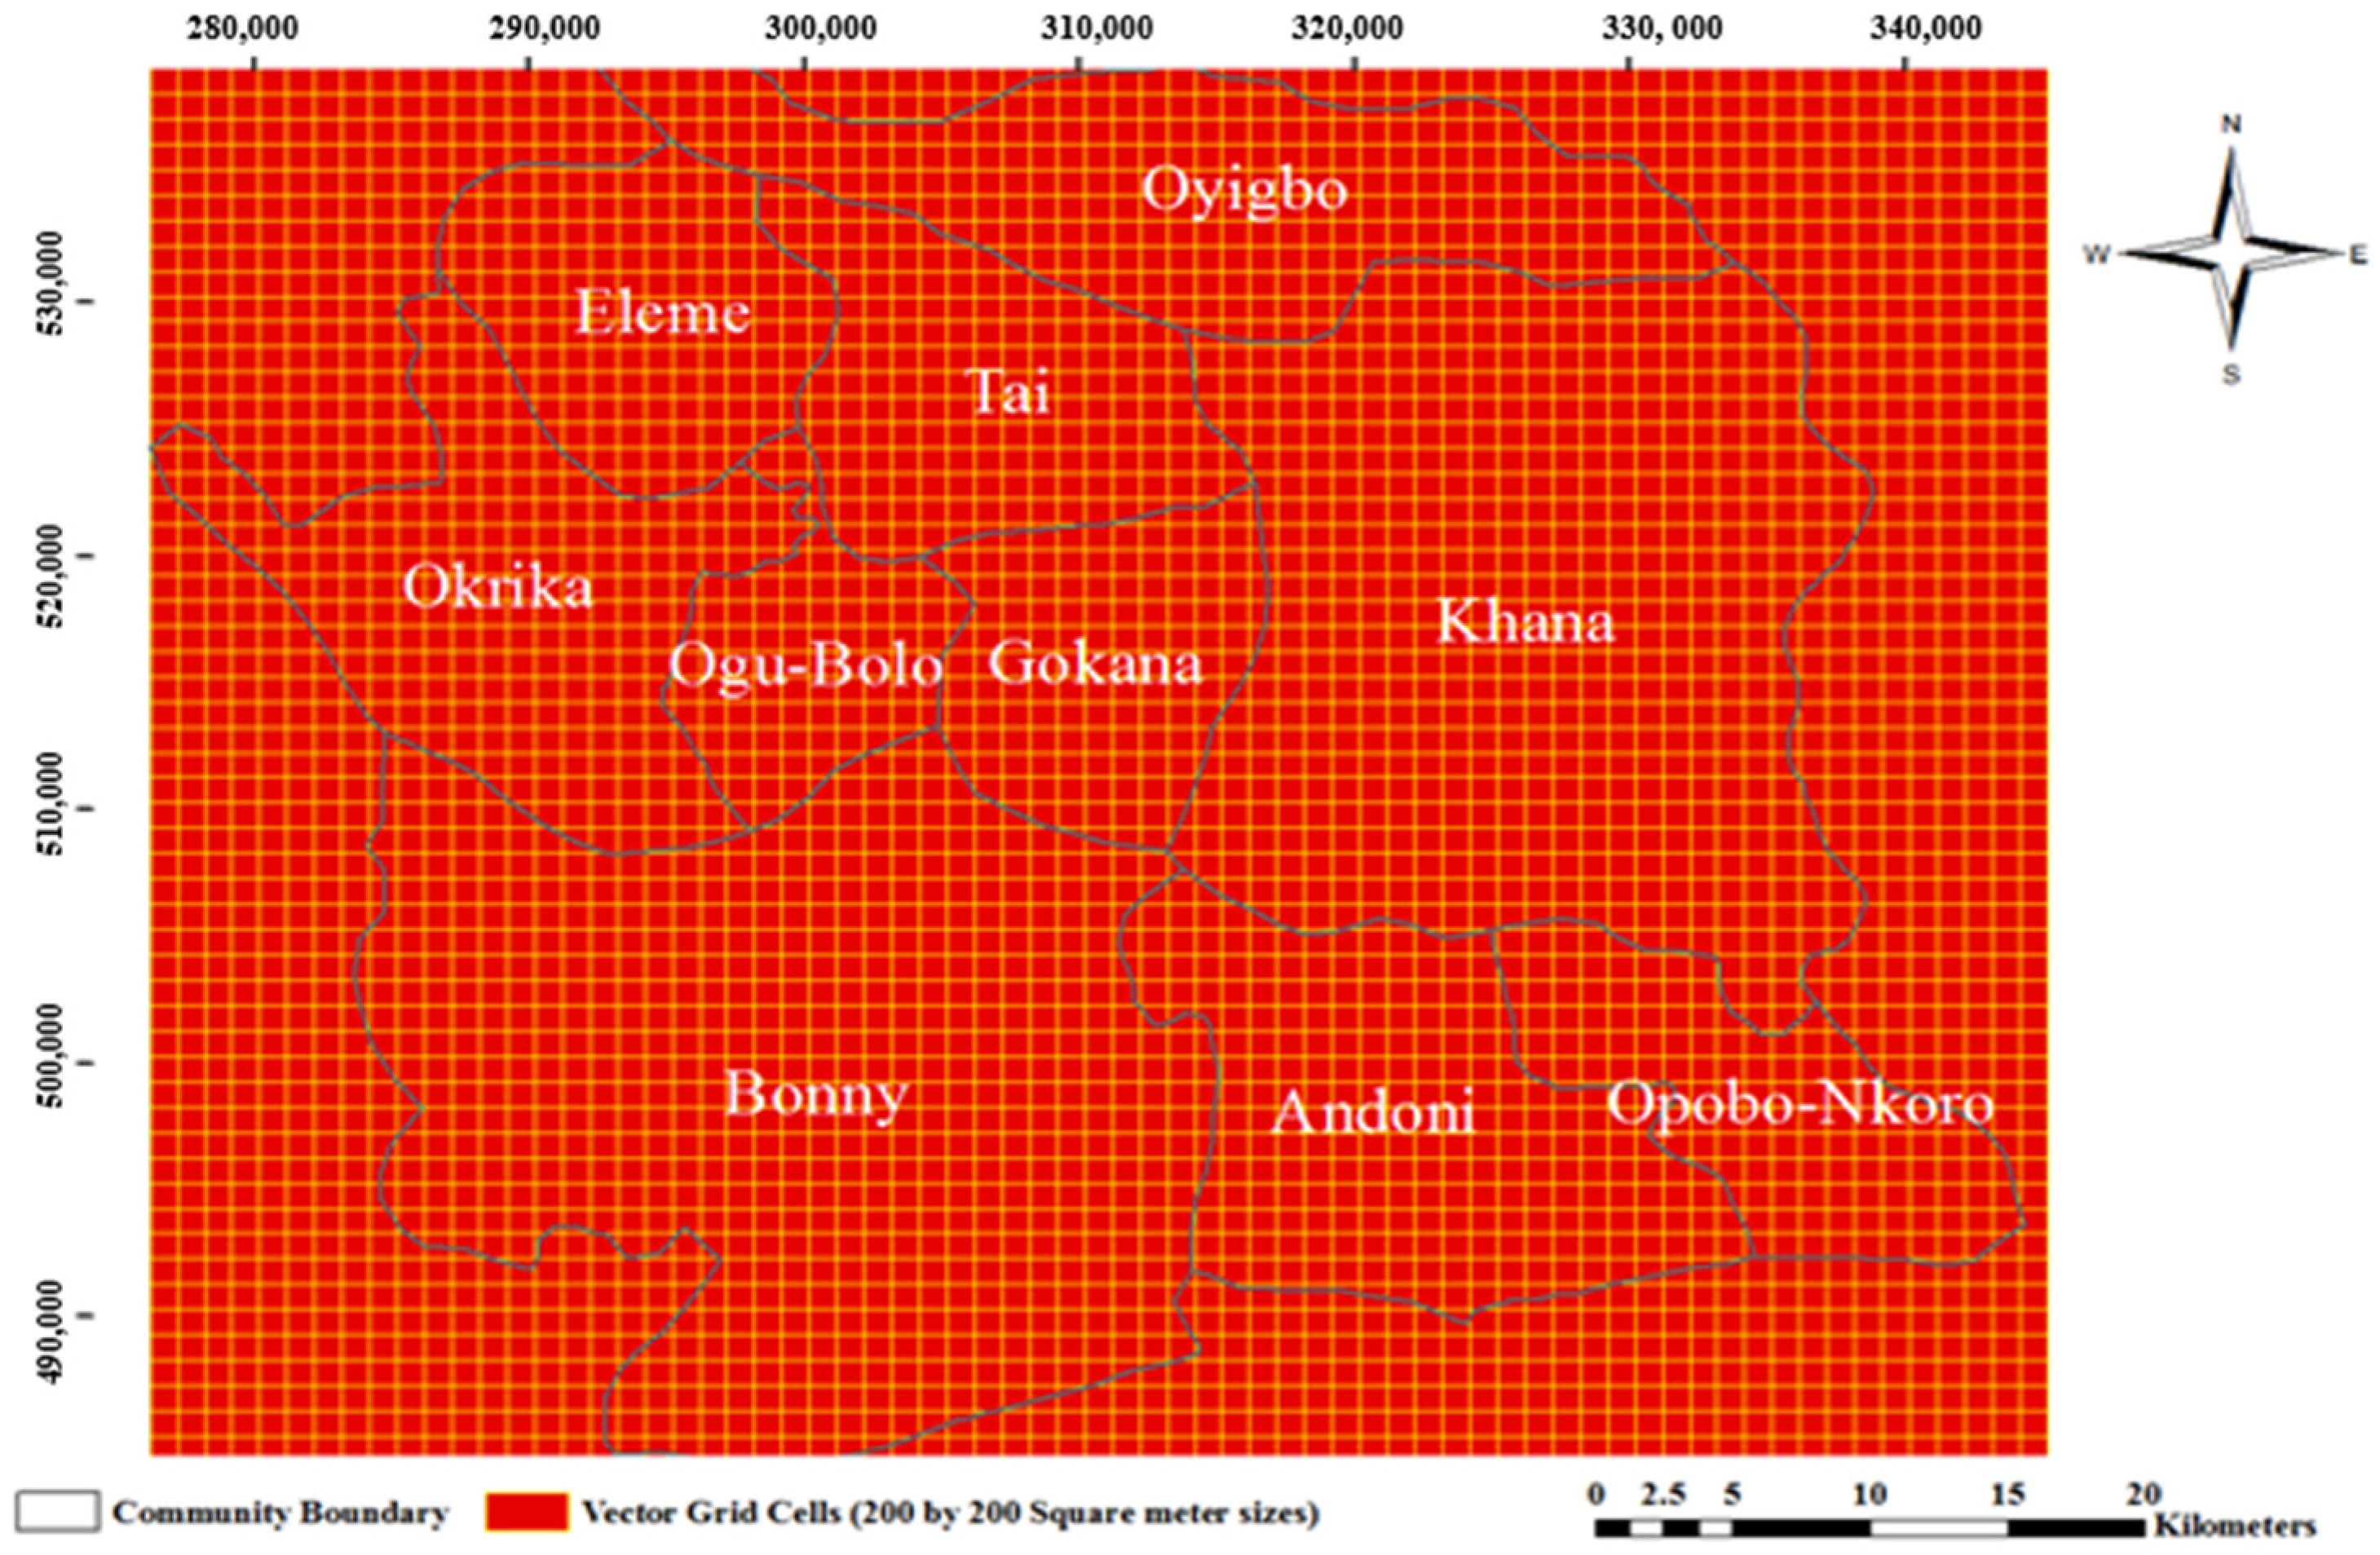
We conducted feature extraction using classification schemes that align with the research goal and existing frameworks. Table 5 shows the land use classification scheme, adapted from [10]. This process drew from established schemes [74,75] and involved post-classification comparisons, contingency tables, and intensity analysis for the intervals [76]. Euclidean distance measurement identifies an object based on its perceived spatial boundaries, not just its location and surrounding environment [77]. For instance, villagers tend to minimize the distances to essential resources, such as streams, arable farms, primary health care services, etc. Additionally, the proximity to oil infrastructure increases the likelihood of conflicts, as noted by [59,78]. Table 6 and Equations (1) and (2) show how the distance variables were derived (adapted from [10]). We developed Spatially Explicit Distance Parameters (SEDPs) based on artificially constructed 200 by 200 m square grid cells, using geographic information systems (GIS) to resolve the available data and the study area (see Figure 3).

Table 5.
Classification scheme used for land use and land cover in this study.

Table 6.
Measurement of distance in GIS.
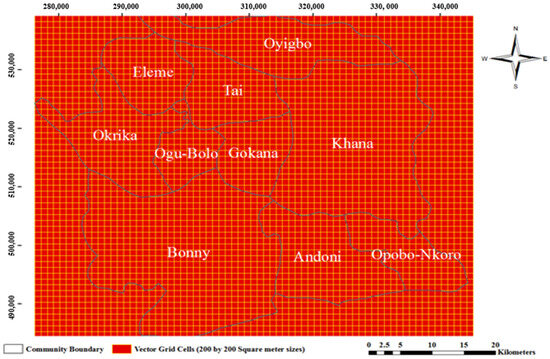
Figure 3.
Sample conflict grid cells.
2.2. Model
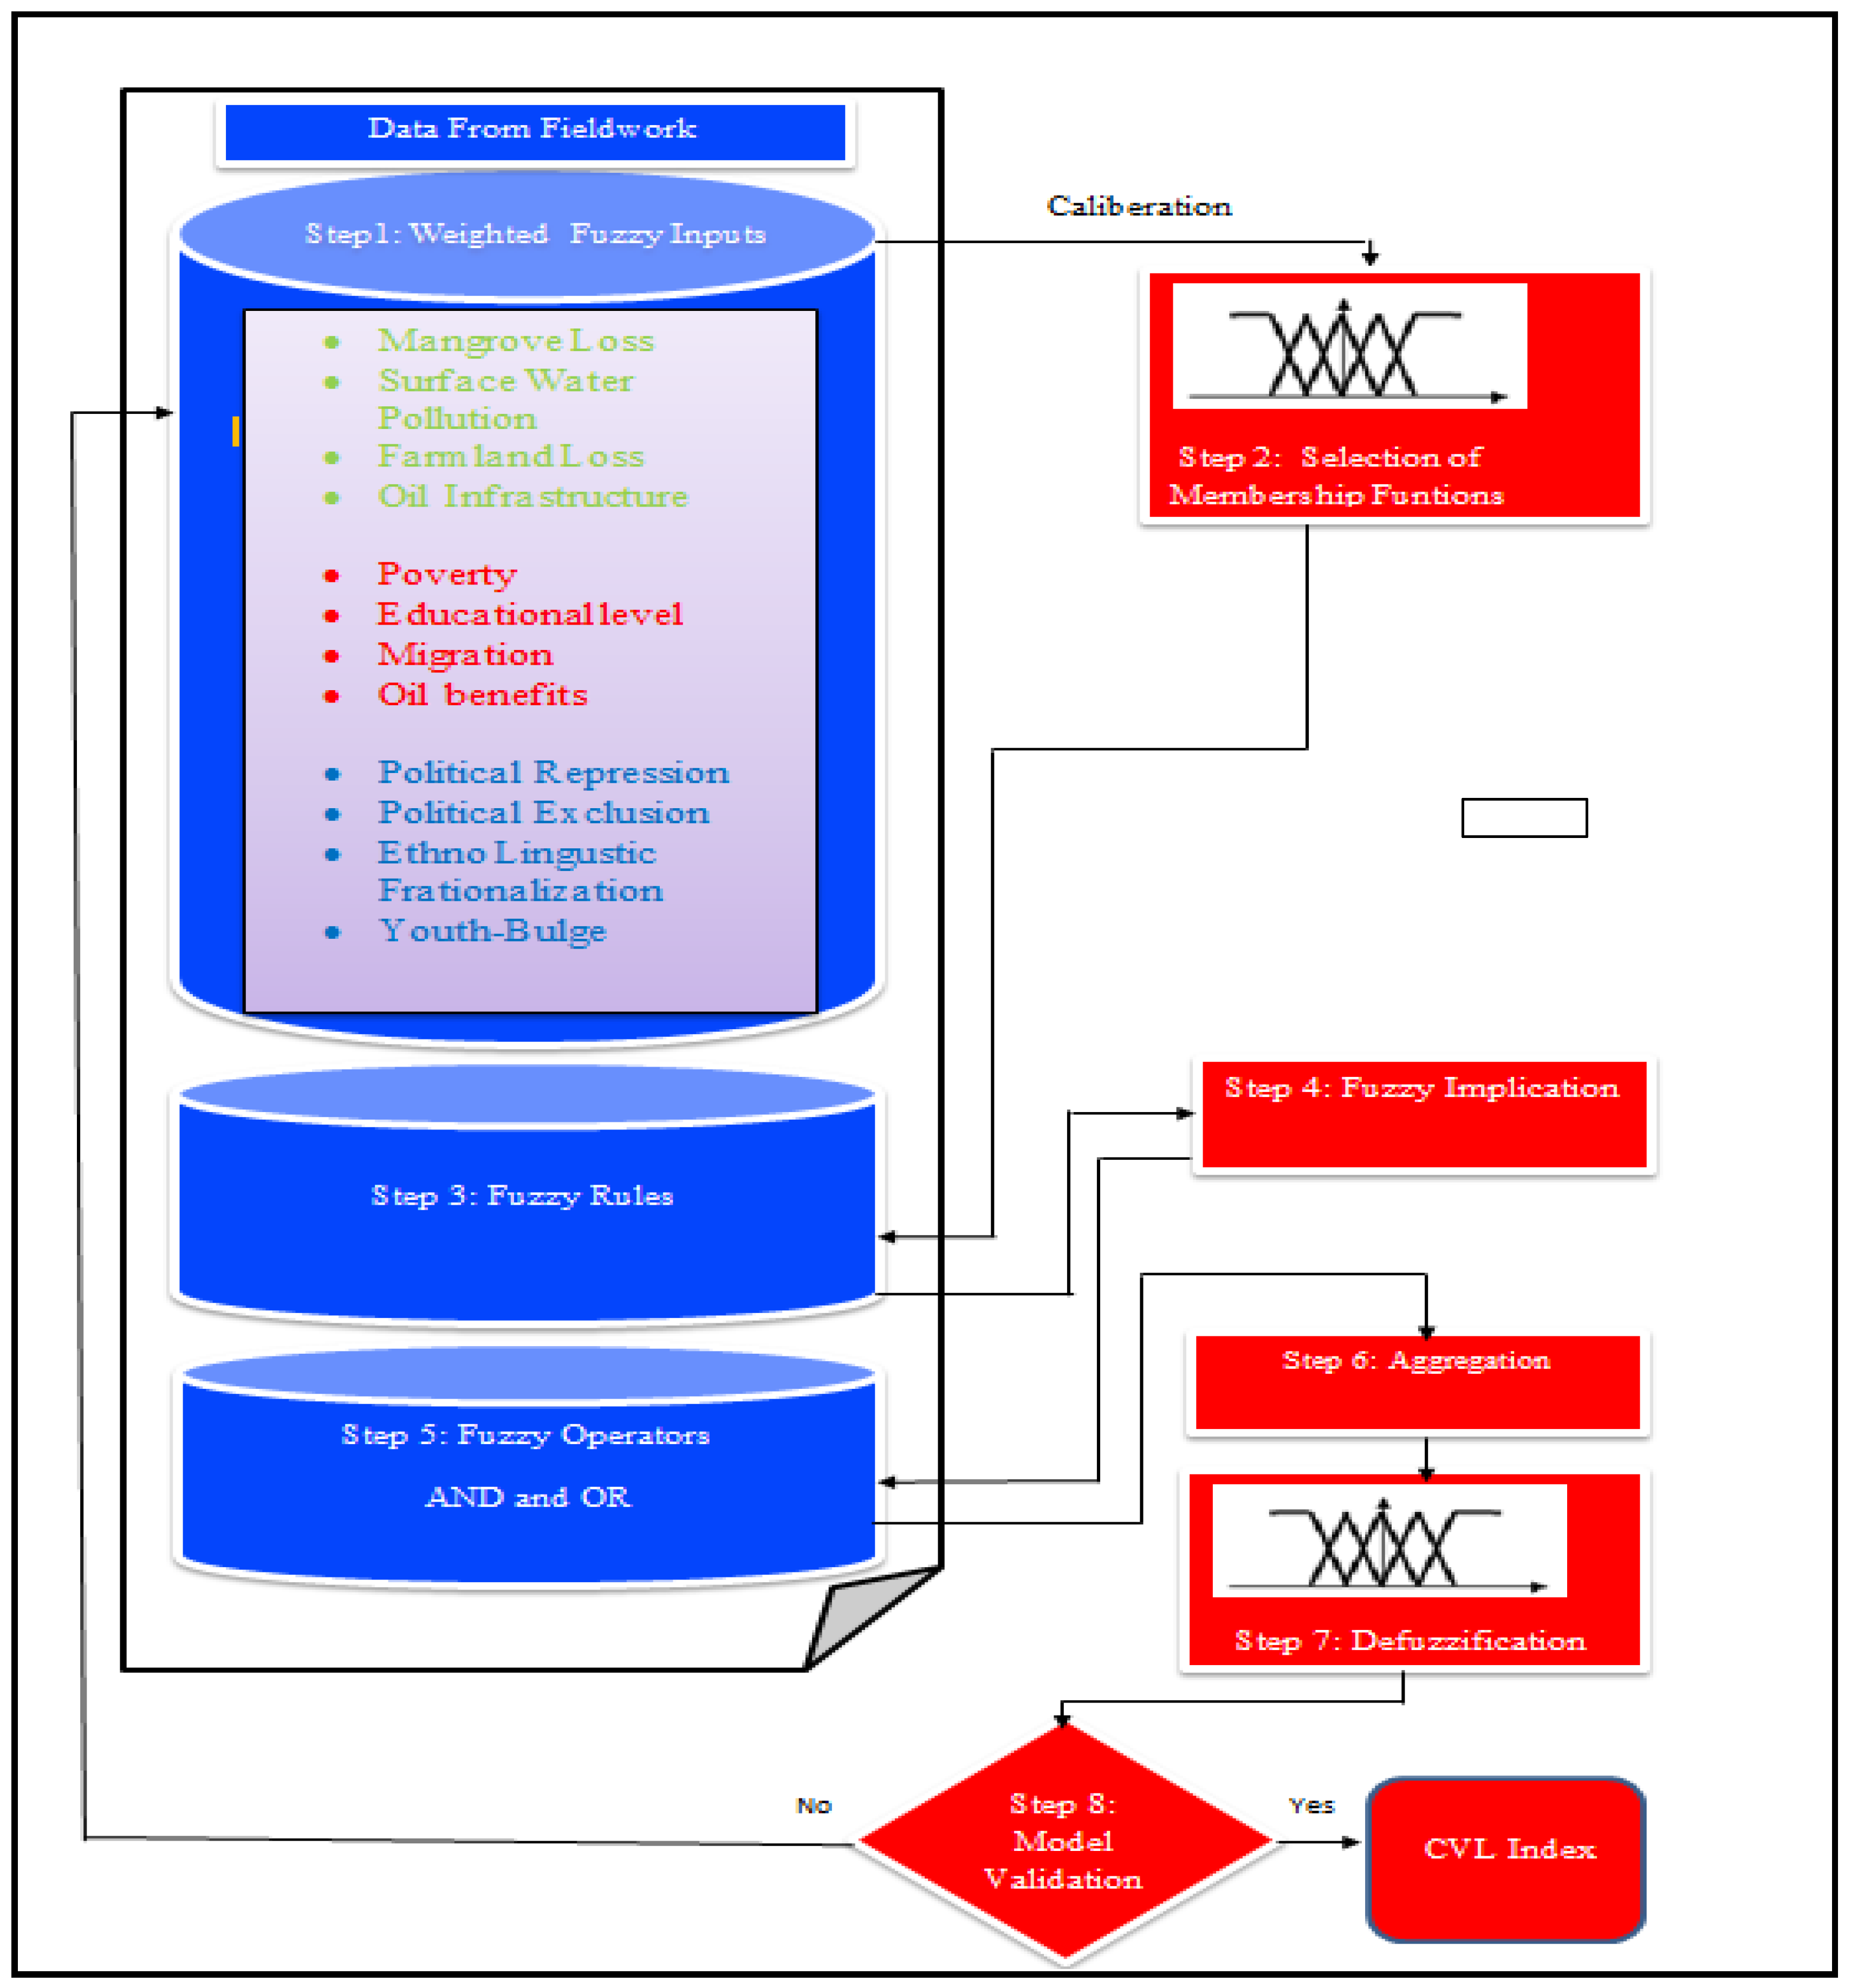
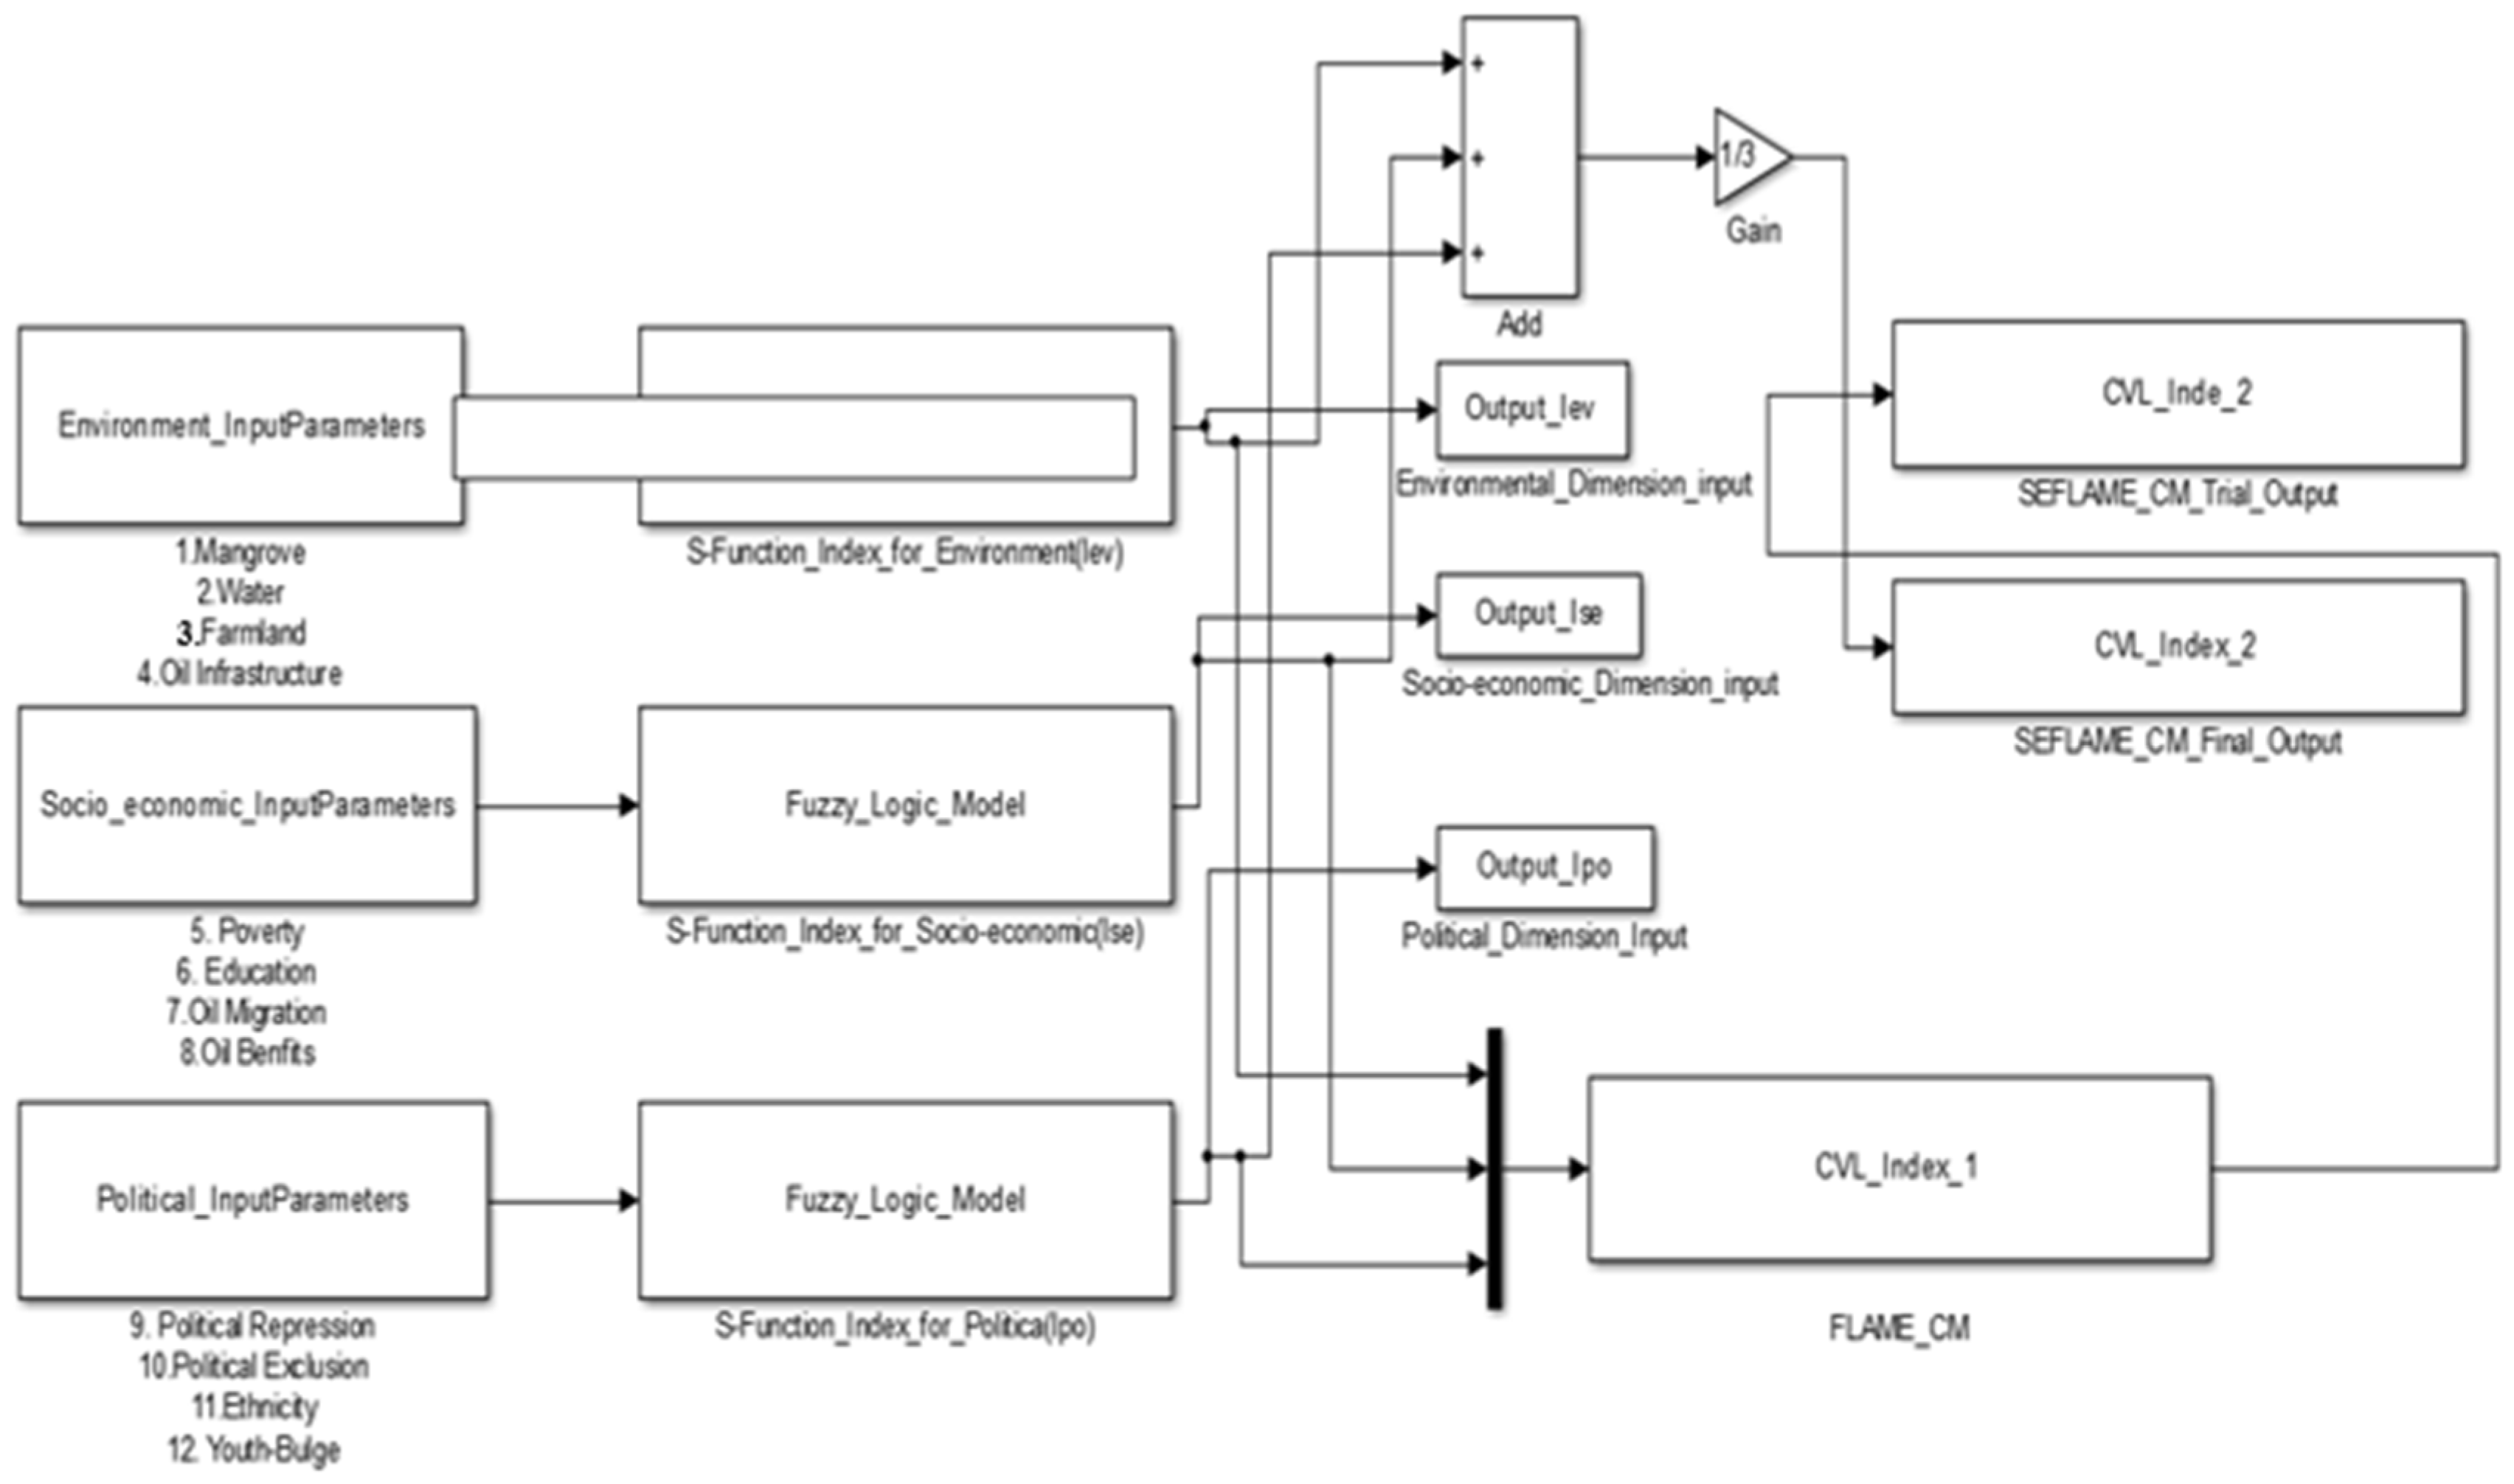
The steps followed in the modeling processes for both the FLAME-CM (the non-spatial model) and SEFLAME-CM (spatial model) [10] detailing the inputs and outputs are outlined in this section. Figure 4 illustrates the architecture of the integration and modeling steps. We achieved SEFLAME-CM by integrating Mamdani fuzzy inference systems in MATLAB R2024b version 24.1 for windows with Simulink families for calculations and simulations and using GIS for the fuzzy maps.
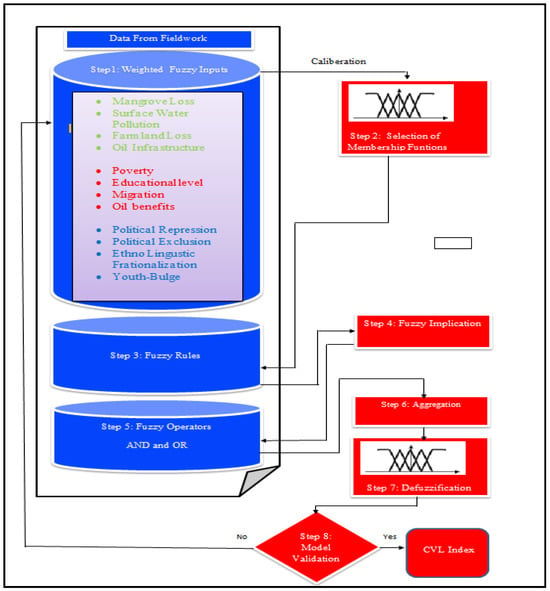
Figure 4.
Field data integration architecture for the SEFLAME-CM design stages [10]. In the diagram, the fuzzy input factors are explained thus: green = environmental dimensions, red = Socio-economic dimension, blue = political dimension.
2.2.1. Qualitative and Quantitative Data Integration Procedures
It is possible to connect the language and statements provided by local actors to quantitative modeling [10]. This integration occurred in two key steps: First, we derived the factors under each socio-economic and political category from interviews, followed by secondary data sources. Second, the actors weighed the input variables. For the environmental variables, the actors, for example, derived the weights (see Equations (1) and (2)) from a questionnaire survey and we integrated the weights into the distance measurements in kilometers (KM) from the natural resource’s locations to the village center. On the other hand, we integrated the weights into the collected secondary data using the same procedure for the socio-economic and political dimensions.
2.2.2. Model Variables and Implementation Procedures
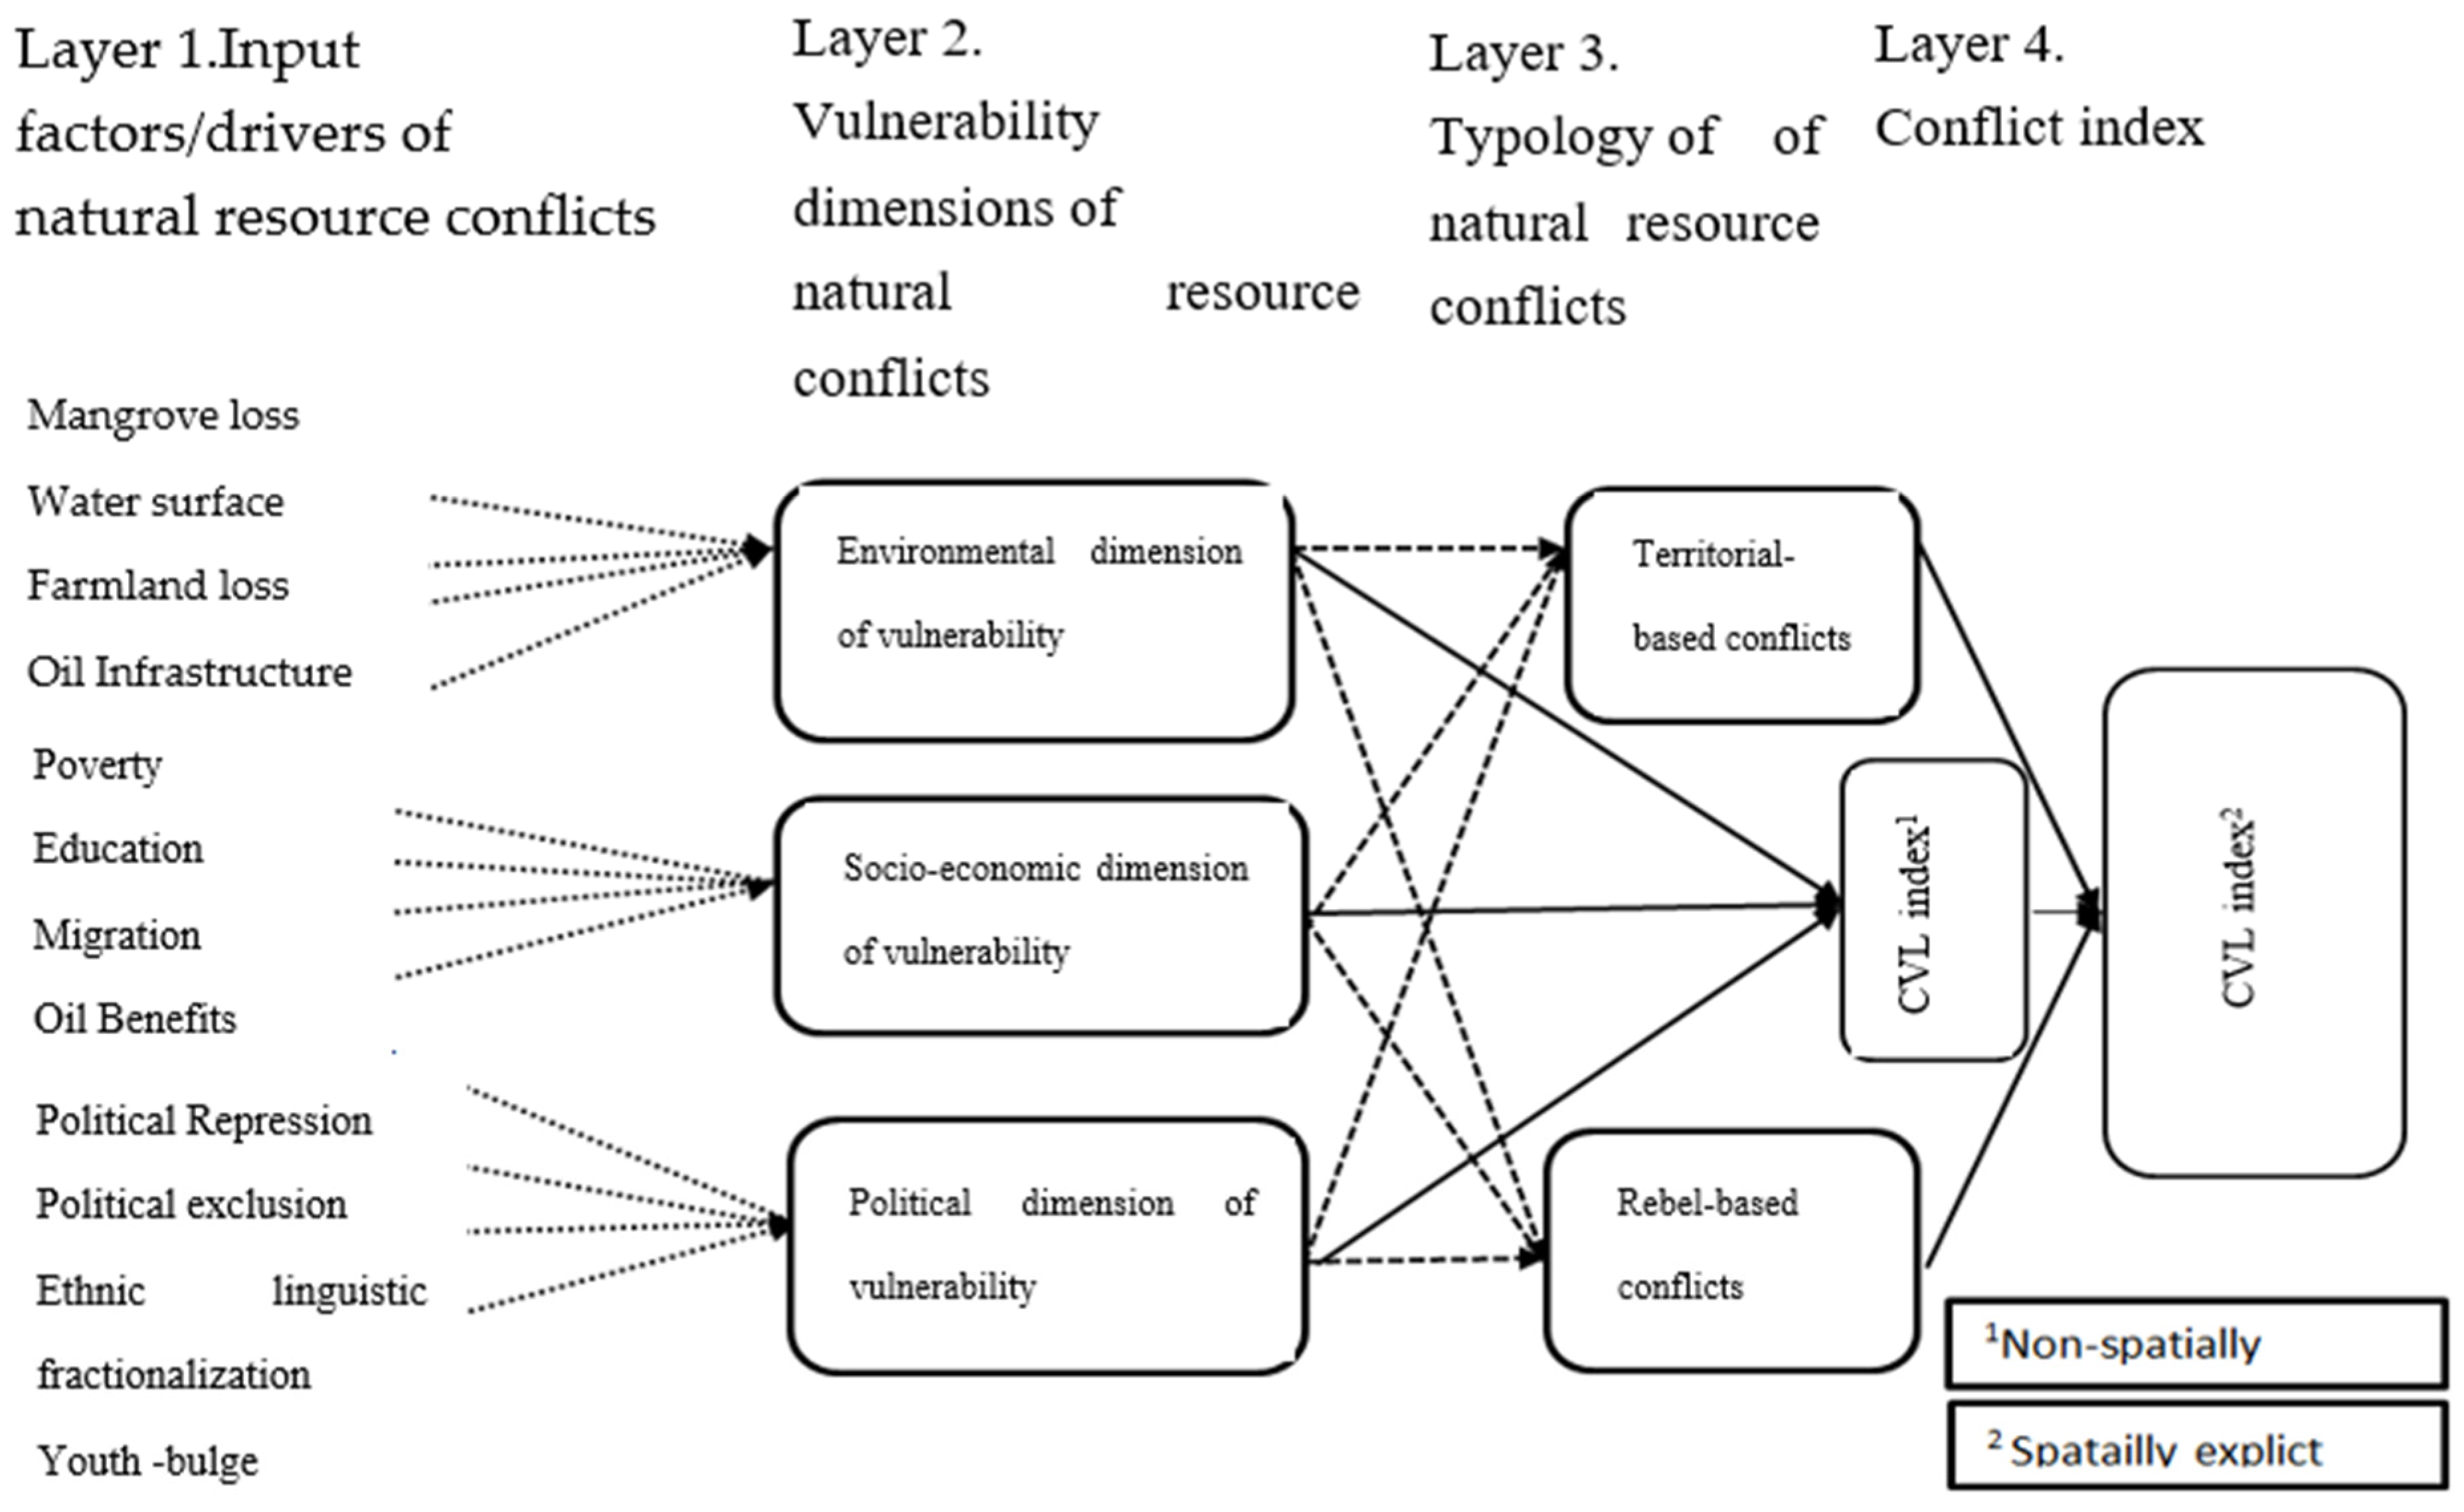
We weighed the model inputs (see Equation (1)) to integrate local knowledge and experiences of NRCs in the Niger Delta. Each layer of the output then serves as the input layer for the subsequent input (refer to Figure 5). We describe the four layers of the model below.
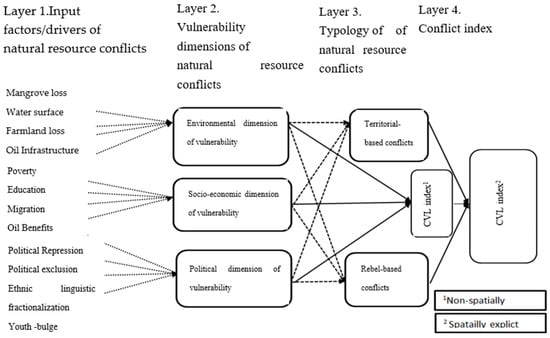
Figure 5.
Model input data layers with a simplified hierarchical layout.
- Layer 1:
- Deriving the initial input parameters based on weights from the actors.
The initial layer encompasses the input parameters of the NRCs. The categorization of the drivers into three dimensions was clearly illustrated earlier in Figure 4. Refer to Table 1 for the environmental, socio-economic, and political drivers of the NRCs [10]. The parameters are categorized within each of these three drivers. The parameters are the primary quantitative measurements.
They make up the NRCs’ imprecise, measurable input variables. The environmental dimensions include factors such as proximity to mangrove forests, surface water contamination, agricultural land, and oil infrastructure. We incorporated these characteristics into the observed lengths utilizing a scale (0–10), as demonstrated in Equations (1) and (2).
The actors (stakeholders) rated how they perceived the influence of distances to mangroves (very near, near, and far) on NRCs (refer to Equation (1)) [10]. This equation was used to determine the inputs of mangrove loss, among other environmental factors. As seen in Equation (2), the rating of the distance is integrated into three fuzzy categories of the actual measured mangrove loss distances one, two, and three (MLdist1, MLdist2, and MLdist3), respectively, in percentages.
where
R = Range of rating [0 10]
N = Number of actors who gave the weight among the actors in a village)
MLdist1% = Mangrove loss distance (fuzzy parameter category 1) in %
MLdist2% = Mangrove loss distance (fuzzy parameter category 2) in %
MLdist3% = Mangrove loss distance (fuzzy parameter category 3) in %
- Layer 2:
- Integrating the model input parameters.
There are three dimensions of conflict drivers. We integrated them and derived the result of layer 1 which became an input for layer 2 leading to the Conflict Vulnerability Likeliness (CVL) Index for each of the dimensions. We derived indices for environmental drivers (Iev), socio-economic drivers (Ise), and political drivers (Ipo) [72]. To generate the environmental dimension, refer to Equation (3). The values for all fuzzy environmental drivers derived from layer 1 are summated, divided by the value of the corresponding membership area [72] in percentage (%), and then transformed to (1–10) for comparison with other parameters. We used similar formulas for all three dimensions as stated in Table 2. Also refer to Figure 4 and Figure 5.
where
YIev = Conflicts index value for environment (ev) for response variable (Y)
ev = Environmental drivers of conflicts
evi = Value of the membership function of the output fuzzy set, ev in rule i
i = Representing rule i of the ev inputs
Ai = Value of the corresponding membership area, indicating the degree to which rule i is fired
- Layer 3:
- Target variables (Y): The rebel conflicts (RBC) and territorial conflicts (TBC).
Two typologies of NRCs were modeled, as reported earlier. We set up a Layer 3 model to assess the relationship between the two conflict typologies and the drivers’ dimensions (1. Environmental, 2. Socio-economic, 3. Political). The following were derived using the equation in Appendix A.1. The CVL Index distinguishes rebel NRCs vs. environmental drivers (YIevRBC), rebel-based conflicts vs. socio-economic drivers (YIseRBC), and rebel NRCs vs. political drivers (YIpoRBC).
We derived the conflicts index for rebel NRC conflicts vs. environmental drivers (YIevRBC), as shown in Appendix A.1. This was based on the division of YIevRBC with the value of the corresponding membership area. Additionally, the same approach was used to model territorial NRCs(TBC) vs. the three dimensions earlier mentioned. Therefore, the resulting CVL Index distinguishes the territorial NRCs (YIevTBC) vs. environmental drivers of conflicts from territorial NRCs vs. socio-economic drivers (YIseTBC) and that of territorial NRCs vs. political drivers (YIpoTBC).
We calculated the ultimate CVL Index for the rebel NRCs typology using the equation in Appendix A.2. This was determined by the average of the following: YIevRBC, YIseRBC, and YIpoRBC [10]. We used a similar model to derive the ultimate CVL Index for territorial NRCs, thus an average of YIevTBC, YIseTBC, and YIpoTBC.
- Layer 4:
- The CVL Index 1 and the CVL Index 2.
The CVL Index is Conflict Vulnerability Likeliness Index 1 (refer to Appendix A.3), while CVL Index 2 is Conflict Vulnerability Likeliness Index 2. CVL Index 1 specifically relied on FLAME-CM [10]. This is not the spatially explicit model [10]. It is rather the average of the output derived from layer 2, meaning the integration of the NRC driver dimensions.
The average of layer 3’s output was calculated based on the spatially explicit model SEFLAME-CM. Therefore, SEFLAME-CM is the integration of the rebel NRCs (YIevRBC) and territorial NRCs (YIevTBC) in a spatial context using Equation (4) [10].
where
CVL Index2 = Conflicts Vulnerability Likeliness Index-spatially explicit [0 1]
YIRBC = Conflicts index for rebel-based conflicts
YITBC = Conflicts index for territorial-based conflicts
n = Number of conflict typology.
2.2.3. Membership Functions (MFs) and Evaluation
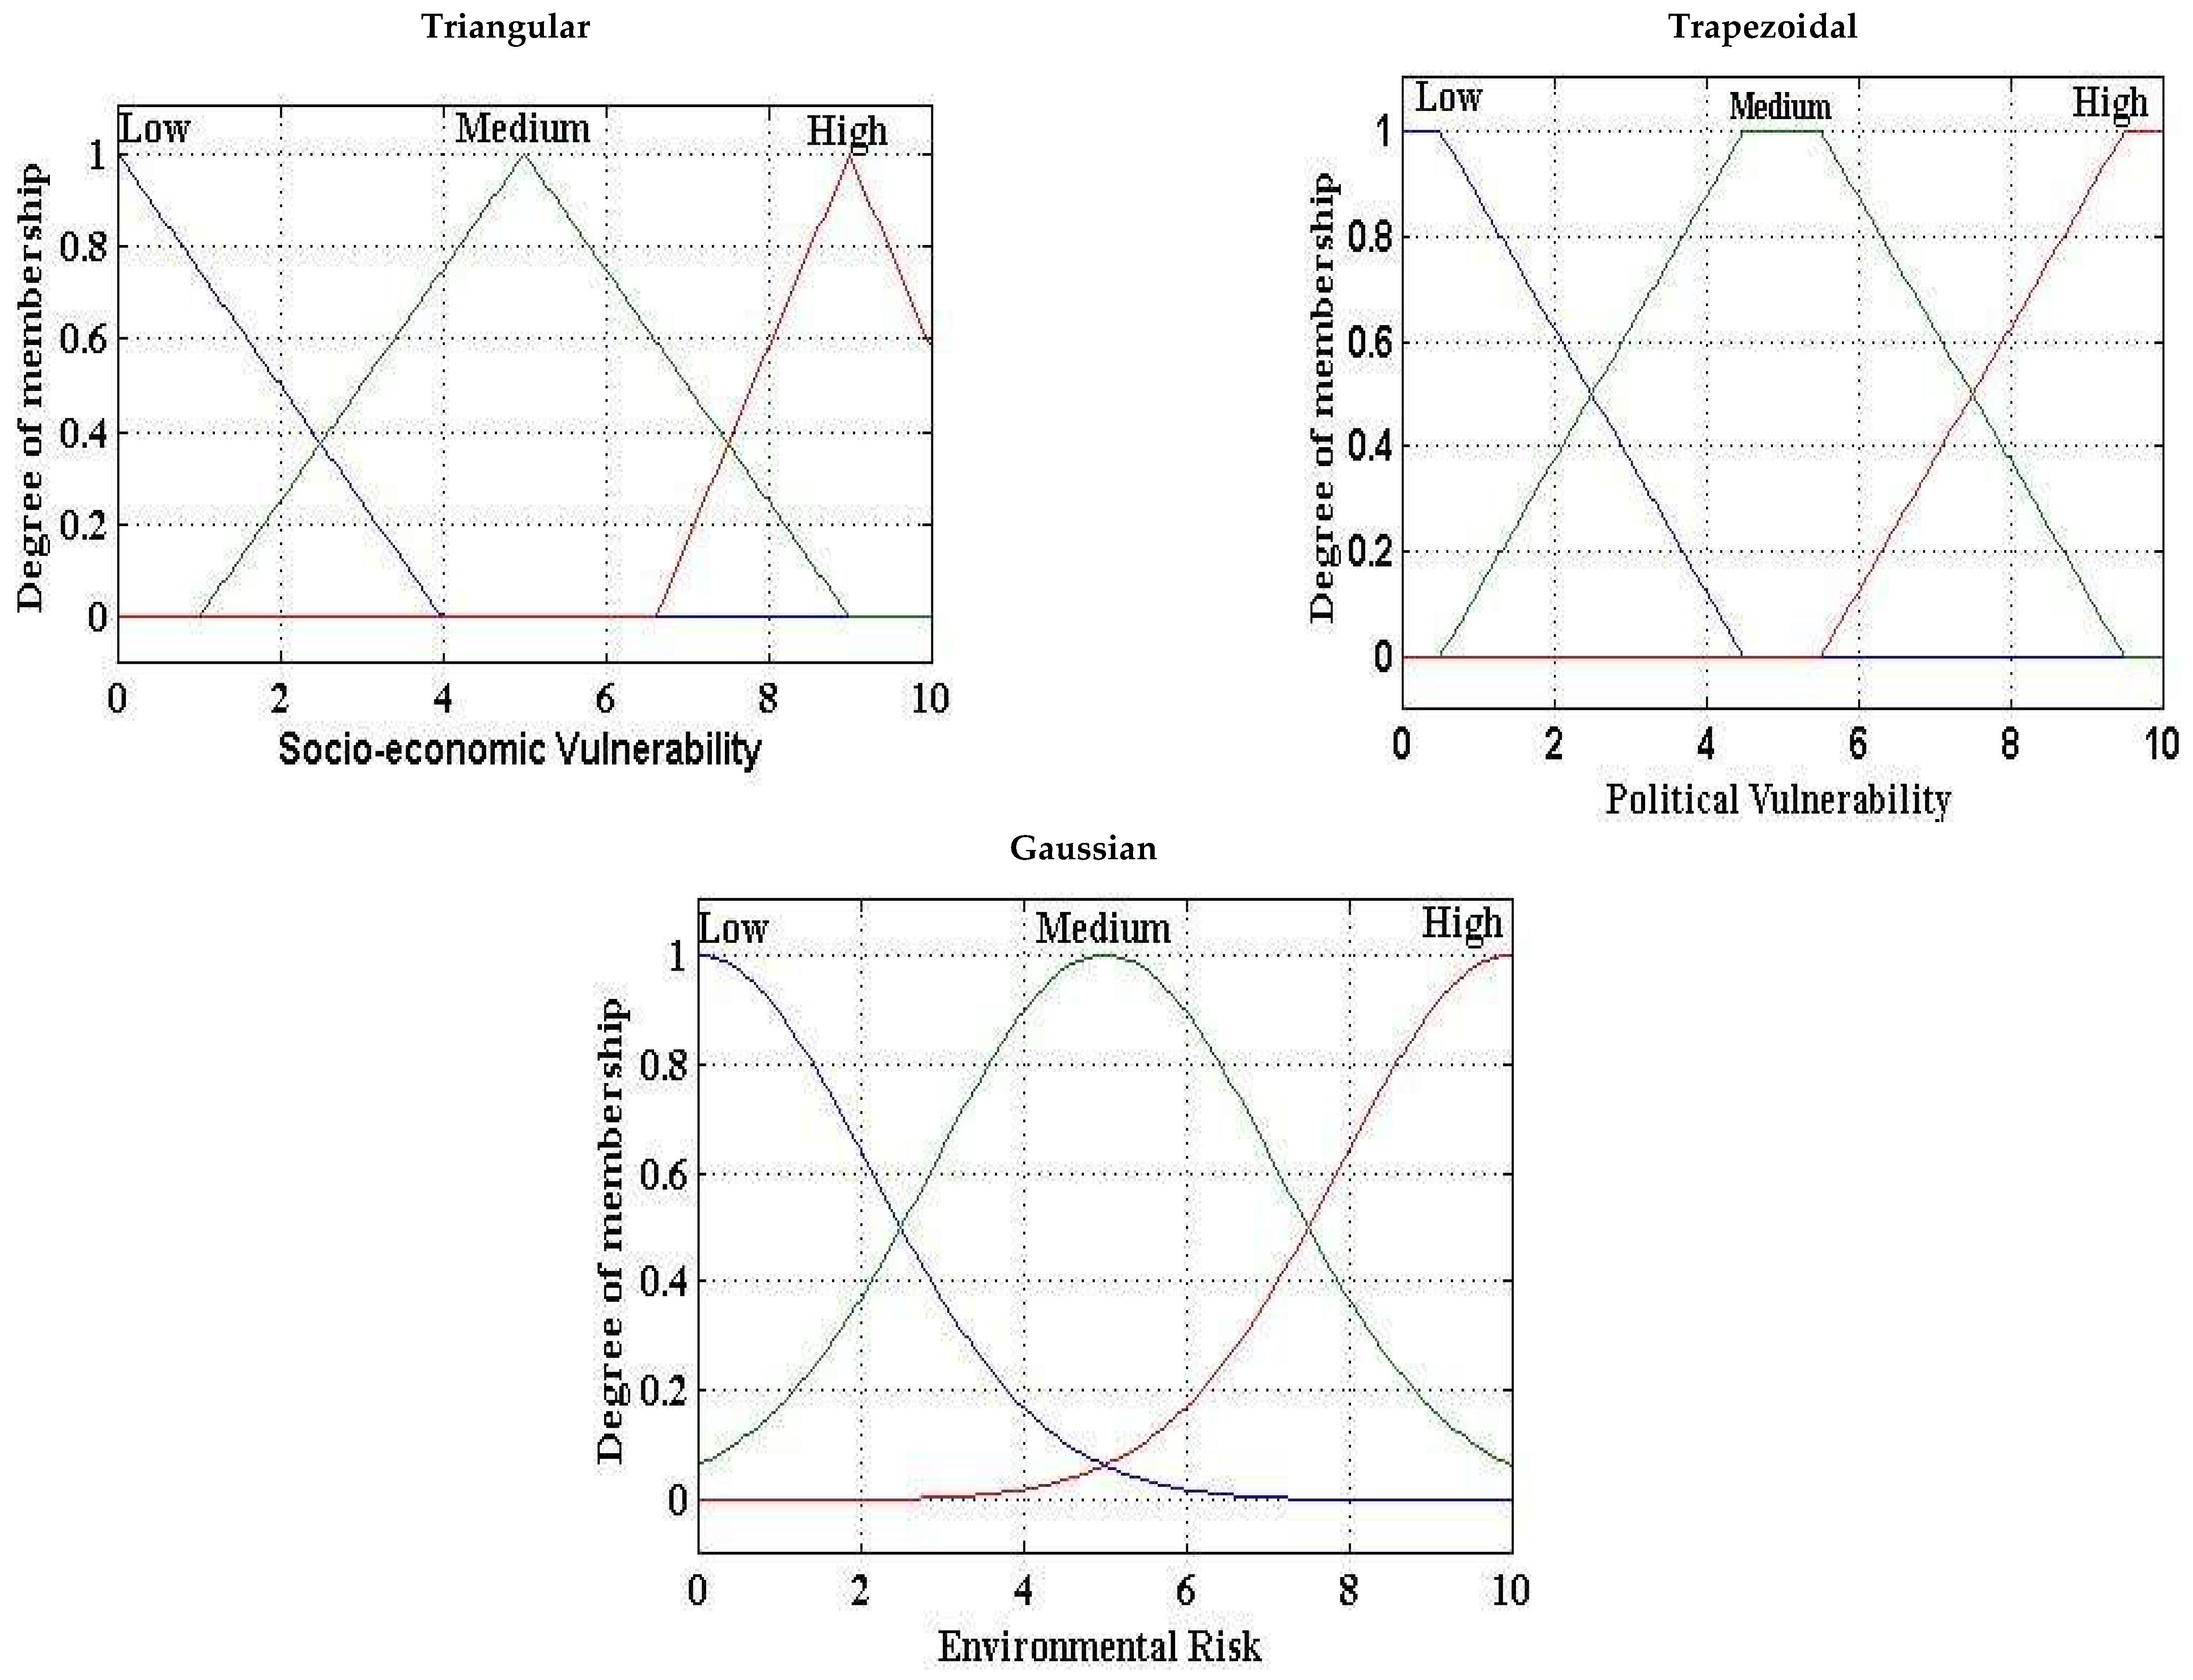
Membership functions (MFs) are crucial in fuzzy logic models. Examples of common MF shapes include triangular, trapezoidal, Gaussian, and bell-shaped MFs. Triangular, trapezoidal, and Gaussian membership functions were the types examined to evaluate membership functions (see Figure 6).
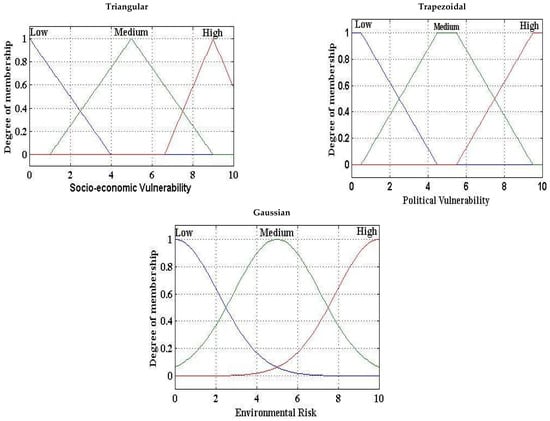
Figure 6.
Membership function types (triangular, trapezoidal, and Gaussian MF).
2.2.4. The Process of Creating Fuzzy Rules by Combining Expert Knowledge with Linguistics Statements from Interviews
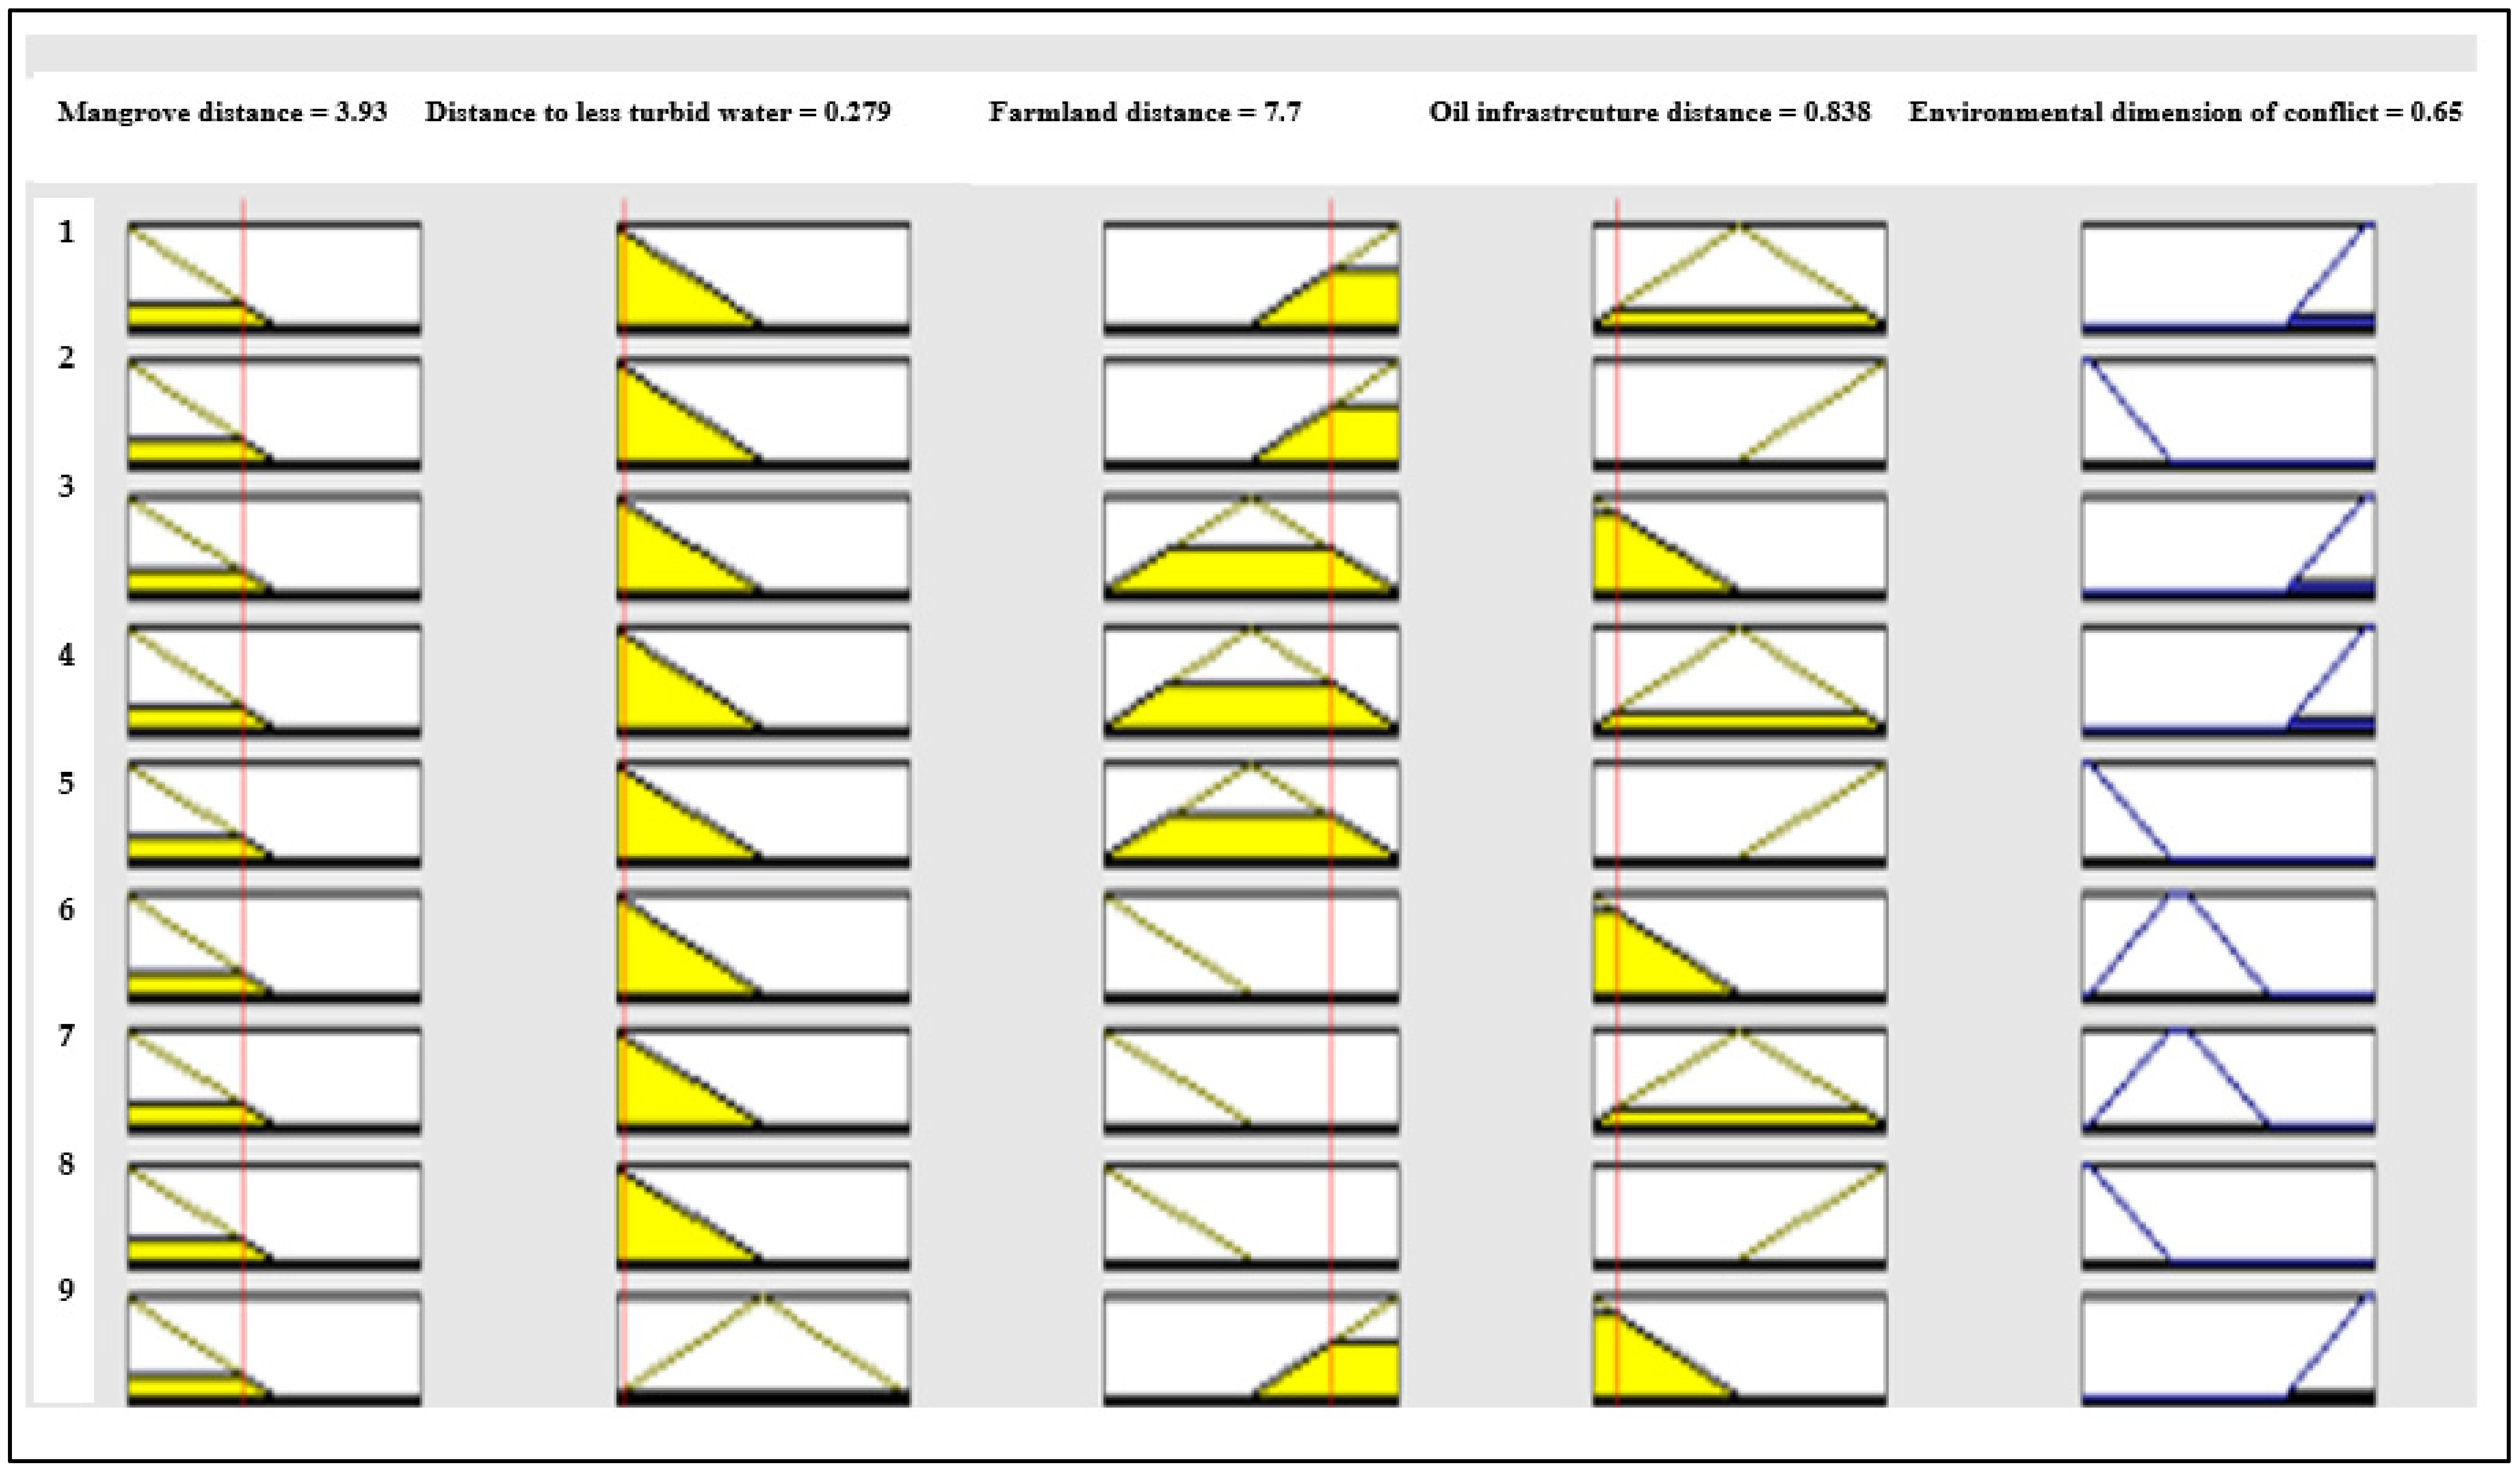
In a fuzzy logic model, the logical inference must replicate the knowledge base relevant to the problem under investigation, with the selection of the number of curves dictated by the number of model variables and membership functions [79]. We had four model variables under each of the NRC driver dimensions. Each fuzzy parameter is assigned one of three membership functions. We derived the rules by raising (x) to the power of the input variables (y), Since there were four input parameters, this yielded , or . There were 81 rules created in all [80,81,82]. Refer to Figure 7 for a sample rule format that guided the implementation of SEFLAME-CM [10]. Also refer to [80,81,82], for justification of the number of rules. The left of the rule bar shows the integration of the four input environmental parameters, while the right side shows the output.
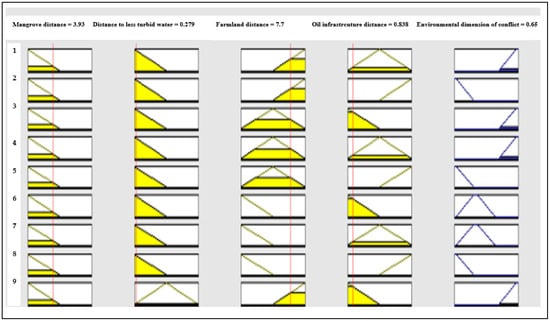
Figure 7.
A Sample of how environmental parameters are integrated to form fuzzy rules in SEFLAME-CM, as demonstrated in MATLAB Simulink.
2.2.5. Fuzzy Implication Rules
Following the assignment of weights to each rule, the subsequent step entailed analyzing the fuzzy implications of the rules to articulate the relationship between inputs and outputs. The antecedents assign weights to each rule, with a range from 0 to 1. If the weight is set to 1, there will be no impact on the implication process. We calculated the weighting of each rule in relation to the ratings assigned to the other rules. The weightings of the fuzzy rules are aggregated (refer to Equation (5)). The implication rule has two parts: the “consequent” and the “antecedent”. To finalize the implication rule, the “consequent” and MF’s corresponding linguistic properties are altered with a function linked to the antecedent. The implication rule for each rule is executed based on Equation (5). As shown, TWARA is divided by the N. The TWARA is “the total weight assigned to a rule by actors” while N is “the number of actors”. TRWev represents the “total weight of the environmental dimension”, as detailed in Equation (5).
where
TWARAev = The total weight assigned to a rule by actors (TWARA) on environmental drivers (ev)
TRWev = Total rule weight used for environmental drivers’ dimension (ev)
TNPW = Total number of possible weights of a rule in ev
R = Range [0–10]
N = Number of actors assigning a weight
2.2.6. The OR and/or AND Fuzzy Operators
Fuzzy operators connect the segments of the antecedent. However, the implication rule links the “antecedent” and the “consequent” part. As illustrated in Figure 7, every line denotes a rule. When combined with fuzzy operators, fuzzy rules create an inference engine (integrative component) in fuzzy modeling [79]. Assume, for instance, that input fuzzy maps “A”, “B”, and “C” have membership values in each of their attributes with , and , respectively [10]. Then if these “WA”, WB”, and “WC” are the map weights, the fuzzy AND operator can be implemented [10]. The fuzzy output values are derived based on combination [79]. We used the two inbuilt fuzzy operators in MATLAB, which are the OR and AND (refer to the result section in Section 3).
2.2.7. Aggregation of Outputs
Aggregation is the process of combining the outputs from separate fuzzy sets—obtained from the defined rules—into one fuzzy set. Normally, the input of the output functions is the implication process (see Section 2.2.5). This is fed into the aggregation process. For every output variable, aggregation occurs only once before the defuzzification process (see Section 2.2.8).
2.2.8. Making Decisions Using Defuzzification (Centroid Defuzzification Algorithm)
Defuzzification converts the generated fuzzy set into a precise set, representing the outcome of the modeling process. Because of some advantages of the center of gravity (COG) as a type of defuzzification, this was used in our model. Some of the advantages include simplicity, adaptability to new problems [10], and sensitivity to all applicable rules [80,83,84]. Mathematically, the COG can be defined in Equation (6) [85,86,87] (p. 432). The COG equations are utilized across various data layers to execute SEFLAME-CM (refer to Figure 5).
where
Y = Output crisp value
Mi = The value of the membership function of the output fuzzy set of rules i
I = Representation of rule i
Ai = The crisp value of the corresponding membership area, indicating the degree to which the rule i is fired
2.2.9. Model Comparison with Previous Models
Multiple NRCS drivers are combined into a single measure using the model SEFLAME-CM (see Table 7). Refs. [84,88,89] are references for this model. For example, Table 7 displays the parameters used in the model. We compared the outcomes of SMCE-CM with SEFLAME-CM.

Table 7.
Fuzzy input variables.
2.3. Description of FUZZYCONDATA and Spatial Attributes
FUZZYCONDATA, the training and validation datasets, come from a variety of data sources.
Table 7 presents a compilation of input data accompanied by fuzzy set parameters as adapted from [10]. Outputs are categorized into four linguistic classifications. Refer to Table 8 for a summary [10].

Table 8.
Fuzzy outputs.
2.4. Case Study
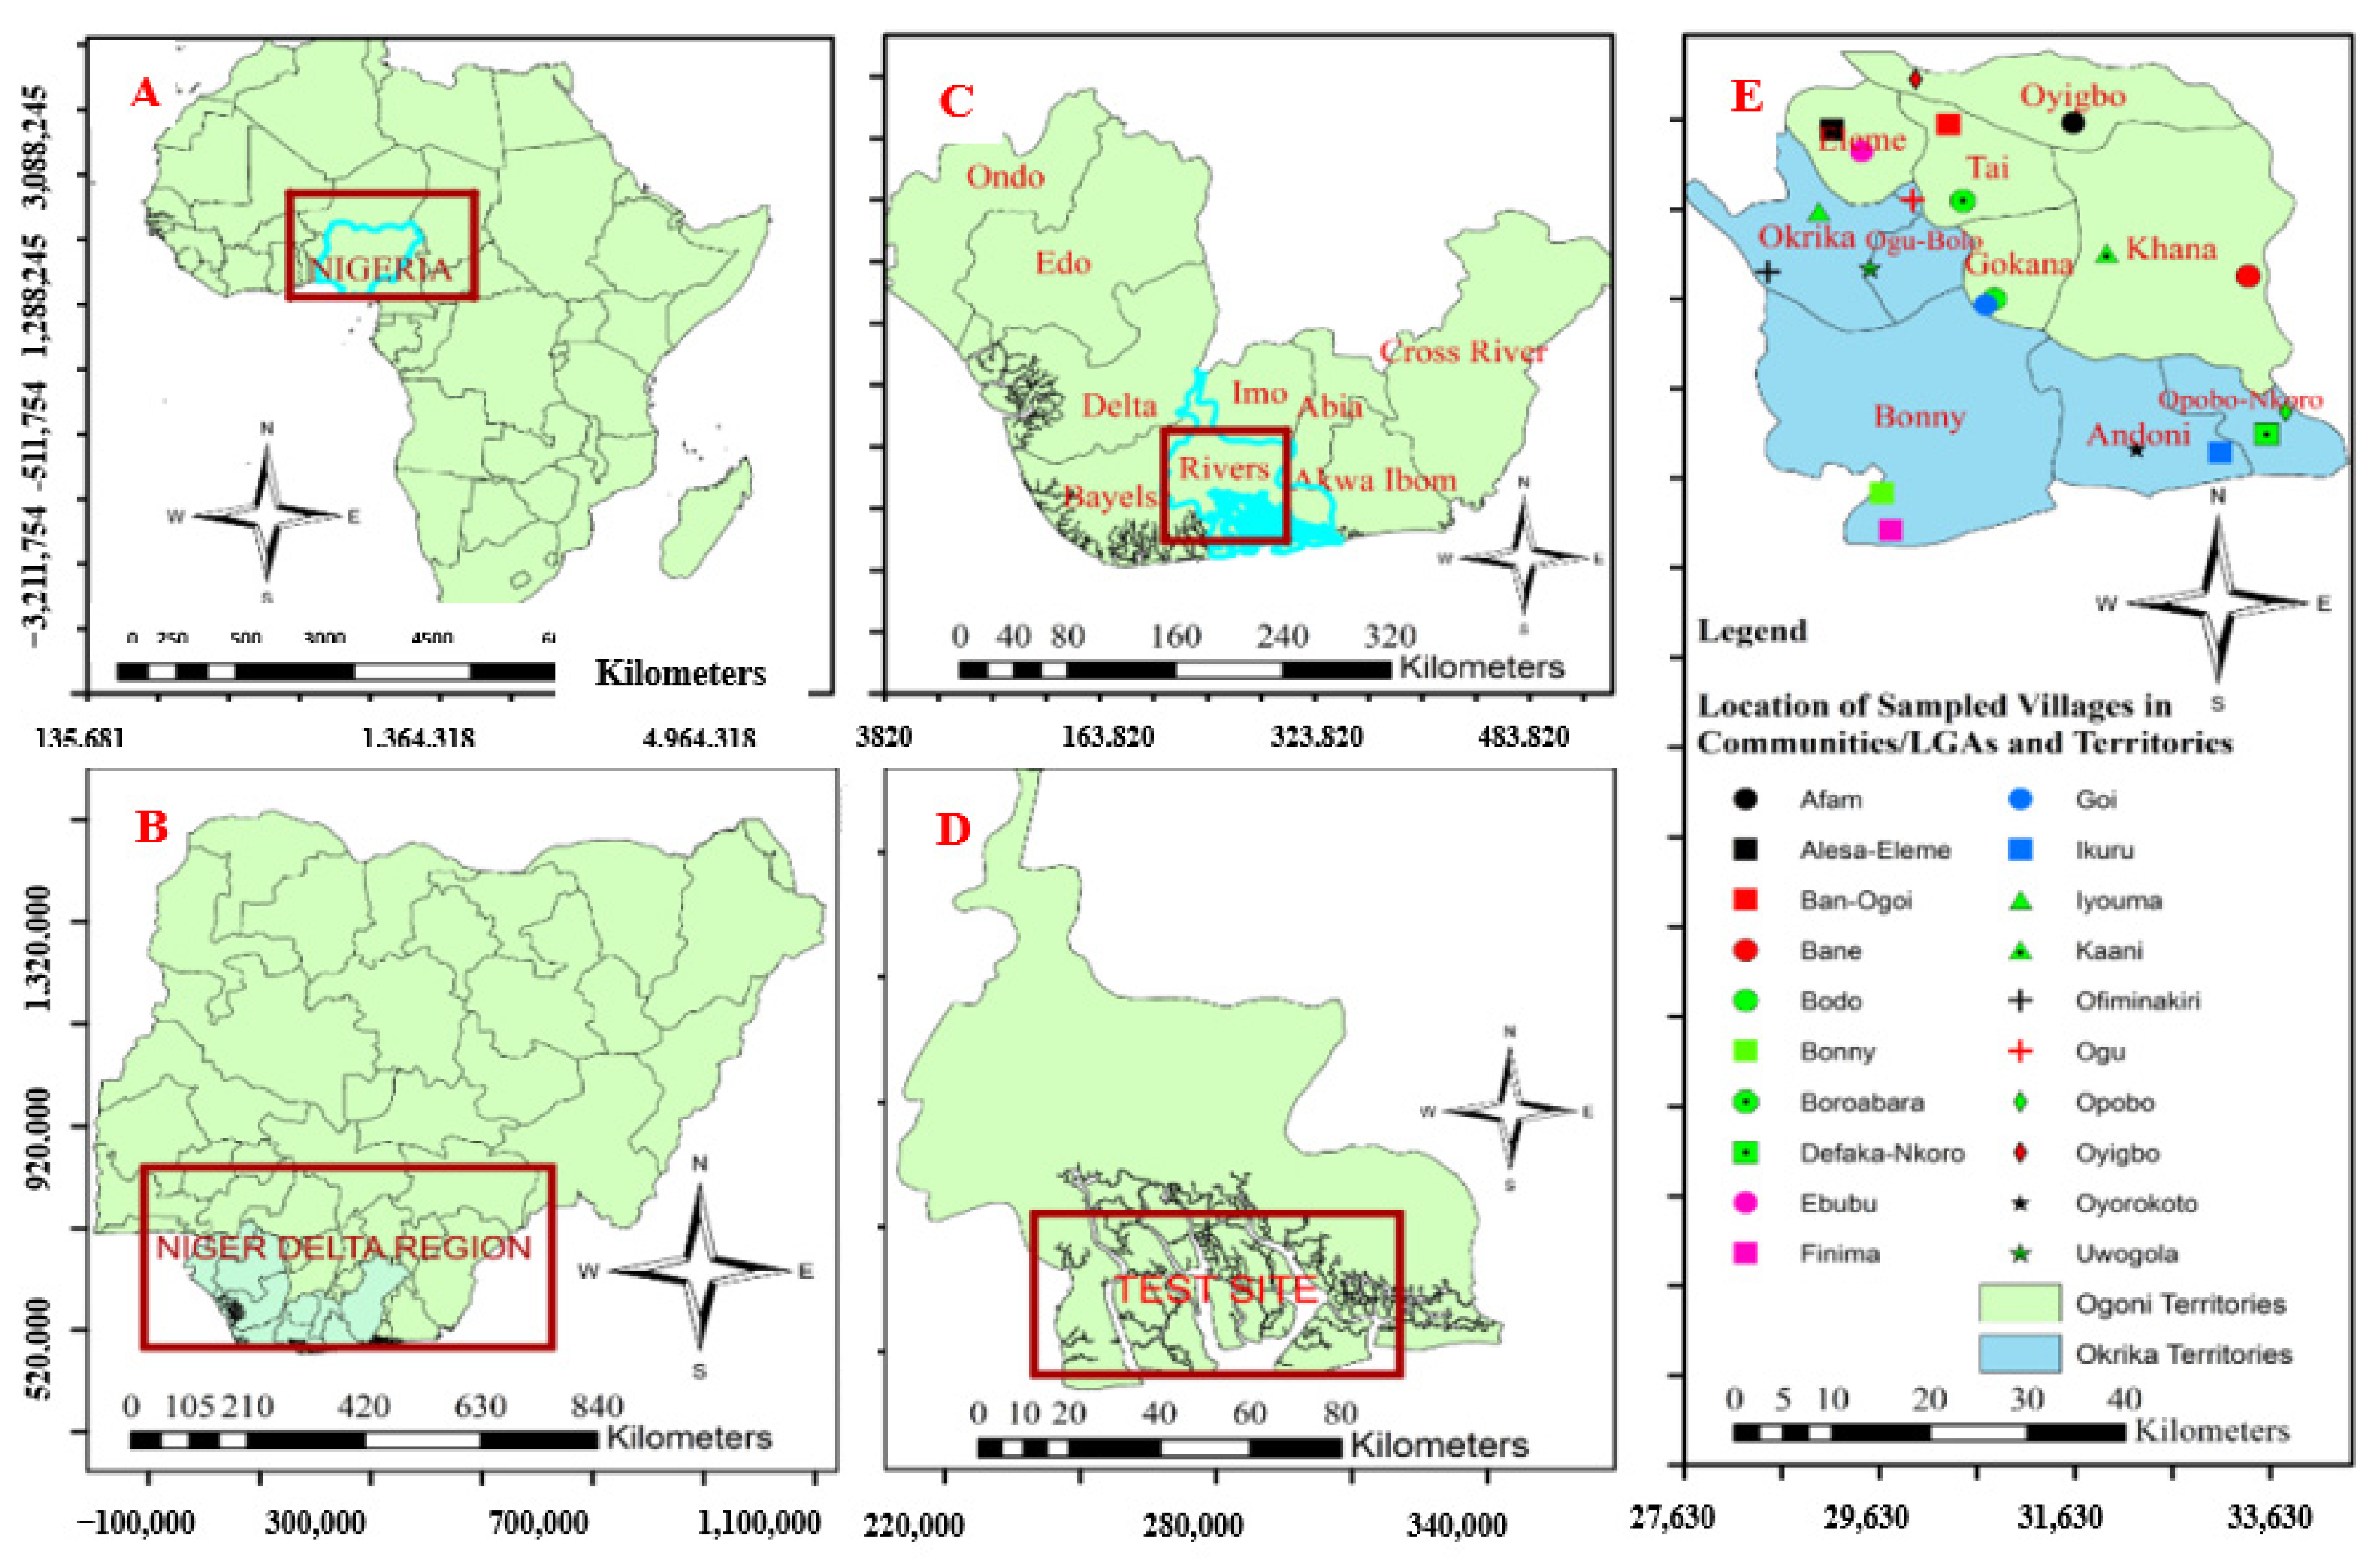
SEFLAME-CM was tested in the Niger Delta, the petroleum extraction region of Nigeria (refer to Figure 8). The region has global significance. This is because of environmental (flora and fauna) and socio-economic characteristics. It serves as a key source of oil production in Africa and worldwide [71,72,90]. Numerous conflicts concerning groups, militias, and military forces have been documented in recent times amidst environmental degradation resulting from harmful oil extraction practices, with policy measures deemed unsustainable (see Section 2.4.2).
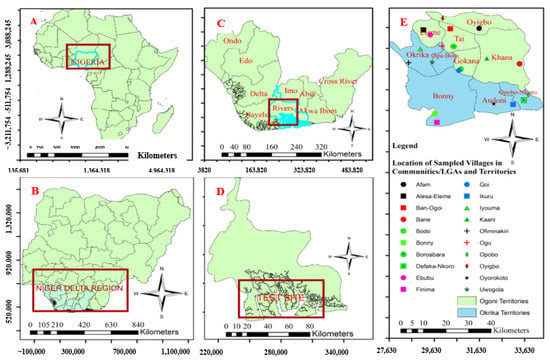
Figure 8.
The geographical positioning of Nigeria within the African continent ((A), top left), the delineation of the Niger Delta region in Nigeria ((B), bottom left), an outline of the nine states that make up the Niger Delta ((C), top middle), Rivers State and the location of the test site ((D), bottom middle), and a thorough case study that includes two territories, communities, LGAs, and villages (E), at the extreme left.
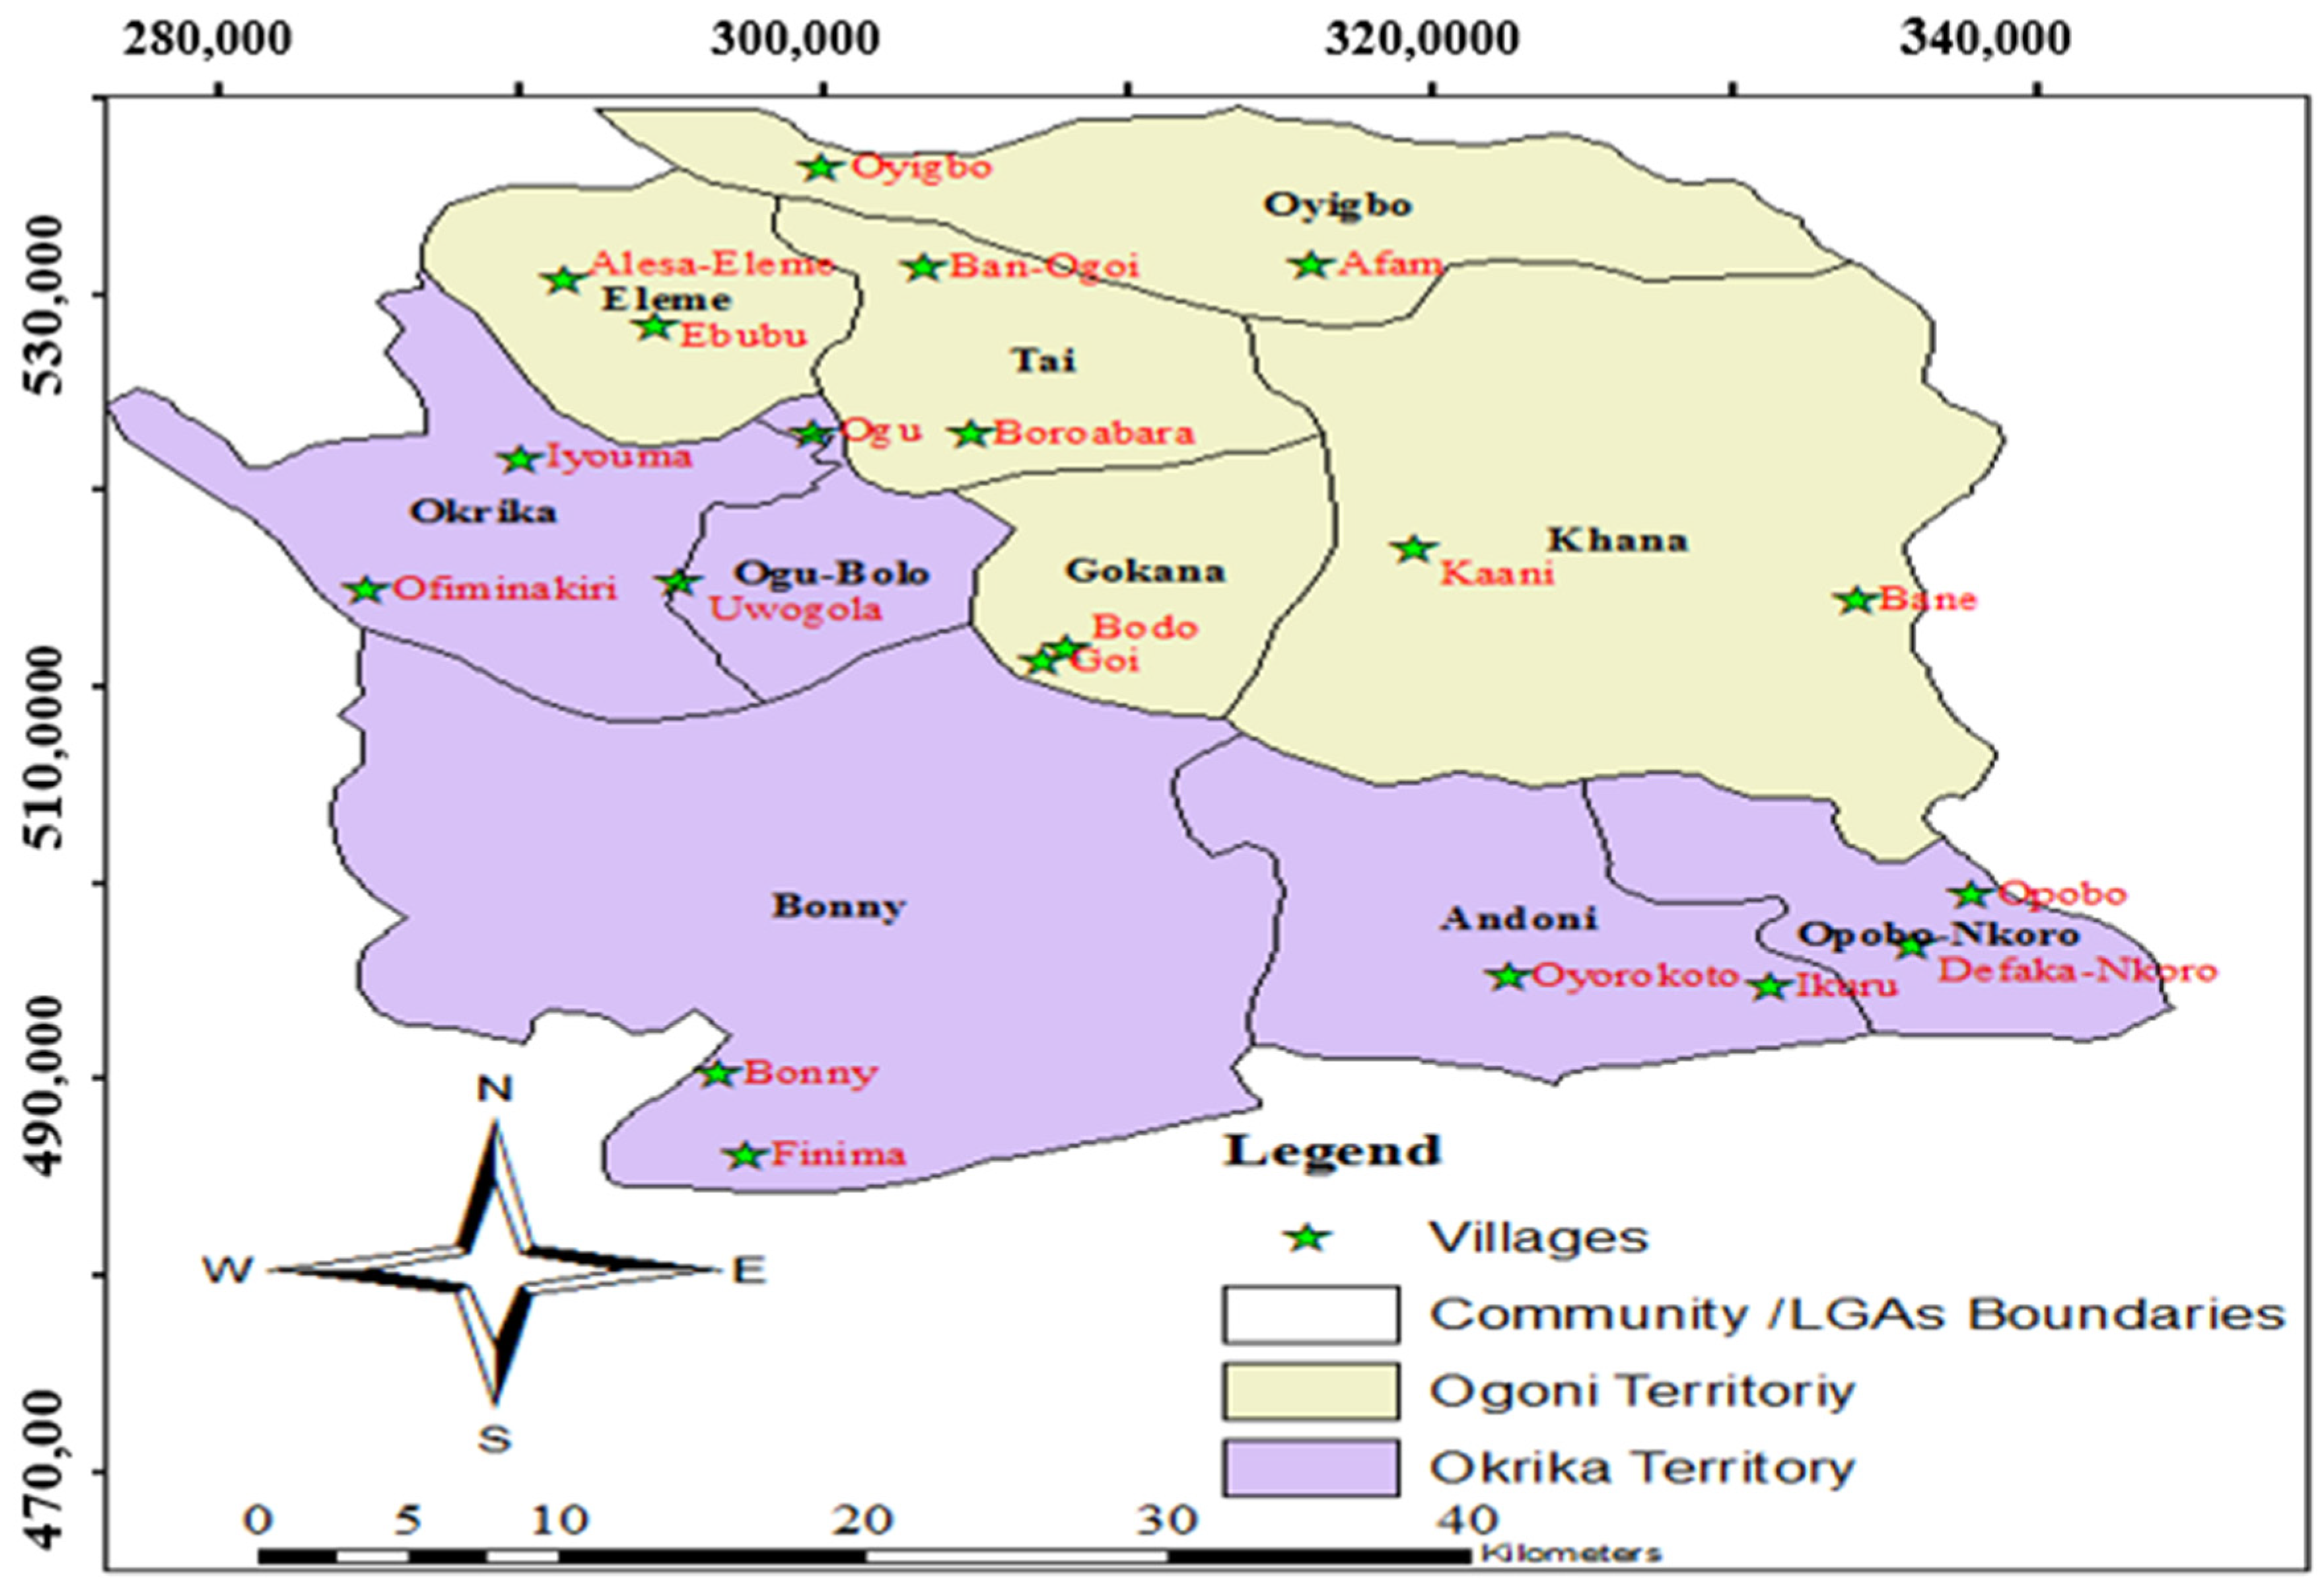
The region is in the Gulf of Guinea, roughly between the latitudes 4° N and 6° N and longitudes 5° E and 8° E [10]. It is a wetland region. Three of the 11 locations have been named wetlands of international importance. As a significant area, its oil reserves, mangrove habitats, and fishery resources make the region unique. The total area of the land is 75,000 km2. Refer to [84], for a detailed description. Due to its vast geographic expanse, we used selected communities—such as the Ogoni and Okrika Territories—to illustrate our methodology. They are key communities in Rivers State. The reasons for the choice include their representation of environmental and socio-economic variety and their natural and man-made circumstances and diversity. The towns and villages selected from the two communities bear the unique natural and anthropogenic features of the Niger Delta [84]. The case study map is shown in Figure 8, with special focus on the region, the provinces referred to as states in Nigeria, including Rivers State, and the chosen towns and villages.
2.4.1. Spatial Attributes of the Test Case
Figure 9 shows the two communities: Ogoni and Okrika. Port Harcourt is the capital of Rivers State, which has a total area of about 10,361 km2. The average population of each LGA, or community, is around 150,000 people. Villages make up Local Government Areas. The map in Figure 9 depicts different territories, local government districts, towns, and villages. Communities exhibit a range of sizes. In arid regions, access is primarily obtained through pedestrian methods, while in isolated coastal areas, navigation is generally conducted using maritime vessels. The NRCs in this region are not ubiquitous [91]; their distribution is understandable. Ten Local Government Areas (LGAs) make up the two selected areas, as shown in Figure 9. Based on the presence of oil, the health effects of extraction, and the socio-economic and political circumstances of the populace as established by conflict occurrences in each LGA, two representative territories were chosen.
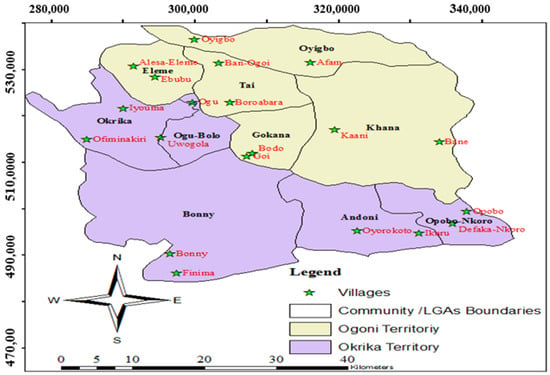
Figure 9.
Map of the case study.
2.4.2. Research-Based Conflict Resolution Techniques and Development Policies of the Study Region
For over two decades, several bilateral and multilateral organizations, such as the Department for International Development (DFID), the United Nations, and the World Bank, have developed policies, made strategic recommendations, and communicated their concerns about resource conflicts, unemployment, and environmental degradation. As summarized in [10], several development projects and legal frameworks have been undertaken, including the Oil Pollution Act of 1990, the Niger Delta Basin Development Authority (NDBDA), and the National Oil Spill Detection and Response Agency (NOSDRA) [10].
Despite the implementation of numerous of the above and many other policy initiatives, the region has shown no improvement. Most local publications related to the policies consist of theoretical research, typically utilizing qualitative methodologies based on theories such “resource curse“ and “political ecology frameworks”, which clarify various perspectives and values regarding the crises in the region [10,90]. As a result, the development of a new modeling technique has become essential as earlier policies are founded on research theories and frameworks responsible for the diverse and contradictory viewpoints and values surrounding the Niger Delta problem.
3. Results
3.1. Graphical Representation of SEFAME-CM
The results of the interview were translated to quantitative modeling, employing the concept of computing with words (CWW). This approach uses perception-based paradigms to quantify the proper design of survey instruments and risk variables, and it incorporates encoding, integration, and decoding processes [92].
For example, the local actors are asked to rate their perception of the occurrence of NRCs in their community from a scale of “0—10”. They are asked to rate “0 1 2”, “3 4 5”, “6 7 8”, “9 10” under “Unlikely”, “Likely”, “Very likely” and “Most likely”, respectively [10]. A defuzzification algorithm, as detailed in Section 2.2.7, executed the integration and decoding processes, employing semantic rules to link each linguistic term set.
The results are based on the two conflict typologies that were examined with SEFLAME-CM (refer to Figure 5 for data layers). Environmental, socio-economic, and political elements that are challenging to integrate into large-N investigations can be modeled using fuzzy logic-based techniques [3,4,11]. However, combining these elements allows us to learn more about NRCs. The SEFLAME-CM implementation in MATLAB is shown in Figure 10. SMCE-CM is used to validate the overall CVL Index.
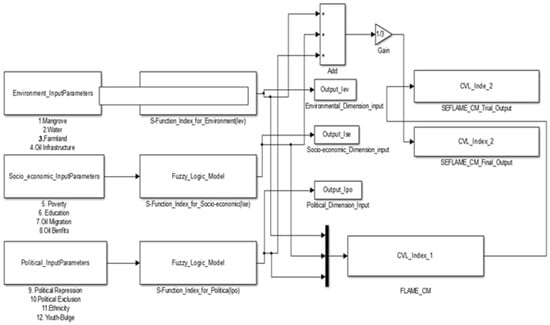
Figure 10.
Overview of SEFAME-CM’s implementation.
3.2. Results of the Fufzzy Operator and Fuzzy Rules
The sample rule viewer (refer to Figure 7) shows how environmental parameters (mangrove forest distance, distance to polluted water, distance to oil infrastructure, and distance to farmland) are integrated to form fuzzy rules in SEFLAME-CM as demonstrated in MATLAB Simulink. As presented earlier in Figure 7, each line represents a rule, suggesting that fuzzy operators are essential for determining how well the output variables of the NRCs are fulfilled. A “maximizing” effect is seen when the output of the Fuzzy Algebraic Sum (FuAS) for each point continuously reaches or surpasses the highest value at the corresponding point of the input map. In SEFLAME-CM, a value of 2 denotes OR, whereas a value of 1 signifies AND. These operators were employed to consolidate various components of the “antecedent”, yielding a singular numerical value between 0 and 1, which indicates the extent of support for the rule. In fuzzy logic, the OR operator is represented by the maximum value, whereas the AND operator is represented by the minimum value. The membership values generally indicate the occurrence of conflict as associated with distance from mangroves, water sources, and farmland, as well as proximity to oil infrastructure. After determining, for example, that “1” is the highest of the four values [0.0, 0.2, 0.9, 1], the fuzzy OR operator ends the fuzzy operator of the rule. By removing all other values, the AND operator finds the least value.
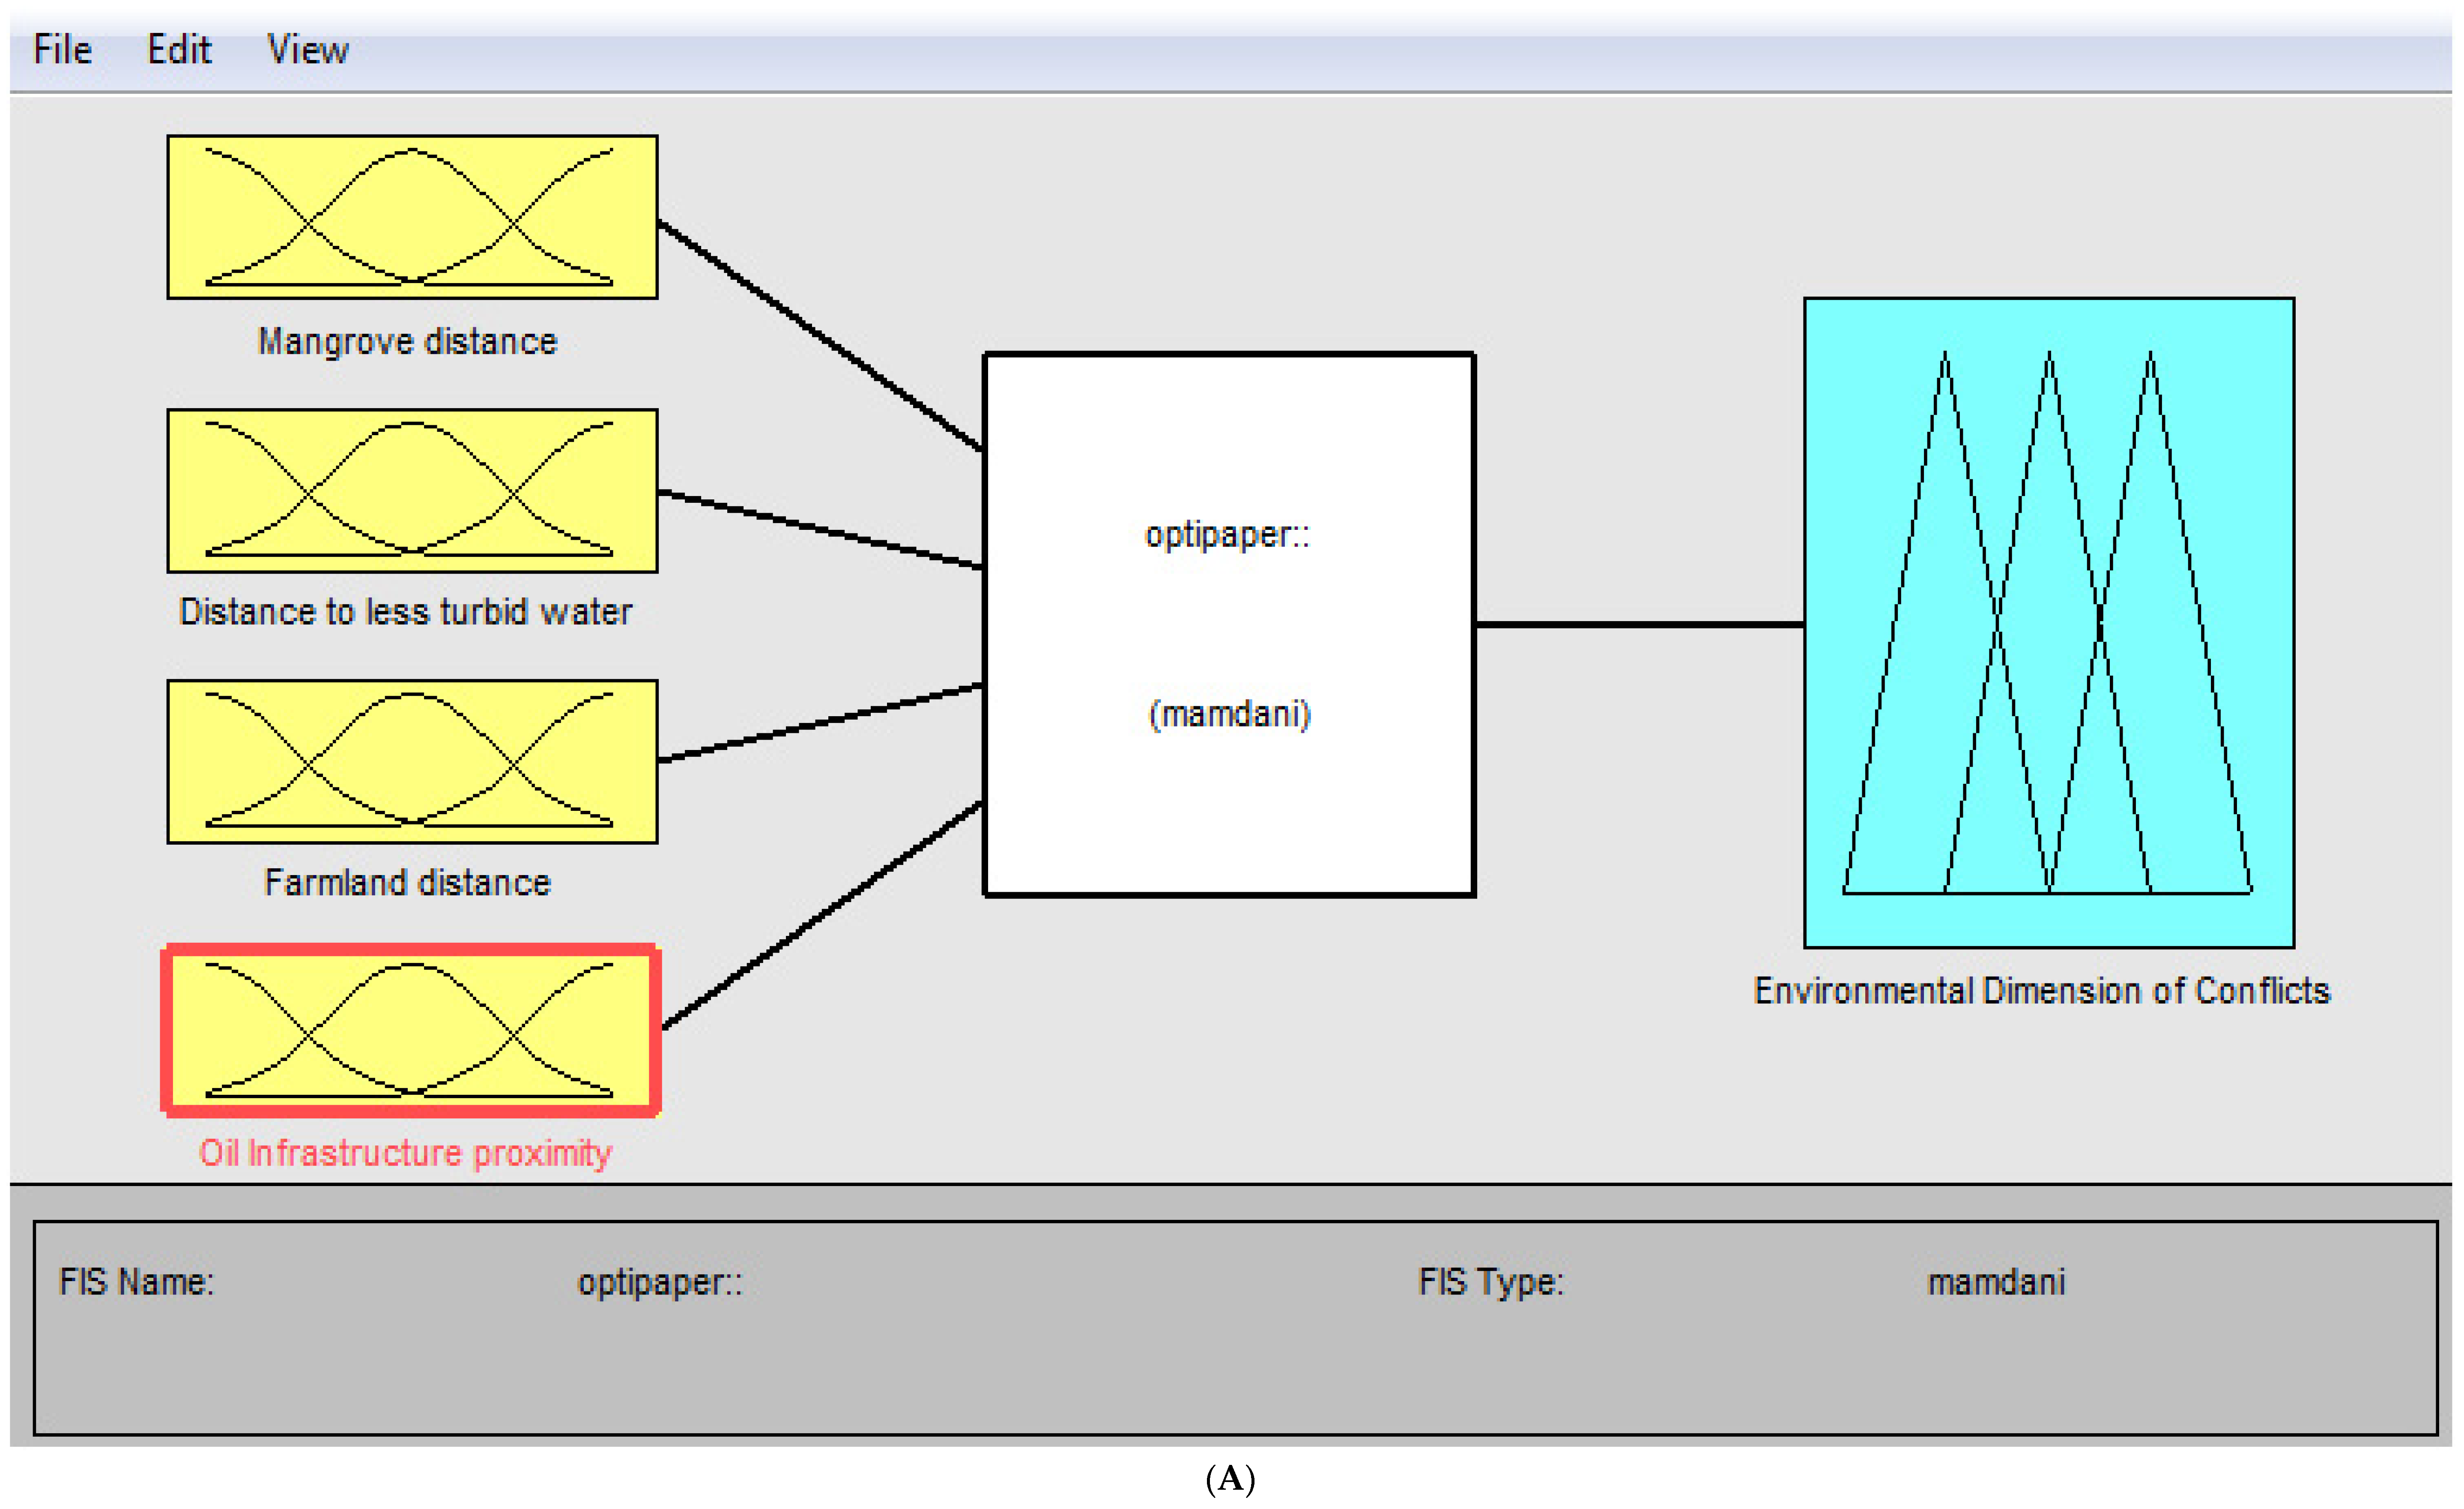
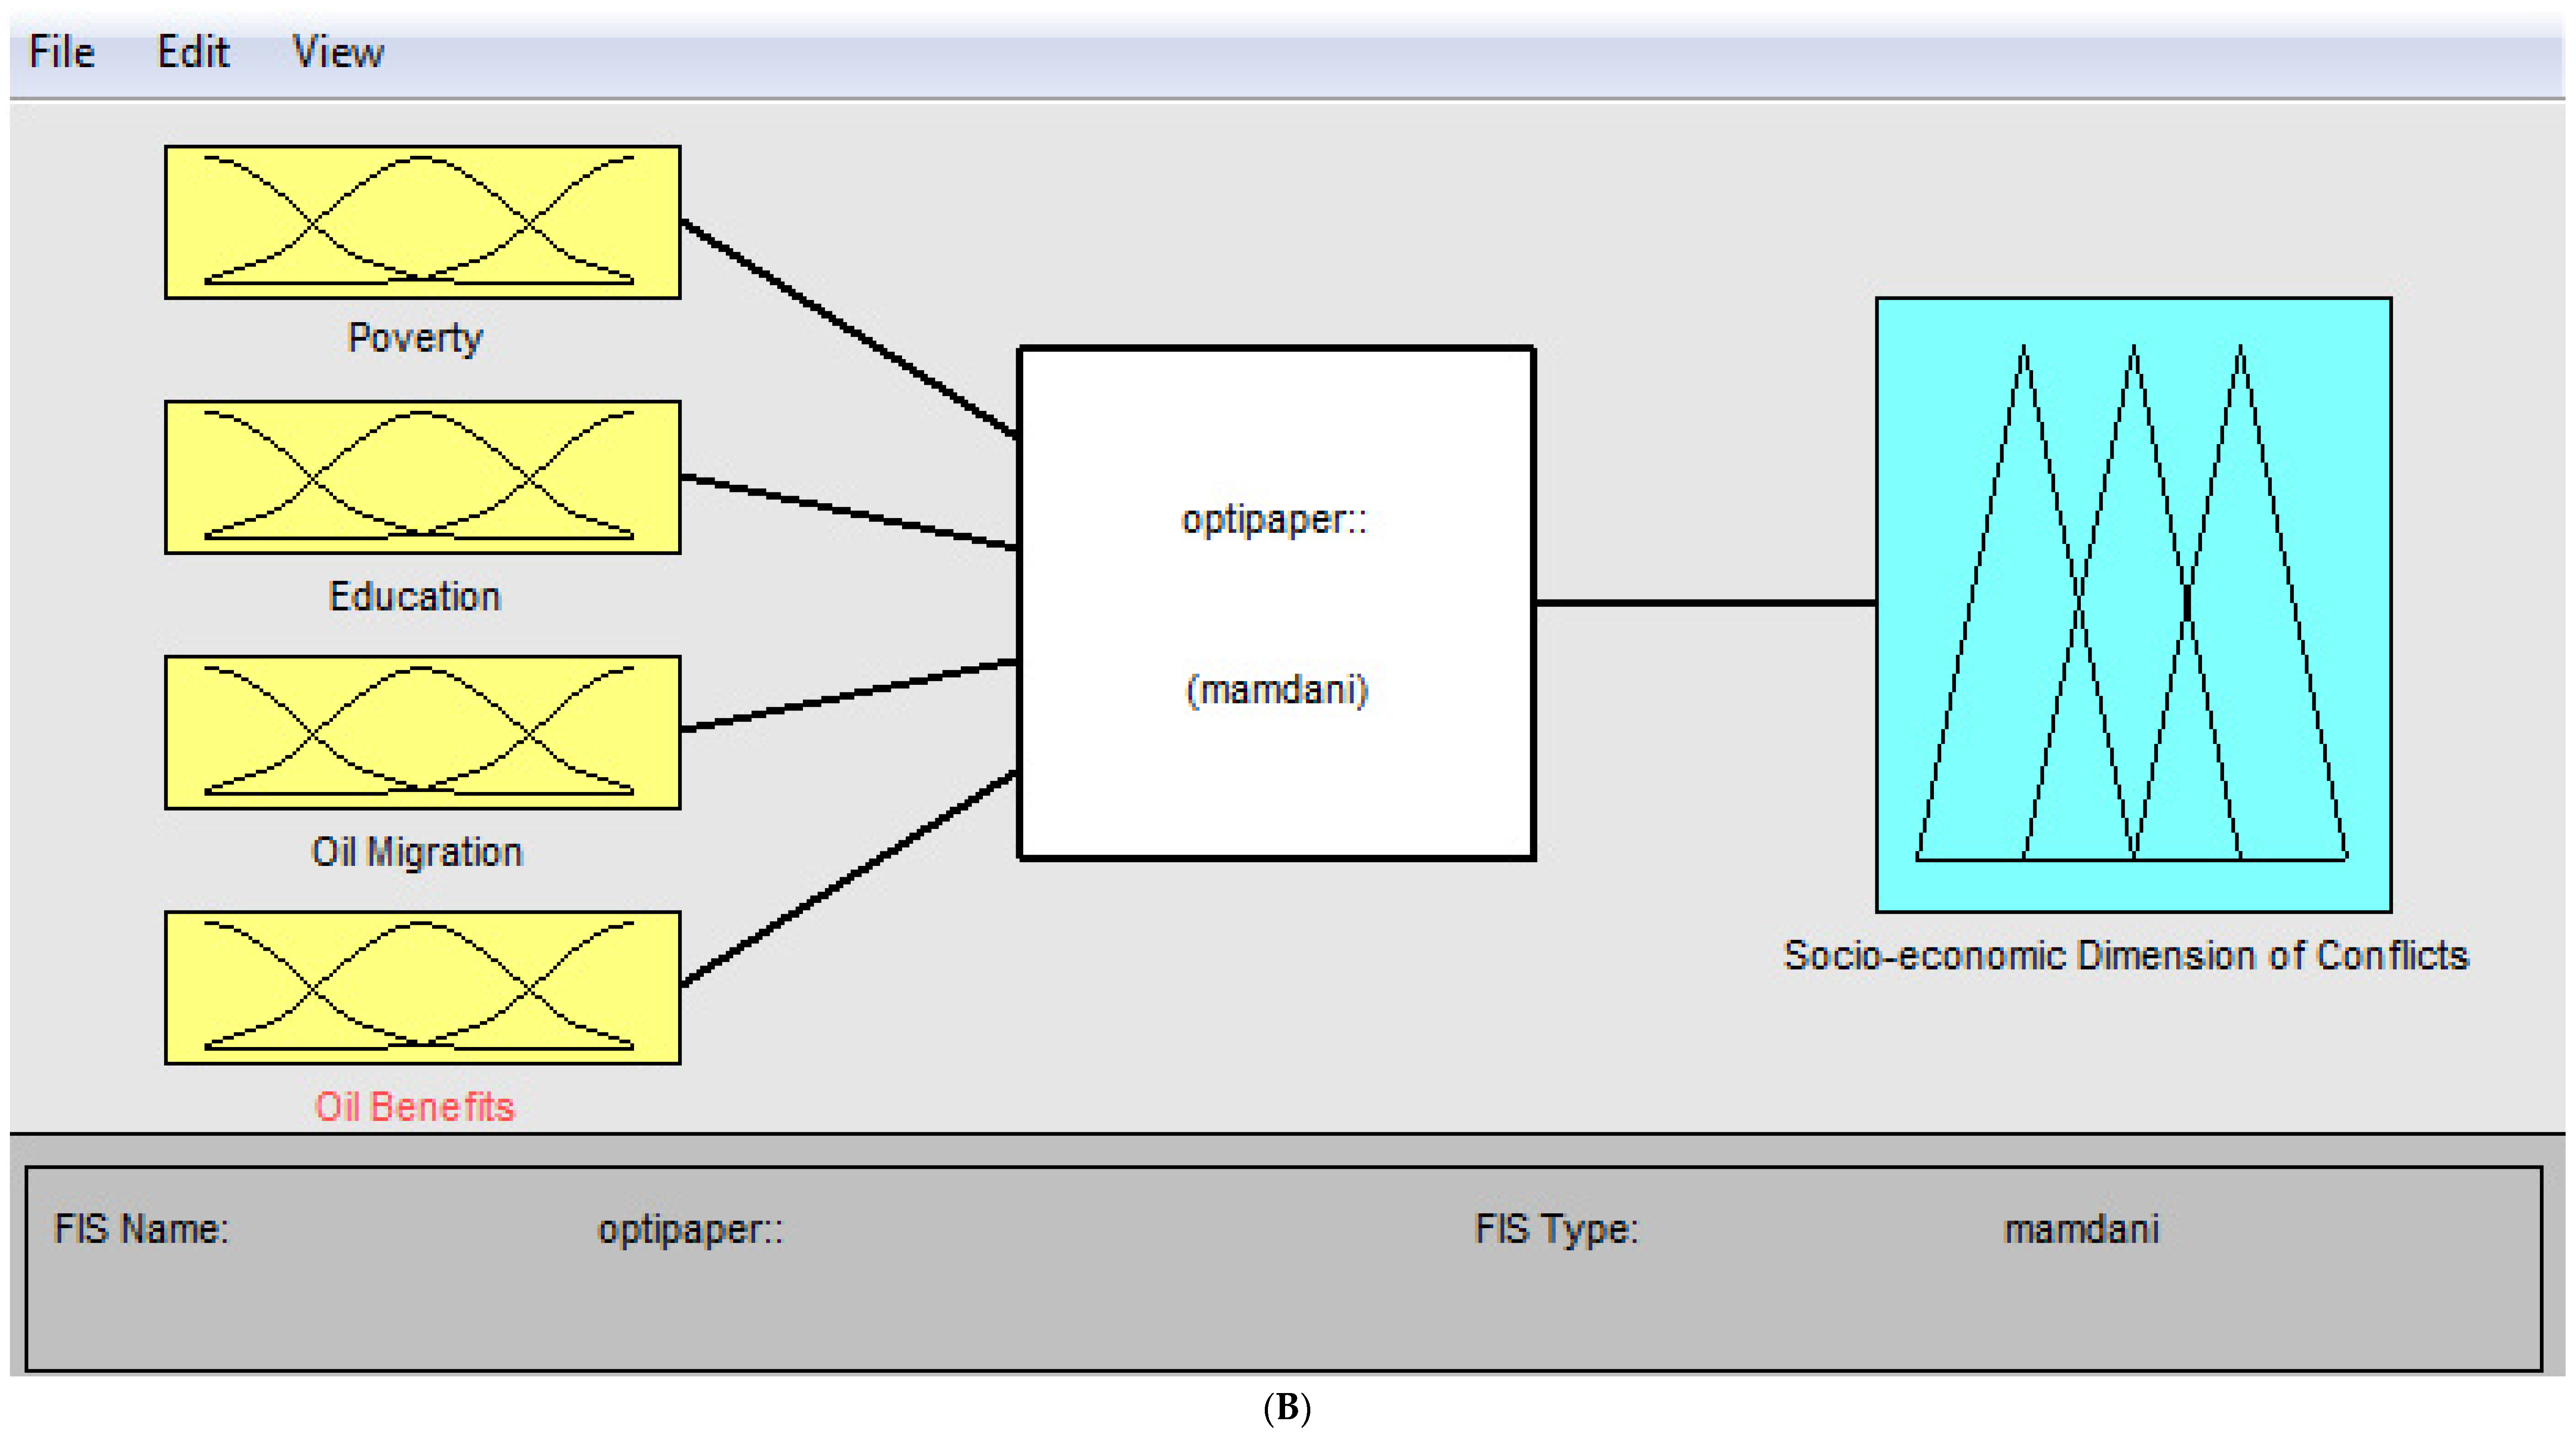
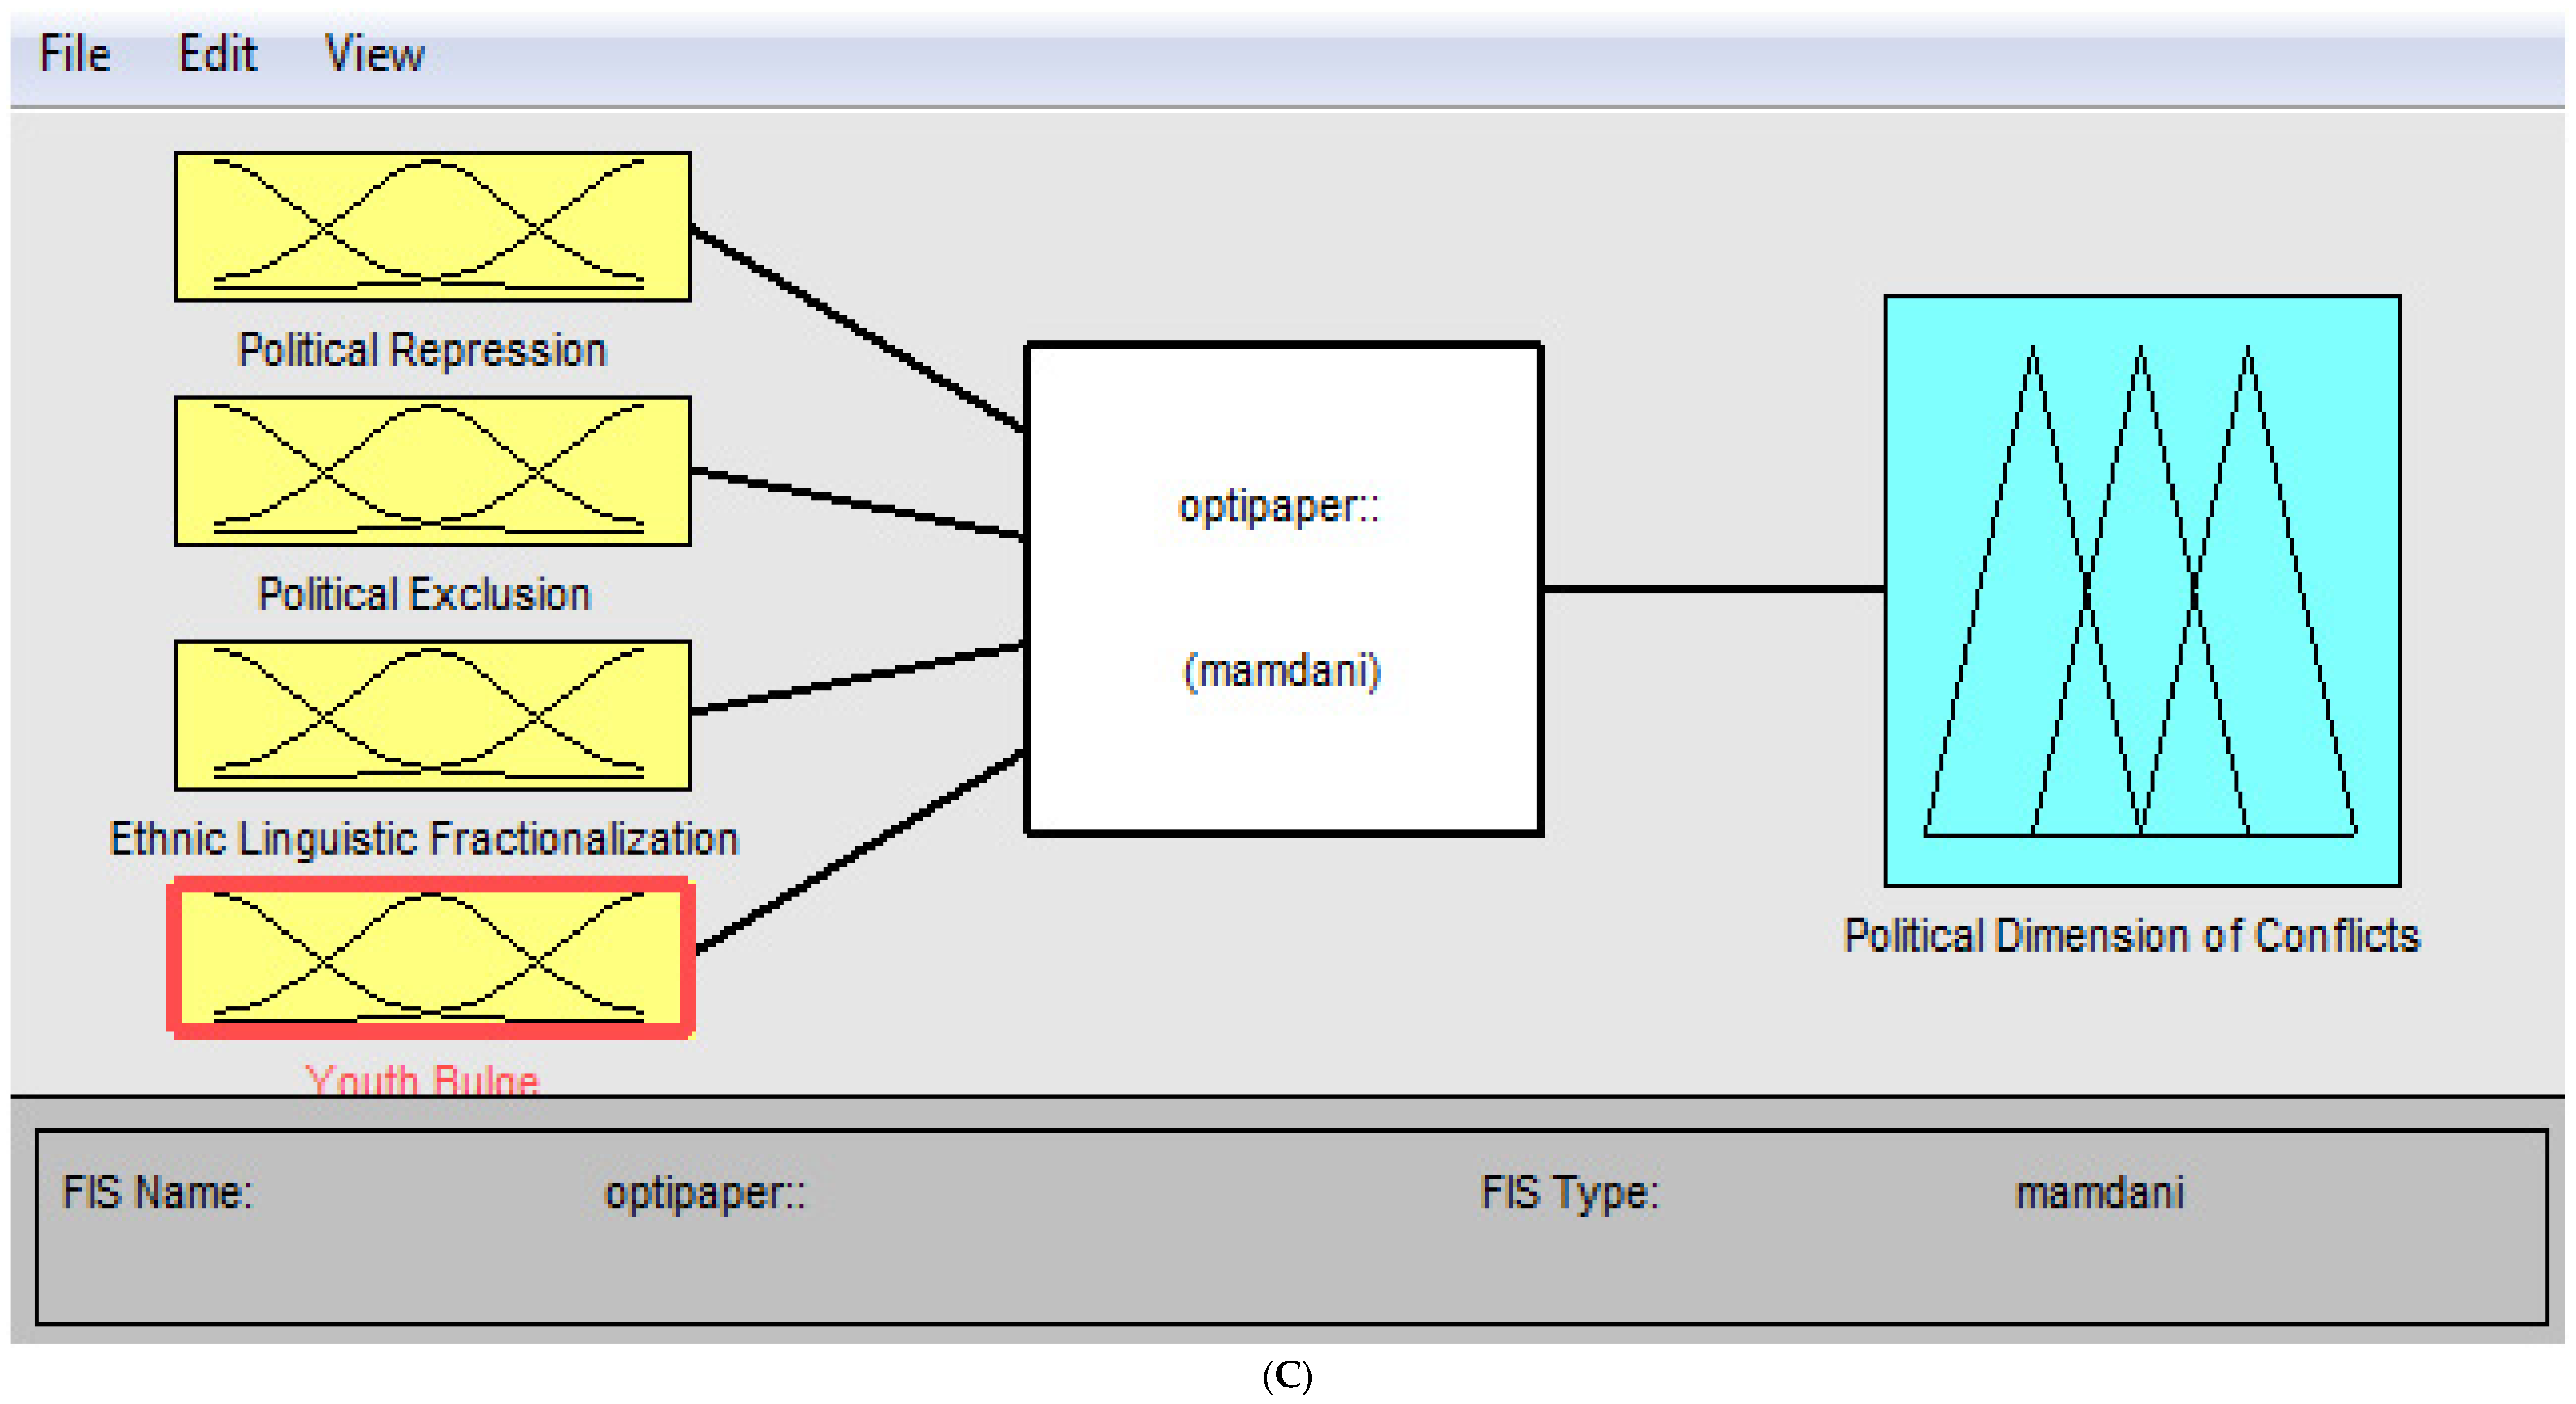
The SEFLAME-CM interface pertaining to the environmental, socio-economic, and political vulnerability categories is shown in Figure 11A–C. For the fuzzy rules, see Appendix B.1 and Appendix B.3.
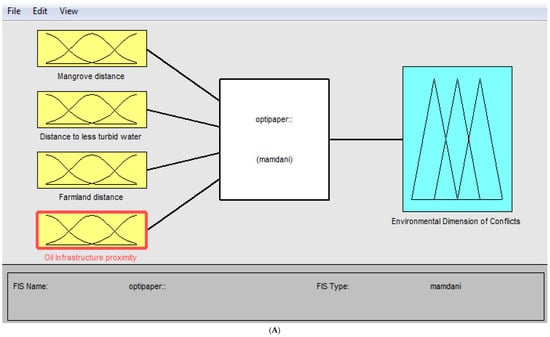
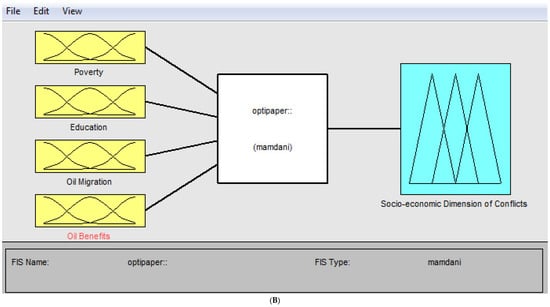
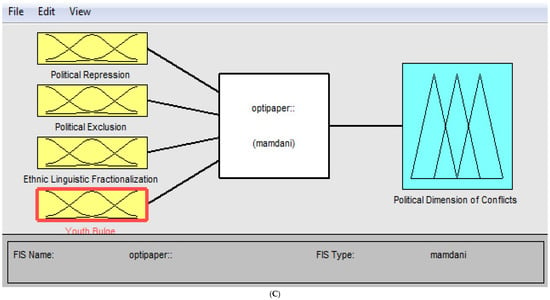
Figure 11.
SEFLAME-CM Interface (A). SEFLAME-CM Interface (B). SEFLAME-CM Interface (C).
3.3. Aggregated Outputs
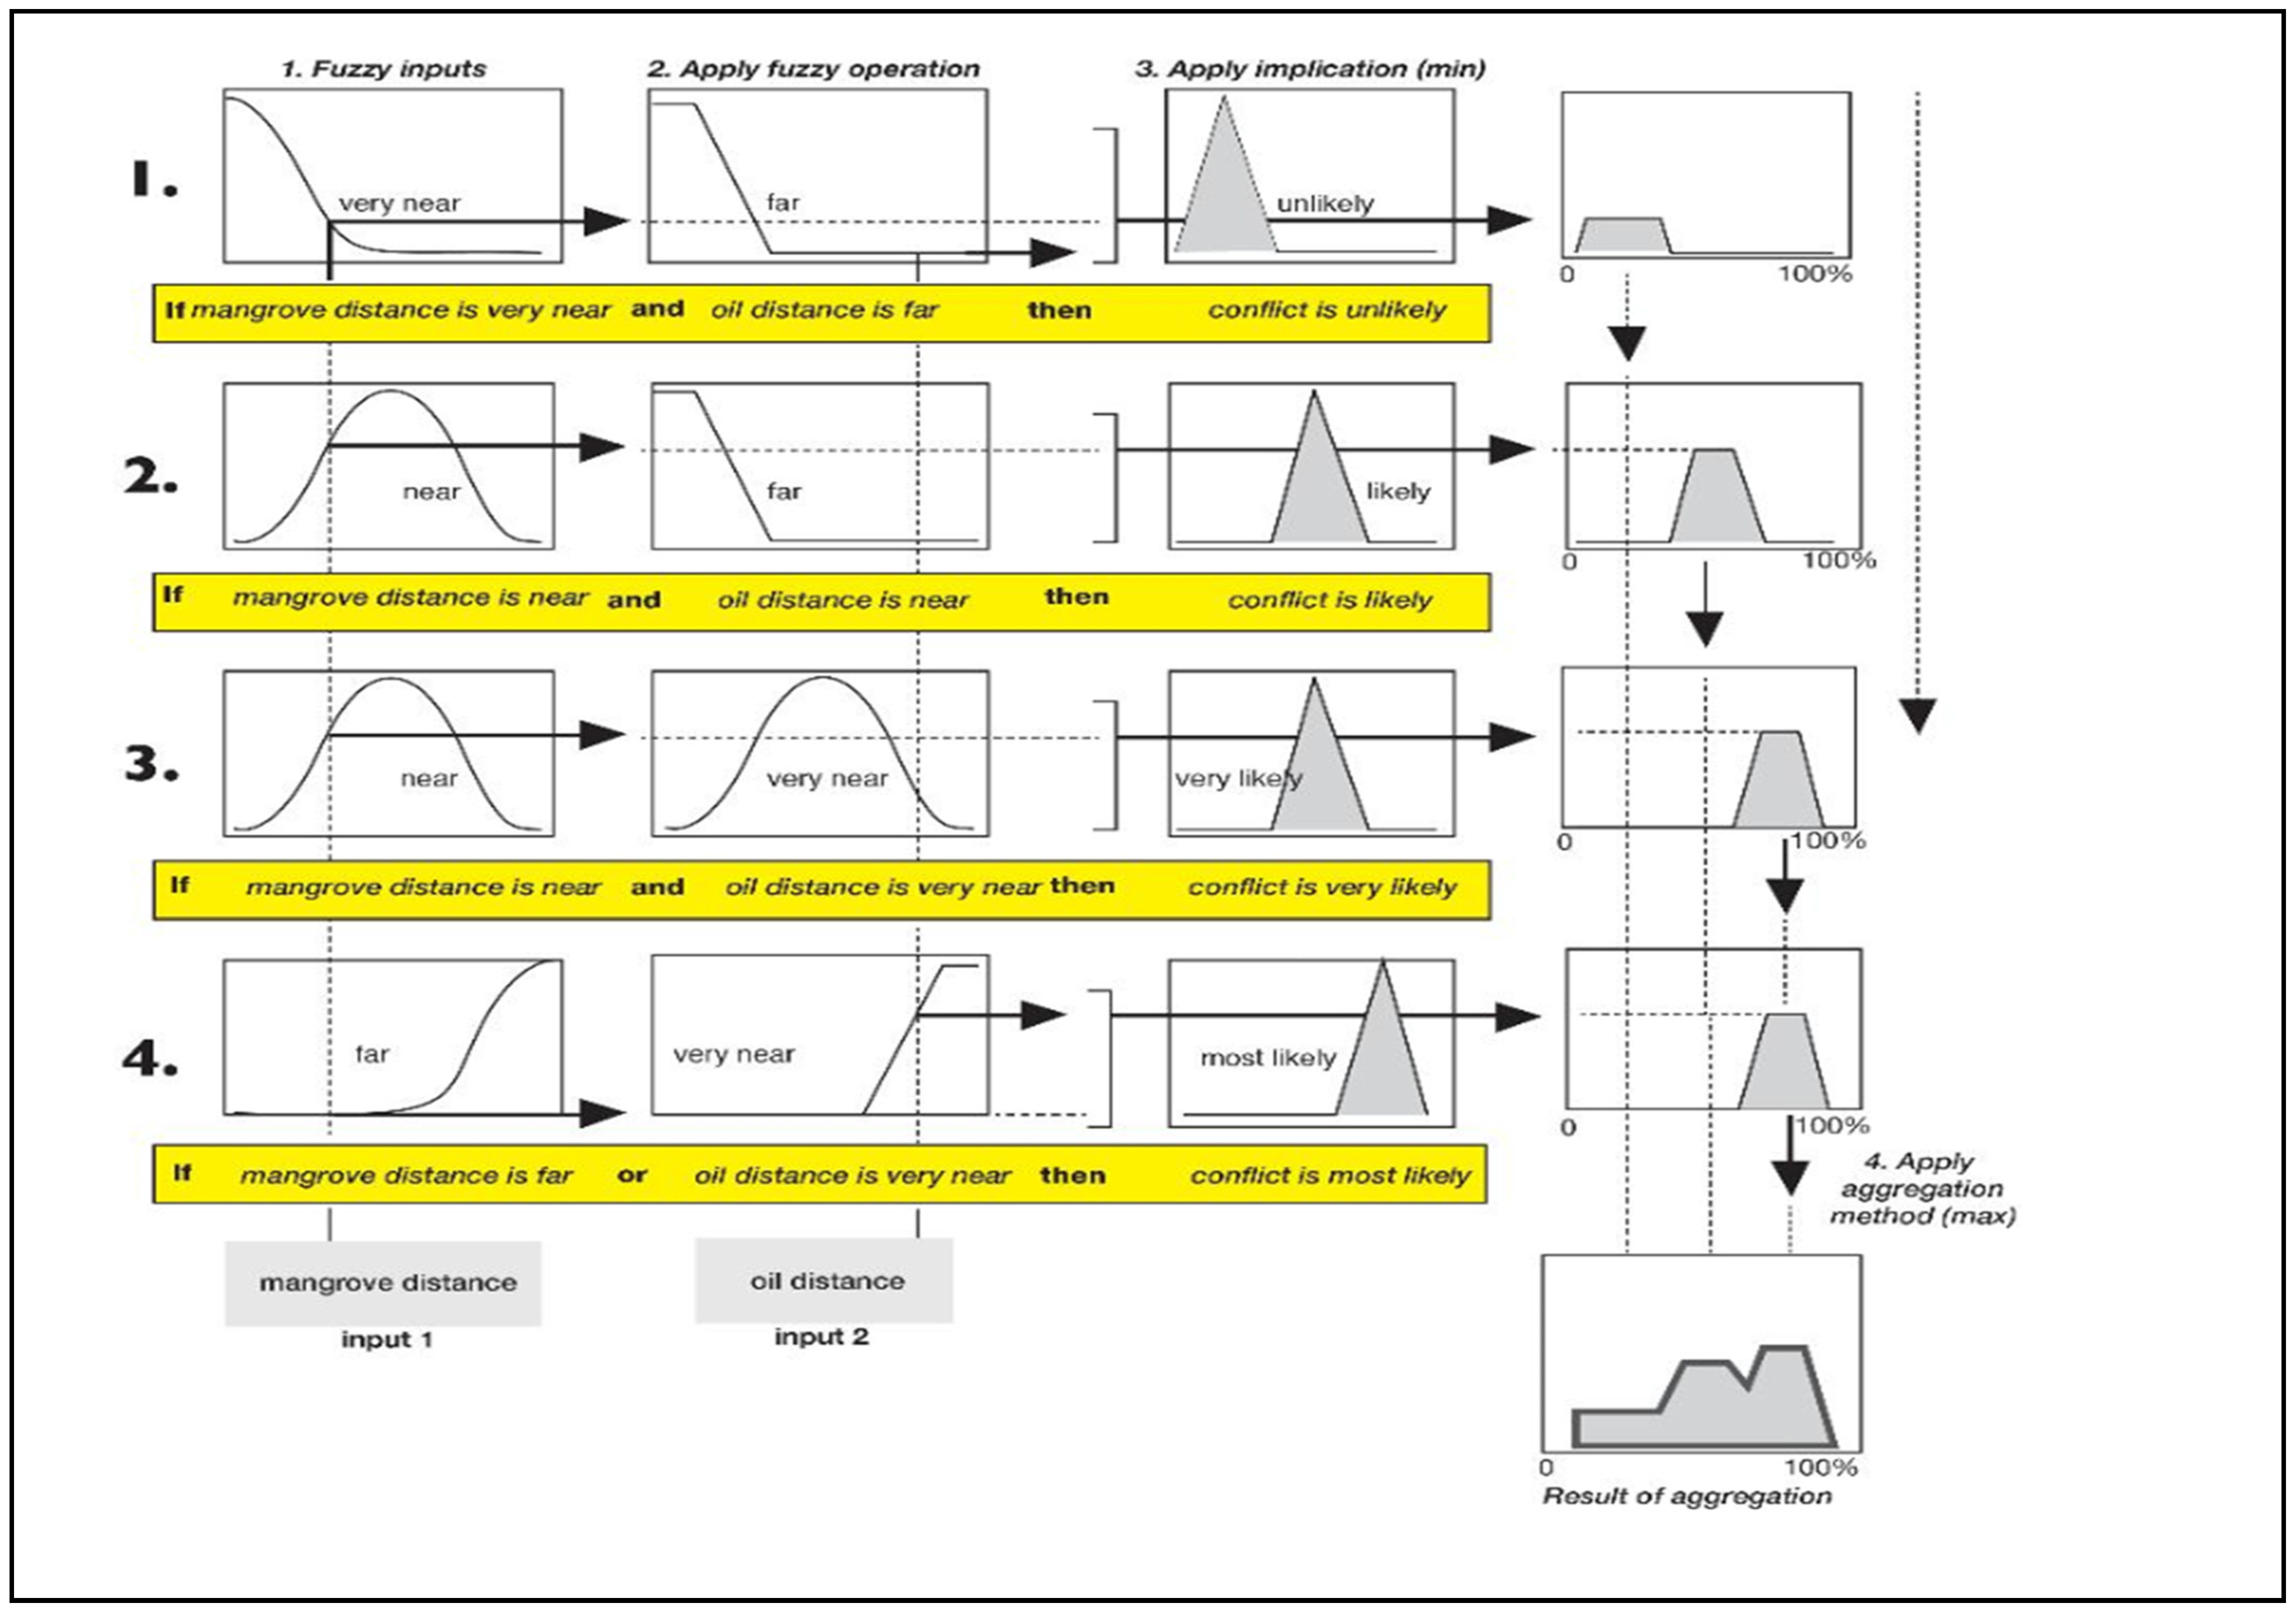
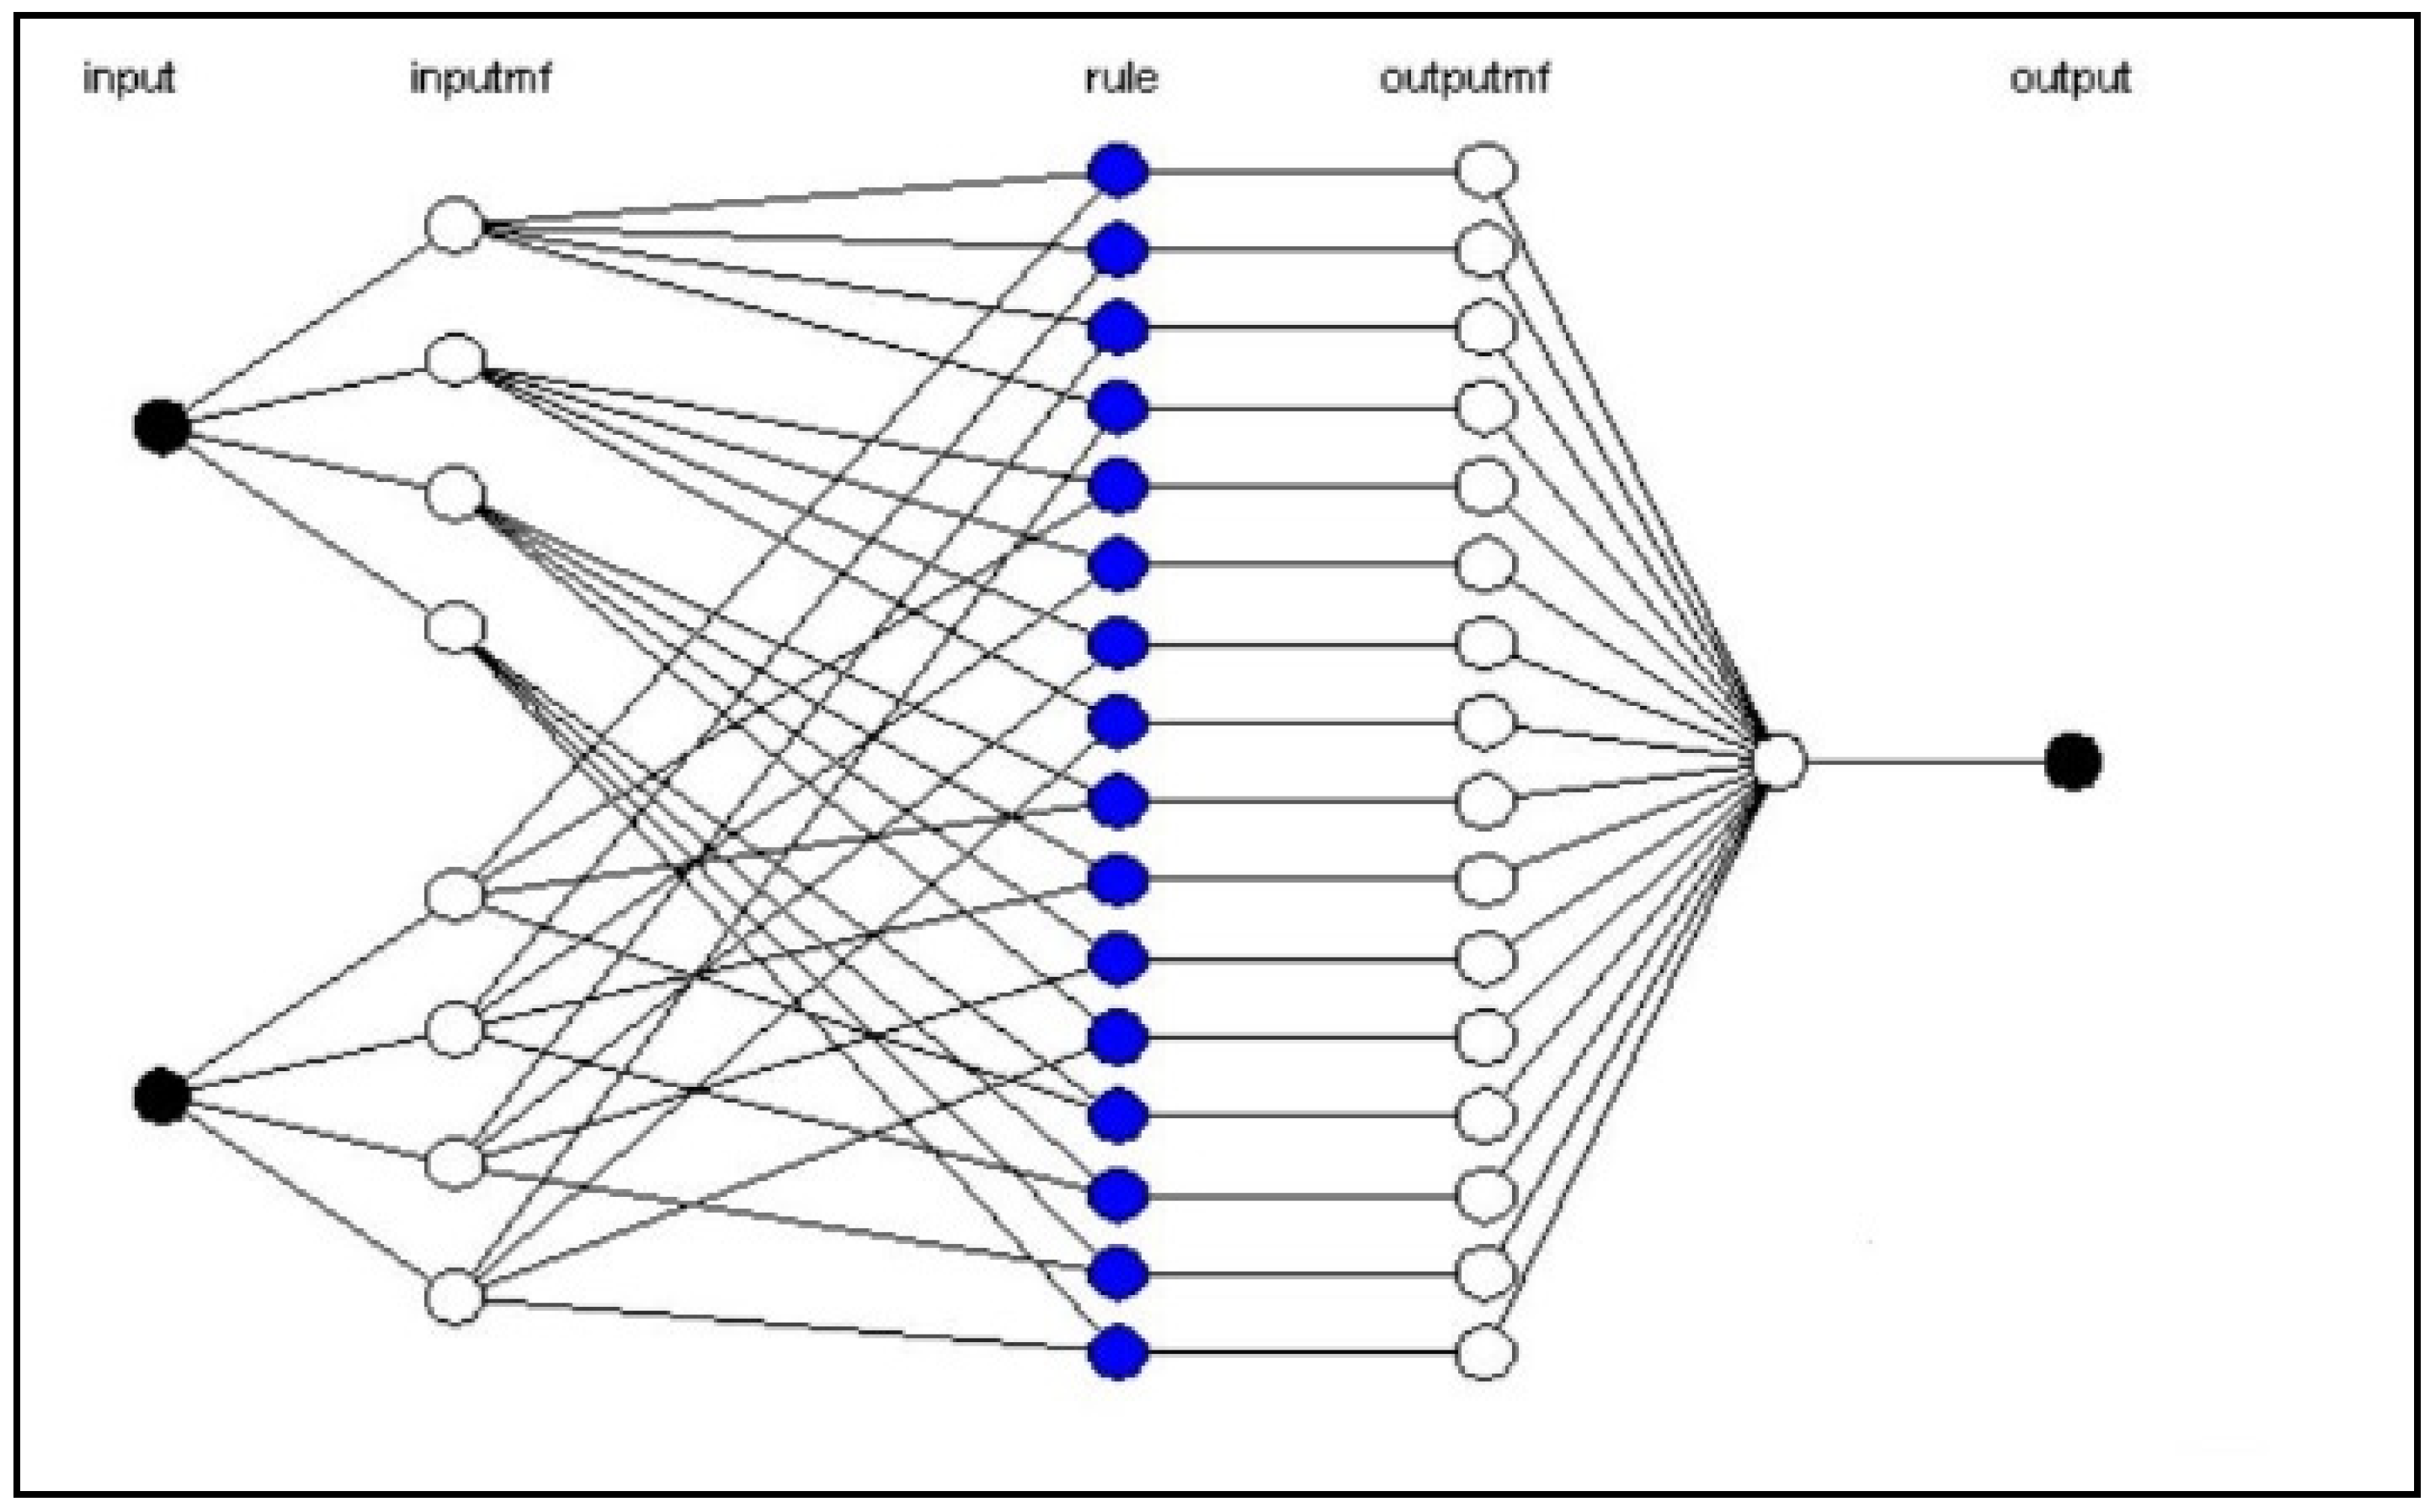
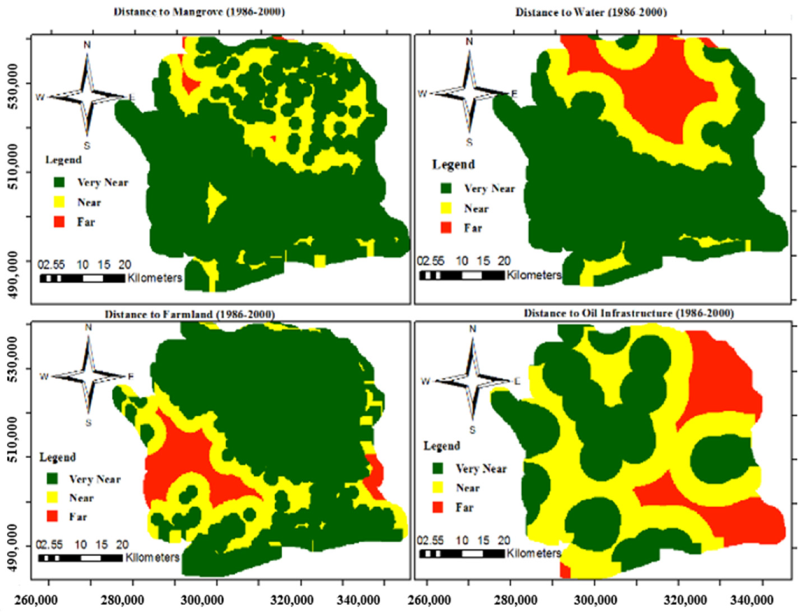
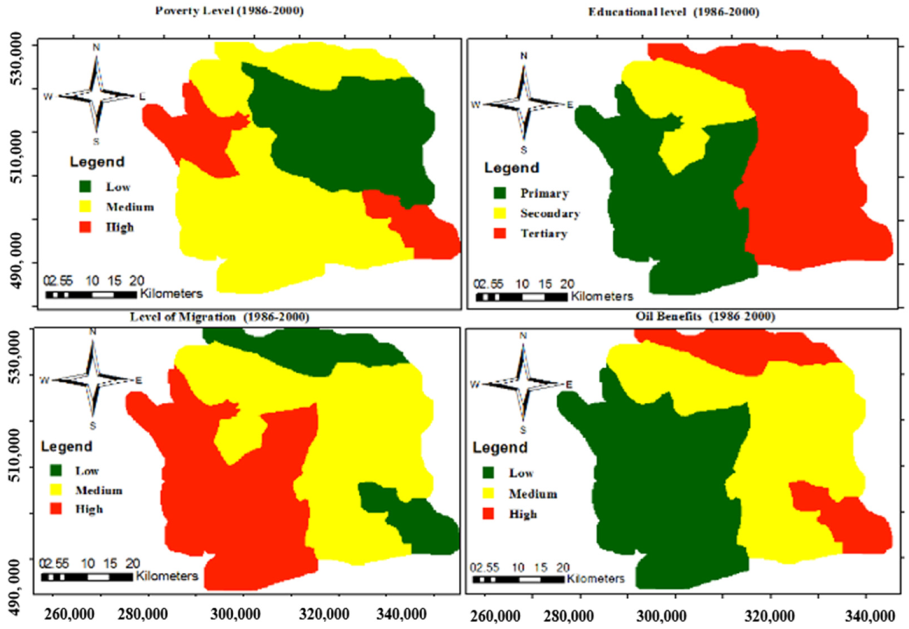
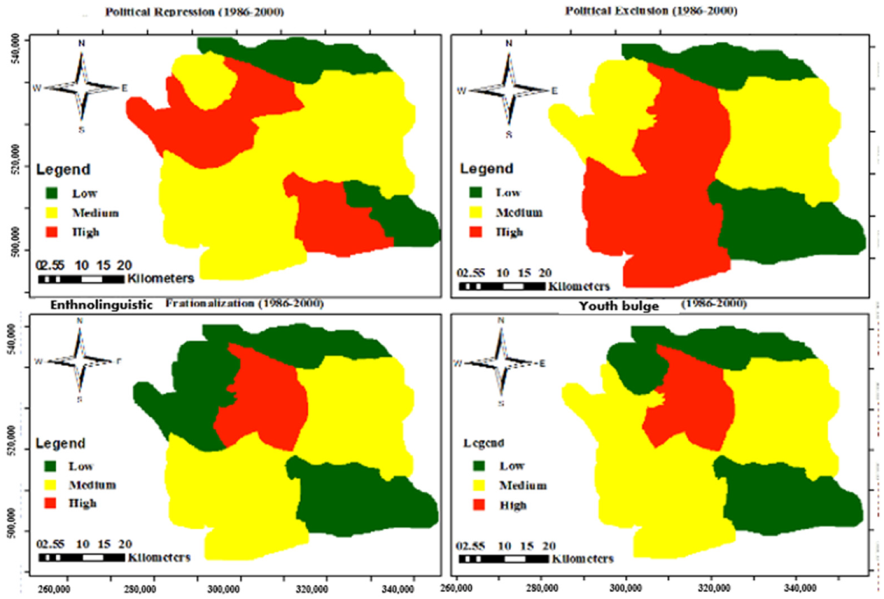
For every output variable, the aggregation method produces a unique fuzzy set [80]. As previously described, we used fuzzy input, rules, implication rules, and operators to derive a single fuzzy set. Throughout the aggregation process, weights were assigned to each output using the membership functions (refer to Figure 6). The weights establish the values indicative of susceptibility to conflicts arising from natural resources. The result is the development of fuzzy parameter maps, which are represented in GIS (refer to Appendix C.1, Appendix C.2, and Appendix C.3 and Appendix D.1, Appendix D.2, and Appendix D.3 for the parameters). Maps from the application of operators like fuzzy AND and fuzzy OR align with the rules established by actors, as indicated in [73]. A simplified illustration of the interactions between the four rules in each line can be found in Figure 12. Figure 13 shows a summary of the linking of inputs, rules, membership functions, and outputs.
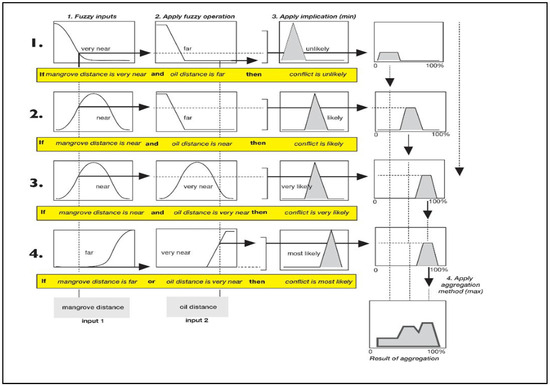
Figure 12.
Example of summary of the interactions of rules and integration into a fuzzy set. Adapted from [80]. As seen in the example here, there are two input factors: mangrove distance and distance to oil infrastructure. There may be more than one input factors in reality. (Line 1): If mangrove distance is very near and oil distance is far, then conflict is unlikely. (Line 2): If mangrove distance is near and oil distance is near then conflict is likely. (Line 3): If mangrove diatance is near and oil distance is very near then conflict is very likely. (Line 4): If mangrove distance is far or oil distance is very near then conflict is mostly likely.
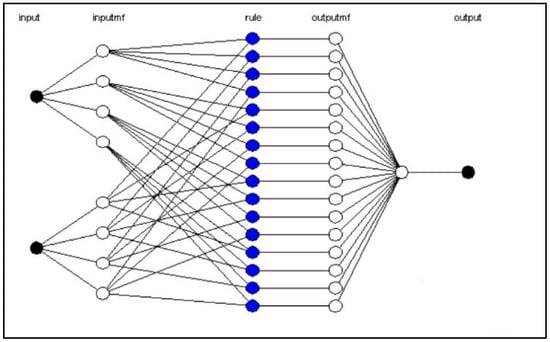
Figure 13.
The Linkage of inputs, rules, membership functions, and outputs.
3.4. Results of Comparison with a Previous Model
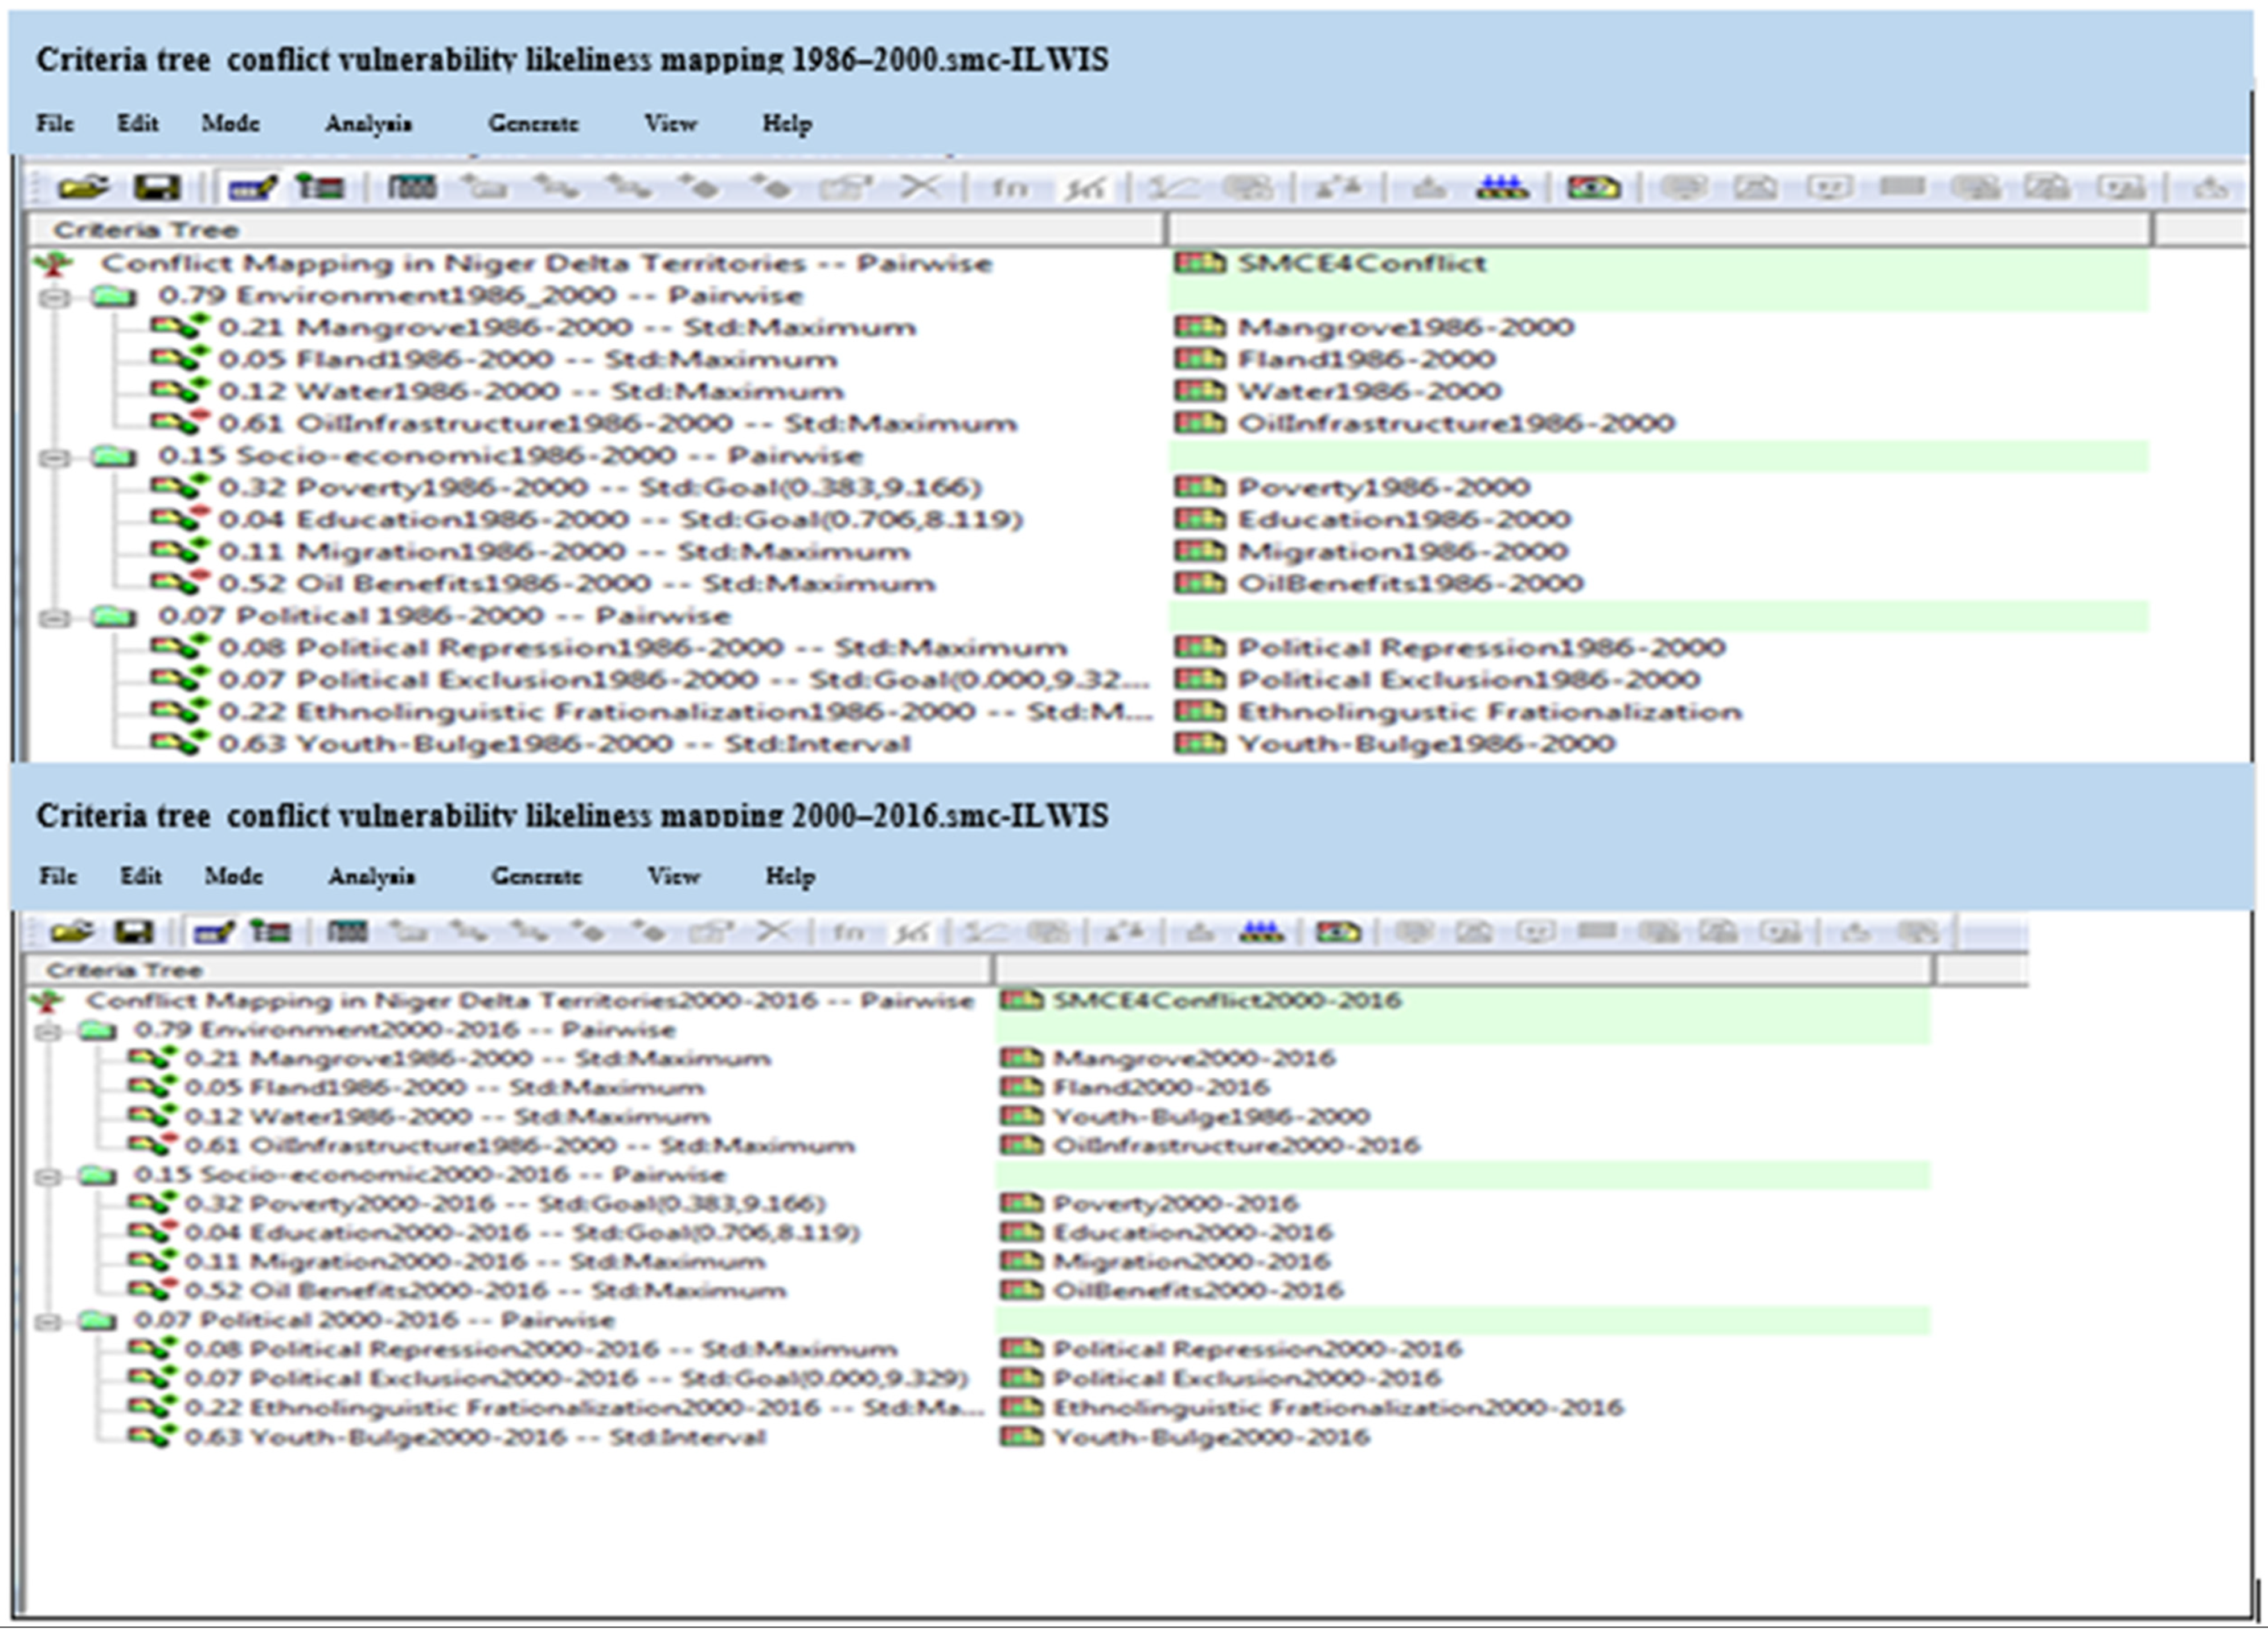
Our model’s comparison procedure is described in this section. We compared the results of our model with SMCE-CM, following the three main steps in the implementation process. First, we classified the elements and/or constraints and created the criteria tree. The second aspect was the standardization of criteria and the assignment of weights to them. The weighting technique in SMCE-CM uses the ’pair-wise comparison’ method [93]. Thirdly, the ILWIS-GIS software 3.8.6 was used to run the SMCE-CM [93,94,95,96]. For reference, see Figure 14. The pairwise comparison matrix was used to determine the weights assigned to each driver or factor incorporating essential findings from the literature review and expert perspectives about NRCs. Using spatial statistics, the outcomes of SEFLAME-CM and SMCE-CM were compared [97,98,99].
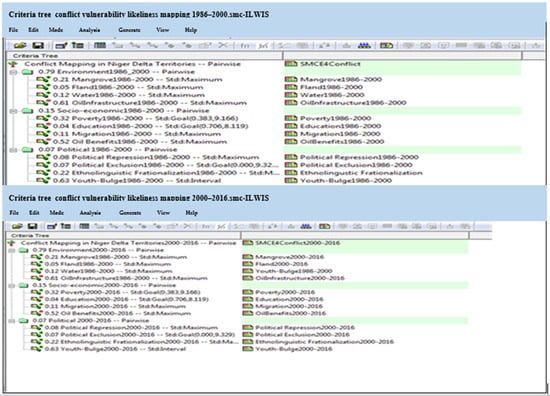
Figure 14.
SMCE-CM screenshot: criteria tree.
4. Discussion
4.1. Implications of Spatio-Temporal Distribution of NRCs: Ogoni (Inland) and Okrika (Coastland)
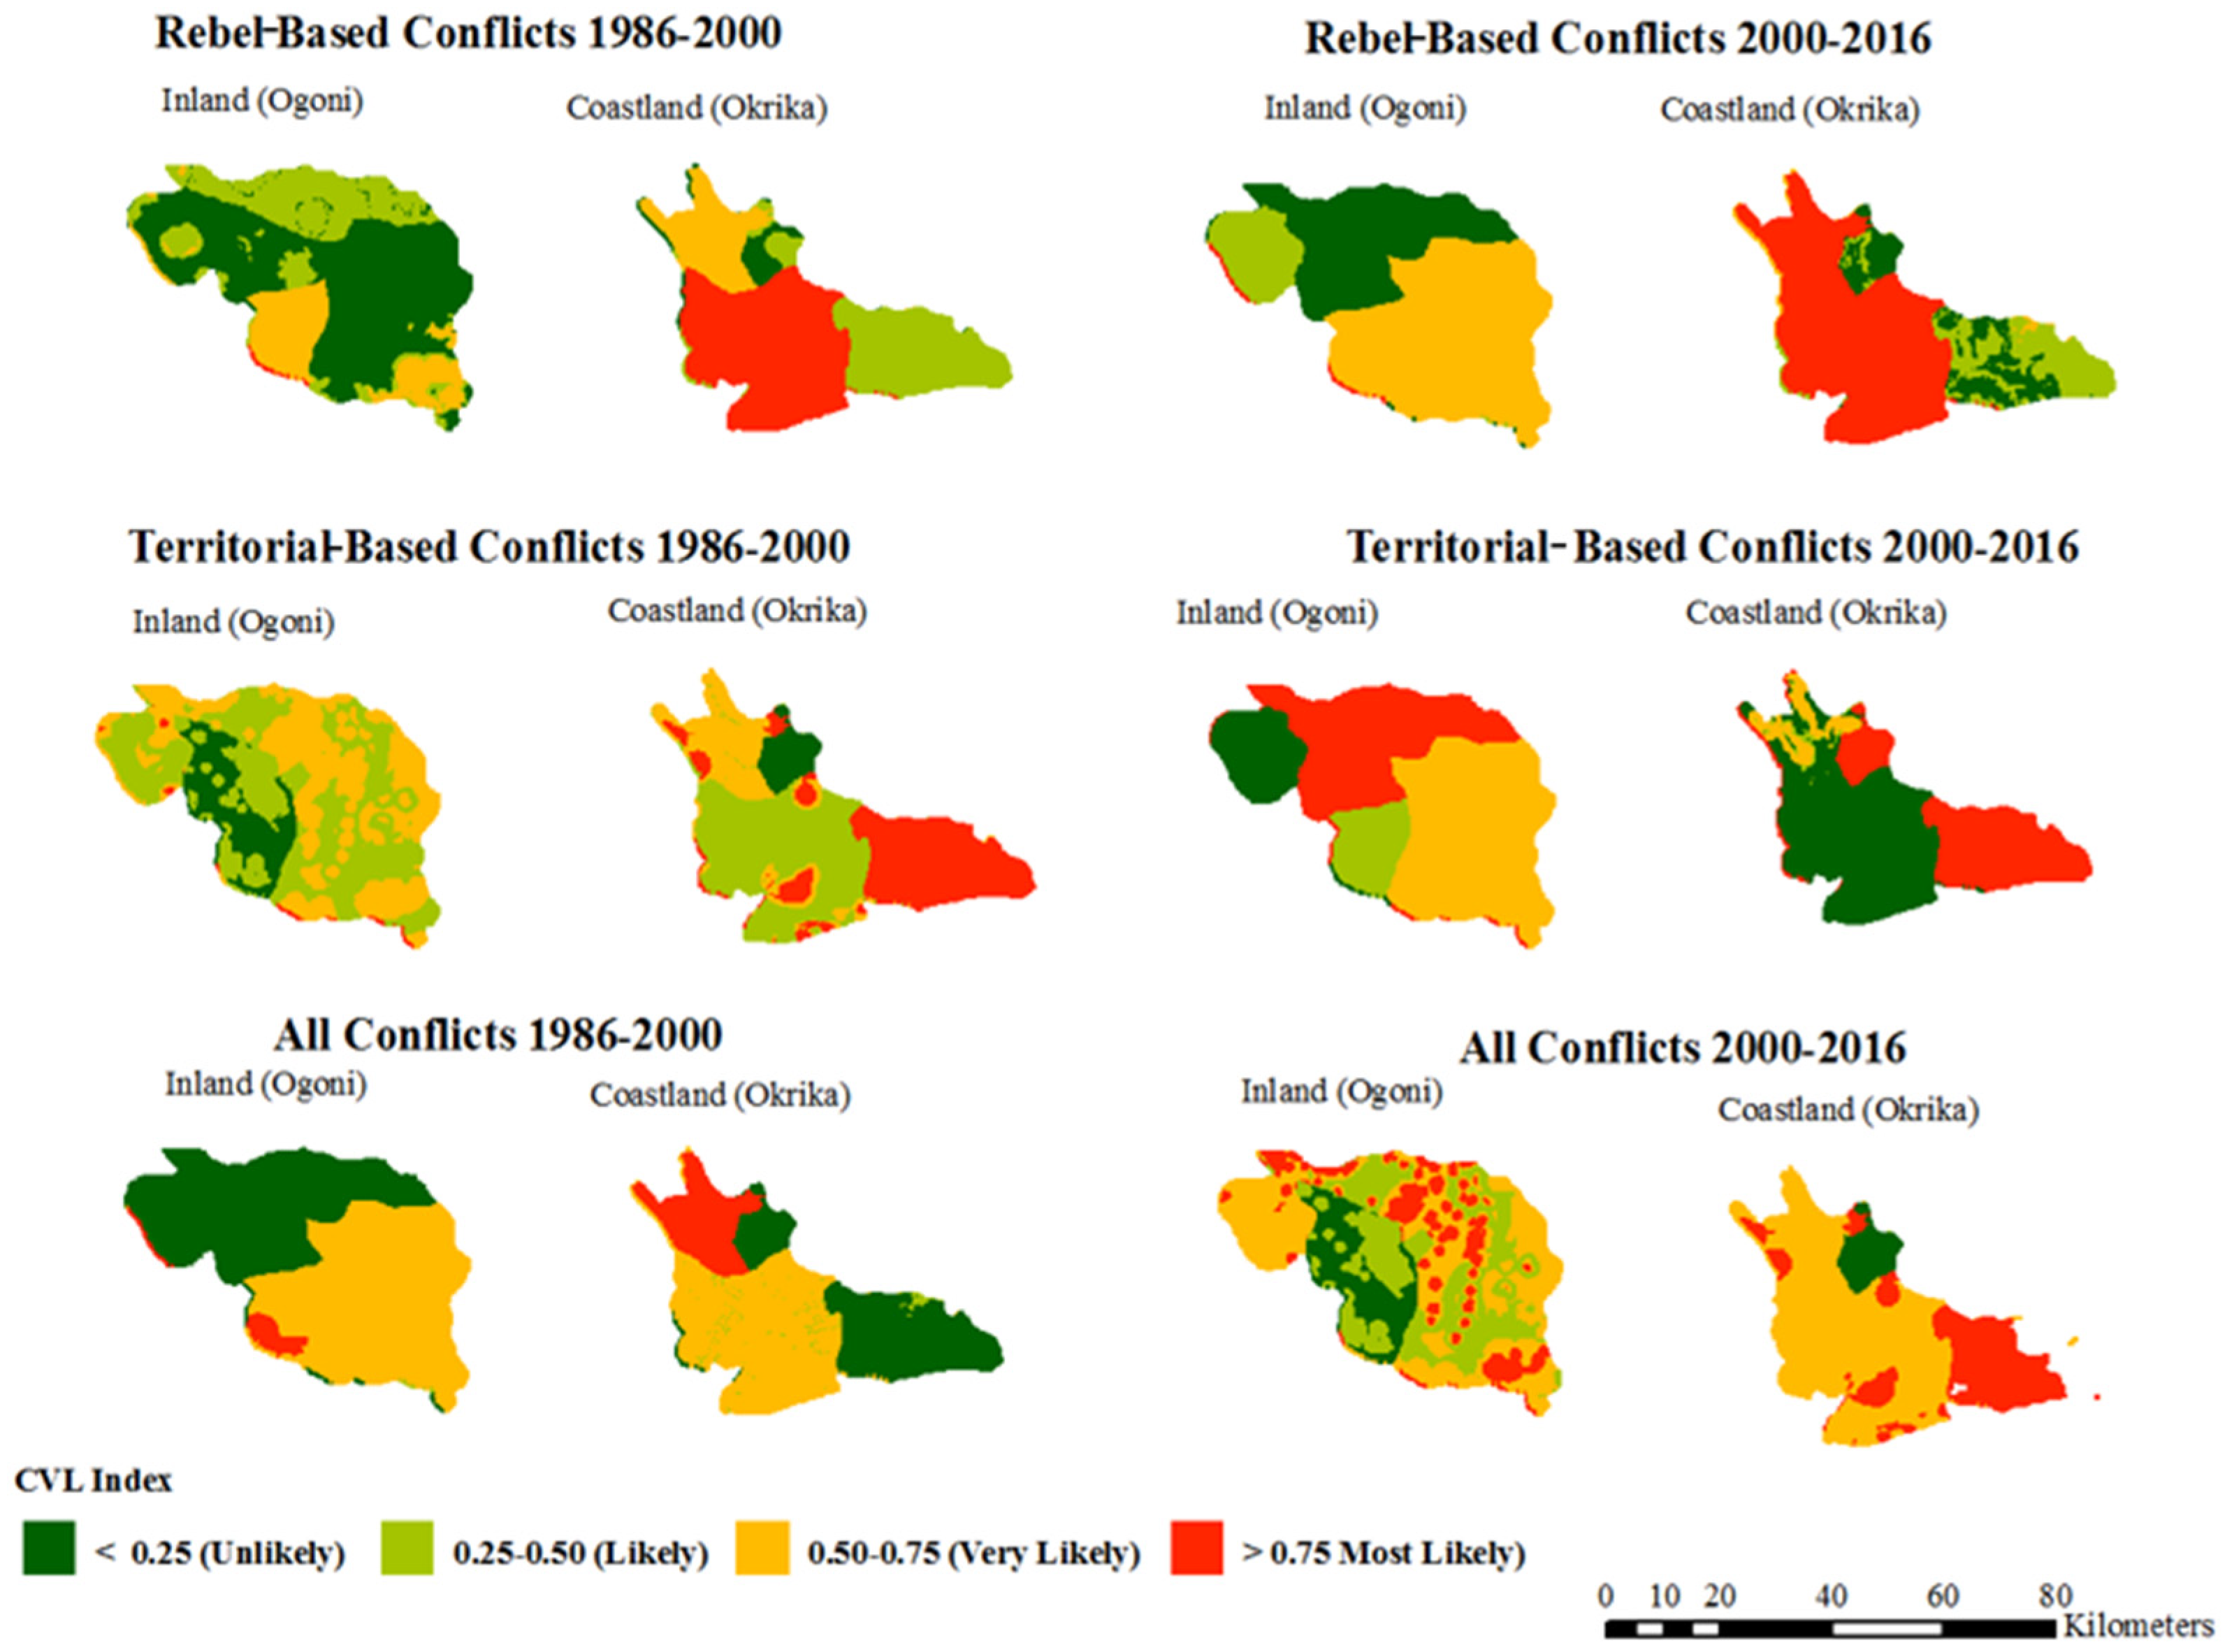
The analysis focuses on the ultimate conflict indices for each typology, with particular emphasis on the inland Ogoni territory and the coastland, namely the Okrika territory. The maps in Figure 15 show the spatial context of the CVL Index across the types of NRCs under investigation. The maps are further presented in statistical format in Figure 16.
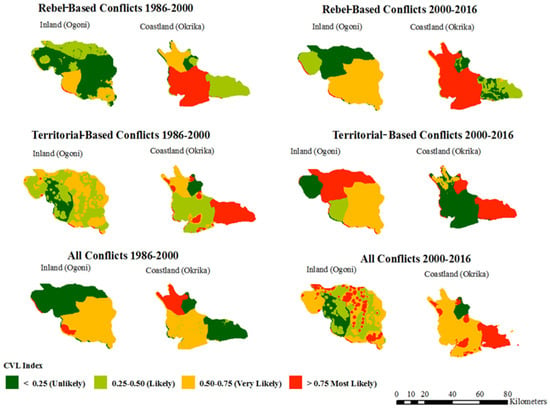
Figure 15.
The CVL Index within inland and the coast. Comparison between 1986 to 2000 and 2000 to 2016 periods.
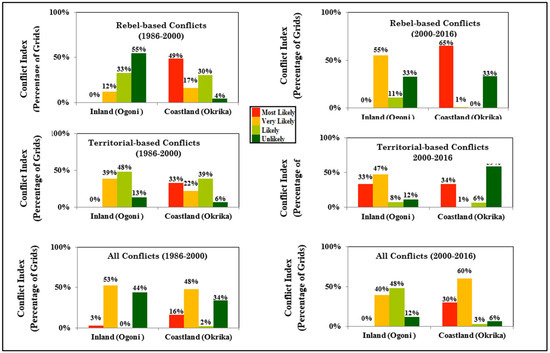
Figure 16.
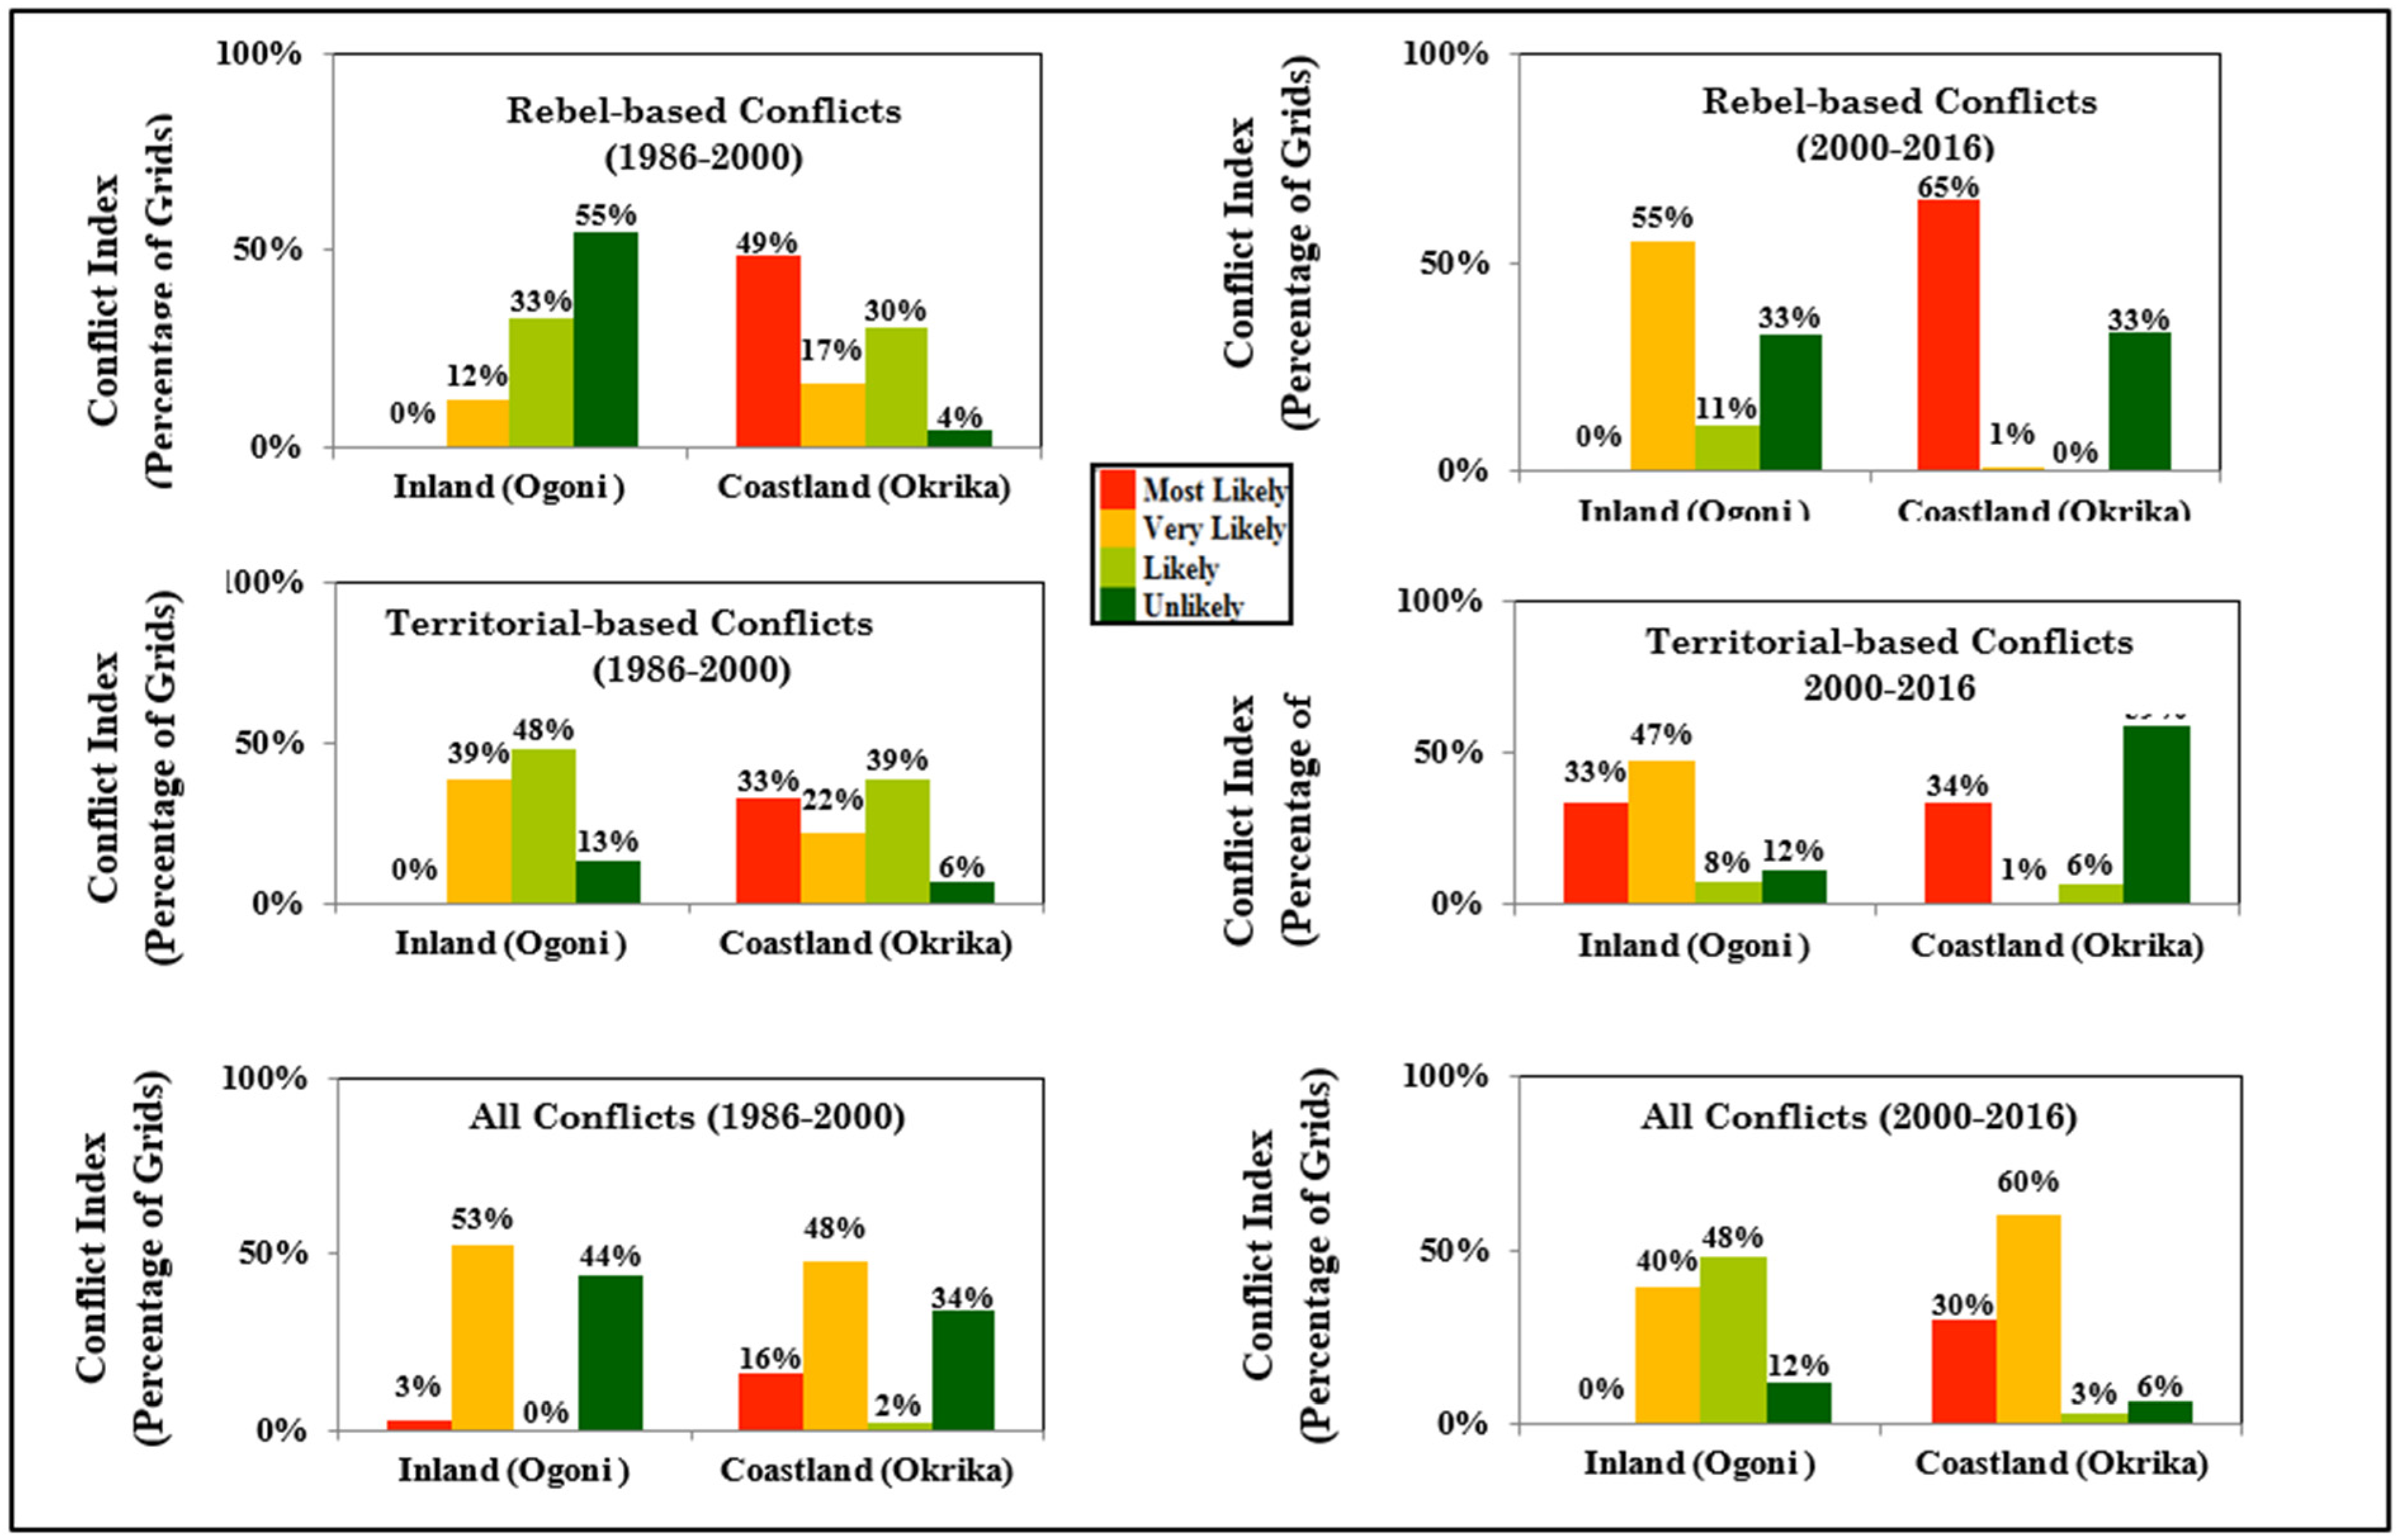
Descriptive statistics of NRCs for the coastal (Okrika) and inland (Ogoni) territories: 1986 to 2000 and 2000 to 2016.
- Rebel NRCs (Inland): For the rebel type of NRCs in Ogoni, the spatial CVL Index is projected to be 0% for both the 1986–2000 and 2000–2016 periods. The index experienced a decline from a probability of 12%, classified as very likely, during the period from 1986 to 2000, to 55%, classified as very likely, in the subsequent period from 2000 to 2016. As expected, the index experienced a decline from 55% during the period of 1986–2000, decreasing to 33% in the subsequent period from 2000 to 2016.
- Territorial NRCs (Inland): The dynamics of NRCs in Ogoni are most significant in instances of territorial disputes. The spatial CVL Index is estimated to have risen from most likely (0%) during the period of 1986–2000 to 33% in 2000–2016. Moreover, the index rose from very likely (39%) to 47% during the periods of 1986–2000 and 2000–2016, respectively. In contrast to rebel NRCs in Ogoni, the issues concerning land resources and territorial claims hold greater significance than uprisings and youthful aggression [91].
- All NRCs (Inland): In Ogoni, the index recorded a most likely value of 3% during the period from 1986 to 2000, and a value of 0% from 2000 to 2016. Recent years have shown a noticeable reduction in conflicts within the inland regions, especially in the Ogoni territory. A notable trend of conflict diffusion from inland areas to coastal regions has been observed over time. Initial investigations into NRCs have primarily focused on the initiation and length of conflicts and resource-related conflicts throughout history [5]. The study was unable to elucidate the factors contributing to the reduction and dispersion of conflicts across various regions without conducting an analysis or measurement of conflicts at the sub-national level [15,100].
- Rebel NRCs on the Coast: The index was most likely (49%) in Okrika for the period of 1986 to 2000. Within the period from 2000 to 2016, the percentage increased to 65%. Between the two-year periods of our investigation, the spatial index was very likely and reduced from 17% to 1%. In addition, the index fell under the likely category but dropped from 30% to 0% across the two periods.
- Territorial NRCs on the Coast: The index of the 1986 to 2000 period was most likely (33%) in Okrika. This saw a slight increase to 34% within 2000 to 2016. A comparative analysis of the Ogoni area (inland) reveals that the coastland exhibits a higher susceptibility to resource conflicts concerning telluric resources [101]. This suggests a significant likelihood of heightened territorial disputes in the future, particularly in coastal regions.
- All NRCs on the Coast: In Okrika, the index score fell within the most likely category. This almost doubled from (16%) from 1986 to 2000 to 30% in the 2000–2016 era. The most likely category’s spatial CVL index rose from 48% between 1986 and 2000 to 60% between 2000 and 2016. The findings suggest a spread of conflicts from the inland (Ogoni) to the coastal zone.
Across all classifications, the spatio-temporal effects of NRCs point to a rise in territory-based conflicts and a decline in rebel-based hostilities. Territory-based conflicts are where conflict dynamics are most noticeable. Over time, conflicts have expanded from inland areas to coastal areas. The escalating clashes along the shore indicate most likely for territory-based conflicts in the future, especially in coastal areas.
4.2. Implications of Types of NRCs vs. All the Driver Dimension
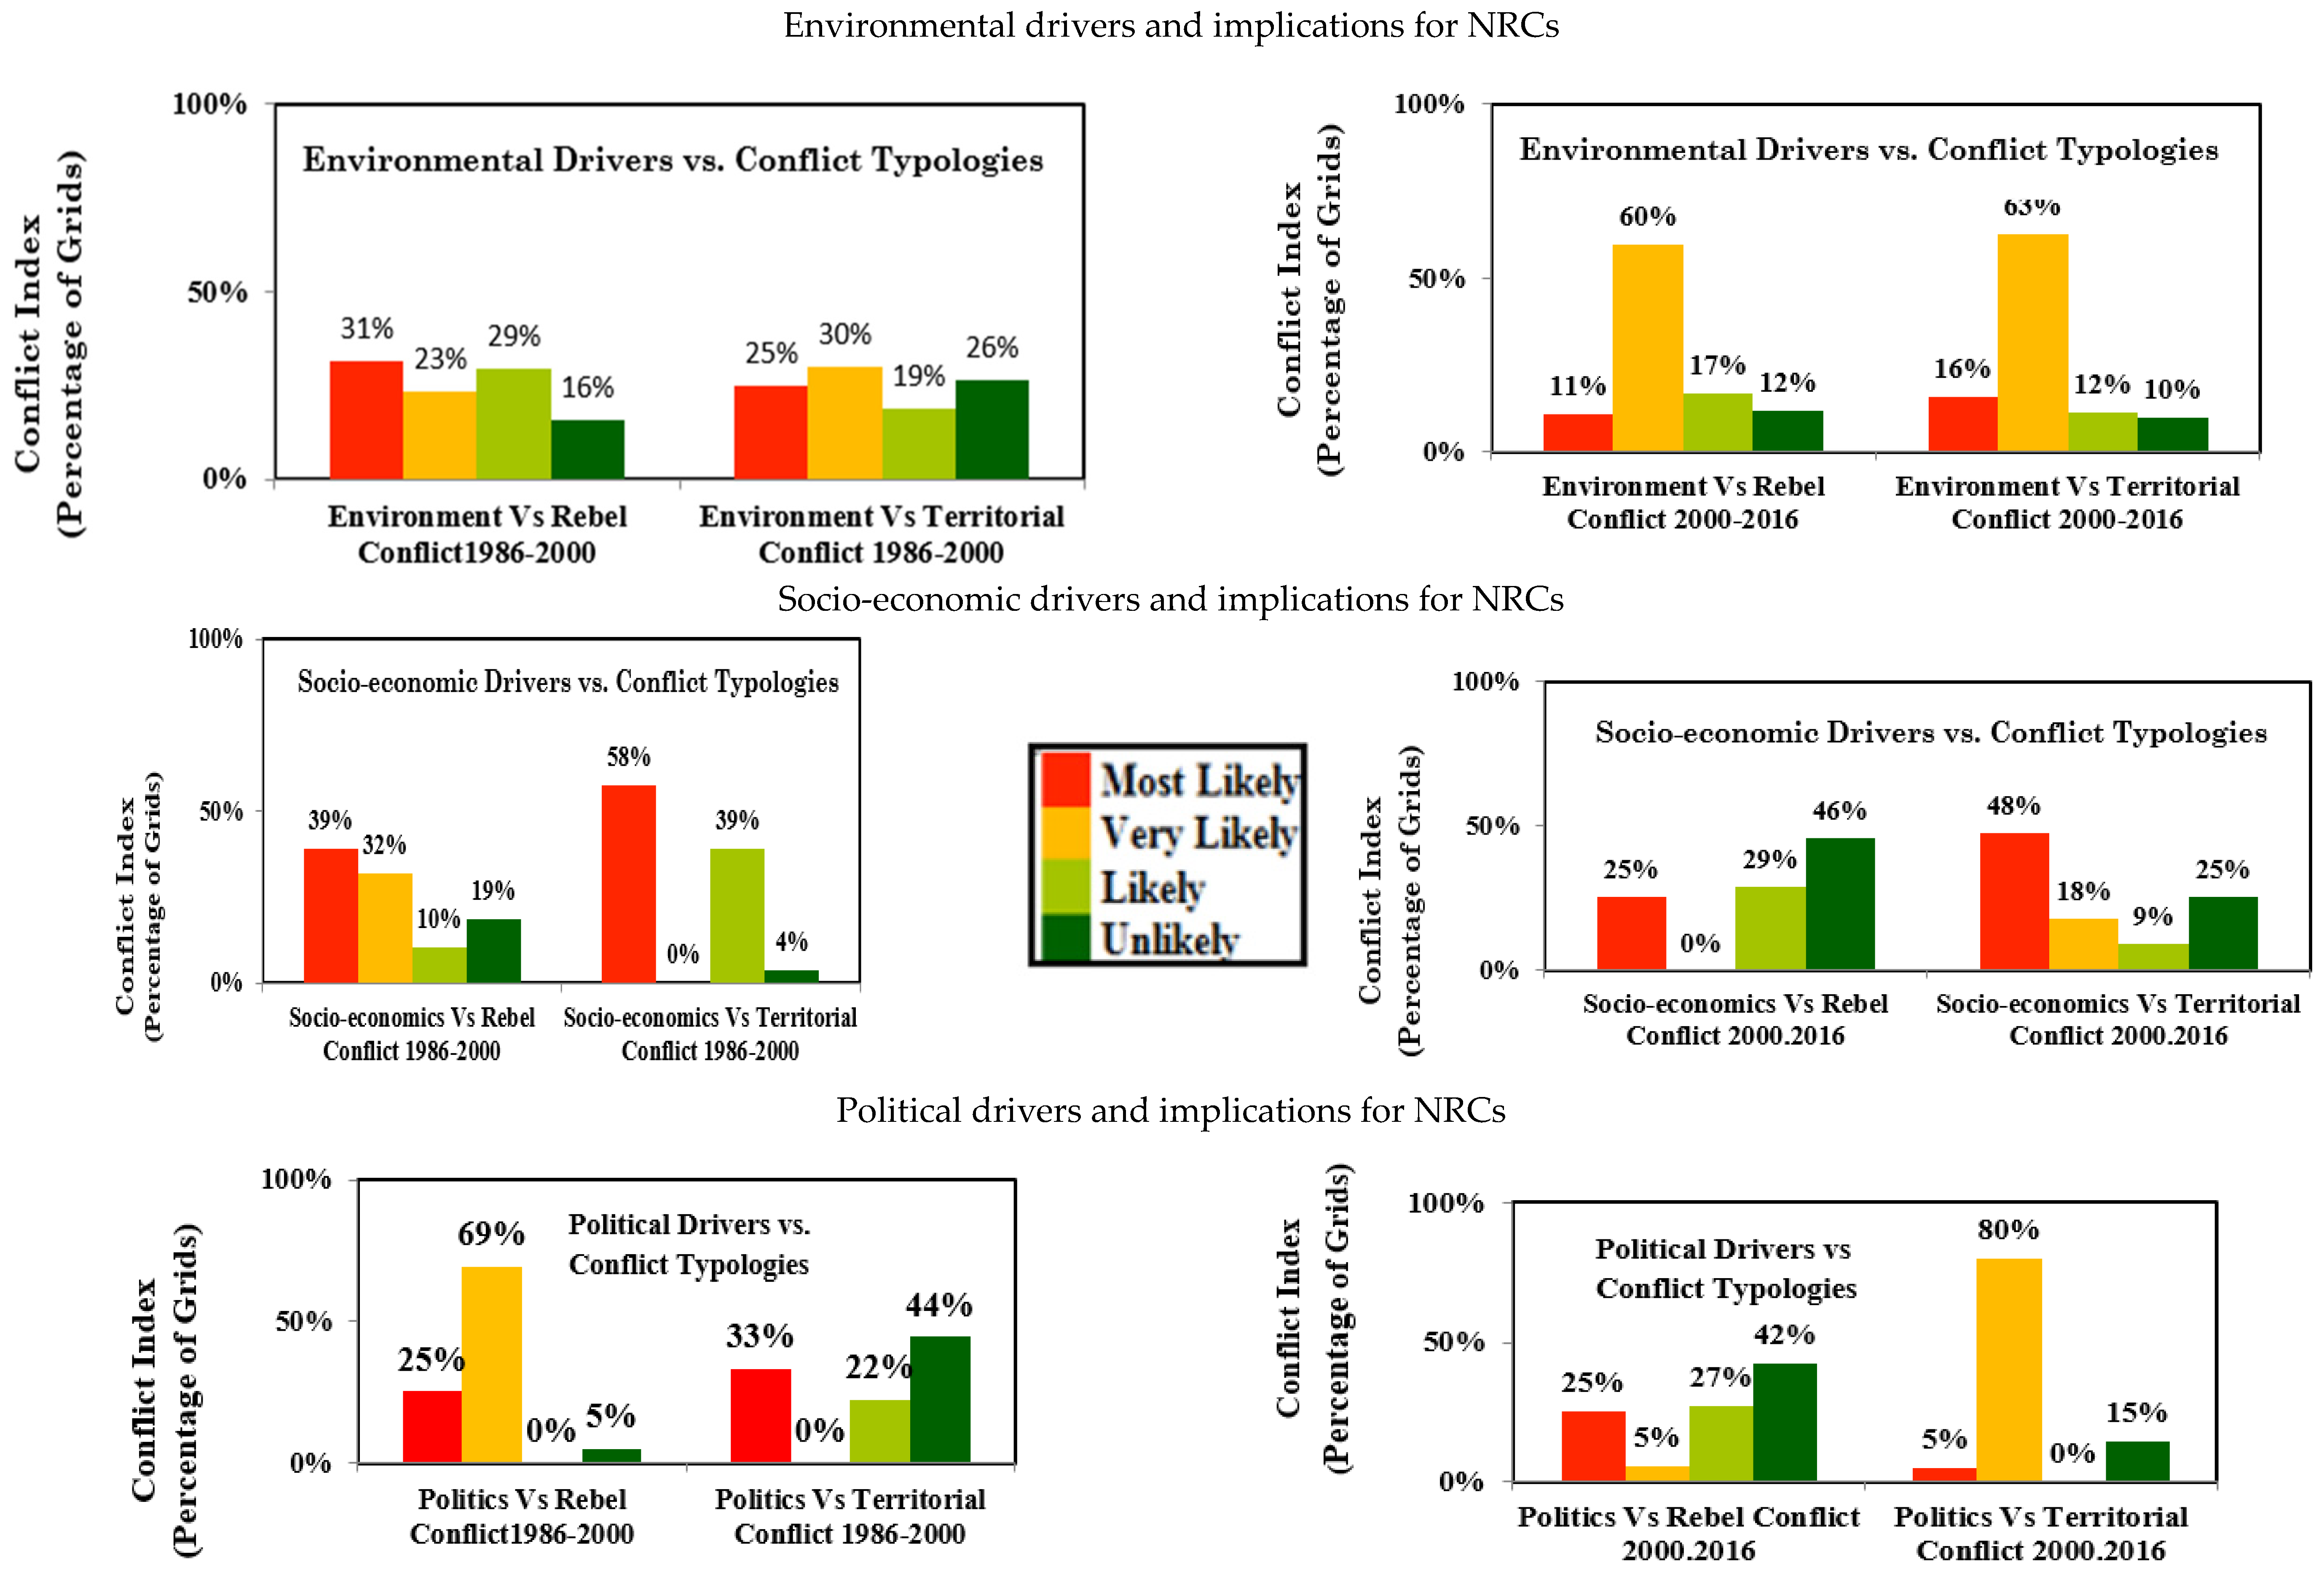
This section discusses the interaction of the combination of the three driver dimensions of NRCs and the two types of NRCs (rebel and territorial-based). As shown in Figure 17, between 1986 and 2000, the CVL Index under most likely reveals that 31% of grid cells are associated with environment vs. rebel conflicts, whereas 25% are associated with environment vs. territorial-based NRCs. Between 2000 and 2016, the spatial CVL Index of environmental factors linked to both the rebel- and territorial-based NRCs decreased to 11% and 16%, respectively, under the most likely scenario. The decline suggests a possible decrease in the number of NRCs in a specific area. However, this may be ascribed to the diffusion of conflicts across spatial and temporal dimensions, rather than an actual reduction in the number of conflicts [73]. Between 1986 and 2000, 23% of grid cells were categorized as very likely concerning rebel conflicts associated with rebel-based conflicts, whereas 30% were classified as very likely in relation to territorial conflicts. This suggests that territorial conflicts categorized as “environmental” occur more frequently than those linked to rebellion.
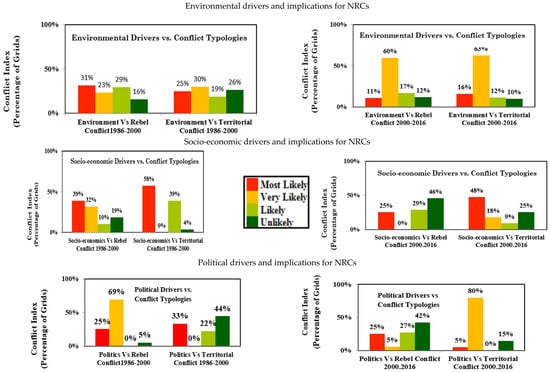
Figure 17.
NRCs vs. environmental, socio-economic and political conditions.
The spatial CVL Index for socio-economic conditions was most likely within 1986 to 2000 (39%) in the rebel-inclined NRCs. Under the territorial-based conflicts, this was 58%. Between the years of 2000 and 2016, the index for socio-economic conflicts relative to rebel-based conflicts and for socio-economic conflicts relative to territorial-based conflicts decreased by 25% and 48%, respectively. The indices pertaining to socio-economic driver vs. rebel-based NRCs and those to territorial-based NRCs were very likely (0%) and very likely (18%), respectively. The findings show that although the two conflict types fall within the very likely index category, territorial NRCs occur with greater frequency than the rebel type.
Regarding the political conditions, from 1986 to 2000, the rebel-based NRCs was most likely (25%), whereas the territorial type had a most likely percentage of 33%. In 2000–2016, while the rebel NRCs remained the same, the territorial type driven by political factors significantly decreased from 33% to 5% over the two-year span. The maps in Appendix E.2. indicate that the coast of the Opobo community serves as the main site for conflicts (5%). The significance lies in the diminishing importance of politics in local actors’ understanding of territory-based conflict. In Third World nations such as Nigeria, local populations prioritize food security over local political issues within the context of resource conflicts and struggles for resources.
4.3. SEFLAME-CM and Comparison with SMCE-CM
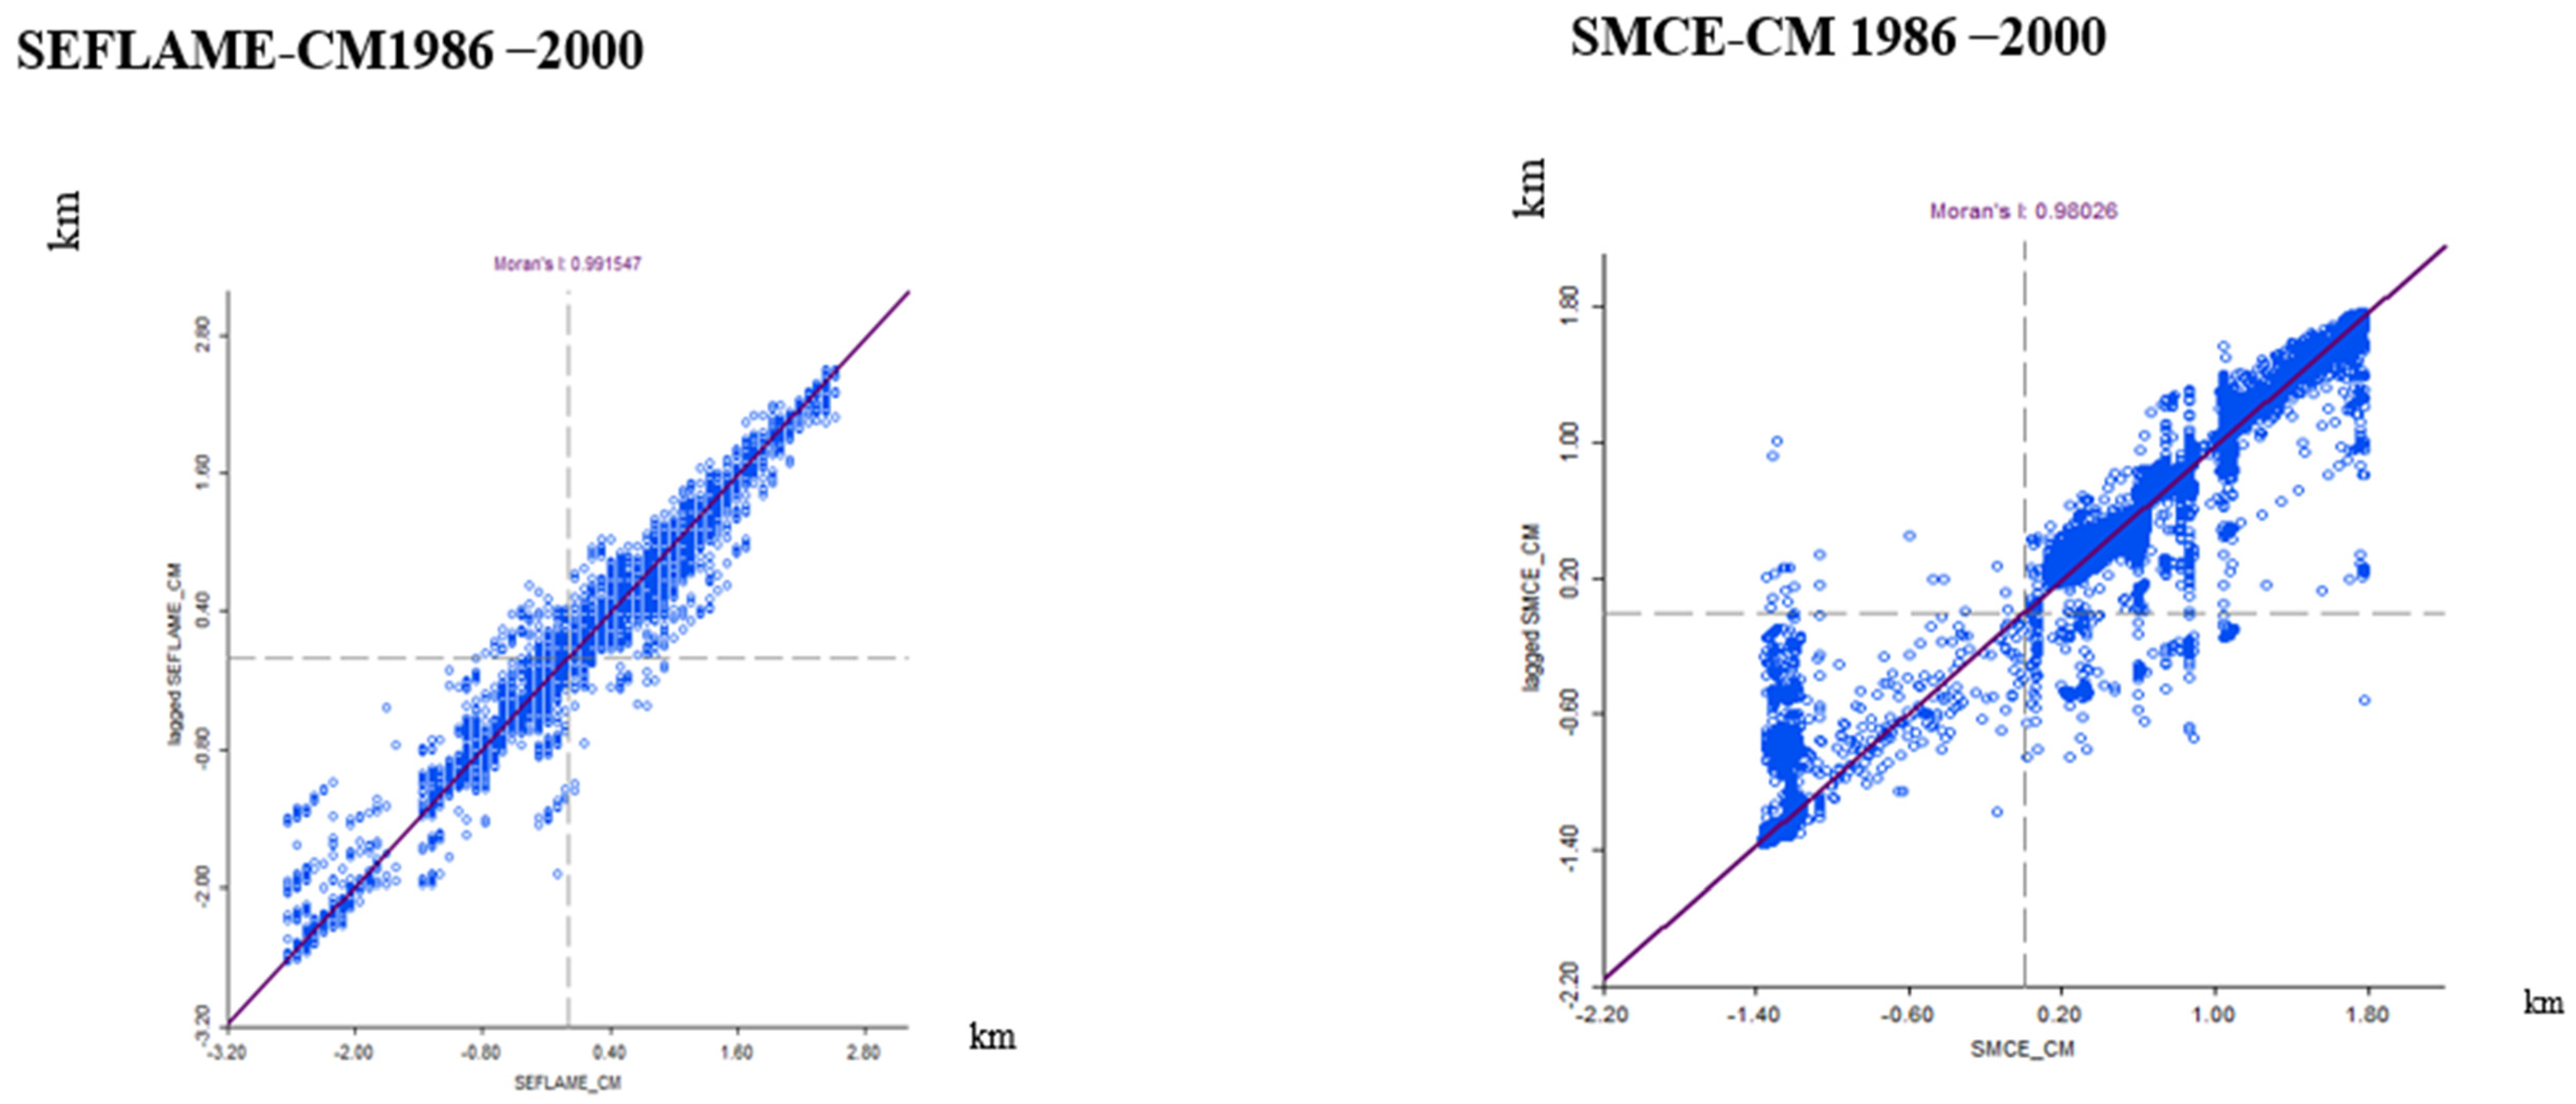
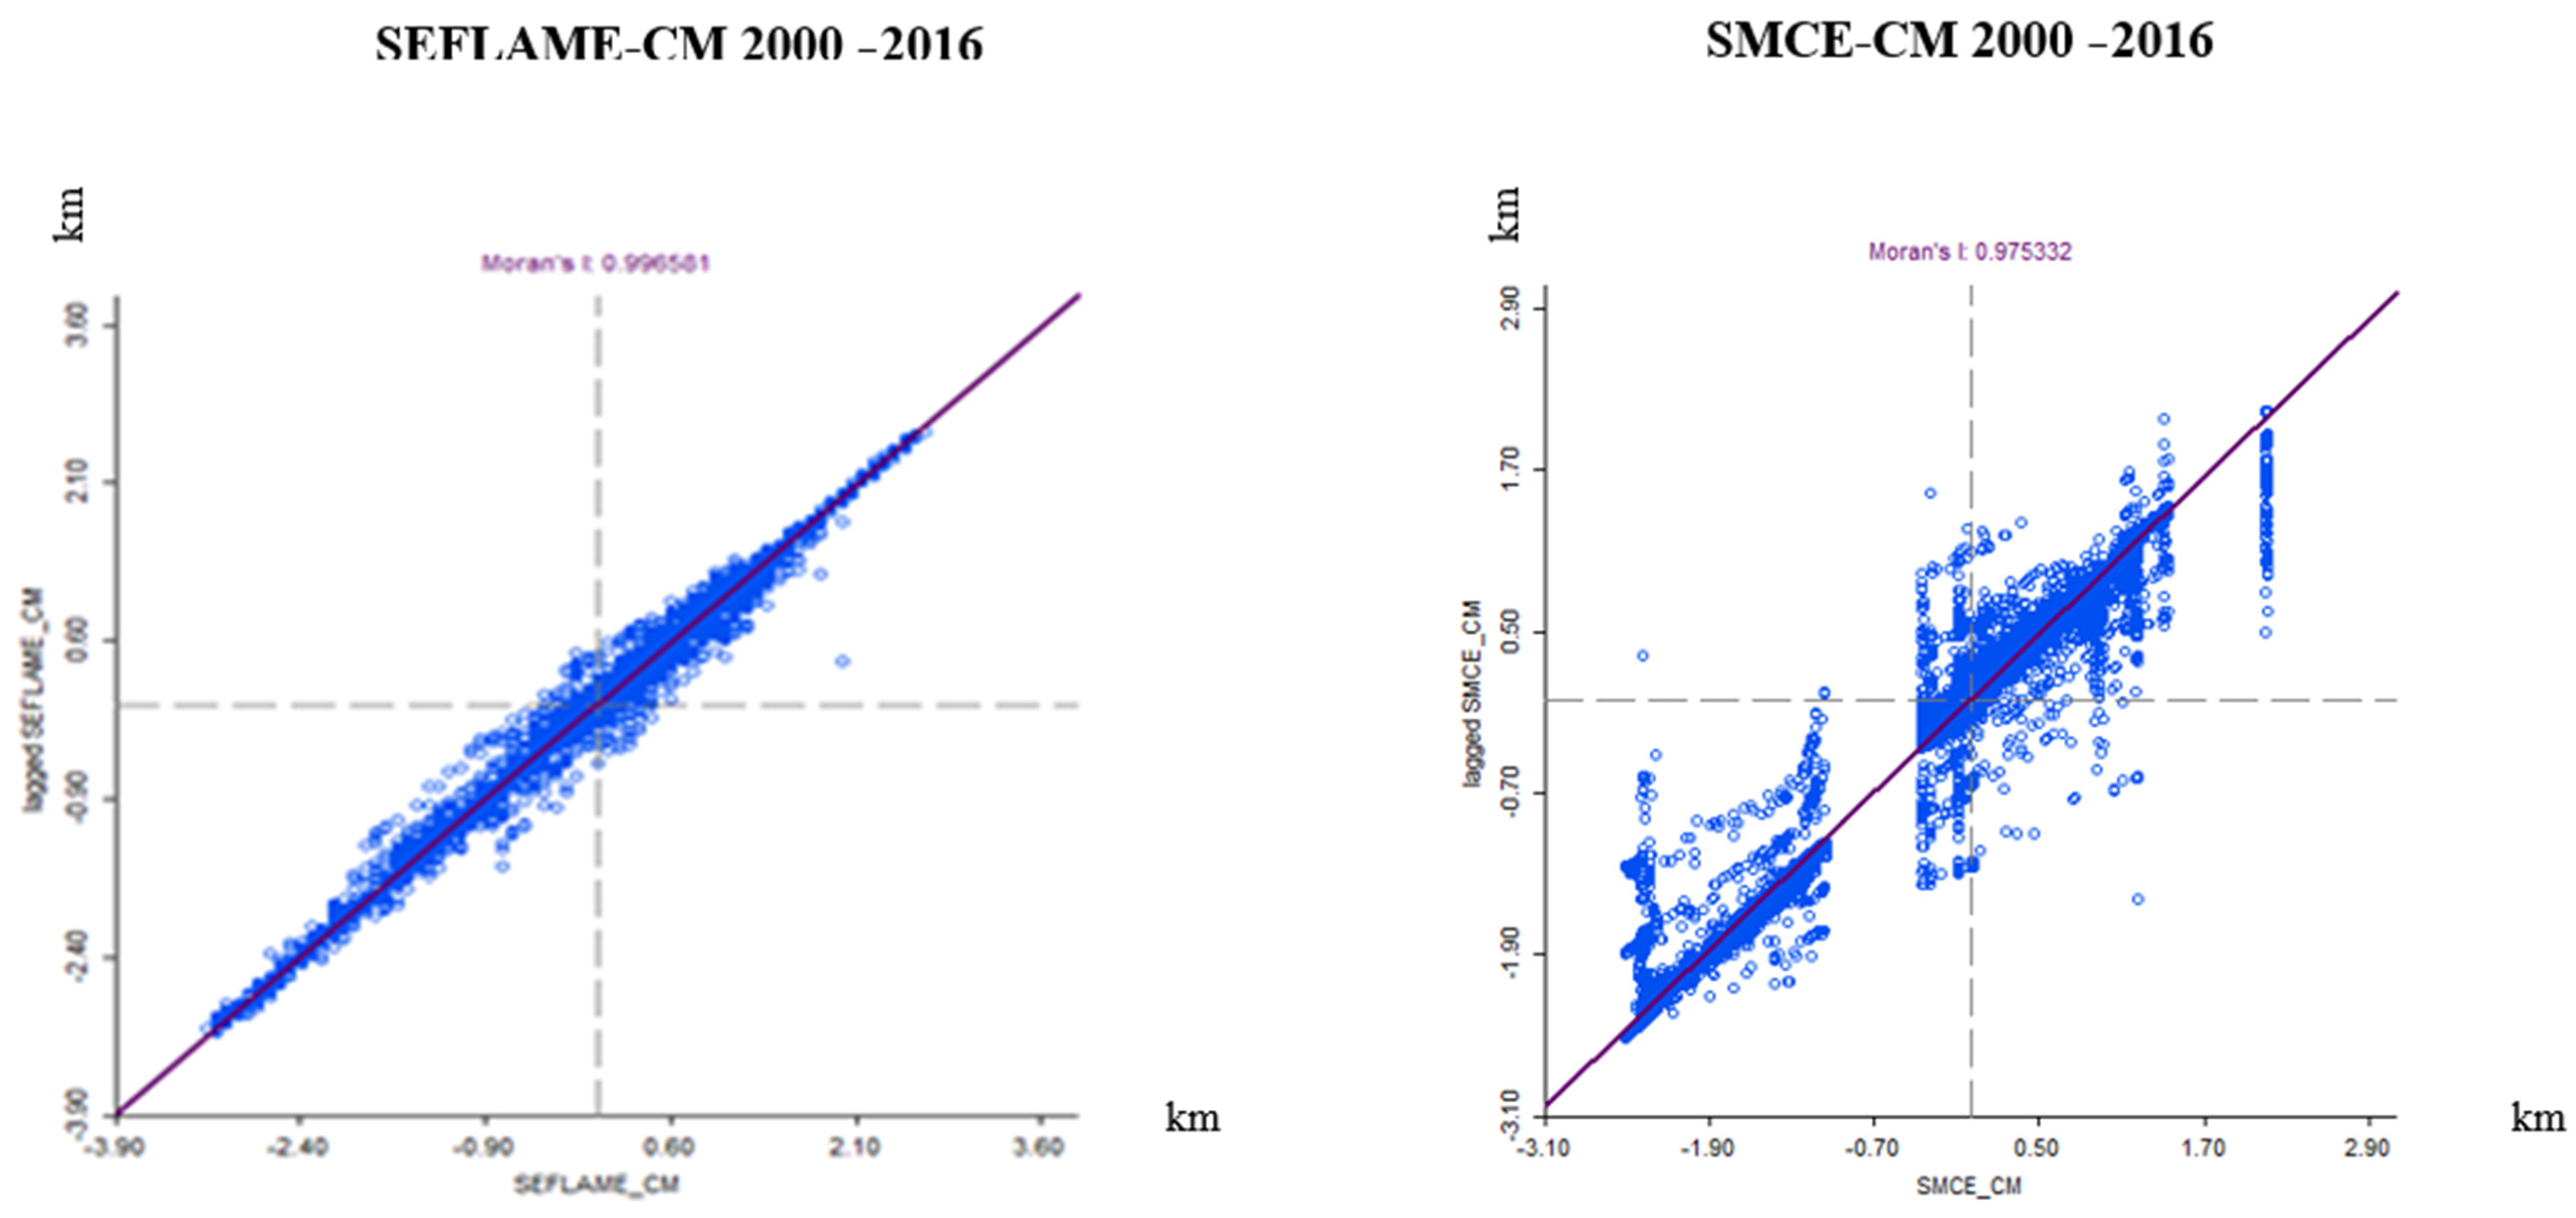
In the evaluation of the model compared with SMCE-CM, a recognized model, a comparison was made using spatial statistics. Spatial statistics are essential for applying spatial analysis to solving practical issues in interdisciplinary research and addressing real-world problems that have spatial context [97,98,99]. Moran’s I scatter plots of NRCs within the time periods are shown in Figure 18 and Figure 19. As seen on the graphs, there are values of 0.99 and 0.98 for the SEFLAME-CM and SMCE models, respectively. They both have a significant spatial autocorrelation. The vertical axis of the scatter plots is the spatial lag. This is the weighted average of neighboring values [95]. The horizontal axis shows the CVL Index obtained from simulations. The scatter plot of Moran’s I is divided into four distinct quadrants. Below is the description.
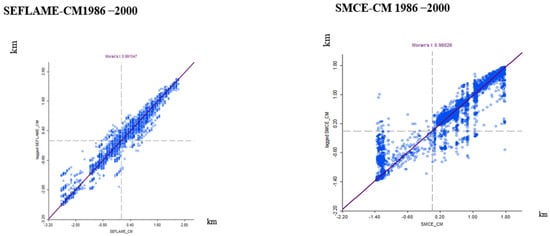
Figure 18.
Spatial CVL Index and model comparison for 1986–2000 The I value is shown at the top of the Moran’s scatter plot. Note, the spatial lag, or the weighted average of nearby values, is shown by the y-axis, while the x-axis represents the value of I. Moran’s I is the line’s slope.
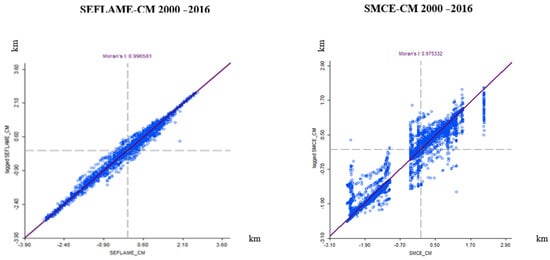
Figure 19.
The spatial CVL Index and model comparison for 2000–2016. The I value is shown at the top of the Moran’s scatter plot. Note, the spatial lag, or the weighted average of nearby values, is shown by the y-axis, while the x-axis represents the value of I. Moran’s I is the line’s slope.
First, the “high-high” communities. These are those areas situated in the upper right quadrant. They exhibit index values that surpass the average. These communities are situated close to neighbors with similarly high average values and have greater average values.
Second, the “low-low”. The locations with nearby areas that also have low average values.
Third, the “high-low”. These are those on the lower right quadrant. They have lower average values encircling locations that have higher average values.
Fourth, the “low–high”. These are like the lower right quadrant. They have areas with low average values but which are surrounded by areas with higher average values (low–high) [10,102].
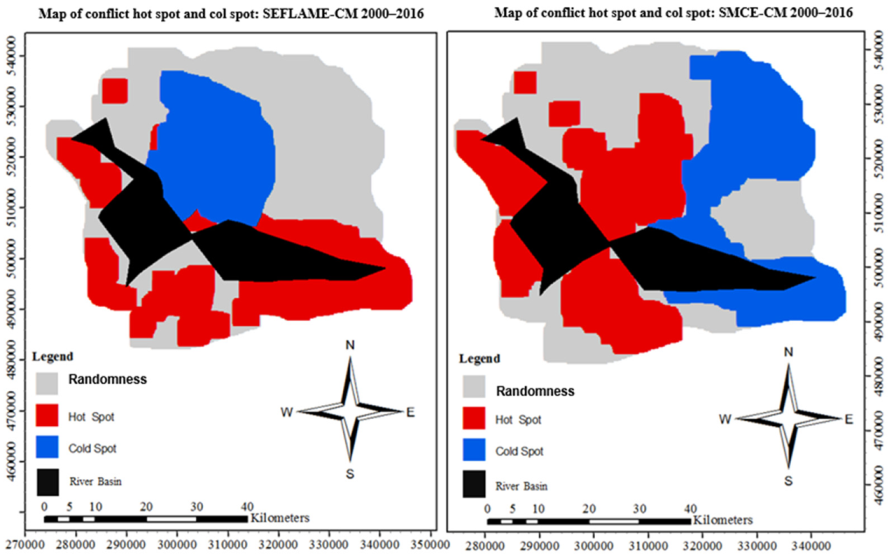
The spatially explicit CVL indices of the two models show a systematic pattern rather than a random distribution [102,103]. Inland settlements, particularly Okrika and Khana, were found to be the most prevalent in the hot spot zones of both models within 1986 and 2000, according to local Moran’s. The overall NRCs maps created from the two models for the two periods are shown in Appendix E.1 and Appendix E.2, respectively. The hot spot moved coastward between 2000 and 2016. The affected communities include Bonny, Finima, Opobo-Nkoro, and Andoni (refer to [10] and Appendix E.2). With improvements and better datasets, our model of SEFLAME-CM shows potential for quality improvement, while effectively representing any complex real-world problem transparently.
The implementation of SMCE is severely hampered by its existing design. A widespread need for customized design to enhance performance is shown by recent applications of SMCE in spatial decision-making [104,105,106]. SMCE is suitable in resource conflict management and negotiations; however, it typically requires stakeholder participation during the problem structuring and joint problem framing stages. SEFLAME-CM effectively mitigates this limitation by integrating a crucial joint problem-framing phase into its functionality. SEFLAME-CM and SMCE-CM can mutually reinforce their strengths when used together. The implementation of SEFLAME-CM as an innovative conflict management model offers multiple benefits: actors engage in the problem-structuring phase, where the model generates inputs by evaluating the importance of conflict drivers, and the model is transdisciplinary, integrating knowledge from participants and various disciplinary fields.
4.4. Implications of SEFLAME-CM and the Novel Applications of Fuzzy Logic Modeling
The proposed model, SEFLAME-CM, in a multi-criteria optimization scheme, outperforms earlier reported novel approaches and works [36,43]. SEFLAME-CM independently addresses the reported needs for a comprehensive evaluation of NRCs and shows the following advantages:
Firstly, the model utilizes the weighting of rules and the conflict drivers in a systematic manner. In the fuzzy logic model, failing to assign weights to rules and factors can result in several disadvantages, including the assumption of equal importance. This may not accurately reflect real-world scenarios of resource conflict management, where certain drivers should have a greater influence on the decision-making process. Humans can perform much better than deterministic systems or computers when driving or planning a strategy due to their unique reasoning capabilities and complex cognitive processing [107,108,109]. In a real resource conflict scenario, some factors have more impact than others.
Secondly, SEFLAME-CM clearly outperforms other novel approaches, like the rough set approach of voting, because it can simultaneously optimize multiple conflicting goals, such as the spatial, temporal, and dimensional vulnerability of people and places to NRCs, in order to enhance a more comprehensive solution to conflicts [44] and the single-valued, neutrosophic, probabilistic, hesitant fuzzy rough set (SV-NPHFRS) [37].
Thirdly, our model produces far more comprehensive results by managing numerous objectives and uncertainties and realistic and nature-inspired metaheuristic algorithms that can tackle problems across disciplines and domains as opposed to merely black box-based algorithms, where the latter is achieved without considering knowledge extracted from human experiences [45,52].
Fourthly, in order to address the problem of NRCs being oversimplified, our model incorporates actors’ involvement from the problem-structuring phase. The problem-structuring step has the potential of oversimplifying the sociological dimensions of NRCs if stakeholders do not participate. With the emerging challenges of climate change, NRCs have become more interwoven between the social and ecological livelihoods of the local people, which requires actors’ involvement in a problem-structuring phase.
5. Limitations
This study is constrained by the quality of the model data. The research demonstrates that remote sensing data sets are effective for gathering environmental data in the quantitative modeling of NRCs. Nonetheless, challenges exist regarding the resolution of the employed optical sensors. The resolution of Landsat data used is 30 m by 30 m, which limits its applicability. For example, assessing water stress trends and pollution linked to oil extraction in the study area may yield more effective results. Rather, we employed alternative distance measures. Increased resolutions will enhance the outcomes. Concerns exist about the exact location of environmental data sets and the social processes taking place in those areas. Research on use of remote sensing for the modeling of social issues occurring in specific locations has been discussed in the literature within the framework of “people and pixels” [110].
In addition, there are limitations associated with spatial autocorrelation in spatial statistics. For example, the Moran’s I statistic is an essential tool for spatial clustering and pattern analysis because it offers a weighted correlation coefficient that makes it different from geographical homogeneity [111]. However, Moran’s I and other global cluster statistics show sensitivity to geographical clustering and departures from the null hypothesis throughout the research region [106]. Global statistics can identify the presence of spatial structures, including clustering, autocorrelation, and uniformity [111]. Nevertheless, the study fails to identify the locations of these clusters or assess the variation in spatial dependency across different regions, thereby constraining the comprehension of the regional structure of spatial autocorrelation [112,113].
Moreover, other challenges emerged during the implementation of the model input variables. Each conflict exhibits unique characteristics that create challenges for operationalization and measurement in various contexts and timeframes. The inadequate performance of earlier empirical studies can be ascribed to data constraints and implausible assumptions. To address these problems, a multi-scale approach was used. This entailed using grid cells as a basis for the scale or unit of analysis. This was then integrated with the administrative scale or community [73], creating links at a disaggregated scale as well as fine-scale resolution.
Modeling NRCs is also challenging due to the intricate social dynamics found in real-world processes at the community level. A recent study by [114] showed that community members often settle around neighbors with similar perceptions and opinions about community challenges. While this remains a limitation of our methodology, a combination of the data on community perception and other sources such as remote sensing was helpful in alleviating this. Our multilevel approach with the use of remote sensing, like that of [115], is a step in the right direction.
Notwithstanding the highlighted challenges, the flexible characteristics of SEFLAME-CM successfully tackled specific challenges related to fuzzy logic models, such as the assessment of membership functions and the prioritization of variables by stakeholders and actors. Fuzzy logic introduces complexities, particularly in the formulation of rules. We employed a framework of IF-THEN rules in conjunction with actor-based weighting. The multiple dimensions of NRCs can result in a complex rule base. However, the complex nature of the factors influencing NRCs necessitates the use of diverse inputs.
6. Conclusions
This paper presents a novel approach to improving knowledge of the variables influencing NRCs. This is achieved through the evaluation of individual vulnerabilities within the context of NRCs. The development of SEFLAME-CM is described in this paper. By considering both internal and external driver components of NRCs in communities, SEFLAME-CM serves as a tool to enhance the comprehensive assessment of susceptibility of people to NRCs. A major finding is that environment plays a critical role in resource violence and resource struggles in Nigeria. In Third World countries like Nigeria, local people care more about food than local politics when it comes to resource conflicts and struggles over resources. The results also indicate that local players’ perceptions of territorial-based conflict are rapidly losing their emphasis on politics. People care more about food than local politics when it comes to resource conflicts and struggles over resources.
For efficient resource-conflict management, this research also emphasizes the significance of spatial technologies, remote sensing, and knowledge sharing between local community stakeholders and experts. The findings, at a spatial and temporal level, are noteworthy and provide a foundation for integrating coastal zone management (ICZM) into the sustainable management and development of one of the most important deltas in Africa. A holistic approach is therefore required to address environmental degradation alongside the socio-economic and political conditions surrounding resource conflict. This approach is essential to understanding the intricate relationship between natural resources and conflicts at the community level in support of regional policies. The policy implications derived from our research suggest that integrating these diverse drivers into conflict management is crucial for ensuring sustainability and peace. International and national interventions, including organizations such as DFID, UNDP, the World Bank, and national agencies like the Presidential Amnesty Program (PAP), should adopt an integrated approach that reflects the needs of affected communities and addresses the multifaceted issues underlying conflicts. While our paper demonstrates the potential of SEFLAME-CM, we acknowledge the necessity for further comparison and model validation using data from additional sources, such as the integration of remotely sensed data. Despite variations in individual actors’ perceptions of conflict drivers, our hierarchical grouping approach defined 81 unique rules. This shows how useful fine-grained spatial and temporal analysis can be for promoting sustainable peace in resource-rich areas and integrating ICZM plans, even though they cannot fully account for the problems that arise when complex social processes happen in real life. Our model can be applied to additional NRCS situations in Africa and globally, particularly those in which natural resource extraction and conflict coexist. This makes it a useful tool for dealing with resource-related problems, even when there are not enough data. SEFLAME-CM represents a significant advancement compared to previous methods for analyzing resource-related conflicts, thanks to its nuanced approach in addressing the complex dimensions of NRCs.
Recommendation for future studies: When researchers think about what SEFLAME-CM could mean for the future of NRCs, they should look at the sub-dimensions of the drivers, or each individual factor that causes conflicts. Future research should explore the applicability of SEFLAME-CM in other case studies, and its extended use can shed light on how multiple stakeholders can collaboratively solve resource conflict problems. In future applications of SEFLAME-CM, studies should consider how the model parameters of SEFLAME-CM affect the opinions of actors in different communities.
It is also recommended that NRCs scenarios will necessitate simulation within a controlled environment, and the efficacy of the fuzzy model is evaluated concerning these simulations. Additionally, SEFLAME-CM can be integrated with complementary methodologies such as game theory or agent-based models. Fuzzy logic effectively addresses imprecise information, while game theory models strategic interactions among conflicting parties, offering a comprehensive understanding of conflict dynamics. Using a combination of qualitative and quantitative studies, researchers should prioritize plausible scenario families and groupings. The circumstances listed below are suggested.
Scenario A. Here, a framework for socio-economic growth is presented along with subgroup scenarios. The socio-economic environment is influenced by urbanization, population increase, and the expansion of the oil sector. Additionally, this scenario should consider the differences in per capita income at local or regional levels.
Scenario B. Scenario B may look at sub-group possibilities and other political dimension eventualities. This could involve not just acting as a sub-group scenario, but also considering other political aspects of NRCs at local or regional levels.
Scenario C. This may be tagged as a climate change scenario. A key consideration may be the integration of data from multiple sources such remote sensing, secondary data and other sources in the assessment of the impact of climate change on environmental change and NRCs.
Scenario D, which includes sub-group scenarios, is related to environmental sustainability scenarios. This scenario emphasizes technological advancements, enhanced compliance with environmental policies by oil extraction companies, or a transition from oil extraction as the main economic driver.
These scenarios may also highlight nature-inspired metaheuristic algorithms, which are appropriate for addressing issues across various disciplines and problem domains. By assigning equal weight to environmental, social, economic, political, and legal poly dimensions in the sustainable management of resource disputes, this strategy will guarantee full participation from all segments of society in decision-making.
Author Contributions
Conceptualization, L.I.; formal analysis, L.I.; investigation, L.I. and D.R.U.; methodology, L.I. and D.R.U.; project administration, K.K.; resources, K.K.; supervision, K.K.; comparison with previous models, L.I.; visualization, L.I.; writing—original draft, L.I.; writing—review and editing, L.I., D.R.U., N.M.C., N.M., A.F., S.S., P.P., S.K., B.B.S., S.M. and A.B. All authors have read and agreed to the published version of the manuscript.
Funding
The research received no external funding.
Institutional Review Board Statement
Not applicable.
Informed Consent Statement
Informed consent was obtained from all subjects involved in the study.
Data Availability Statement
Data is available on request from the corresponding author.
Acknowledgments
We acknowledge the support of Kyriakos Kouveliotis for providing an enabling environment that made it possible to complete this paper. Wolfram Mauser, formerly of the LMU, Munich, for his support in supervising the project at the beginning of the research. Thank you to Chioma Daisy Onyige, a sociologist at the University of Port Harcourt, Nigeria, Faculty of Social Sciences, for her assistance and for allowing us to utilize her experience in the study area, for supervising the fieldwork, and partly recommending the students who helped with the data collection. Thank you too to Fyneface Dumnamene Fyneface, now Executive Director of the Youths and Environmental Advocacy Centre (YEAC-Nigeria), who was at the time of the research an MSc. student in Political Science and Administrative Studies (International Affairs) at the Faculty of the Social Sciences of the University of Port Harcourt. Fyneface was the most supportive student and nominated some staff at the YEAC-Nigeria who supported us in the entire data collection process and in the meetings we had with the local communities.
Conflicts of Interest
The authors declare no conflicts of interest.
Appendix A
Appendix A.1. The CVL Index—Environmental Drivers of Conflicts vs. Rebel-Based Conflicts (YIevRBC)
YIevRBC = Conflicts index for environmental drivers of conflicts vs. rebel-based conflicts
evRBC = Environmental drivers vs. rebel-based conflicts
evRBCi = The value of the membership function of the output fuzzy set, evRBC of rule i
I = Representing rule i of the evRBC inputs
Ai = Value of the corresponding membership area, indicating the degree to which rule i is fired
Appendix A.2. The CVL Index for All Rebel-Based Conflict Typology (YIRB)
YIRBC = Rebel-based conflicts index
YIevRBC = Conflicts index for environment risks drivers vs. RBC
YIseRBC = Conflicts index for socio-economic drivers vs. RBC
YIpoRBC = Conflicts index for political drivers vs. RBC
N = Number of conflict-driver dimensions
Appendix A.3. The Final CVL Index Based on FLAME-CM (Non-Spatially Explicit) (CVL Index)
CVL Index 1 = Conflicts vulnerability Likeliness Index—non-spatially explicit [0 1]
YIev = Conflicts index for environment risk drivers
YIse = Conflicts index for socio-economic drivers
YIpo = Conflicts index for political drivers
N = Number of conflict-driver dimensions
Appendix B
Appendix B.1. Sample IF THEN RULES: Environmental Dimension
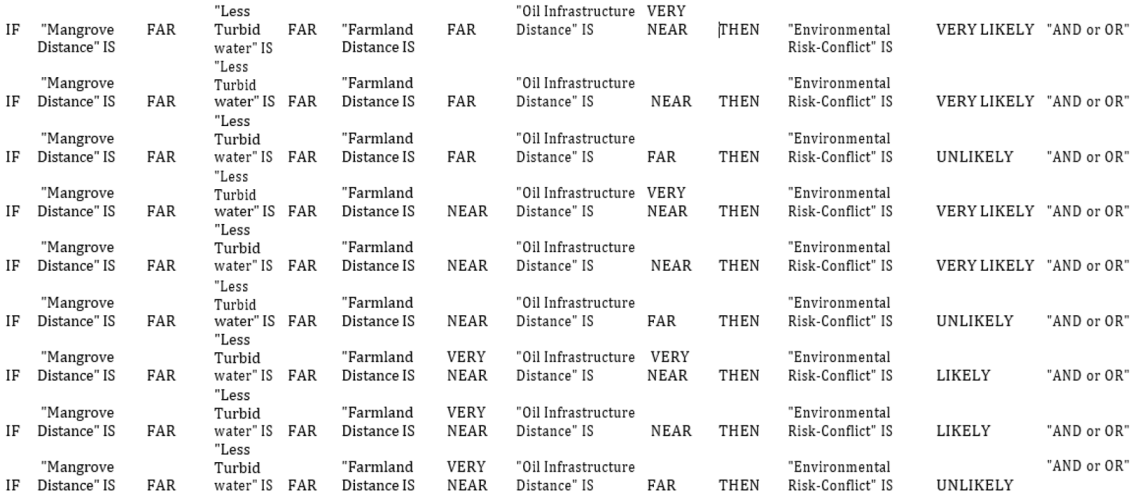
Appendix B.2. Sample IF THEN RULES: Socio-Economic Dimension
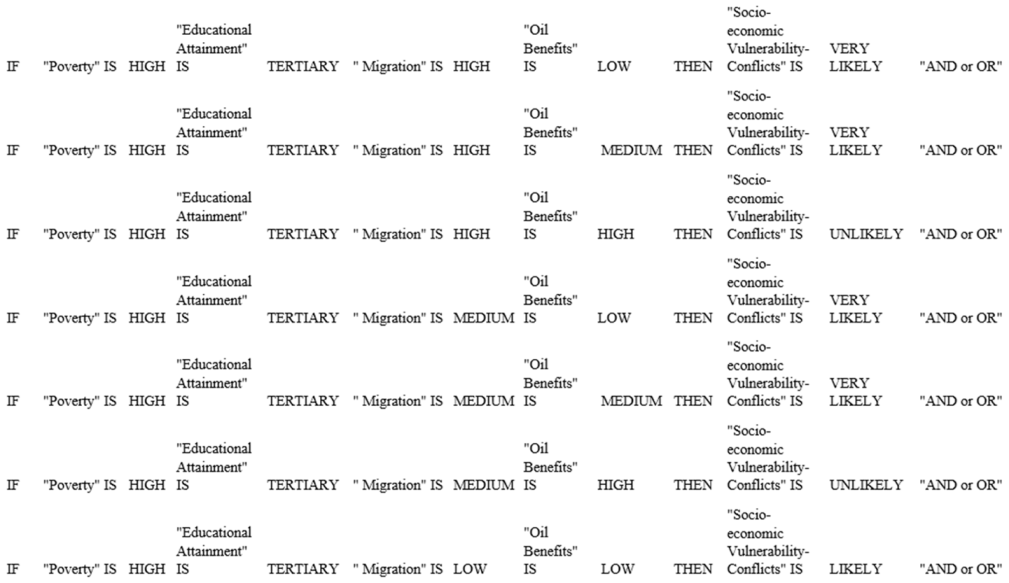
Appendix B.3. Sample IF THEN RULES: Political Dimension
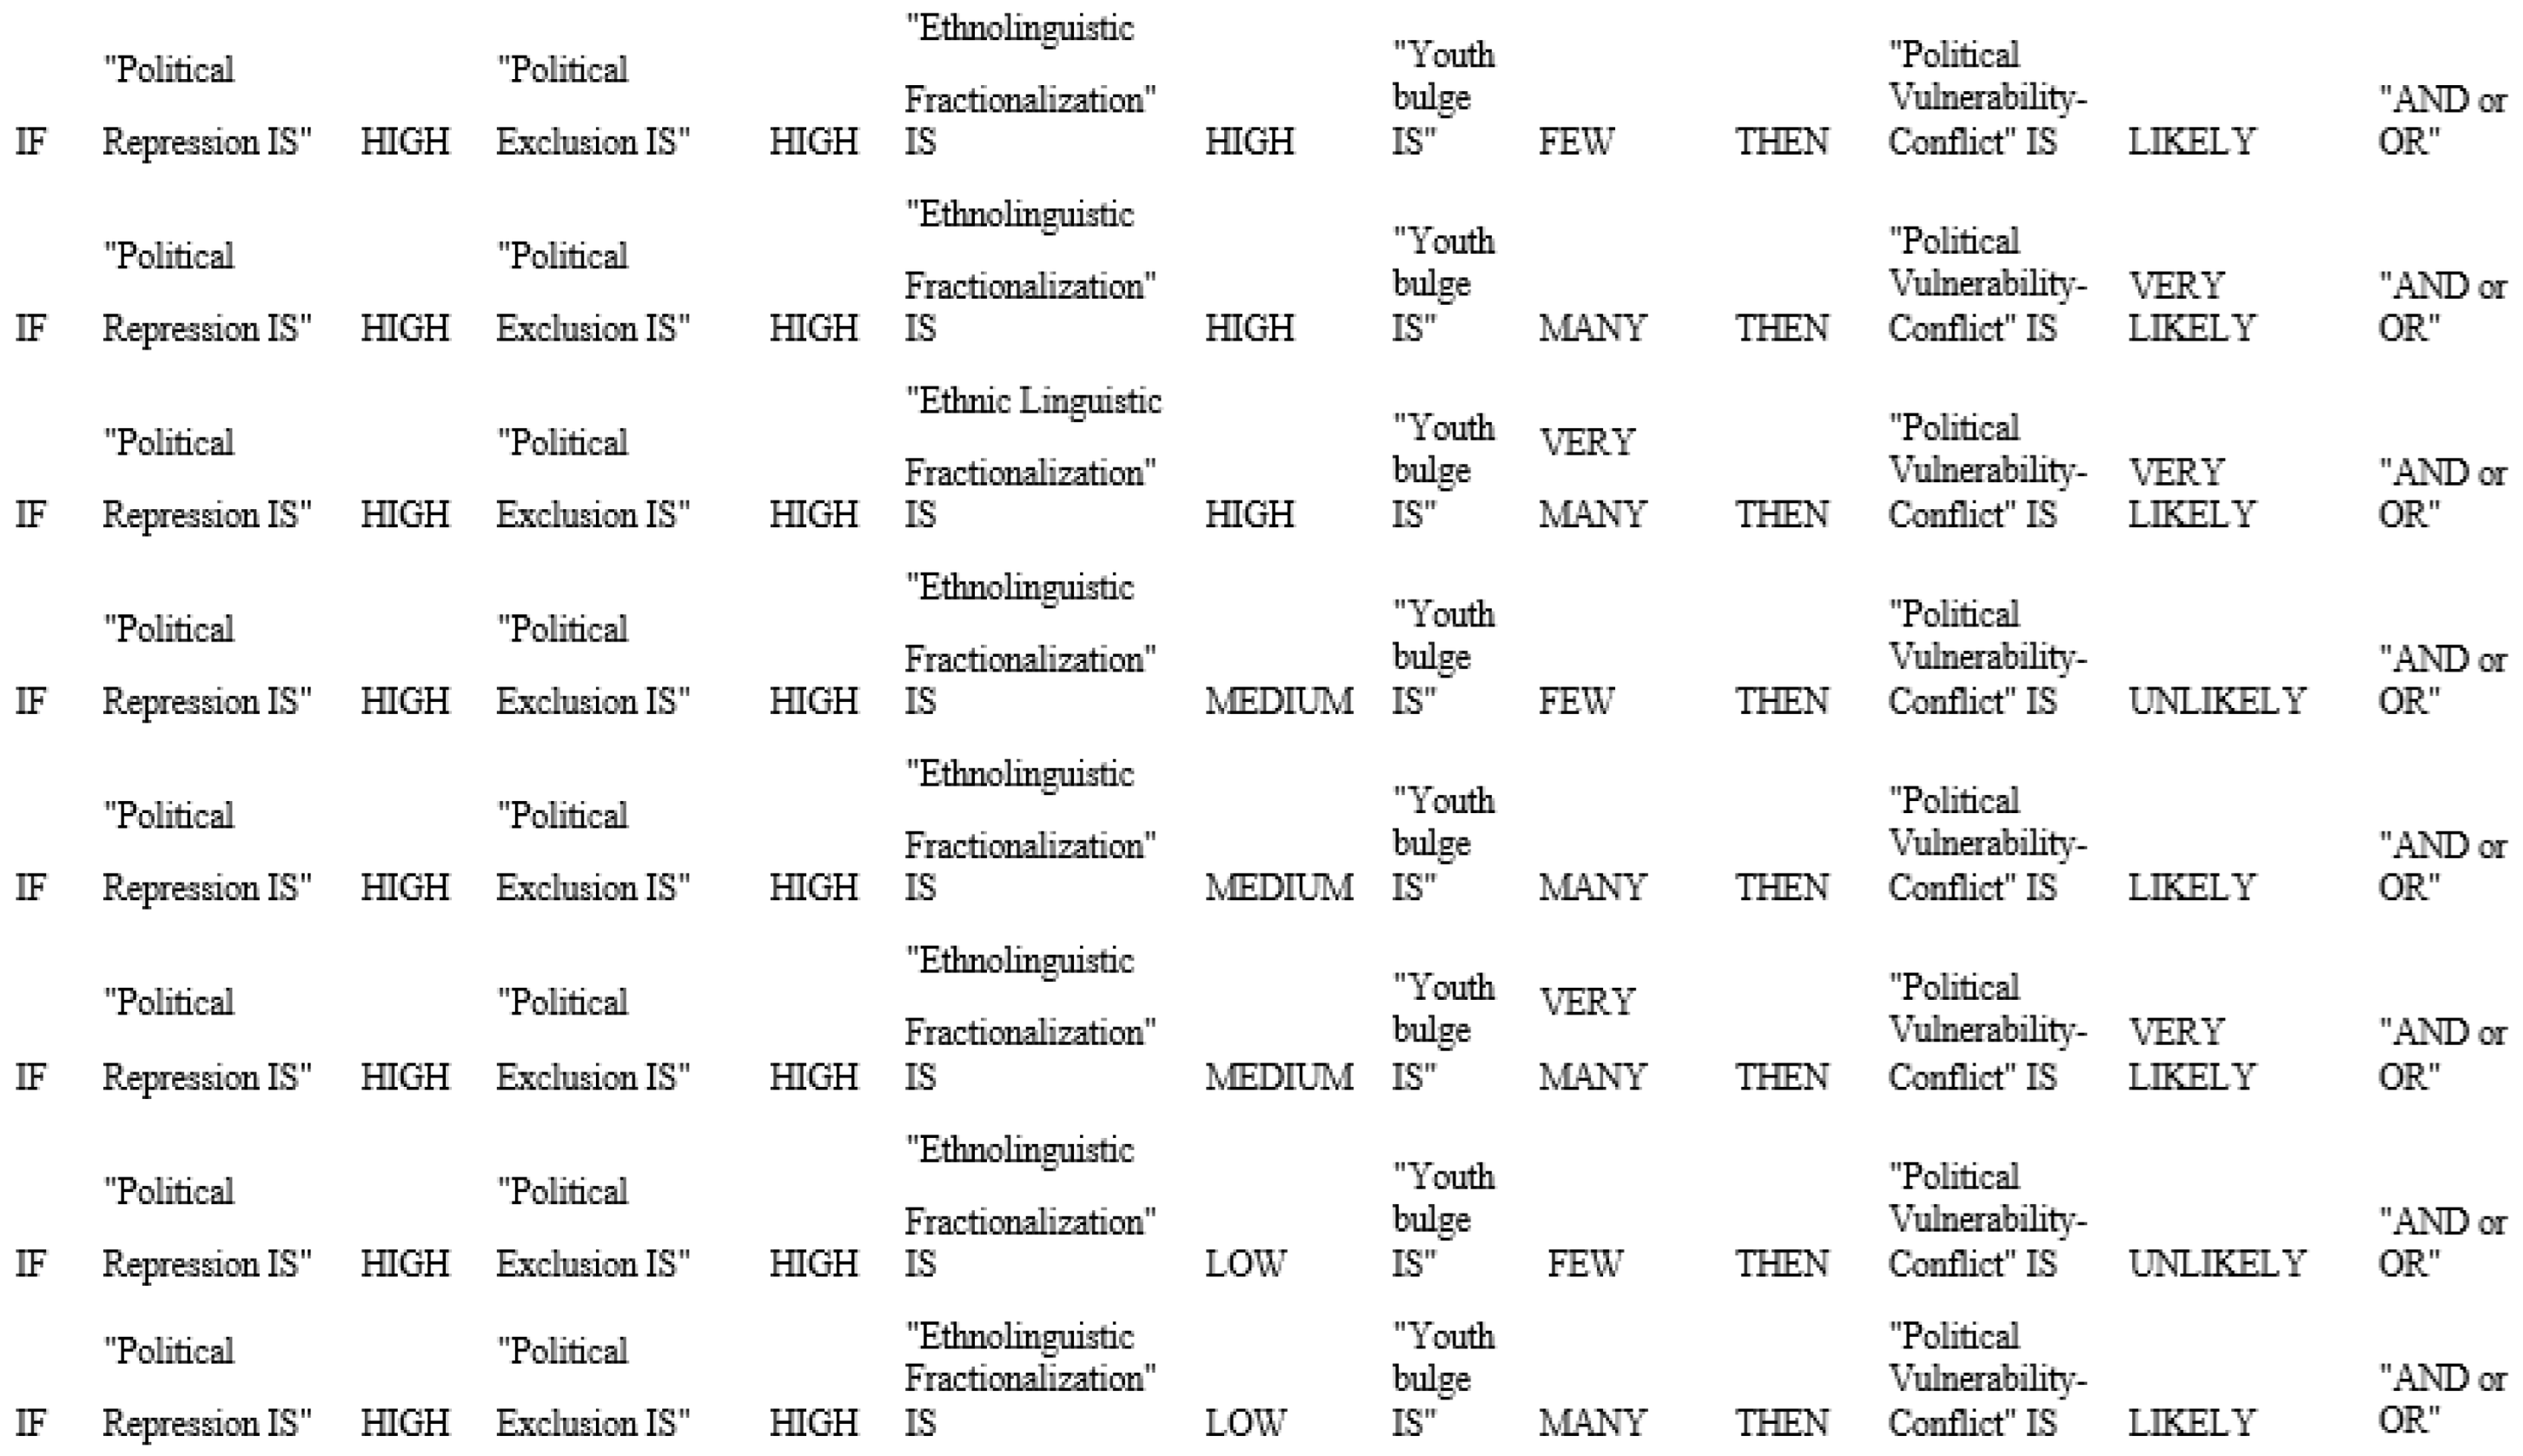
Appendix C
Appendix C.1. Fuzzy Maps of Environmental Drivers and Parameters of NRCs, 1986–2000
Appendix C.2. Fuzzy Maps of Socio-Economic Drivers and Parameters of NRCs, 1986–2000
Appendix C.3. Maps of Political Drivers and Parameters of NRCs, 1986–2000
Appendix D
Appendix D.1. Fuzzy Maps of Environmental Drivers and Parameters of NRCs, 2000–2016
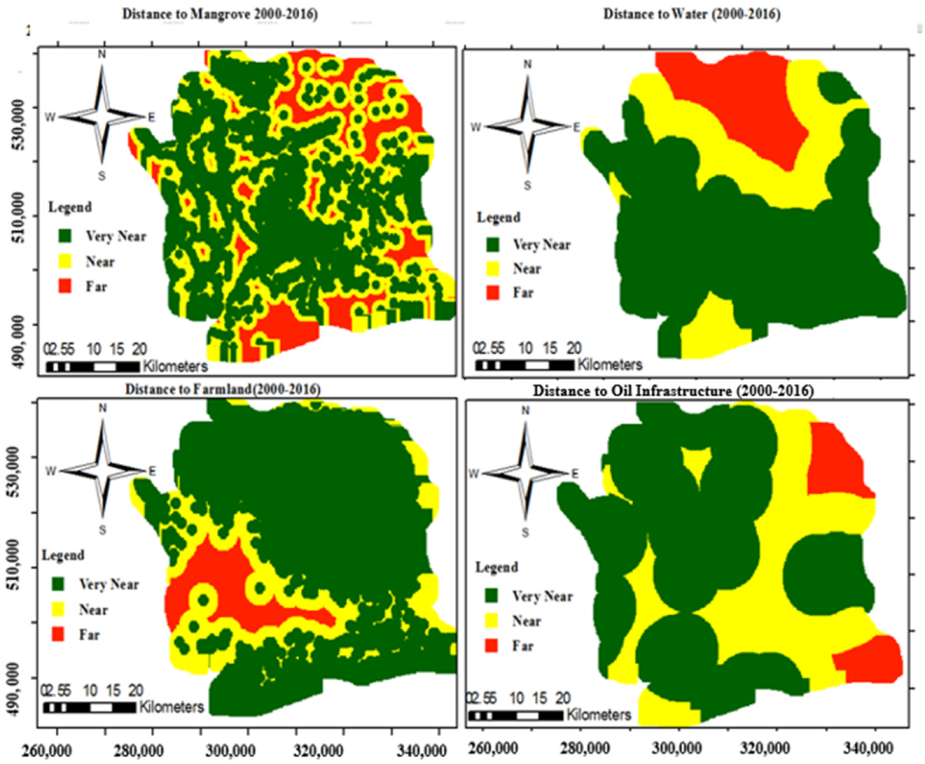
Appendix D.2. Maps of Socio-Economic Drivers and Parameters of NRCs, 2000–2016
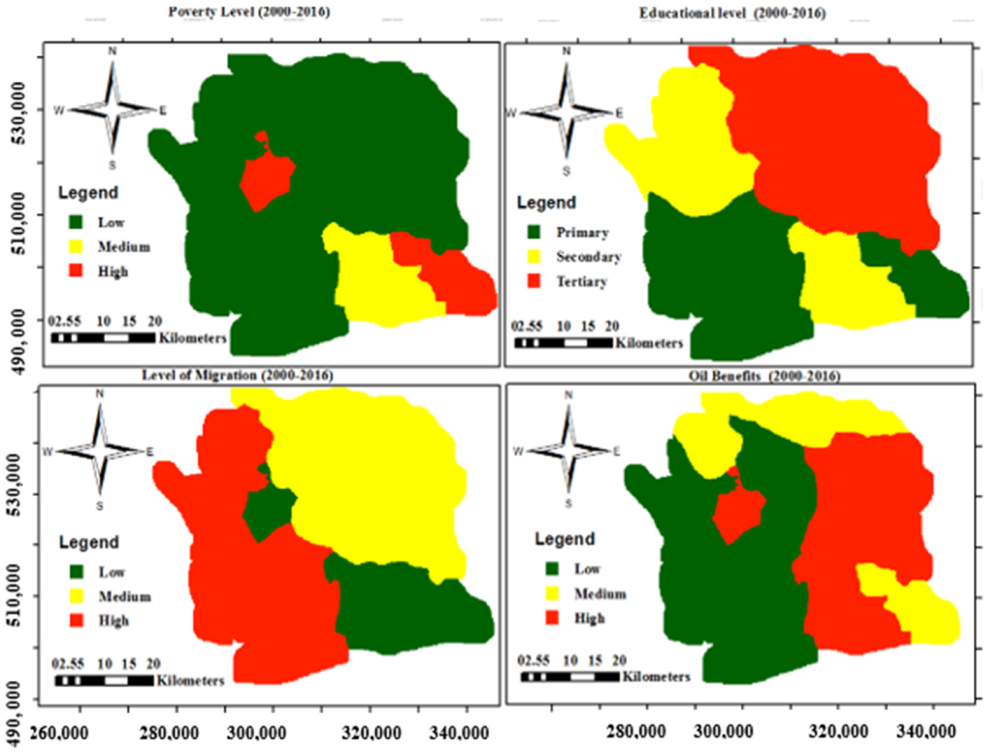
Appendix D.3. Maps of Political Drivers and Parameters of NRCs 2000–2016
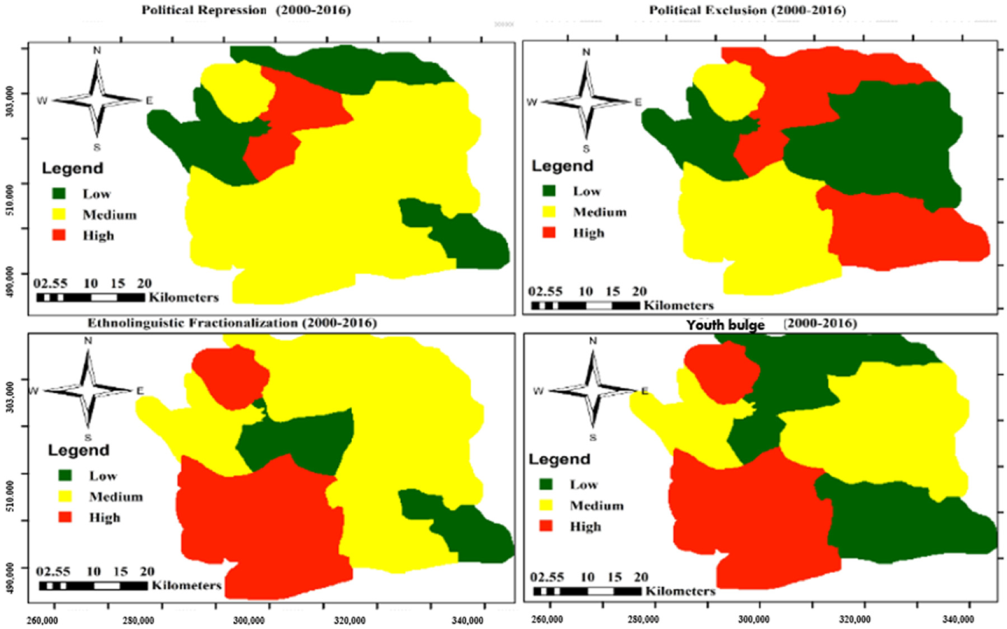
Appendix E
Appendix E.1. Spatial Conflict Clusters: SEFLAME-CM and SMCE-CM, 1986–2000
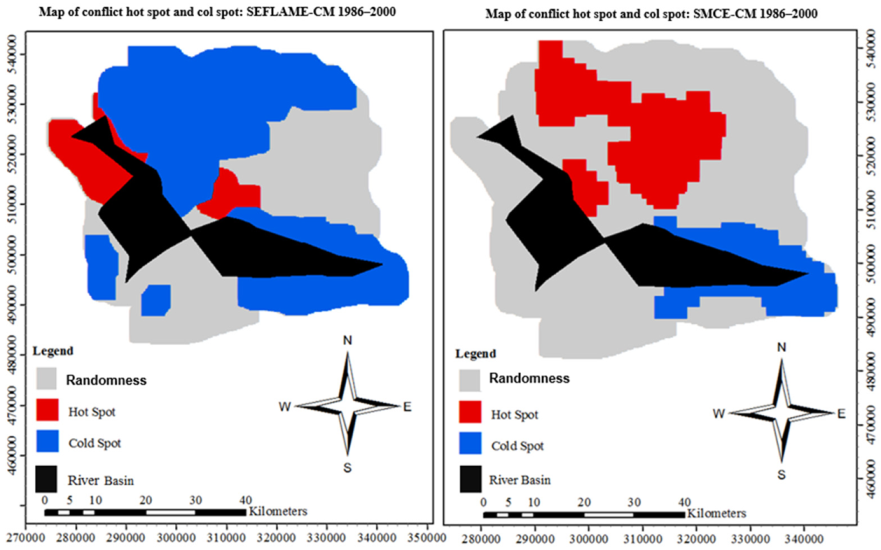
Appendix E.2. Spatial Conflict Clusters: SEFLAME-CM and SMCE-CM, 2000–2016
References
- UNEP. Toolkit and Guidance for Preventing and Managing Land and Natural Resources Conflict; UNEP: Nairobi, Kenya, 2012. [Google Scholar]
- UNEP. UNEP Post 2015 Note: Environmental Dmensions of Resilient and Peaceful Societies. 2015. Available online: https://wedocs.unep.org/handle/20.500.11822/9674?show=full (accessed on 21 September 2023).
- Hoeffler, A.; Collier, P.; Rohner, D. Beyond Greed and Grievance: Feasibility and Civil War. Oxf. Econ. Pap. 2009, 61, 1–27. [Google Scholar] [CrossRef]
- Collier, P.; Hoeffler, A. High-value natural resources, development, and conflict: Channels of causation. In High-Value Natural Resources and Peacebuilding; Routledge: London, UK, 2012. [Google Scholar]
- Collier, P.; Hoeffler, A. Greed and Grievance in Civil War. Oxf. Econ. Pap. 2004, 56, 563–595. [Google Scholar] [CrossRef]
- Collier, P.; Hoeffler, A. On Economic Causes of Civil Wars. Oxf. Econ. Pap. 1998, 50, 563–573. [Google Scholar] [CrossRef]
- Homer-Dixon, T.; Boutwell, J.; Rathjens, G. Environmental Change and Violent Conflict. Sci. Am. 2011, 268, 18–25. [Google Scholar] [CrossRef]
- Homer-Dixon, T.; Levy, M. Environment and Security. Int. Secur. 1995, 20, 189–198. [Google Scholar] [CrossRef]
- Ostrom, E.; Burger, J.; Field, C.B.; Norgaard, R.B.; Policansky, D. Revisiting the commons: Local lessons, global challenges. Am. Assoc. Adv. Sci. 1999, 284, 278–282. [Google Scholar] [CrossRef]
- Ibeh, L. A Transdisciplinary-Based Coupled Approach for Vulnerability Assessment in the Context of Natural Resource-Based Conflicts Using Remote Sensing, Spatial Statistics and Fuzzy Logic Adapted Models. Ph.D. Thesis, LMU, München, Germany, 2019. Available online: https://edoc.ub.uni-muenchen.de/24770/1/Ibeh_Lawrence.pdf (accessed on 1 January 2024).
- Fearon, J. Primary Commodity Exports and Civil War. J. Confl. Resolut. 2005, 49, 483–507. [Google Scholar] [CrossRef]
- Brauch, H. Building Sustainable Peace by Moving Towards Sustainability Transition. In Addressing Global Environmental Challenges from a Peace Ecology Perspective; Springer: Cham, Switzerland, 2016; Volume 4, pp. 145–179. [Google Scholar] [CrossRef]
- Brauch, H.; Spring, Ú.O.; Mesjasz, C.; Grin, J.; Kameri-Mbote, P.; Chourou, B.; Dunay, P.; Birkmann, J. Coping with Global Environmental Change, Disasters and Security: Threats, Challenges, Vulnerabilities and Risks; Springer Science & Business Media: Berlin/Heidelberg, Germany, 2011. [Google Scholar] [CrossRef]
- Brauch, H. Sustainable Peace in the Anthropocene: Towards Political Geoecology and Peace Ecology. In Handbook on Sustainability Transition and Sustainable Peace; Springer: Cham, Switzerland, 2016; Volume 10, pp. 187–236. [Google Scholar] [CrossRef]
- Buhaug, H.; Lujala, P. Measuring Geography in Quantitative Studies of Civil War. Polit. Geogr. 2005, 24, 399–418. [Google Scholar] [CrossRef]
- Bernauer, T.; Gleditsch, N. New Event Data in Conflict Research. Int. Interact. 2012, 38, 375–381. [Google Scholar] [CrossRef]
- Johansson, P. Nurturing Adaptive Peace: Resilience Thinking for Peacebuilders. In Proceedings of the Fifteenth Biennial Conference of the International Association for the Study of the Commons, Mumbai Region, India, 27 May 2015; pp. 2–15. Available online: https://dlc.dlib.indiana.edu/dlc/bitstream/handle/10535/9838/Johansson_Patrik_Adaptive_Peace_May15.pdf?sequence=1&isAllowed=y (accessed on 21 September 2023).
- Ratner, B.; Meinzen-Dick, R.; May, C.; Haglund, E. Resource Conflict, Collective Action, and Resilience: An Analytical Framework. Int. J. Commons 2013, 7. [Google Scholar] [CrossRef]
- Sivakumar, B. Water Crisis: From Conflict to Cooperation. An Overview. Hydrol. Sci. J. 2011, 56, 531–552. [Google Scholar] [CrossRef]
- Ekong, F.; Atser, J.; Ebong, S. Water Resource Management in the Niger Delta Region of Nigeria: The Role of Physical Planning. Int. Rev. Soc. Sci. Humanit. 2012, 3, 51–61. [Google Scholar]
- Gray, S.; Chan, A.; Clark, D.; Jordan, R. Modeling the integration of stakeholder knowledge in social–ecological decision-making: Benefits and limitations to knowledge diversity. Ecol. Model. 2011, 229, 88–96. [Google Scholar] [CrossRef]
- Okpara, U.; Stringer, L.; Dougill, A. Using a novel climate–water conflict vulnerability index to capture double exposures in Lake Chad. Reg. Environ. Chang. 2017, 17, 351–366. [Google Scholar] [CrossRef]
- Fountis, A.; Arunachalam, V. Creating A Sustainable Development Model for the Trading of Industrial Minerals. J. Contemp. Issues Bus. Gov. 2021, 27, 1557–1567. [Google Scholar] [CrossRef]
- Mauser, W.; Klepper, G.; Rice, M.; Schmalzbauer, B.S.; Hackmann, H.; Leemans, R.; Moore, H. Transdisciplinary global change research: The co-creation of knowledge for sustainability. Curr. Opin. Environ. Sustain. 2013, 5, 420–431. [Google Scholar] [CrossRef]
- Woodall, L.C.; Talma, S.; Steeds, O.; Stefanoudis, P.; Jeremie-Muzungaile, M.M.; De Comarmond, A. Co-development, co-production and co-dissemination of scientific research: A case study to demonstrate mutual benefits. Biol. Lett. 2021, 17, 20200699. [Google Scholar] [CrossRef]
- Rustad, S.; Binningsbø, H. A Price Worth Fighting For? Natural Resources and Conflict Recurrence. J. Peace Res. 2012, 49, 531–546. [Google Scholar] [CrossRef]
- Buhaug, H.; Gleditsch, K. Contagion or Confusion? Why Conflicts Cluster in Space. Int. Stud. Q. 2008, 52, 215–233. [Google Scholar] [CrossRef]
- Zadeh, L. From Computing with Numbers to Computing with Words—From Manipulation of Measurements to Manipulation of Perceptions. In Logic, Thought and Action; Springer: Dordrecht, The Netherlands, 2005; Volume 12, pp. 507–544. [Google Scholar] [CrossRef]
- Zadeh, L. A New Direction in AI: Toward a Computational Theory of Perceptions. AI Mag. 2001, 22, 628. [Google Scholar] [CrossRef]
- Agrawal, A.; Ostrom, E. Collective Action, Property Rights, and Decentralization in Resource Use in India and Nepal. Politics Soc. 2001, 29, 485–514. [Google Scholar] [CrossRef]
- Ostrom, E. A general framework for analyzing sustainability of social-ecological systems. Science (1979) 2009, 325, 419–422. [Google Scholar] [CrossRef] [PubMed]
- Kamran, M.; Ismail, R.; Al-Sabri, E.H.A.; Salamat, N.; Farman, M.; Ashraf, S. An Optimization Strategy for MADM Framework with Confidence Level Aggregation Operators under Probabilistic Neutrosophic Hesitant Fuzzy Rough Environment. Symmetry 2023, 15, 578. [Google Scholar] [CrossRef]
- Kamran, M.; Ashraf, S.; Naeem, M. A promising approach for decision modeling with single-valued neutrosophic probabilistic hesitant fuzzy dombi operators. Yugosl. J. Oper. Res. 2023, 33, 549–575. [Google Scholar] [CrossRef]
- Rodríguez-Pérez, Á.M.; Rodríguez, C.A.; Márquez-Rodríguez, A.; Mancera, J.J.C. Viability Analysis of Tidal Turbine Installation Using Fuzzy Logic: Case Study and Design Considerations. Axioms 2023, 12, 778. [Google Scholar] [CrossRef]
- Kambalimath, S.; Deka, P.C. Applications of Fuzzy Logics in Modern Systems: A Simple Survey. Int. J. Res. Publ. Rev. 2024, 5, 7598–7600. [Google Scholar] [CrossRef]
- Pérez, Á.M.R.; Rodríguez, C.A.; Rodríguez, L.O.; Mancera, J.J.C. Revitalizing the Canal de Castilla: A Community Approach to Sustainable Hydropower Assessed through Fuzzy Logic. Appl. Sci. 2024, 14, 1828. [Google Scholar] [CrossRef]
- Kamran, M.; Ashraf, S.; Salamat, N.; Naeem, M.; Hameed, M.S. Smart city design plan selection through single-valued neutrosophic probabilistic hesitant fuzzy rough aggregation information. J. Intell. Fuzzy Syst. 2023, 45, 10693–10737. [Google Scholar] [CrossRef]
- Niswati, Z.; Mustika, F.A.; Paramita, A. Fuzzy logic implementation for diagnosis of Diabetes Mellitus disease at Puskesmas in East Jakarta. J. Phys. Conf. Ser. 2018, 1114, 012107. [Google Scholar] [CrossRef]
- Minli, Z.; Wenpo, Y. Fuzzy Comprehensive Evaluation Method Applied in the Real Estate Investment Risks Research. Phys. Procedia 2012, 24, 1815–1821. [Google Scholar] [CrossRef]
- Yao, Y. Three-way conflict analysis: Reformulations and extensions of the Pawlak model. Knowl. Based Syst. 2019, 180, 26–37. [Google Scholar] [CrossRef]
- Zhi, H.; Li, J.; Li, Y. Multilevel Conflict Analysis Based on Fuzzy Formal Contexts. IEEE Trans. Fuzzy Syst. 2022, 30, 5128–5142. [Google Scholar] [CrossRef]
- Zhao, J.; Wan, R.; Miao, D. Conflict Analysis Triggered by Three-Way Decision and Pythagorean Fuzzy Rough Set. Int. J. Comput. Intell. Syst. 2024, 17, 1–25. [Google Scholar] [CrossRef]
- Du, J.; Liu, S.; Liu, Y.; Yi, J. A novel approach to three-way conflict analysis and resolution with Pythagorean fuzzy information. Inf. Sci. 2022, 584, 65–88. [Google Scholar] [CrossRef]
- Pawlak, Z. Some remarks on conflict analysis. Eur. J. Oper. Res. 2005, 166, 649–654. [Google Scholar] [CrossRef]
- Schellens, M.K.; Belyazid, S. Revisiting the contested role of natural resources in violent conflict risk through machine learning. Sustainability 2020, 12, 6574. [Google Scholar] [CrossRef]
- Cimino, A.; Cimino, A.; Oieni, A. Fuzzy Logic Implementation of Vulnerability Assessment in a Coastal Aquifer of Northern Sicily. J. Geosci. Environ. Prot. 2021, 9, 177–188. [Google Scholar] [CrossRef]
- Liu, Z. Article citation contribution indicator: Application in energy and environment. Ecofem. Clim. Chang. 2022, 3, 81–84. [Google Scholar] [CrossRef]
- Kienberger, S.; Blaschke, T.; Zaidi, R.Z. A framework for spatio-temporal scales and concepts from different disciplines: The ‘vulnerability cube’. Nat. Hazards 2013, 68, 1343–1369. [Google Scholar] [CrossRef]
- Kamran, M.; Abdalla, M.E.M.; Nadeem, M.; Uzair, A.; Farman, M.; Ragoub, L.; Cangul, I.N. A Systematic Formulation into Neutrosophic Z Methodologies for Symmetrical and Asymmetrical Transportation Problem Challenges. Symmetry 2024, 16, 615. [Google Scholar] [CrossRef]
- Liu, Z.; Ge, B.; Huang, Y.; Hou, Z.; Wei, W.; Xie, H. Fuzzy-based dilemma assessment in confrontation analysis with applications to the Walkerton Drinking Water Crisis. Appl. Soft Comput. 2024, 162, 111793. [Google Scholar] [CrossRef]
- Zhang, W.; Li, B.; Liu, Z.; Zhang, B. Application of improved fuzzy comprehensive evaluation method in karst groundwater quality evaluation: A case study of Cengong county. Earth Sci. Inf. 2021, 14, 1101–1109. [Google Scholar] [CrossRef]
- Liu, J.; Liu, W.; Allechy, F.B.; Zheng, Z.; Liu, R.; Kouadio, K.L. Machine learning-based techniques for land subsidence simulation in an urban area. J. Environ. Manag. 2024, 352, 120078. [Google Scholar] [CrossRef] [PubMed]
- Gencer, K.; Başçiftçi, F. The fuzzy common vulnerability scoring system (F-CVSS) based on a least squares approach with fuzzy logistic regression. Egypt. Inform. J. 2021, 22, 145–153. [Google Scholar] [CrossRef]
- Ncube, M.M.; Ngulube, P. Enhancing environmental decision-making: A systematic review of data analytics applications in monitoring and management. Discov. Sustain. 2024, 5, 290. [Google Scholar] [CrossRef]
- Obiedat, M.; Samarasinghe, S. Modelling Socio-ecological Systems: Implementation of an Advanced Fuzzy Cognitive Map Framework for Policy development for addressing complex real-life challenges. arXiv 2022, arXiv:2208.05103. [Google Scholar]
- Hauge, W.I.; Ellingsen, T. Causal Pathways to Conflict. 2018. Available online: https://api.semanticscholar.org/CorpusID:158790657 (accessed on 12 December 2022).
- Tollefsen, A.F.; Buhaug, H. Insurgency and inaccessibility. Int. Stud. Rev. 2015, 17, 6–25. [Google Scholar] [CrossRef]
- Kalbhenn, A. Democracy, International Interlinkages and Cooperation over Shared Resources. Ph.D. Thesis, ETH, Zurich, Switzerland, 2010. [Google Scholar] [CrossRef]
- Lujala, P.; Rød, J.K.; Thieme, N. Fighting Over Oil: Introducing a New Dataset. Confl. Manag. Peace Sci. 2007, 24, 239–256. [Google Scholar] [CrossRef]
- Buhaug, H.; Rød, J.K. Local determinants of African civil wars, 1970–2001. Polit Geogr. 2006, 25, 315–335. [Google Scholar] [CrossRef]
- Hegre, H.; Østby, G.; Raleigh, C. Poverty and Civil War Events: A Disaggregated Study of Liberia. J. Confl. Resolut. 2009, 53, 598–623. [Google Scholar] [CrossRef]
- Barakat, B.; Urdal, H. Breaking the Waves? Does Education Mediate the Relationship Between Youth Bulges and Political Violence? 2009. Available online: https://documents.worldbank.org/en/publication/documents-reports/documentdetail/403881468165872383/breaking-the-waves-does-education-mediate-the-relationship-between-youth-bulges-and-political-violence (accessed on 23 February 2025).
- Ezra, M.; Kiros, G.E. Rural out-migration in the drought prone areas of Ethiopia: A multilevel analysis. The International migration review. Int. Migr. Rev. 2011, 35, 749–771. [Google Scholar] [CrossRef] [PubMed]
- Idemudia, U. Assessing corporate–community involvement strategies in the Nigerian oil industry: An empirical analysis. Resour. Policy 2009, 34, 133–141. [Google Scholar] [CrossRef]
- Idemudia, U. Corporate Social Responsibility and Development in Africa: Issues and Possibilities. Geogr. Compass 2014, 8, 421–435. [Google Scholar] [CrossRef]
- García-Ponce, O.; Pasquale, B. How Political Repression Shapes Attitudes Toward the State: Evidence from Zimbabwe. 2015. Available online: https://api.semanticscholar.org/CorpusID:201686121 (accessed on 1 January 2024).
- Rustad, S.C.A.; Buhaug, H.; Falch, Å.; Gates, S. All Conflict is Local: Modeling Sub-National Variation in Civil Conflict Risk. Confl. Manag. Peace Sci. 2011, 28, 15–40. [Google Scholar] [CrossRef]
- Asal, V.; Findley, M.; Piazza, J.A.; Walsh, J.I. Political Exclusion, Oil, and Ethnic Armed Conflict. J. Confl. Resolut. 2015, 60, 1343–1367. [Google Scholar] [CrossRef]
- Cederman, L.-E.; Girardin, L.U.C. Beyond Fractionalization: Mapping Ethnicity onto Nationalist Insurgencies. Am. Political Sci. Rev. 2007, 101, 173–185. [Google Scholar] [CrossRef]
- Pruitt, L.J. Rethinking youth bulge theory in policy and scholarship: Incorporating critical gender analysis. Int. Aff. 2020, 96, 711–728. [Google Scholar] [CrossRef]
- Oyefusi, A. Oil, Youths, and Civil Unrest in Nigeria’s Delta: The Role of Schooling, Educational Attainments, Earnings, and Unemployment. Confl. Manag. Peace Sci. 2010, 27, 326–346. [Google Scholar] [CrossRef]
- Oyefusi, A. Oil and the Probability of Rebel Participation Among Youths in the Niger Delta of Nigeria. J. Peace Res. 2008, 45, 539–555. [Google Scholar] [CrossRef]
- Raleigh, C.; Linke, R.; Hegre, H.; Karlsen, J. Introducing ACLED: An Armed Conflict Location and Event Dataset. J. Peace Res. 2010, 47, 651–660. [Google Scholar] [CrossRef]
- Anderson, J.R.; Hardy, E.E.; Roach, J.T.; Witmer, R.E. A Land Use and Land Cover Classification System for Use with Remote Sensor Data; US Government Printing Office: Washington, DC, USA, 1976. [CrossRef]
- Mengistu, D.A.; Salami, A.T. Application of remote sensing and GIS inland use/land cover mapping and change detection in a part of south western Nigeria. Afr. J. Environ. Sci. Technol. 2007, 1, 99–109. [Google Scholar]
- Aldwaik, S.Z.; Pontius, R.G. Intensity analysis to unify measurements of size and stationarity of land changes by interval, category, and transition. Landsc. Urban Plan. 2012, 106, 103–114. [Google Scholar] [CrossRef]
- Brennan, J.; Martin, E. Spatial proximity is more than just a distance measure. Int. J. Hum.-Comput. Stud. 2012, 70, 88–106. [Google Scholar] [CrossRef]
- Lujala, P. The spoils of nature: Armed civil conflict and rebel access to natural resources. J. Peace Res. 2010, 47, 15–28. [Google Scholar] [CrossRef]
- Sicat, R.; Carranza, E.J.; Nidumolu, U. Fuzzy modeling of farmers’ knowledge for land suitability classification. Agric. Syst. 2005, 83, 49–75. [Google Scholar] [CrossRef]
- MATLAB®. User’s Guide Fuzzy Logic Toolbox Computation Programming Visualization, Hill Drive Natick, MA 01760-2098. 2015. Available online: http://www.mathworks.com (accessed on 23 February 2025).
- Cordón, O.; Herrera, F.; Hoffmann, F.; Magdalena, L. Genetic Fuzzy Systems. In Advances in Fuzzy Systems—Applications and Theory; World Scientific: Singapore, 2001; Volume 9. [Google Scholar] [CrossRef]
- d’Acierno, A.; Esposito, M.; De Pietro, G. An extensible six-step methodology to automatically generate fuzzy DSSs for diagnostic applications. BMC Bioinform. 2013, 14 (Suppl. S1), S4. [Google Scholar] [CrossRef]
- Hellendoorn, H.; Thomas, C. On Quality Defuzzification. In Fuzzy Logic and Its Applications to Engineering, Information Sciences, and Intelligent Systems; Springer Science & Business Media: Berlin/Heidelberg, Germany, 1995; pp. 167–176. [Google Scholar] [CrossRef]
- Acosta-Michlik, L.A.; Kumar, K.S.K.; Klein, R.J.T.; Campe, S. Application of fuzzy models to assess susceptibility to droughts from a socio-economic perspective. Reg. Environ. Chang. 2008, 8, 151–160. [Google Scholar] [CrossRef]
- Ross, T. Fuzzy Logic with Engineering Applications. In Fuzzy Logic with Engineering Applications, 3rd ed.; John Wiley & Sons: Chichester, UK, 2016. [Google Scholar] [CrossRef]
- Ross, T.J. Fuzzy Logic with Engineering Applications; John Wiley: Chichester, UK, 2010. [Google Scholar]
- Pappis, C.P.; Siettos, C. Fuzzy reasoning. In Search Methodologies—Introductory Tutorials in Optimization and Decision Support Techniques; Burke, E.K., Kendall, G., Eds.; Springer: Cham, Switzerland, 2014; pp. 519–556. [Google Scholar] [CrossRef]
- Fritzsch, J. A Composite Fuzzy Indicator for Assessing Farm Household Potential for Non-farm Income Diversification. In Proceedings of the 2011 International Congress, Zurich, Switzerland, 30 August–2 September 2011. [Google Scholar]
- Sivanandam, S.N.; Sumathi, S.; Deepa, S.N. Introduction to Fuzzy Logic Using MATLAB; Springer: Cham, Switzerland, 2007. [Google Scholar]
- Ikelegbe, A.; Umukoro, N. Exclusion and Peacebuilding in the Niger Delta of Nigeria: An Assessment of the Presidential Amnesty Programme. J. Peacebuild. Dev. 2016, 11, 25–36. [Google Scholar] [CrossRef]
- Agbonifo, J. Niger Delta conflicts: Place and contentious mobilization. Interface A J. About Soc. Mov. 2011, 3, 240–265. [Google Scholar]
- Slovic, P. The Perception of Risk; Praeger: Westport, CT, USA, 2016. [Google Scholar] [CrossRef]
- ITC, ILWIS 3.0 for Windows the Integrated Land and Water Information System User’s Guide. 2005. Available online: http://www.itc.nl/ilwis/ (accessed on 23 February 2025).
- Lemenkova, P.; Kumpula, T. ILWIS GIS for Monitoring Landscapes in Tundra Ecosystems: Yamal Peninsula, Russia, 2012. Available online: https://hal.science/cel-01973028/file/Lemenkova_etal_Present_Yamal2012.pdf (accessed on 23 February 2025).
- Lemenkova, P. Modelling Landscape Changes and Detecting Land Cover Types by Means of the Remote Sensing Data and ILWIS GIS. In Proceedings of the 3rd International Conference. Information Technologies. Problems and Solutions, Ufa, Russia, 20 May 2015. [Google Scholar] [CrossRef]
- Lemenkova, P. Innovations in the Geoscience Research: Classification of the Landsat TM Image Using ILWIS GIS for Geographic Studies. In Proceedings of the 8th International Conference Prospects for the Higher School Development Grodno State Agrarian University (GGAU), Grodno, Belarus, 28–29 May 2015. [Google Scholar] [CrossRef]
- Anselin, L. The future of spatial analysis in the social sciences. Geogr. Inf. Sci. 1999, 5, 67–76. [Google Scholar] [CrossRef]
- Anselin, L. Spatial Models in Econometric Research. In Oxford Research Encyclopedia of Economics and Finance; Location Analysis View Project A Spatial Perspective on the Econometrics of Health Program Evaluation View Project; Oxford University Press: Oxford, UK, 2021. [Google Scholar] [CrossRef]
- Goodchild, M.; Anselin, L.; Appelbaum, R.; Harthorn, B. Toward Spatially Integrated Social Science. Int. Reg. Sci. Rev. 2000, 23, 139–159. [Google Scholar] [CrossRef]
- Buhaug, H.; Gates, S.; Lujala, P. Geography, Rebel Capability, and the Duration of Civil Conflict. J. Confl. Resolut. 2009, 53, 544–569. [Google Scholar] [CrossRef]
- Korf, B. Resources, violence and the telluric geographies of small wars. Prog. Hum. Geogr. 2011, 35, 733–756. [Google Scholar] [CrossRef]
- Voss, P.; Long, D.; Hammer, R.; Friedman, S. County Child Poverty Rates in the US: A Spatial Regression Approach. Popul. Res. Policy Rev. 2006, 25, 369–391. [Google Scholar] [CrossRef]
- Rupasingha, A.; Goetz, S. Social and political forces as determinants of poverty: A spatial analysis. J. Socio-Econ. 2007, 36, 650–671. [Google Scholar] [CrossRef]
- Hua, Y.; Cui, B.; He, W.; Cai, Y. Identifying potential restoration areas of freshwater wetlands in a river delta. Ecol. Indic. 2016, 71, 438–448. [Google Scholar] [CrossRef]
- Moghadam, S.T.; Delmastro, C.; Lombardi, P.; Corgnati, S.P. Towards a New Integrated Spatial Decision Support System in Urban Context. Procedia Soc. Behav. Sci. 2016, 223, 974–981. [Google Scholar] [CrossRef][Green Version]
- Ferretti, V.; Montibeller, G. Key challenges and meta-choices in designing and applying multi-criteria spatial decision support systems Article (Accepted version) (Refereed). Decis. Support Syst. 2016, 84, 41–52. [Google Scholar] [CrossRef]
- Cui, E.H.; Zhang, Z.; Chen, C.J.; Wong, W.K. Applications of nature-inspired metaheuristic algorithms for tackling optimization problems across disciplines. Sci. Rep. 2024, 14, 9403. [Google Scholar] [CrossRef]
- Cuevas, E.; Diaz, P.; Camarena, O. A Metaheuristic Methodology Based on Fuzzy Logic Principles. In Metaheuristic Computation: A Performance Perspective; Cuevas, E., Diaz, P., Camarena, O., Eds.; Springer International Publishing: Cham, Switzerland, 2021; pp. 39–89. [Google Scholar] [CrossRef]
- Díaz-Cortés, M.A.; Cuevas, E.; Gálvez, J.; Camarena, O. A new metaheuristic optimization methodology based on fuzzy logic. Appl. Soft Comput. J. 2017, 61, 549–569. [Google Scholar] [CrossRef]
- Bennett, M.M.; Chen, J.K.; León, L.F.A.; Gleason, C.J. The politics of pixels: A review and agenda for critical remote sensing. Prog. Hum. Geogr. 2022, 46, 729–752. [Google Scholar] [CrossRef]
- Grekousis, G. Spatial Autocorrelation. In Spatial Analysis Methods and Practice: Describe—Explore—Explain Through GIS; Grekousis, G., Ed.; Cambridge University Press: Cambridge, UK, 2020; pp. 207–274. [Google Scholar] [CrossRef]
- Fritz, C.E.; Schuurman, N.; Robertson, C.; Lear, S. A scoping review of spatial cluster analysis techniques for point-event data. Geospat. Health 2013, 7, 183–198. [Google Scholar] [CrossRef] [PubMed]
- Le Gallo, J.; Ertur, C. Exploratory spatial data analysis of the distribution of regional per capita GDP in Europe, 1980–1995. Pap. Reg. Sci. 2003, 82, 175–201. [Google Scholar] [CrossRef]
- Peng, Y.; Zhao, Y.; Hu, J. On the Role of Community Structure in Evolution of Opinion Formation: A New Bounded Confidence Opinion Dynamics. Inf. Sci. 2023, 621, 672–690. [Google Scholar] [CrossRef]
- Li, T.; Xin, S.; Xi, Y.; Tarkoma, S.; Hui, P.; Li, Y. Predicting Multi-level Socioeconomic Indicators from Structural Urban Imagery. In Proceedings of the International Conference on Information and Knowledge Management, Proceedings, Association for Computing Machinery, Atlanta, GA, USA, 17–21 October 2022; pp. 3282–3291. [Google Scholar] [CrossRef]
Disclaimer/Publisher’s Note: The statements, opinions and data contained in all publications are solely those of the individual author(s) and contributor(s) and not of MDPI and/or the editor(s). MDPI and/or the editor(s) disclaim responsibility for any injury to people or property resulting from any ideas, methods, instructions or products referred to in the content. |
© 2025 by the authors. Licensee MDPI, Basel, Switzerland. This article is an open access article distributed under the terms and conditions of the Creative Commons Attribution (CC BY) license (https://creativecommons.org/licenses/by/4.0/).

