
Research on the Effect and Path of CBAM on Green Technology Innovation in China’s High-Carbon Manufacturing Industries


Abstract
:1. Introduction
2. Literature Review and Research Hypotheses
2.1. Carbon Tariffs and Green Technology Innovation
2.2. Carbon Tariffs and Public Environmental Concerns
2.3. Carbon Tariffs and Government Fiscal Expenditures
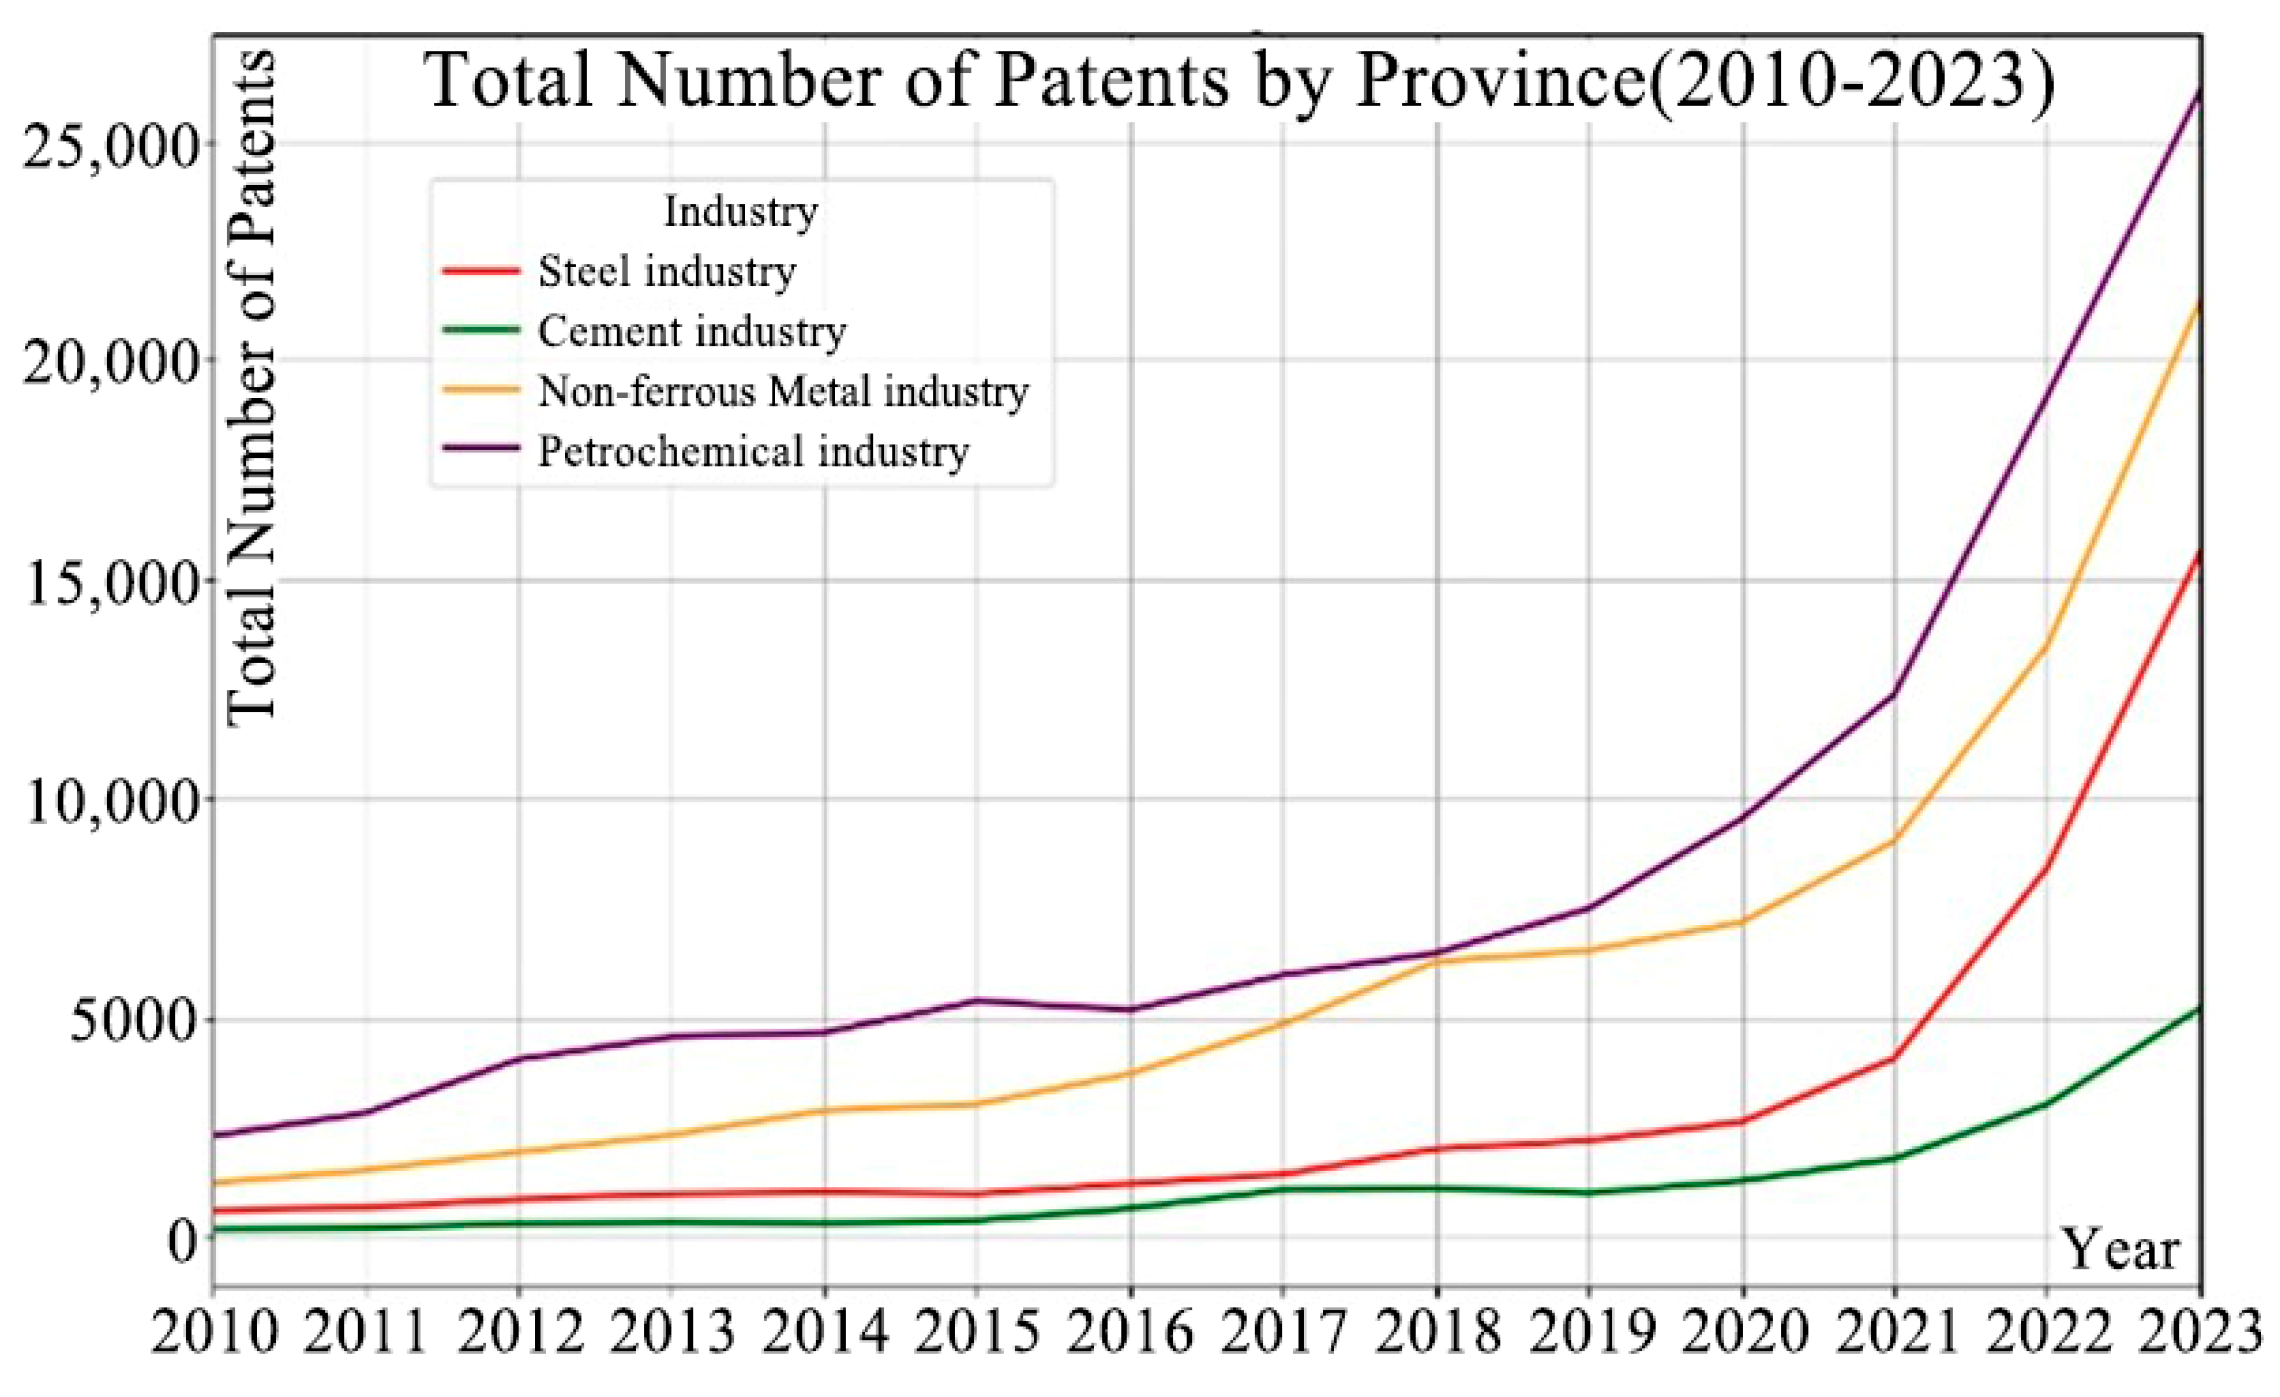
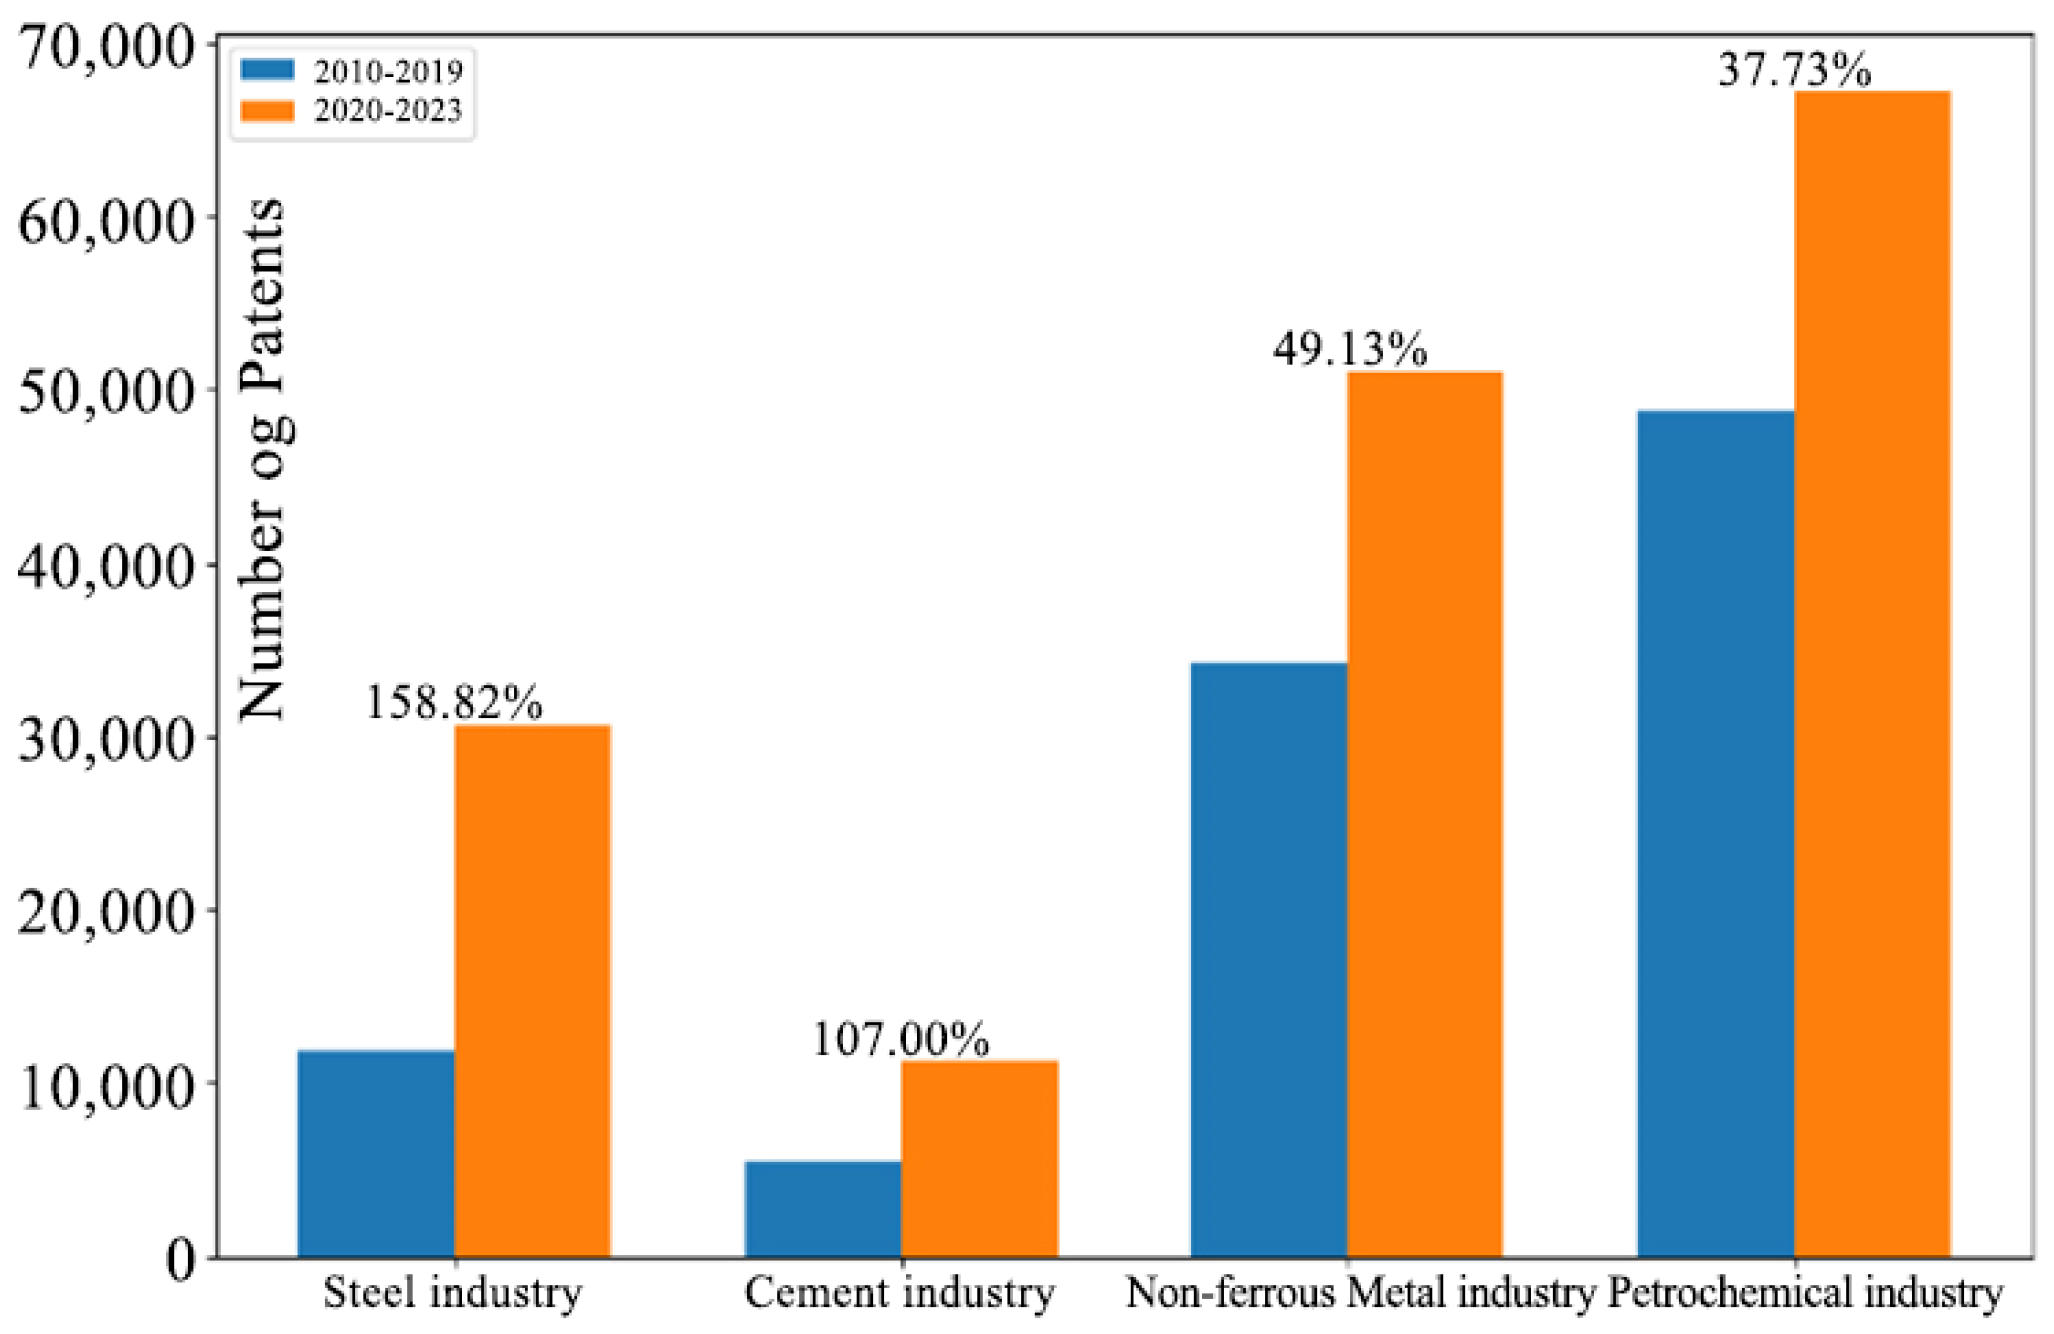
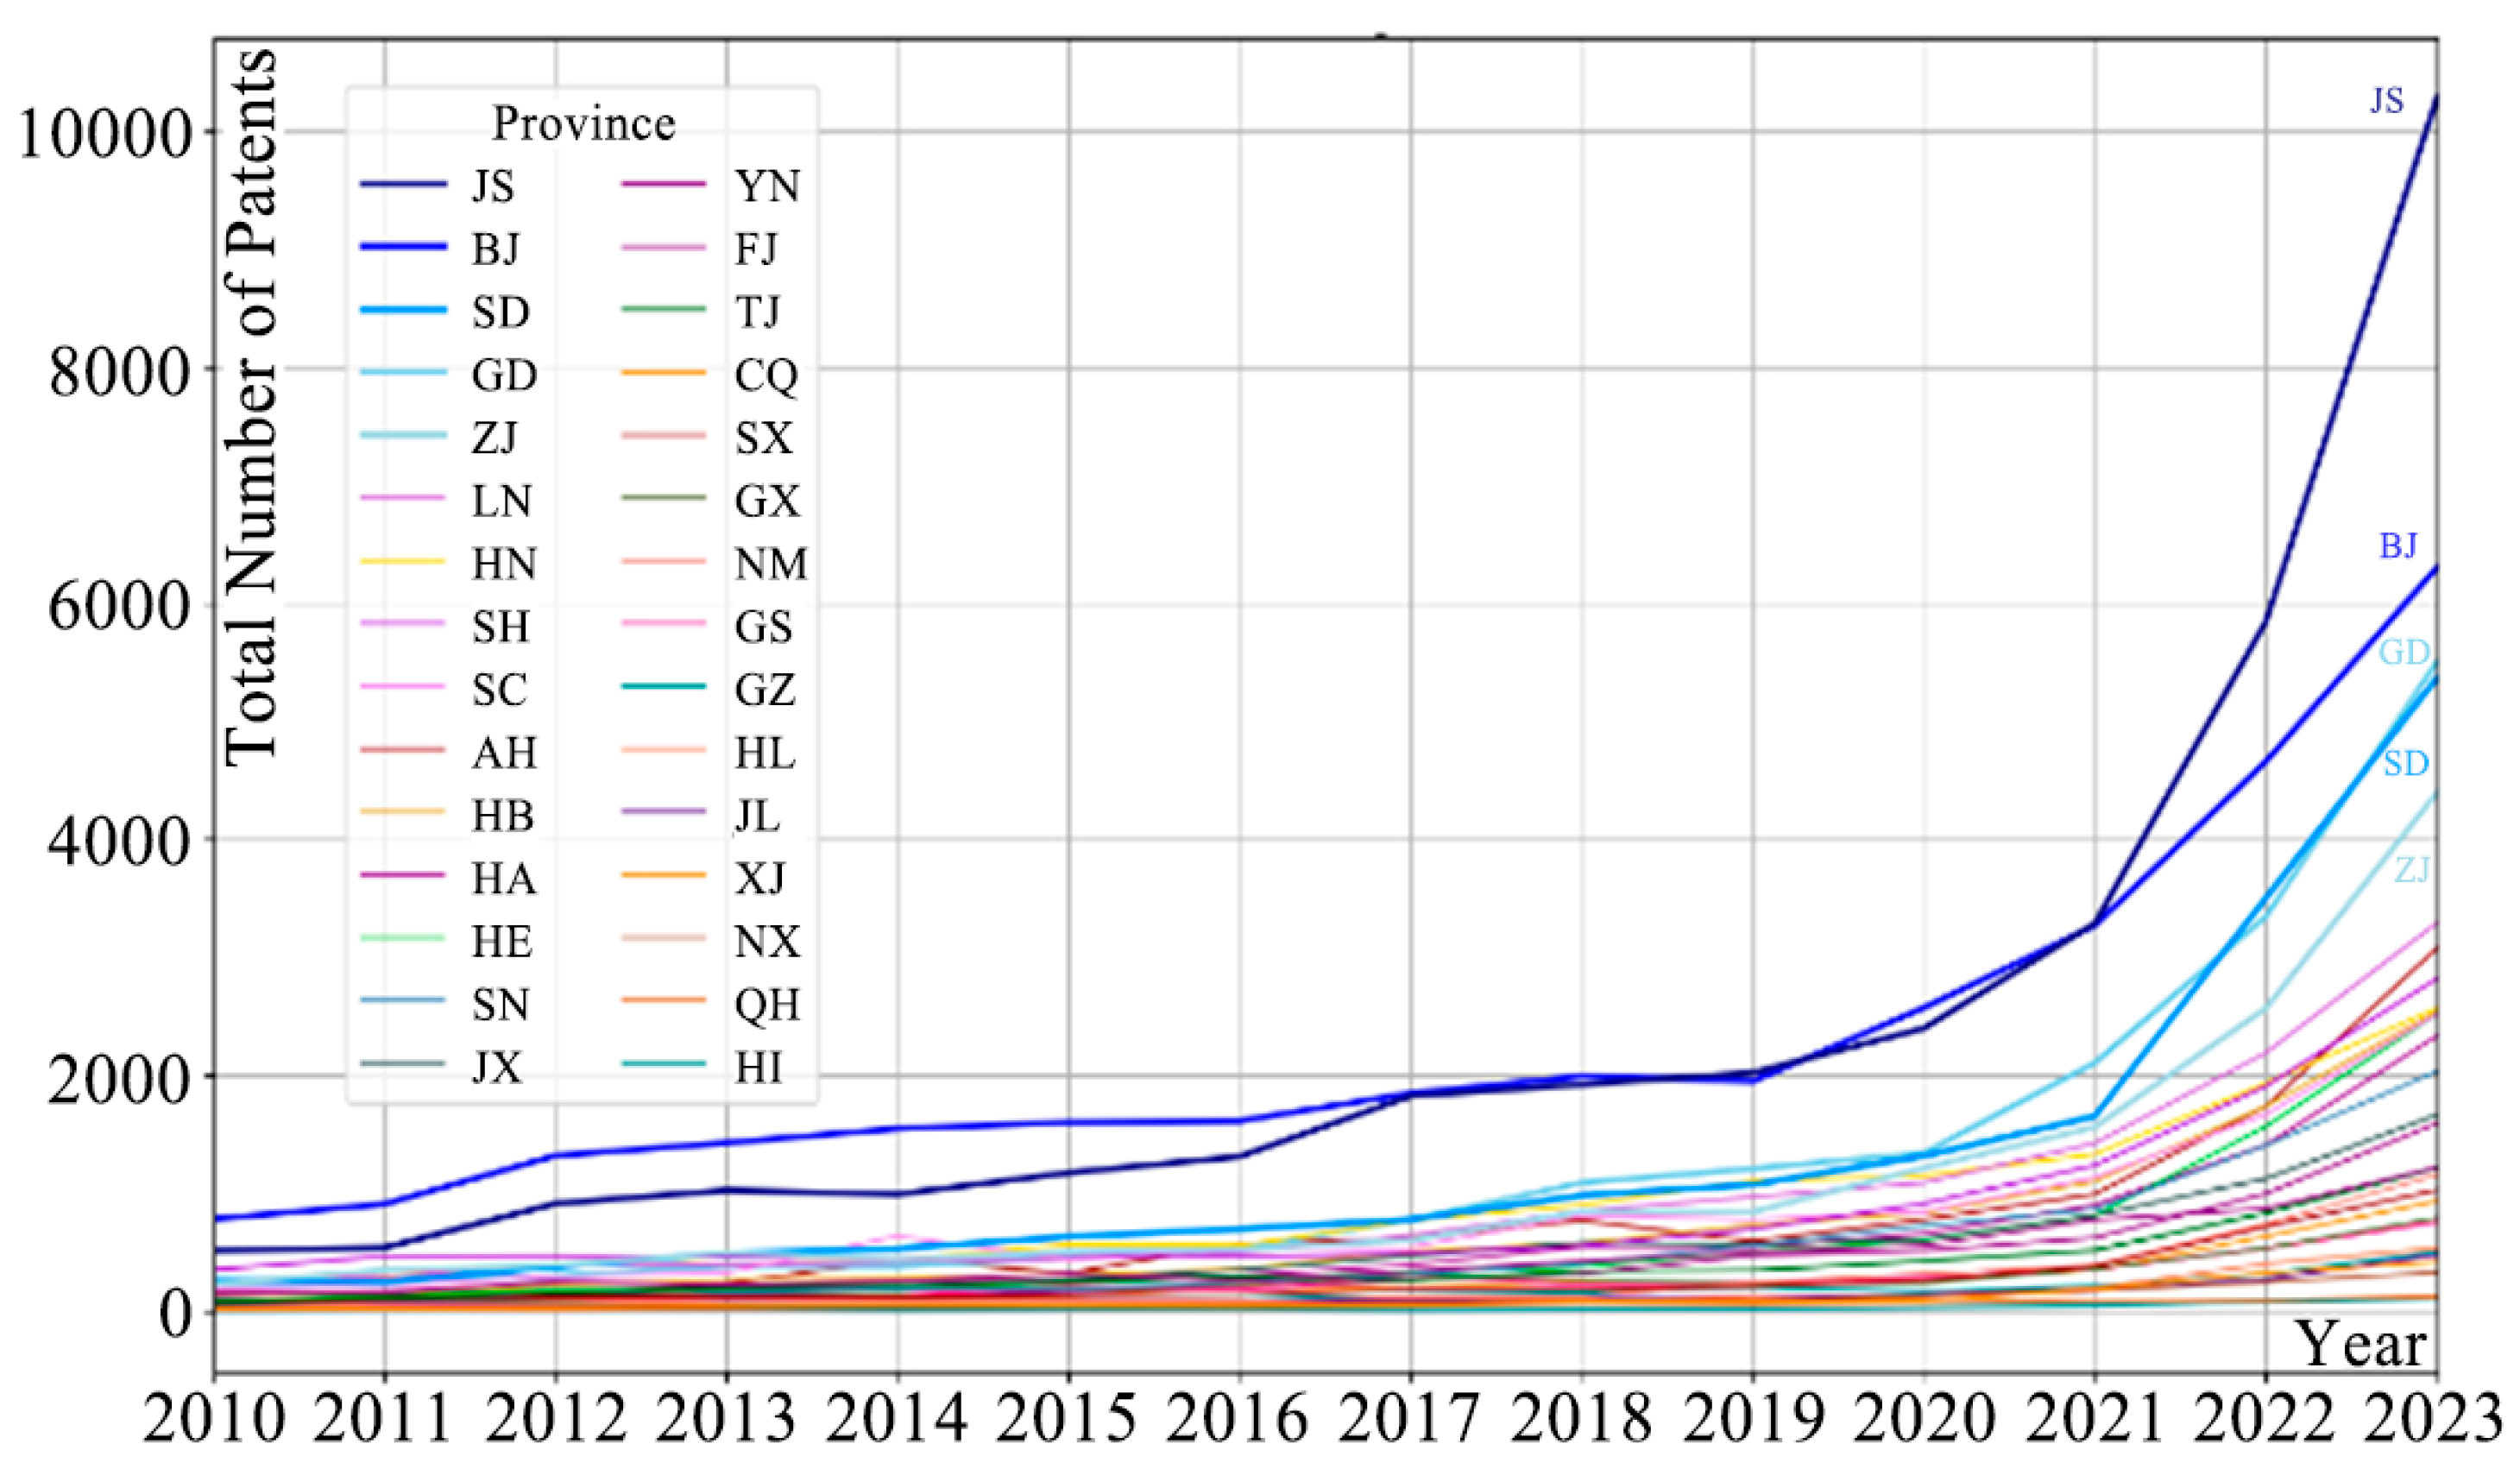
3. Green Technology Innovation Patents in High-Carbon Manufacturing Industries
4. Data and Methodology
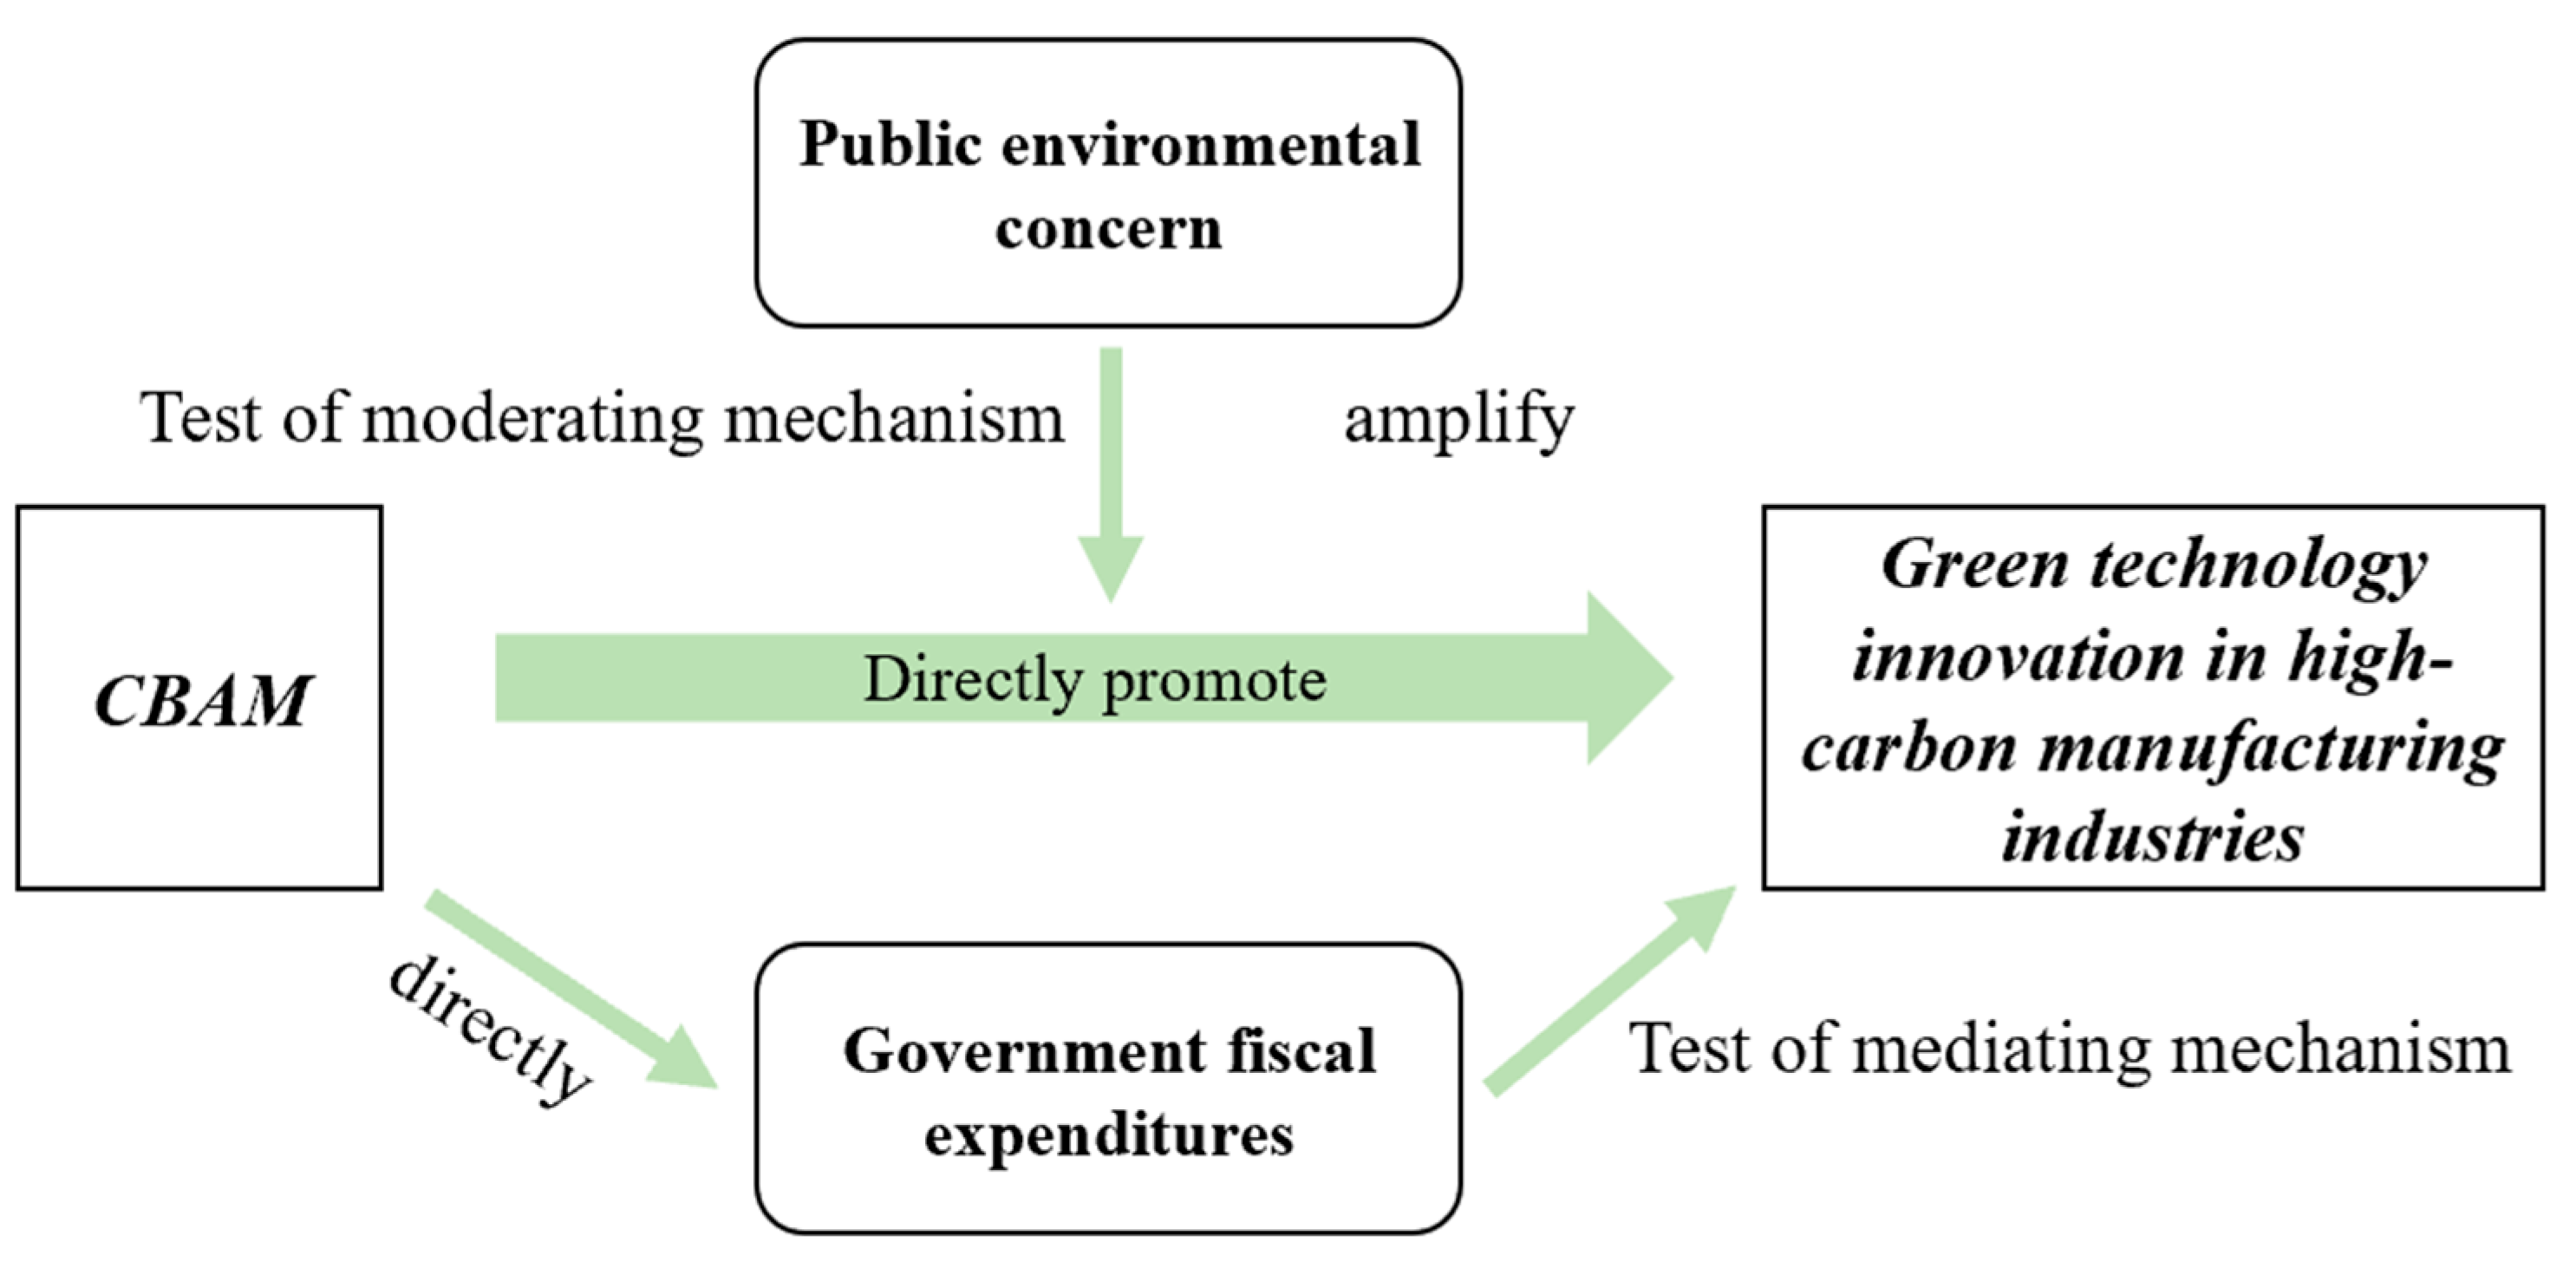
4.1. Empirical Mode
4.1.1. DID Model
4.1.2. Parallel Trend Test Model
4.1.3. Test of Moderating Mechanism
4.1.4. Test of Mediating Mechanism
4.2. Data and Variables
4.2.1. Independent Variable
4.2.2. Dependent Variable
4.2.3. Mechanism Variables
4.2.4. Control Variables
5. Empirical Results
5.1. Benchmark Regression Results Based on DID
5.2. Result of Moderating Mechanism
5.3. Result of Mediating Mechanism
6. Robustness Test
6.1. Shrinkage Treatment
6.2. Parallel Trend Test
6.3. Placebo Test
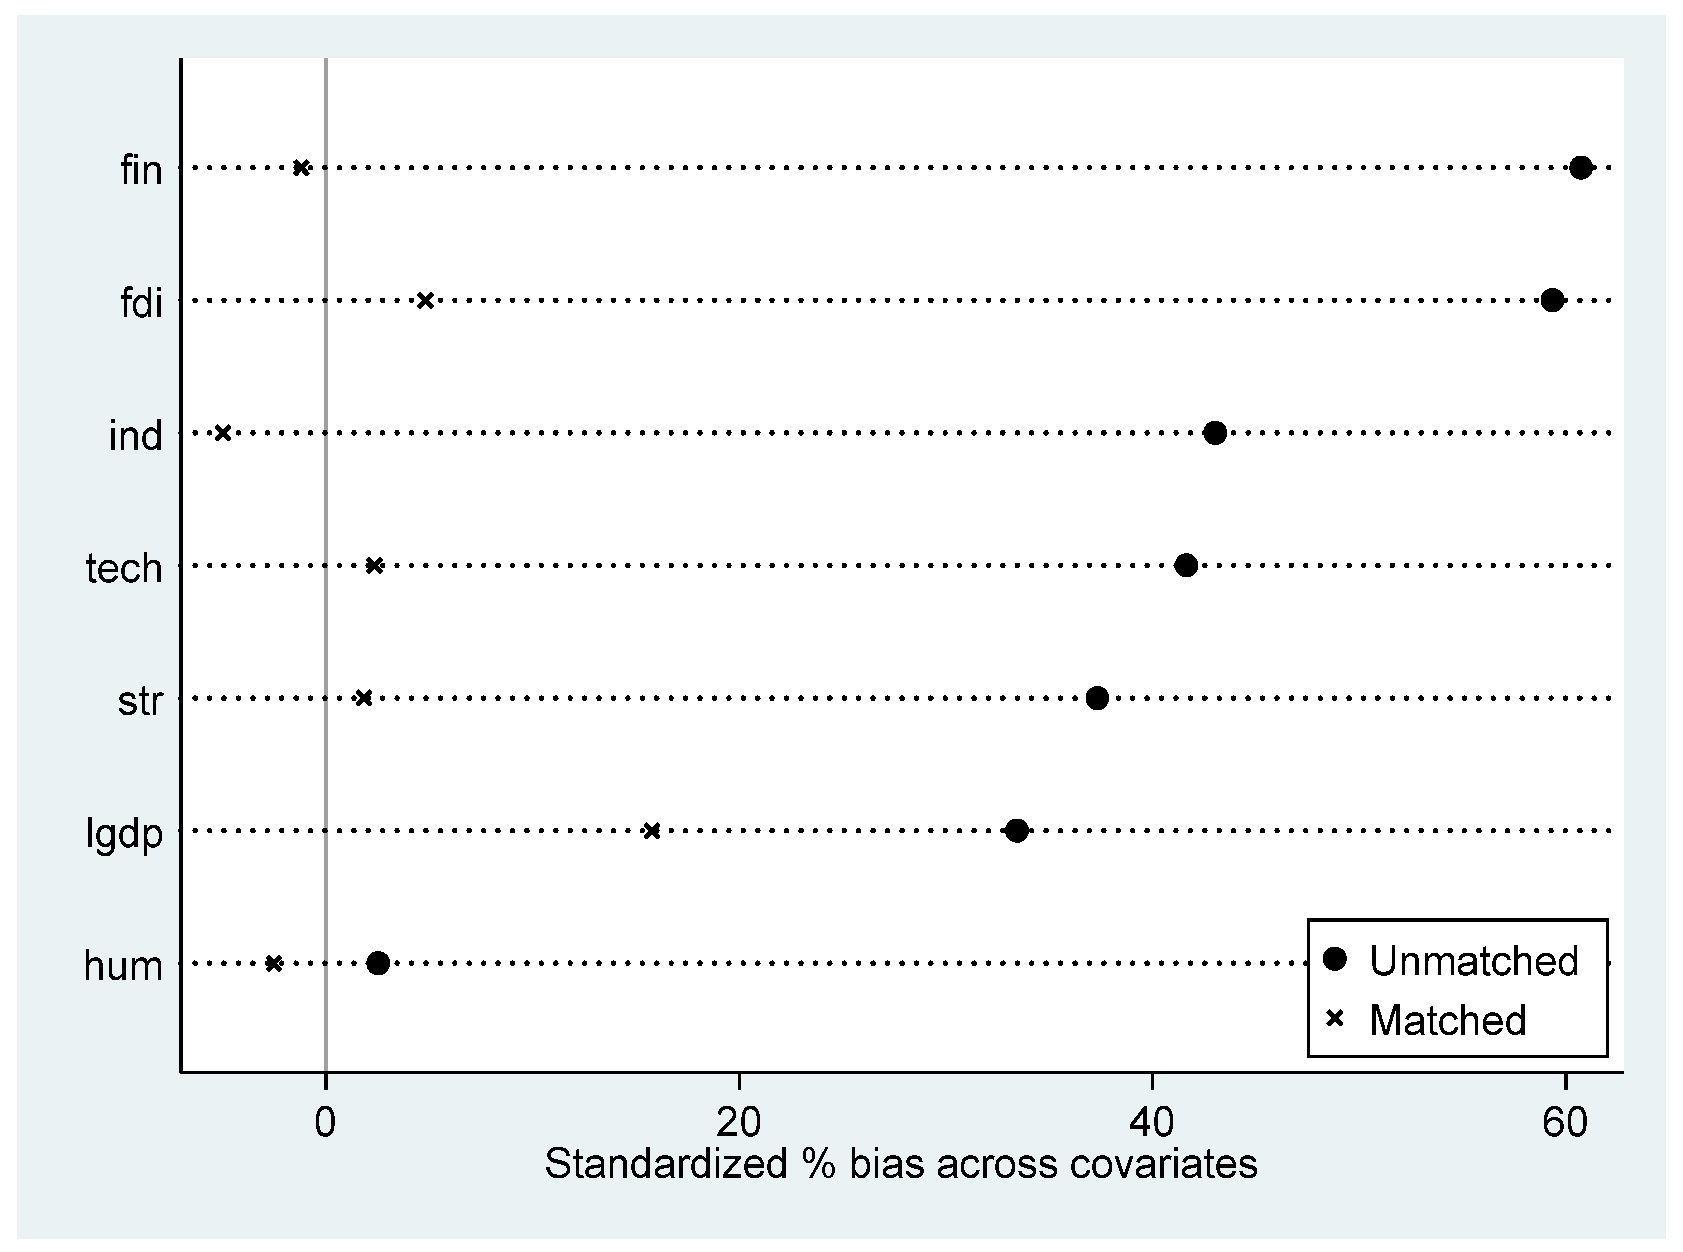
6.4. PSM-DID
6.5. Instrumental Variable Method
7. Heterogeneity Analysis
7.1. Analysis of Industry Heterogeneity
7.2. Analysis of Regional Heterogeneity
8. Conclusions and Policy Recommendations
8.1. Conclusions
8.2. Policy Recommendations
Author Contributions
Funding
Data Availability Statement
Acknowledgments
Conflicts of Interest
References
- Berrang-Ford, L.; Ford, J.D.; Paterson, J. Are we adapting to climate change? Glob. Environ. Change 2021, 21, 25–33. [Google Scholar] [CrossRef]
- Hallegatte, S. Strategies to adapt to an uncertain climate change. Glob. Environ. Change 2009, 19, 240–247. [Google Scholar] [CrossRef]
- Overland, I.; Sabyrbekov, R. Know your opponent: Which countries might fight the European carbon border adjustment mechanism? Energy Policy 2022, 169, 113175. [Google Scholar] [CrossRef]
- Eicke, L.; Weko, S.; Apergi, M.; Marian, A. Pulling up the carbon ladder? Decarbonization, dependence, and third-country risks from the European carbon border adjustment mechanism. Energy Res. Soc. Sci. 2021, 80, 102240. [Google Scholar] [CrossRef]
- Jia, Z.J.; Wu, R.X.; Liu, Y.; Wen, S.Y.; Lin, B.Q. Can carbon tariffs based on domestic embedded carbon emissions reduce more carbon leakages? Ecol. Econ. 2024, 220, 108163. [Google Scholar] [CrossRef]
- Fouré, J.; Guimbard, H.; Monjon, S. Border carbon adjustment and trade retaliation: What would be the cost for the European Union? Energy Econ. 2016, 54, 349–362. [Google Scholar] [CrossRef]
- Antimiani, A.; Costantini, V.; Kuik, O.; Paglialunga, E. Mitigation of adverse effects on competitiveness and leakage of unilateral EU climate policy: An assessment of policy instruments. Ecol. Econ. 2016, 128, 246–259. [Google Scholar] [CrossRef]
- Li, W.; Liu, X.; Lu, C. Analysis of China’s steel response ways to EU CBAM policy based on embodied carbon intensity prediction. Energy 2023, 282, 128812. [Google Scholar] [CrossRef]
- Gu, R.; Guo, J.; Huang, Y.; Wu, X. Impact of the EU carbon border adjustment mechanism on economic growth and resources supply in the BASIC countries. Resour. Policy 2023, 85, 104034. [Google Scholar] [CrossRef]
- Böhringer, C.; Carbone, J.C.; Rutherford, T.F. Embodied carbon tariffs. Scand. J. Econ. 2018, 120, 183–210. [Google Scholar] [CrossRef]
- Perdana, S.; Vielle, M. Making the EU Carbon Border Adjustment Mechanism acceptable and climate friendly for least developed countries. Energy Policy 2022, 170, 113245. [Google Scholar] [CrossRef]
- Yue, T.; Tong, J.; Qiao, Y.B.; Chen, L.J. Carbon governance or trade gaming: China’s approach to addressing the EU’s carbon border adjustment mechanism. J. Clean. Prod. 2024, 484, 144359. [Google Scholar] [CrossRef]
- Lin, B.; Li, A. Impacts of carbon motivated border tax adjustments on competitiveness across regions in China. Energy 2011, 36, 5111–5118. [Google Scholar] [CrossRef]
- Zhong, J.; Pei, J. Beggar thy neighbor? On the competitiveness and welfare impacts of the EU’s proposed carbon border adjustment mechanism. Energy Policy 2022, 162, 112802. [Google Scholar] [CrossRef]
- Li, J.F.; Wang, X.; Zhang, Y.X. Is it in China’s interest to implement an export carbon tax? Energy Econ. 2012, 34, 2072–2080. [Google Scholar] [CrossRef]
- Jones, C.I. R & D-based models of economic growth. J. Political Econ. 1995, 103, 759–784. [Google Scholar]
- Ghosh, M.; Luo, D.; Siddiqui, M.S.; Zhu, Y. Border tax adjustments in the climate policy context: CO2 versus broad-based GHG emission targeting. Energy Econ. 2012, 34, 154–167. [Google Scholar] [CrossRef]
- Krass, D.; Nedorezov, T.; Ovchinnikov, A. Environmental taxes and the choice of green technology. Prod. Oper. Manag. 2013, 22, 1035–1055. [Google Scholar] [CrossRef]
- Cheng, Y.; Sinha, A.; Ghosh, V.; Sengupta, T.; Luo, H. Carbon tax and energy innovation at crossroads of carbon neutrality: Designing a sustainable decarbonization policy. J. Environ. Manag. 2021, 294, 112957. [Google Scholar] [CrossRef]
- Åhman, M.; Nilsson, L.J.; Johansson, B. Global climate policy and deep decarbonization of energy-intensive industries. Clim. Policy 2017, 17, 634–649. [Google Scholar] [CrossRef]
- Ahmed, Z.; Ahmad, M.; Murshed, M.; Shah, M.I.; Mahmood, H.; Abbas, S. How do green energy technology investments, technological innovation, and trade globalization enhance green energy supply and stimulate environmental sustainability in the G7 countries? Gondwana Res. 2022, 112, 105–115. [Google Scholar] [CrossRef]
- Yu, C.Y.; Long, H.Y.; Zhang, X.; Tan, Y.F. The interaction effect between public environmental concern and air pollution: Evidence from China. J. Clean. Prod. 2023, 391, 136231. [Google Scholar] [CrossRef]
- Marquis, C.; Raynard, M. Institutional strategies in emerging markets. Acad. Manag. Ann. 2015, 9, 291–335. [Google Scholar] [CrossRef]
- Fritsche, I.; Jonas, E.; Kayser, D.N.; Koranyi, N. Existential threat and compliance with pro-environmental norms. J. Environ. Psychol. 2010, 30, 67–79. [Google Scholar] [CrossRef]
- Zhang, S.P.; Cheng, L.; Ren, Y.; Yao, Y. Effects of carbon emission trading system on corporate green total factor productivity: Does environmental regulation play a role of green blessing? Environ. Res. 2024, 278, 118295. [Google Scholar] [CrossRef] [PubMed]
- Quesnel, K.J.; Ajami, N.K. Changes in water consumption linked to heavy news media coverage of extreme climatic events. Sci. Adv. 2017, 3, e1700784. [Google Scholar] [CrossRef]
- Zhang, H.T.; Dong, J.R.; Zhang, W.Q.; Luo, J.H. Public environmental supervision, environmental non-governmental organizations, and industrial green and low-carbon transformation. Front. Environ. Sci. 2023, 10, 1074267. [Google Scholar] [CrossRef]
- Johnson, T.; Lora-Wainwright, A.; Lu, J. The quest for environmental justice in China: Citizen participation and the rural-urban network against Panguanying’s waste incinerator. Sustain. Sci. 2018, 13, 733–746. [Google Scholar] [CrossRef]
- Zhang, G.; Deng, N.; Mou, H.; Chen, X. The impact of the policy and behavior of public participation on environmental governance performance: Empirical analysis based on provincial panel data in China. Energy Policy 2019, 129, 1347–1354. [Google Scholar] [CrossRef]
- Oberndorfer, U.; Schmidt, P.; Wagner, M.; Ziegler, A. Does the stock market value the inclusion in a sustainability stock index? An event study analysis for German firms. J. Environ. Econ. Manag. 2013, 66, 497–509. [Google Scholar] [CrossRef]
- Du, X. How the market values greenwashing? Evidence from China. J. Bus. Ethics 2015, 128, 547–574. [Google Scholar] [CrossRef]
- Costa-Campi, M.T.; García-Quevedo, J.; Martínez-Ros, E. What are the determinants of investment in environmental R&D? Energy Policy 2017, 104, 455–465. [Google Scholar]
- Zhao, L.; Zhang, L.; Sun, J.; He, P. Can public participation constraints promote green technological innovation of Chinese enterprises? The moderating role of government environmental regulatory enforcement. Technol. Forecast. Soc. Change 2022, 174, 121198. [Google Scholar] [CrossRef]
- Cheng, X.; Wang, W.; Chen, X.; Song, M. Carbon Tariffs and Energy Subsidies: Synergy or Antagonism? Energy 2024, 306, 132563. [Google Scholar] [CrossRef]
- Jiang, F.X.; Wang, Z.J.; Bai, J.H. The dual effect of environmental regulations’ impact on innovation—An empirical study based on dynamic panel data of Jiangsu manufacturing. China Ind. Econ. 2013, 7, 2013. (In Chinese) [Google Scholar]
- Chien, F.; Anwar, A.; Hsu, C.C.; Sharif, A.; Razzaq, A.; Sinha, A. The role of information and communication technology in encountering environmental degradation: Proposing an SDG framework for the BRICS countries. Technol. Soc. 2021, 65, 101587. [Google Scholar] [CrossRef]
- Chishti, M.Z.; Sinha, A. Do the shocks in technological and financial innovation influence the environmental quality? Evidence from BRICS economies. Technol. Soc. 2022, 68, 101828. [Google Scholar] [CrossRef]
- Meltzer, J. A carbon tax as a driver of green technology innovation and the implications for international trade. Energy LJ 2014, 35, 45. [Google Scholar]
- Bai, Y.; Song, S.; Jiao, J.; Yang, R. The impacts of government R&D subsidies on green innovation: Evidence from Chinese energy-intensive firms. J. Clean. Prod. 2019, 233, 819–829. [Google Scholar]
- Liu, J.; Zhao, M.; Wang, Y. Impacts of government subsidies and environmental regulations on green process innovation: A nonlinear approach. Technol. Soc. 2020, 63, 101417. [Google Scholar] [CrossRef]
- Shao, Y.; Chen, Z. Can government subsidies promote the green technology innovation transformation? Evidence from Chinese listed companies. Econ. Anal. Policy 2022, 74, 716–727. [Google Scholar] [CrossRef]
- Beck, T.; Levine, R.; Levkov, A. Big bad banks? The winners and losers from bank deregulation in the United States. J. Financ. 2010, 65, 1637–1667. [Google Scholar] [CrossRef]
- Bian, Y.C.; Wu, L.H.; Bai, J.H. Does high-speed rail improve regional innovation in China? Financ. Res 2019, 6, 132–149. (In Chinese) [Google Scholar]
- Wu, L.B.; Yang, M.M.; Sun, K.G. Impact of public environmental attention on environmental governance of enterprises and local governments. China Popul. Resour. Env. 2022, 32, 1–14. (In Chinese) [Google Scholar]
- Li, F.Z.; Zhang, X.R. The green and low-carbon development effect of China’s new energy demonstration cities. Ziyuan Kexue 2023, 45, 1590–1603. (In Chinese) [Google Scholar] [CrossRef]
- Dong, Z.Q.; Wang, H. Validation of Market-based Environmental Policies: Empirical Evidence from the Perspective of Carbon Emission Trading Policies. Stat. Res. 2021, 38, 48–61. (In Chinese) [Google Scholar]
- Gan, C.H.; Zheng, R.G.; Yu, D.F. An empirical study on the effects of industrial structure on economic growth and fluctuations in China. Econ. Res. J. 2011, 46, 4–16. (In Chinese) [Google Scholar]
- Shen, J.; Bai, Q.X. China’s Efficiency of Financial System and Financial Scale. J. Quant. Tech. Econ. 2013, 30, 35–50. (In Chinese) [Google Scholar]
- Liang, Y.N.; Zhang, C. Population Aging, Digital Economy and Optimization of China’s Industrial Structure. Inq. Into Econ. Issues 2022, 12, 114–131. (In Chinese) [Google Scholar]
- Sun, Z.; Hou, Y.L. How does industrial intelligence reshape the employment structure of Chinese labor force. China Ind. Econ. 2019, 5, 61–79. (In Chinese) [Google Scholar]
- Ye, X.S.; Liu, J. Government Support, Technology Market Development and the Efficiency of Scientific and Technological Innovation. Econ. Perspect. 2018, 7, 67–81. (In Chinese) [Google Scholar]
- Chen, S.Y.; Chen, D.K. Air pollution, government regulations and high-quality economic development. Econ. Res 2018, 53, 20–34. (In Chinese) [Google Scholar]
- Zhou, C.B.; Qin, Y. The Impact of a Carbon Trading Pilot Policy on the Low-Carbon Economic Transformation in China—An Empirical Analysis Based on a DID Model. Soft Sci 2020, 34, 36–42+55. (In Chinese) [Google Scholar]
- Wen, Z.; Chang, L.; Hau, K.T.; Liu, H. Testing and application of the mediating effects. Acta Psychol. Sin. 2004, 36, 614. (In Chinese) [Google Scholar]
- Wei, Y.; Zhang, H. Will import liberalization increase China’s export domestic value added ratio: A re-estimation based on the gross export accounting framework. China Ind. Econ. 2019, 3, 24–42. (In Chinese) [Google Scholar]
- Li, P.; Lu, Y.; Wang, J. Does flattening government improve economic performance? Evidence from China. J. Dev. Econ. 2016, 123, 18–37. [Google Scholar] [CrossRef]
- He, W.W.; Zhang, Y.B. Does Trade Opening Promote the Urban-rural Common Prosperity?—Empirical Evidence from Cities at Prefecture Level and Above in China. South China J. Econ. 2024, 6, 57–76. (In Chinese) [Google Scholar]
- Shen, X.B.; Chen, Y.; Lin, B.Q. The Impacts of Technological Process and Industrial Structure Distortion on China’s Energy Intensity. Econ. Res. J. 2021, 56, 157–173. (In Chinese) [Google Scholar]


| JS—Jiangsu | BJ—Beijing | SD—Shandong | GD—Guangdong | ZJ—Zhejiang |
| LN—Liaoning | HN—Hunan | SH—Shanghai | SC—Sichuan | AH—Anhui |
| HB—Hubei | HA—Henan | HE—Hebei | SN—Shaanxi | JX—Jiangxi |
| YN—Yunnan | FJ—Fujian | TJ—Tianjin | CQ—Chongqing | SX—Shanxi |
| GX—Guangxi | NM—Inner Mongoria | GS—Gansu | GZ—Guizhou | HL—Heilongjiang |
| JL—Jilin | XJ—Xinjiang | NX—Ningxia | QH—Qinghai | HI—Hainan |
| Prov | ZJ | JS | GD | SD | SH | FJ | BJ | LN | HE | JX |
|---|---|---|---|---|---|---|---|---|---|---|
| Exports in 2023 | 919.1 | 745.1 | 710.7 | 675.3 | 374.1 | 265.9 | 418.8 | 143.7 | 143.9 | 144.6 |
| Total exports 2015–2023 | 5540.1 | 5441.5 | 4906.9 | 4570.8 | 2577.6 | 2046.8 | 2032.6 | 1417.9 | 1191.1 | 874.3 |
| VarName | Obs | Mean | SD | Min | Median | Max |
|---|---|---|---|---|---|---|
| kgt | 420 | 0.6205 | 0.983 | 0.00 | 0.29 | 10.29 |
| D | 420 | 0.0952 | 0.294 | 0.00 | 0.00 | 1.00 |
| str | 420 | 1.2350 | 0.693 | 0.35 | 1.08 | 5.30 |
| lgdp | 420 | 9.7954 | 0.972 | 6.95 | 9.91 | 11.82 |
| ind | 420 | 0.3267 | 0.084 | 0.10 | 0.33 | 0.58 |
| hum | 420 | 0.0213 | 0.006 | 0.01 | 0.02 | 0.04 |
| tech | 420 | 0.0184 | 0.031 | -0.05 | 0.01 | 0.17 |
| fin | 420 | 3.2734 | 1.145 | 1.52 | 3.06 | 8.13 |
| fdi | 420 | 1.8638 | 1.626 | 0.00 | 1.62 | 12.42 |
| gov | 420 | 0.2366 | 0.101 | 0.08 | 0.22 | 0.64 |
| PA | 420 | 131.7581 | 73.897 | 5.02 | 121.51 | 417.37 |
| (1) | (2) | |
|---|---|---|
| KGT | KGT | |
| D | 1.358 *** | 0.846 *** |
| (0.349) | (0.238) | |
| str | −0.643 *** | |
| (0.176) | ||
| lgdp | −0.154 *** | |
| (0.051) | ||
| ind | −2.964 *** | |
| (1.034) | ||
| hum | −90.987 ** | |
| (36.509) | ||
| tech | 7.468 ** | |
| (2.975) | ||
| fin | 0.118 | |
| (0.130) | ||
| fdi | −0.039 | |
| (0.024) | ||
| prov | Y | Y |
| year | Y | Y |
| _cons | 0.491 *** | 5.291 *** |
| (0.033) | (1.117) | |
| N | 420 | 420 |
| r2 | 0.771 | 0.823 |
| ar2 | 0.745 | 0.800 |
| (1) | (2) | |
|---|---|---|
| GT | KGT | |
| D | 0.808 *** | 0.565 *** |
| (0.238) | (0.153) | |
| PA | −0.001 ** | 0.002 |
| (0.001) | (0.001) | |
| D × PA | 0.021 ** | |
| (0.009) | ||
| str | −0.617 *** | −0.682 *** |
| (0.177) | (0.183) | |
| lgdp | −0.166 *** | −0.116 *** |
| (0.051) | (0.038) | |
| ind | −2.873 *** | −2.993 *** |
| (1.036) | (0.924) | |
| hum | −90.263 ** | −64.460 * |
| (36.191) | (31.716) | |
| tech | 7.389 ** | 6.476 ** |
| (3.006) | (2.874) | |
| fin | 0.109 | 0.155 |
| (0.126) | (0.120) | |
| fdi | −0.036 | −0.047 * |
| (0.025) | (0.024) | |
| prov | Y | Y |
| year | Y | Y |
| _cons | 5.538 *** | 4.065 *** |
| (1.113) | (1.027) | |
| N | 420 | 420 |
| dj. R2 | 0.800 | 0.831 |
| (1) | (2) | (3) | (4) | (5) | (6) | |
|---|---|---|---|---|---|---|
| KGT | GOV | KGT | KGT | GOV | KGT | |
| D | 0.846 *** | 0.013 * | 0.757 *** | |||
| (0.238) | (0.007) | (0.232) | ||||
| L.D | 1.049 *** | 0.027 *** | 0.878 *** | |||
| (0.305) | (0.007) | (0.290) | ||||
| GOV | 6.964*** | 6.307 *** | ||||
| (1.868) | (1.835) | |||||
| lgdp | −0.154 *** | −0.005 * | −0.121 ** | −0.105 ** | −0.004 | −0.081 * |
| (0.051) | (0.003) | (0.048) | (0.041) | (0.002) | (0.040) | |
| ind | −2.964 *** | 0.014 | −3.061 *** | −3.086 *** | 0.021 | −3.221 *** |
| (1.034) | (0.069) | (1.029) | (1.031) | (0.069) | (1.007) | |
| hum | −90.987 ** | −2.056 | −76.668 ** | −94.685 ** | −1.756 | −83.611 ** |
| (36.509) | (1.646) | (31.059) | (37.857) | (1.722) | (32.980) | |
| tech | 7.468 ** | 0.119 | 6.640 ** | 7.616 ** | 0.138 | 6.743 ** |
| (2.975) | (0.163) | (3.032) | (3.159) | (0.157) | (3.209) | |
| fin | 0.118 | 0.054 *** | −0.259 * | 0.139 | 0.054 *** | −0.203 |
| (0.130) | (0.007) | (0.150) | (0.136) | (0.008) | (0.153) | |
| fdi | −0.039 | 0.000 | −0.040 * | −0.036 | 0.000 | −0.037 |
| (0.024) | (0.002) | (0.023) | (0.023) | (0.002) | (0.022) | |
| prov year | Y | Y | Y | Y | Y | Y |
| _cons | 5.291 *** | 0.138 *** | 4.332 *** | 4.884 *** | 0.117 ** | 4.146 *** |
| (1.117) | (0.043) | (1.020) | (1.041) | (0.043) | (0.988) | |
| Sobel Z | 4.362 *** | |||||
| Bootstrap _bs_1(BC)95% conf. interval Bootstrap _bs_2(BC)95% conf. interval | [0.1484–0.3068] [1.1421–2.0491] | |||||
| N | 420 | 420 | 420 | 390 | 390 | 390 |
| adj. R2 | 0.799 | 0.965 | 0.816 | 0.808 | 0.967 | 0.820 |
| (1) | |
|---|---|
| KGT_w | |
| D | 0.807 *** |
| (0.199) | |
| str_w | −0.537 *** |
| (0.159) | |
| lgdp_w | −0.145 *** |
| (0.039) | |
| ind_w | −2.524 *** |
| (0.825) | |
| hum_w | −67.205 ** |
| (25.899) | |
| tech_w | 7.480 ** |
| (3.097) | |
| fin_w | 0.050 |
| (0.079) | |
| fdi_w | −0.027 |
| (0.027) | |
| prov | Y |
| year | Y |
| _cons | 4.607 *** |
| (0.762) | |
| N | 420 |
| r2 | 0.879 |
| ar2 | 0.862 |
| Variables | Mean | Bias | t-Test | ||||
|---|---|---|---|---|---|---|---|
| (1) | (2) | (3) | (4) | (5) | (6) | (7) | (8) |
| Treated | Control | % Bias |
% Reduct |Bias| | t | p > |t| | ||
| str | U | 1.426 | 1.140 | 37.3 | 4.06 | 0.000 | |
| M | 1.035 | 1.018 | 1.8 | 95.1 | 0.27 | 0.784 | |
| lgdp | U | 10.011 | 9.688 | 33.4 | 3.25 | 0.001 | |
| M | 9.989 | 9.837 | 15.8 | 52.8 | 1.22 | 0.223 | |
| ind | U | 0.350 | 0.315 | 43.0 | 4.19 | 0.000 | |
| M | 0.372 | 0.376 | −5 | 88.4 | −0.41 | 0.686 | |
| hum | U | 0.021 | 0.021 | 2.5 | 0.23 | 0.820 | |
| M | 0.020 | 0.021 | −2.5 | 0 | −0.23 | 0.842 | |
| tech | U | 0.028 | 0.014 | 41.6 | 4.57 | 0.000 | |
| M | 0.013 | 0.012 | 2.4 | 94.3 | 0.30 | 0.764 | |
| fin | U | 3.775 | 3.023 | 60.7 | 6.66 | 0.000 | |
| M | 3.076 | 3.090 | −1.2 | 98 | −0.14 | 0.891 | |
| fdi | U | 2.467 | 1.563 | 59.3 | 5.56 | 0.000 | |
| M | 2.157 | 2.083 | 4.8 | 91.9 | 0.27 | 0.791 | |
| (1) | |
|---|---|
| kgt | |
| D | 0.514 ** |
| (0.220) | |
| str | −1.686 |
| (1.207) | |
| lgdp | −0.154 * |
| (0.088) | |
| ind | −10.727 |
| (6.503) | |
| hum | −346.096 ** |
| (142.768) | |
| tech | 22.052 * |
| (11.507) | |
| fin | 0.533 |
| (0.486) | |
| fdi | −0.046 |
| (0.050) | |
| prov | Y |
| year | Y |
| _cons | 13.702 ** |
| (5.356) | |
| N | 353 |
| r2 | 0.887 |
| ar2 | 0.867 |
| Variables | First-Stage Regression (1) | Second-Stage Regression (2) |
|---|---|---|
| IV | 0.017 *** | |
| D | 2.270 ** | |
| Control variables | Y | Y |
| Prov | Y | Y |
| Year | Y | Y |
| N | 420 | 420 |
| Kleibergen–Paap rk LM statistic | 8.457 *** | |
| (1) | (2) | (3) | (4) | |
|---|---|---|---|---|
| Steel Industry | Cement Industry | Non-Ferrous Metals Industry | Petro-Chemical Industry | |
| did | 0.173 ** | 0.082 *** | 0.229 *** | 0.362 *** |
| (0.065) | (0.025) | (0.066) | (0.120) | |
| str | −0.141 *** | −0.040 ** | −0.199 *** | −0.263 *** |
| (0.046) | (0.018) | (0.065) | (0.094) | |
| lgdp | −0.037 ** | −0.015 *** | −0.046 *** | −0.057 ** |
| (0.014) | (0.004) | (0.016) | (0.023) | |
| ind | −0.553 * | −0.397 *** | −0.856 ** | −1.158 ** |
| (0.281) | (0.129) | (0.344) | (0.425) | |
| hum | −17.546 * | −5.119 | −22.347 ** | −45.975 ** |
| (9.070) | (3.171) | (9.993) | (17.674) | |
| tech | 1.568 | 0.361 * | 2.166 ** | 3.373 *** |
| (0.961) | (0.211) | (0.993) | (1.213) | |
| fin | 0.052 | 0.012 | 0.026 | 0.027 |
| (0.036) | (0.009) | (0.042) | (0.054) | |
| fdi | −0.014 ** | −0.004 | −0.007 | −0.013 |
| (0.007) | (0.003) | (0.008) | (0.009) | |
| prov | Y | Y | Y | Y |
| year | Y | Y | Y | Y |
| _cons | 0.999 *** | 0.426 *** | 1.516 *** | 2.350 *** |
| (0.288) | (0.112) | (0.352) | (0.522) | |
| N | 420 | 420 | 420 | 420 |
| adj. R2 | 0.647 | 0.667 | 0.782 | 0.848 |
| (1) | (2) | |
|---|---|---|
| Eastern Region | Central and Western Regions | |
| D | 0.964 ** | 0.172 * |
| (0.391) | (0.099) | |
| str | −0.686 ** | −0.081 |
| (0.274) | (0.133) | |
| lgdp | −0.197 | −0.095 *** |
| (0.124) | (0.021) | |
| ind | 0.770 | −1.713 ** |
| (5.137) | (0.709) | |
| hum | −132.573 | −39.774 * |
| (92.671) | (20.013) | |
| tech | 0.627 | 8.957 *** |
| (15.061) | (2.337) | |
| fin | 0.068 | 0.006 |
| (0.351) | (0.096) | |
| fdi | −0.010 | −0.053 * |
| (0.062) | (0.030) | |
| prov | Y | Y |
| year | Y | Y |
| _cons | 6.334 * | 2.712 *** |
| (2.955) | (0.524) | |
| N | 154 | 266 |
| adj. R2 | 0.793 | 0.848 |
| chowtest | 4.14 *** | |
Disclaimer/Publisher’s Note: The statements, opinions and data contained in all publications are solely those of the individual author(s) and contributor(s) and not of MDPI and/or the editor(s). MDPI and/or the editor(s) disclaim responsibility for any injury to people or property resulting from any ideas, methods, instructions or products referred to in the content. |
© 2025 by the authors. Licensee MDPI, Basel, Switzerland. This article is an open access article distributed under the terms and conditions of the Creative Commons Attribution (CC BY) license (https://creativecommons.org/licenses/by/4.0/).
Share and Cite
Yang, L.; Lu, Z.; Shen, M. Research on the Effect and Path of CBAM on Green Technology Innovation in China’s High-Carbon Manufacturing Industries. Sustainability 2025, 17, 2305. https://doi.org/10.3390/su17052305
Yang L, Lu Z, Shen M. Research on the Effect and Path of CBAM on Green Technology Innovation in China’s High-Carbon Manufacturing Industries. Sustainability. 2025; 17(5):2305. https://doi.org/10.3390/su17052305
Chicago/Turabian StyleYang, Lin, Zhengnan Lu, and Mengsha Shen. 2025. "Research on the Effect and Path of CBAM on Green Technology Innovation in China’s High-Carbon Manufacturing Industries" Sustainability 17, no. 5: 2305. https://doi.org/10.3390/su17052305
APA StyleYang, L., Lu, Z., & Shen, M. (2025). Research on the Effect and Path of CBAM on Green Technology Innovation in China’s High-Carbon Manufacturing Industries. Sustainability, 17(5), 2305. https://doi.org/10.3390/su17052305