Article

Research on the Effect and Path of CBAM on Green Technology Innovation in China’s High-Carbon Manufacturing Industries

1
School of Management, Jiangsu University, Zhenjiang 212013, China
2
School of Finance & Economics, Jiangsu University, Zhenjiang 212013, China
*
Author to whom correspondence should be addressed.
Sustainability 2025, 17(5), 2305; https://doi.org/10.3390/su17052305
Submission received: 21 January 2025 / Revised: 28 February 2025 / Accepted: 4 March 2025 / Published: 6 March 2025
(This article belongs to the Topic Multiple Roads to Achieve Net-Zero Emissions by 2050)

Abstract

:
To cope with global warming, the European Union will implement the Carbon Border Adjustment Mechanism (CBAM) in 2026. CBAM may seriously affect the export of China’s high-carbon manufacturing products. To illustrate this issue, this paper uses DID for analysis, taking CBAM as a shock policy. To further explore the impact pathway, this article utilizes a high-dimensional fixed-effect model for mechanism analysis. The results are as follows: (1) CBAM stimulates the vitality of green technology innovation in the high-carbon manufacturing industry; (2) public environmental concern has a positive moderating effect on green technology innovation; (3) financial support plays a mediating role; (4) green technology innovations are more likely to be influenced by CBAM in the eastern region, the petrochemical, and nonferrous industries. Based on research findings, suggestions are as follows: (1) promote green technology innovation in high-carbon industries; (2) increase financial support for green technology innovation in high-carbon enterprises; (3) guide the public towards green and low-carbon consumption; (4) strengthen policy support for low-carbon development in the central and western regions.

1. Introduction

Curbing climate change has become the international community’s broad consensus, given the increasingly severe global climate problem (Berrang-Ford et al., 2011) [1]. To implement the climate goals, the carbon-neutral commitments of countries worldwide are shifting from “soft constraints” to “hard constraints” (Hallegatte, 2009) [2]. CBAM means that non-European Union countries are required to reduce their emissions and reduce the risk of “carbon leakage” by requiring that imported or exported carbon-intensive products be subject to a corresponding tax or refund of carbon allowances (Overland and Sabyrbekov, 2022) [3]. In the European Green Bill 2019, the EU proposed a concrete CBAM idea. After several rounds of deliberations and revisions, the European Parliament adopted the CBAM amendments in June 2022. In December, the EU formalized the establishment of the CBAM mechanism. The mechanism covers six key sectors—steel, aluminum, electricity, cement, fertilizers, and hydrogen. It is scheduled to be formally implemented from the end of 2026 onward.
China, the largest developing country in the world, pays close attention to this problem (Eicke et al., 2021) [4]. CBAM may affect the export of Chinese steel and aluminum products to the EU. In 2021, China’s exports of CBAM steel and aluminum products accounted for 0.98% and 0.21% of the total export scale to the EU, respectively, with a value of up to 5.6 billion euros. In the long run, if the EU extends the coverage of CBAM to the downstream of the steel and aluminum industries in the future, it will deal a heavy blow to China’s exports. This may lead Chinese companies to seek new buyers in the international market and change the trade patterns. To address the challenges of introducing CBAM and deepening the “dual-carbon” strategy, China has proposed new requirements for green technological innovation. The National Development and Reform Commission (NDRC) confirms that the critical tasks need to focus on green technological innovations in key industries, such as steel, cement, non-ferrous metals, petrochemicals, and chemicals in 2022. In 2024, the Chinese government further proposes improving the mechanism for green and low-carbon development and solidly promoting it.
Against this background, this paper provides an in-depth analysis of CBAM’s impact and influence on the path of green technological innovation in China’s high-carbon manufacturing industries. This study provides a theoretical basis for further understanding the impact and path of CBAM on China’s high-carbon product exports and for effectively addressing the impact of CBAM in the European Union. The marginal contribution of this paper lies in using CBAM as a policy shock and exploring its impact on green technology innovation in high-carbon industries, which is forward-looking, and using public environmental concern as a moderating variable, which is novel.

2. Literature Review and Research Hypotheses

2.1. Carbon Tariffs and Green Technology Innovation

Existing research suggests that developed countries favor implementing carbon tariffs, mainly based on considerations of mitigating carbon leakage and competitiveness issues. In this context, some scholars believe that carbon tariffs as a border adjustment measure are not a protectionist policy but a policy tool aimed at promoting global environmental sustainability. It advocates for the implementation of carbon tariff schemes that specifically target products with high embedded carbon emissions, thereby further reducing carbon leakage (Jia et al., 2024) [5]. Implementing carbon tariffs can not only effectively curb the growth of total global carbon emissions but also mitigate the risk of carbon leakage and enhance international competitiveness to a certain extent (Four’e et al., 2016) [6]. However, opposition voices argue that carbon tariffs will lead to higher emissions reduction costs and carbon leakage risks and raise issues of fairness and burden-sharing. To verify the impact of CBAM on carbon leakage and trade-implied carbon emissions, academics have adopted a variety of quantitative analytical methods, including the computable general equilibrium (CGE) model (Antimiani et al., 2016) [7], the input-output method (Li et al., 2023) [8], and the global trade analysis (GTAP) model (Gu et al., 2023) [9], among others.
As a border adjustment measure and an emerging trade regulation tool, carbon tariffs have far-reaching implications for exports and trade. In studies exploring the effect of carbon tariffs on the cost of exports from developing countries, academics have noted that carbon tariffs on energy-intensive goods imported into the European Union could restrict the export of developing countries, mainly due to the higher risk of exposure and vulnerability of these countries. Although carbon tariffs have demonstrated a positive effect in reducing foreign emissions, their core impact lies in the partial transfer of the economic costs of climate policy to developing countries (Böhringer et al., 2018) [10]. By evaluating and quantifying the impacts of the EU’s CBAM, it was found that implementing carbon tariffs may result in firms experiencing higher export costs and a reduction in their overall export volume and consequently suffering significant economic losses (Perdana and Vielle, 2022) [11].
Further, scholars have modeled the macroeconomic effects of carbon tariffs on the economy using a four-country CGE model (including the US, the EU, China, and other countries). CBAM may lead to a slight decrease of 0.003% in China’s GDP and a 0.004% reduction in carbon emissions (Yue et al., 2024) [12]. The effects of carbon tariffs on different regions (east, central, and west) and regions with different trade openness in China were simulated and analyzed in depth through a more detailed multi-country, multi-region CGE model. The results show that the negative effects of carbon tariffs on China are mainly concentrated in regions with high external dependence (Lin and Li, 2011) [13]. Moreover, at the trade level, carbon tariffs have a more significant negative impact on countries that favor exporting carbon-intensive industries (Li et al., 2023) [8]. However, China has a larger share of global trade and carbon emissions, and its exports are characterized by high carbon content (Zhong and Pei, 2022) [14]. Therefore, the imposition of carbon tariffs will significantly increase the production costs of Chinese enterprises and weaken their export competitiveness, especially for industries relying on high-carbon emission products; carbon tariffs will have far-reaching implications on the structure of China’s exports (Li et al., 2012) [15].
In summary, as a potential international trade adjustment tool, carbon tariffs’ impact on China’s exports is multidimensional. Implementing the CBAM has challenged China’s industrial exports and significantly impacted domestic production and consumption patterns. According to the endogenous economic growth theory, the core of sustainable economic growth is innovation (Jones, 1995) [16]. Policy pressures also stimulate industries to adjust their strategies to promote innovation and the development of green industries (Ghosh et al., 2012) [17]. Environmental taxes will incentivize the choice of innovative and “green” abatement technologies (Krass et al., 2013) [18]. Studies have shown that carbon tax is the primary policy tool for decarbonization, and the income from carbon tax has been a driving force for energy innovation (Cheng et al., 2021) [19]. It drives relevant industries to improve energy efficiency through green technology innovation, leading to deep decarbonization and technological change (Ahman et al., 2017) [20]. In addition, scholars have analyzed the effect of carbon tariffs on exports from a long-term perspective and found that green technological innovations positively mitigate export reductions. Studies have shown that technological innovation not only enhances the supply of renewable energy but also helps to reduce carbon emissions, thus mitigating the negative impact of carbon tariffs on exports to a certain extent (Ahmed et al., 2022) [21].
Accordingly, this paper proposes the research Hypothesis H1: CBAM will promote green technological innovation in China’s high-carbon manufacturing industries.

2.2. Carbon Tariffs and Public Environmental Concerns

Against the growing global challenge of climate change and the relentless advance of the global green transition, public environmental concern is a social force that cannot be ignored. It was proved that public environmental concern reduces air pollution by promoting government environmental regulation, and air pollution promotes public environmental concern by threatening the health of the residents (Yu et al., 2023) [22]. According to the stakeholder theory, corporate environmental decisions and practices are deeply influenced by multiple stakeholders, among whom the government, non-governmental organizations, the public, and the media play vital roles (Marquis and Raynard, 2015) [23]. In particular, as a group that receives environmental impacts directly or indirectly, the public has an essential influence on corporate ecological strategies regarding their attitudes and behaviors. Risk perception theory further states that when the public perceives that environmental pollution threatens them, they will take positive action and demand that the government or firms take countermeasures (Fritsche et al., 2010) [24]. Studies have shown that public environmental concern plays a moderating role in the relationship between CETPP (Carbon Emissions Trading Pilot Policy) and GTFP (Green Total Factor Productivity) (Zhang et al., 2024) [25]. In modern society, public opinion increasingly influences government and corporate behavior (Quesnel and Ajami, 2017) [26]. Both public environmental supervision and ENGOs can achieve green and low-carbon industrial transformation by promoting green technology progress (Zhang et al., 2023) [27]. At the same time, the public’s concern about the environment and demand for green consumption is increasing (Johnson et al., 2018; Zhang et al., 2019) [28,29], and companies will actively adopt green innovation to build a green image and accumulate a green reputation (Oberndorfer et al., 2013; Du, 2015) [30,31]. Moreover, introducing a carbon tariff policy will drive the growth of green demand and enhance public environmental concern, promoting technological innovation and implementing enterprises’ green development strategy. Specifically, public environmental concerns contribute to improving environmental management performance and increasing enterprises’ incentives to innovate (Costa-Campi et al., 2017) [32] and ultimately facilitate the enhancement of firms’ green technological innovation level (Zhao et al., 2022) [33].
Accordingly, this paper proposes the research Hypothesis H2: The positive impact of CBAM on green technological innovation in China’s high-carbon manufacturing industries is enhanced by the increase in public environmental concern.

2.3. Carbon Tariffs and Government Fiscal Expenditures

Carbon tariffs, as a tax on carbon-emitting products, reduce carbon emissions by raising the cost of exports and lowering their market demand. However, implementing carbon tariffs constitutes a significant economic pressure for developing countries, especially those that rely on energy-intensive industries and export high-carbon products. Therefore, it is essential to find effective coping strategies. Studies have shown that financial subsidies from developing countries to domestic renewable energy can help to develop renewable energy industries and reduce the impact of carbon tariffs on the economy (Cheng et al., 2024) [34]. At the same time, technological innovation and green investment are crucial to achieving sustainable development goals. Financial subsidies play an essential role in this regard. For one thing, the government subsidy can decrease the cost and risk of R&D and encourage firms to invest more in green technology (Jiang et al., 2013) [35]. On the other hand, the subsidy policy can direct the social capital to the green industry and enlarge the scale of green investment. (Chien et al., 2021; Chishti and Sinha, 2022) [36,37]. For example, the United States has successfully promoted the R&D and application of clean technologies through subsidies and low-interest loans (Meltzer, 2014) [38]. Other scholars have explored the enterprise level, and studies have shown that government subsidies for research and development substantially improve the propensity and performance of energy-intensive businesses to green technologies. (Bai et al., 2019) [39]. It was further confirmed that government subsidies positively facilitate green technology innovation (Liu et al., 2020) [40]. More detailed studies have shown that the specific forms of financial subsidies also include environmental protection subsidies, talent subsidies, etc., all of which contribute to a significant boost to the transformation of green technology innovation in enterprises. For example, environmental protection subsidies directly target enterprises’ environmental protection projects and equipment, which helps enterprises reduce pollution control costs and improve environmental performance. This form of subsidy promotes enterprises’ green transformation and enhances their competitiveness in the international market. Talent is a core element of green technology innovation. By providing talent subsidies, the government attracts and cultivates high-level talent in green technology, which provides a solid talent guarantee for enterprises’ green technology innovation (Shao and Chen, 2022) [41]. Therefore, as an essential means of government intervention in the market, government fiscal expenditures can effectively mitigate the economic shock caused by carbon tariffs and promote technological innovation and green investment.
Accordingly, this paper proposes the research Hypothesis H3: CBAM will promote green technological innovation in China’s high-carbon manufacturing industries by increasing government fiscal expenditures.
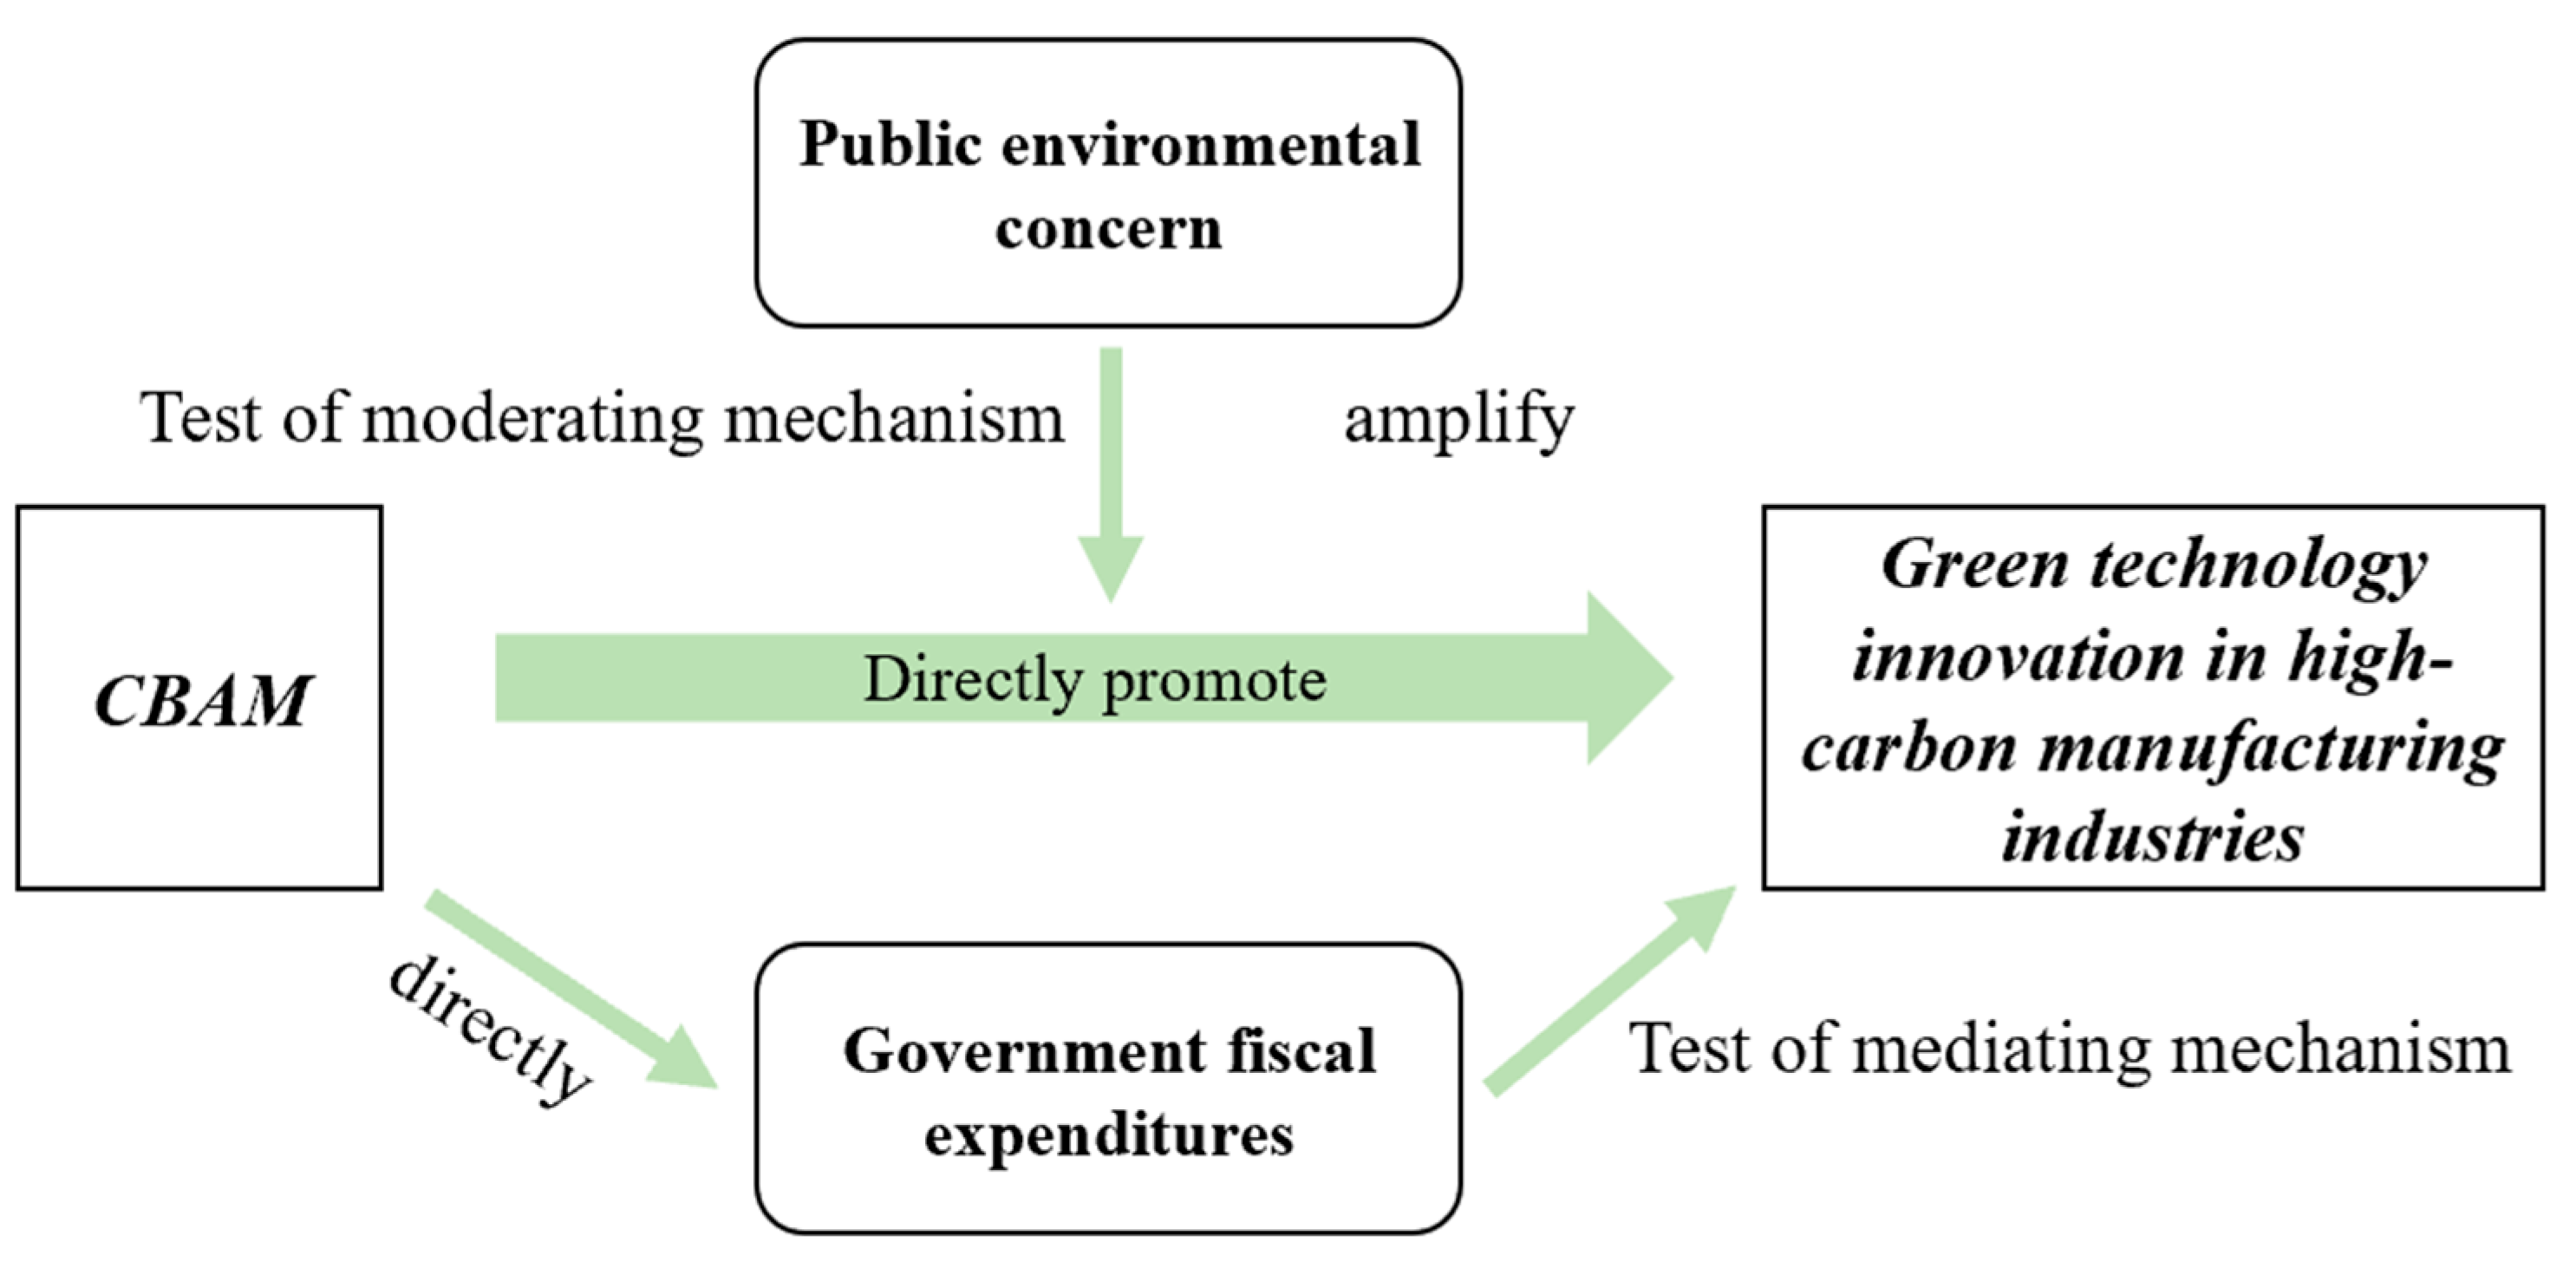
CBAM has received extensive attention from the international community as an emerging international trade policy tool in the context of global climate change and environmental governance. Academic research on the impact of carbon tariffs and green technological innovation has been relatively abundant, and it is believed that: 1. Carbon tariffs will increase export costs and directly promote green technological innovation; 2. Carbon tariffs will attract the attention of the governments of exporting countries and formulate corresponding policies to provide financial support from the government; 3. Carbon tariffs will trigger the public’s environmental concern and enhance green technological innovation. However, there is little research on the impact of CBAM on green technology innovation in high-carbon manufacturing industries in China. In the following section, this paper will investigate the effects, paths, and heterogeneity of CBAM on green technology innovation in China’s high-carbon manufacturing industries. Finally, based on the empirical results, practical policy recommendations are proposed. The specific research framework diagram is as Figure 1:

3. Green Technology Innovation Patents in High-Carbon Manufacturing Industries

Based on the relevant industries to be managed by the end of 2026 in CBAM, this paper identifies China’s high-carbon manufacturing industries, mainly steel, nonferrous metals, cement, and petrochemicals. Selected from the incoPat Patent Database jointly developed by the European Patent Office and the United States Patent and Trademark Office, the Y02P Classification (Green Manufacturing Technology patents) in the Cooperative Patent Classification (CPC) database is used as a green technology innovation patent in manufacturing. According to the corresponding industry codes of steel, nonferrous, cement, and petrochemical, the patent industry code sets of these four industries are selected as follows:
Steel Industry code set: [C3110, C3120, C3130, C3140];
Non-ferrous Industry code set: [C3211, C3212, C3213, C3214, C3215, C3216, C3217, C3218, C3219, C3221, C3222, C3229, C3231, C3232, C3239, C3240, C3251, C3252, C3253, C3254, C3259];
Cement Industry Code Set: [C3011, C3021, C3022, C3023, C3024, C3029];
Petrochemical Industry Code Set: [C2511, C2519, C2611, C2612, C2613, C2614, C2619].
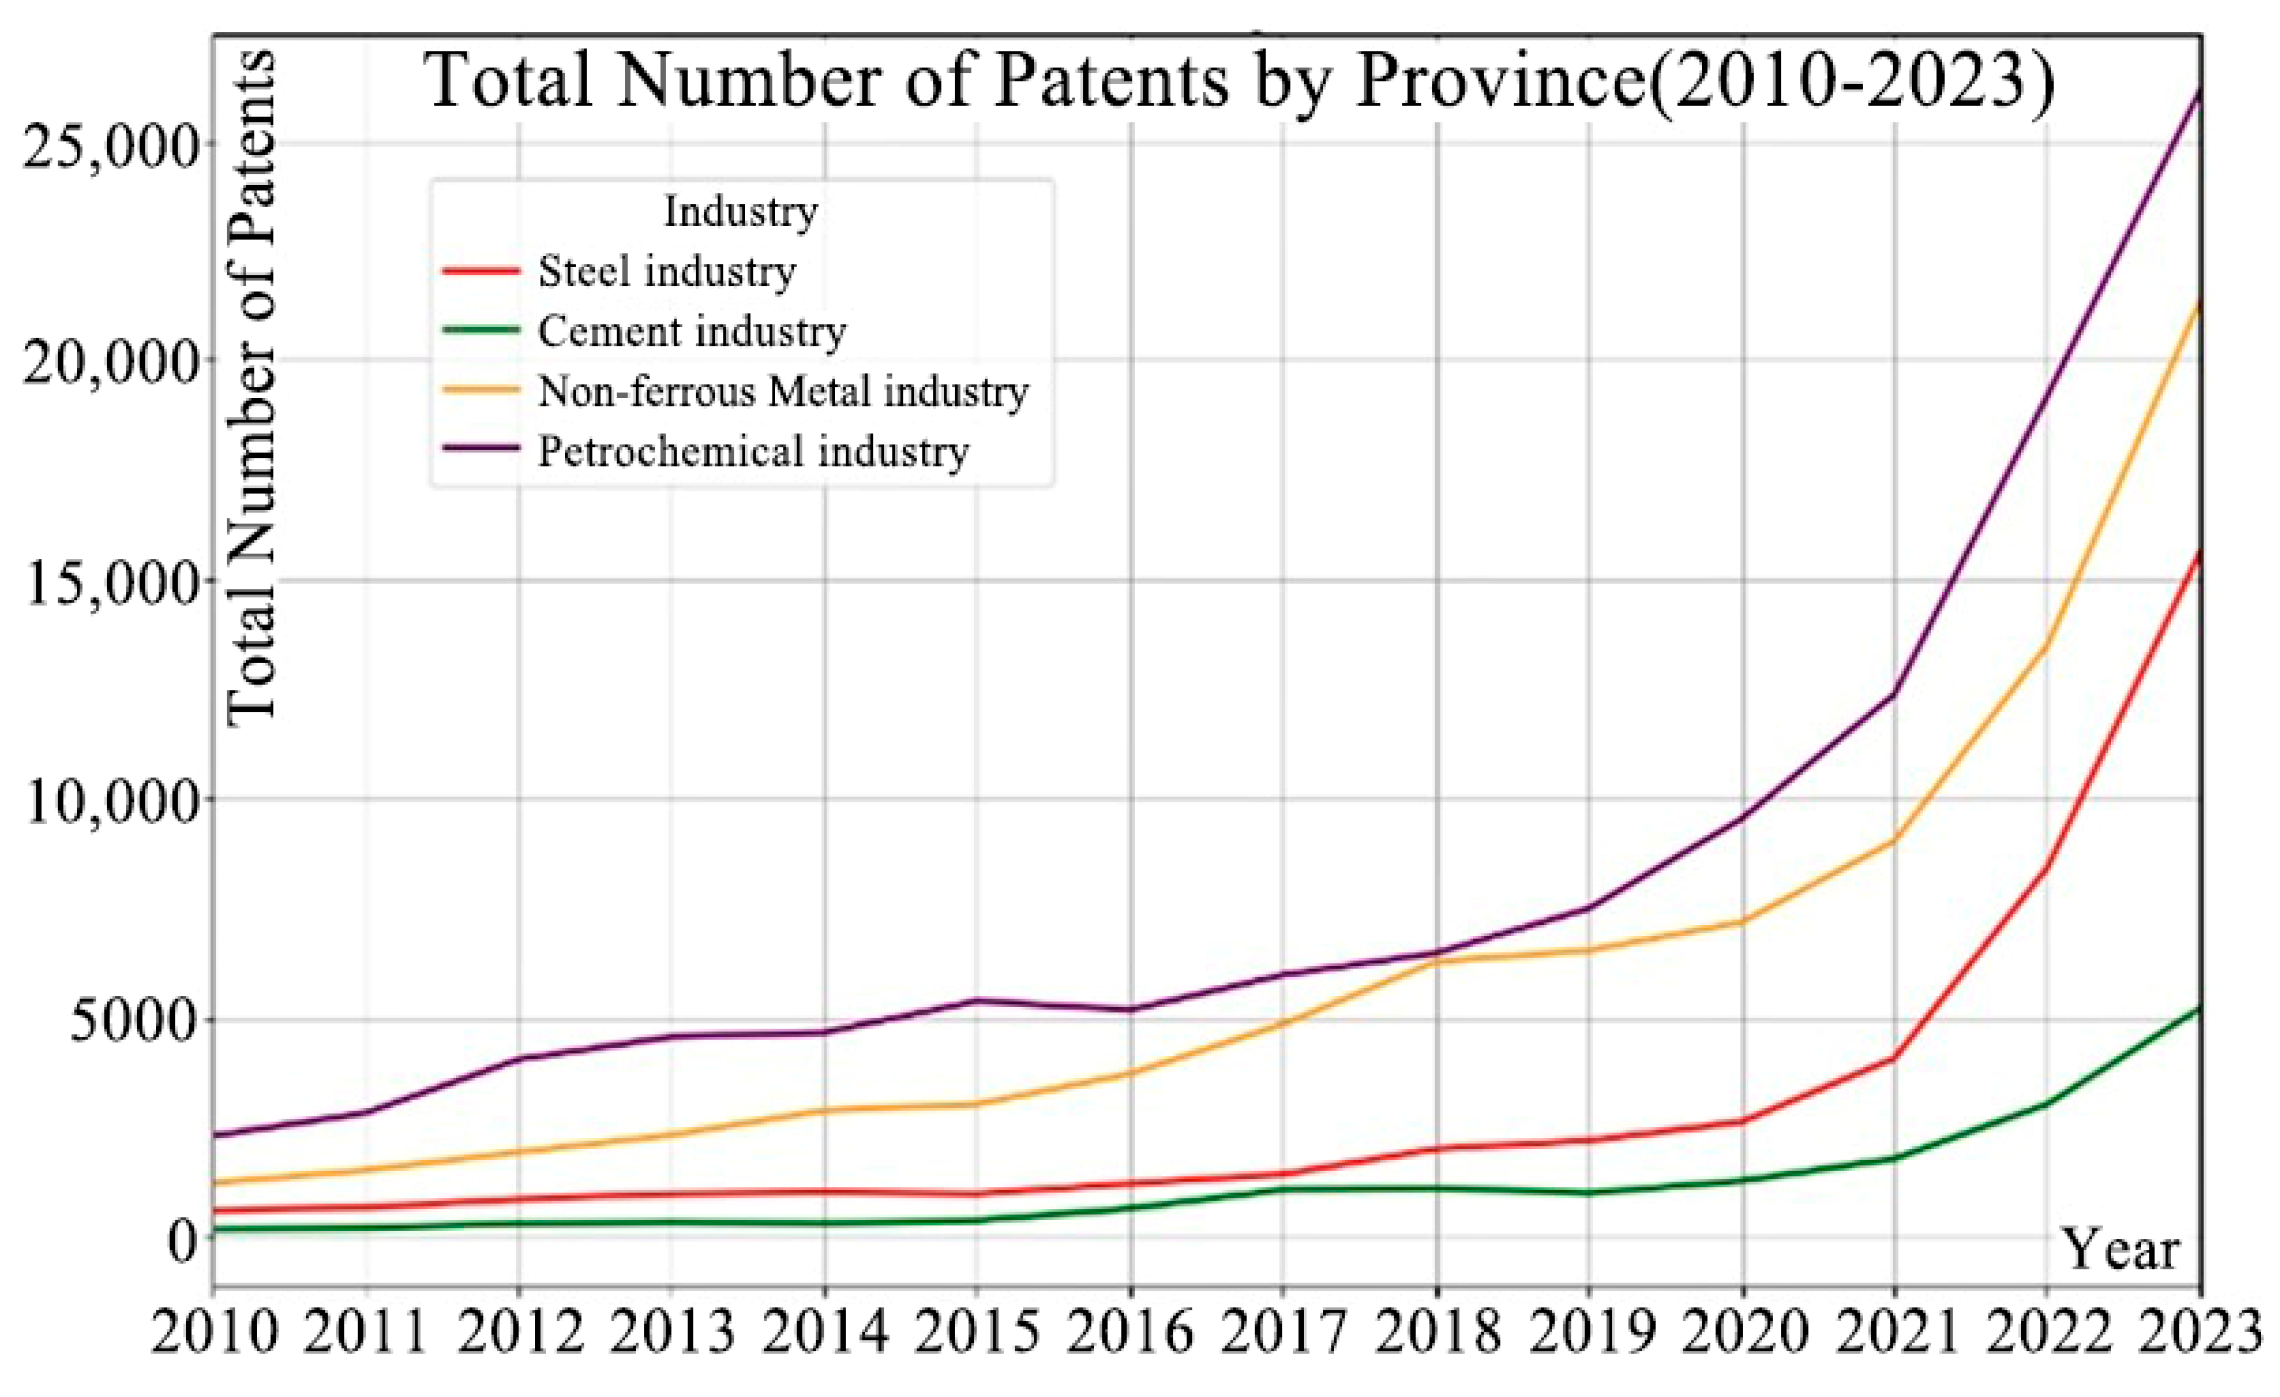
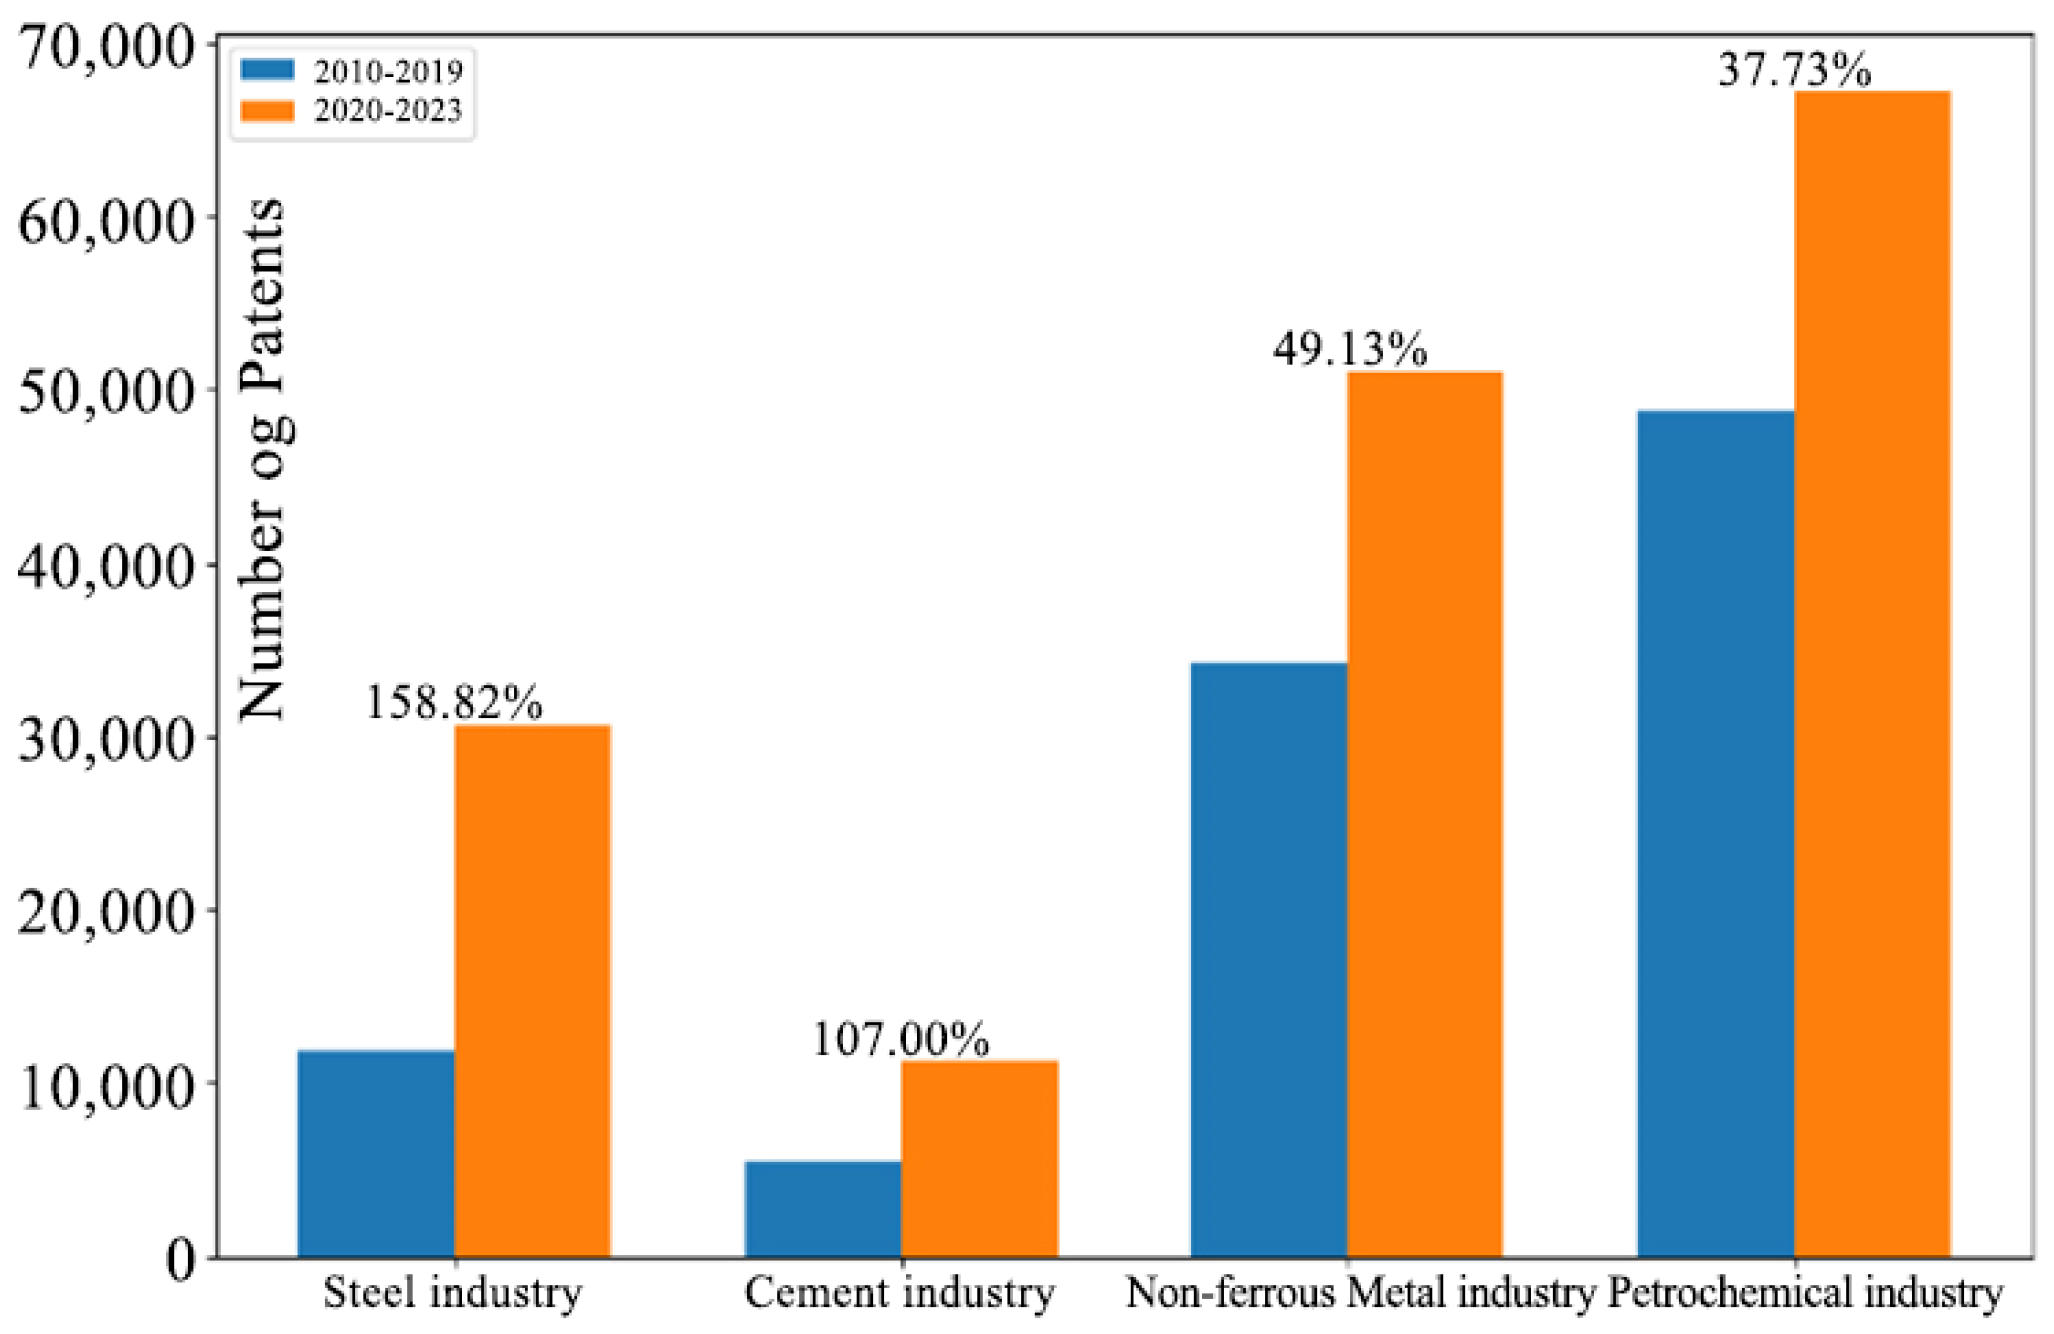
Python 2.10 was used to identify 1,302,559 patent families of Y02P in four high-carbon manufacturing industries from 260,628 patent families of one type and match them according to regions and industries to get the annual number of patent families of green technological innovations in different high-carbon manufacturing industries in different provinces (specifically, we use the “pandas” library of Python and the “Where” statement in SQL) to facilitate the calculation. This paper takes one type of patent family as the unit of green technology innovation. The evolution of green technology innovation in the four industries over the years shows a rapid upward trend after 2020 (Figure 2), roughly corresponding to when the CBAM concept was proposed. From the comparison of the two development stages of different industries from 2010 to 2019 and from 2020 to 2023 (Figure 3), overall, green technological innovation is higher in the petrochemical and non-ferrous industries, and the steel and cement sectors are growing more rapidly. Therefore, this paper proposes Hypothesis H4: CBAM has different degrees of influence on green technology innovation in different high-carbon manufacturing industries.
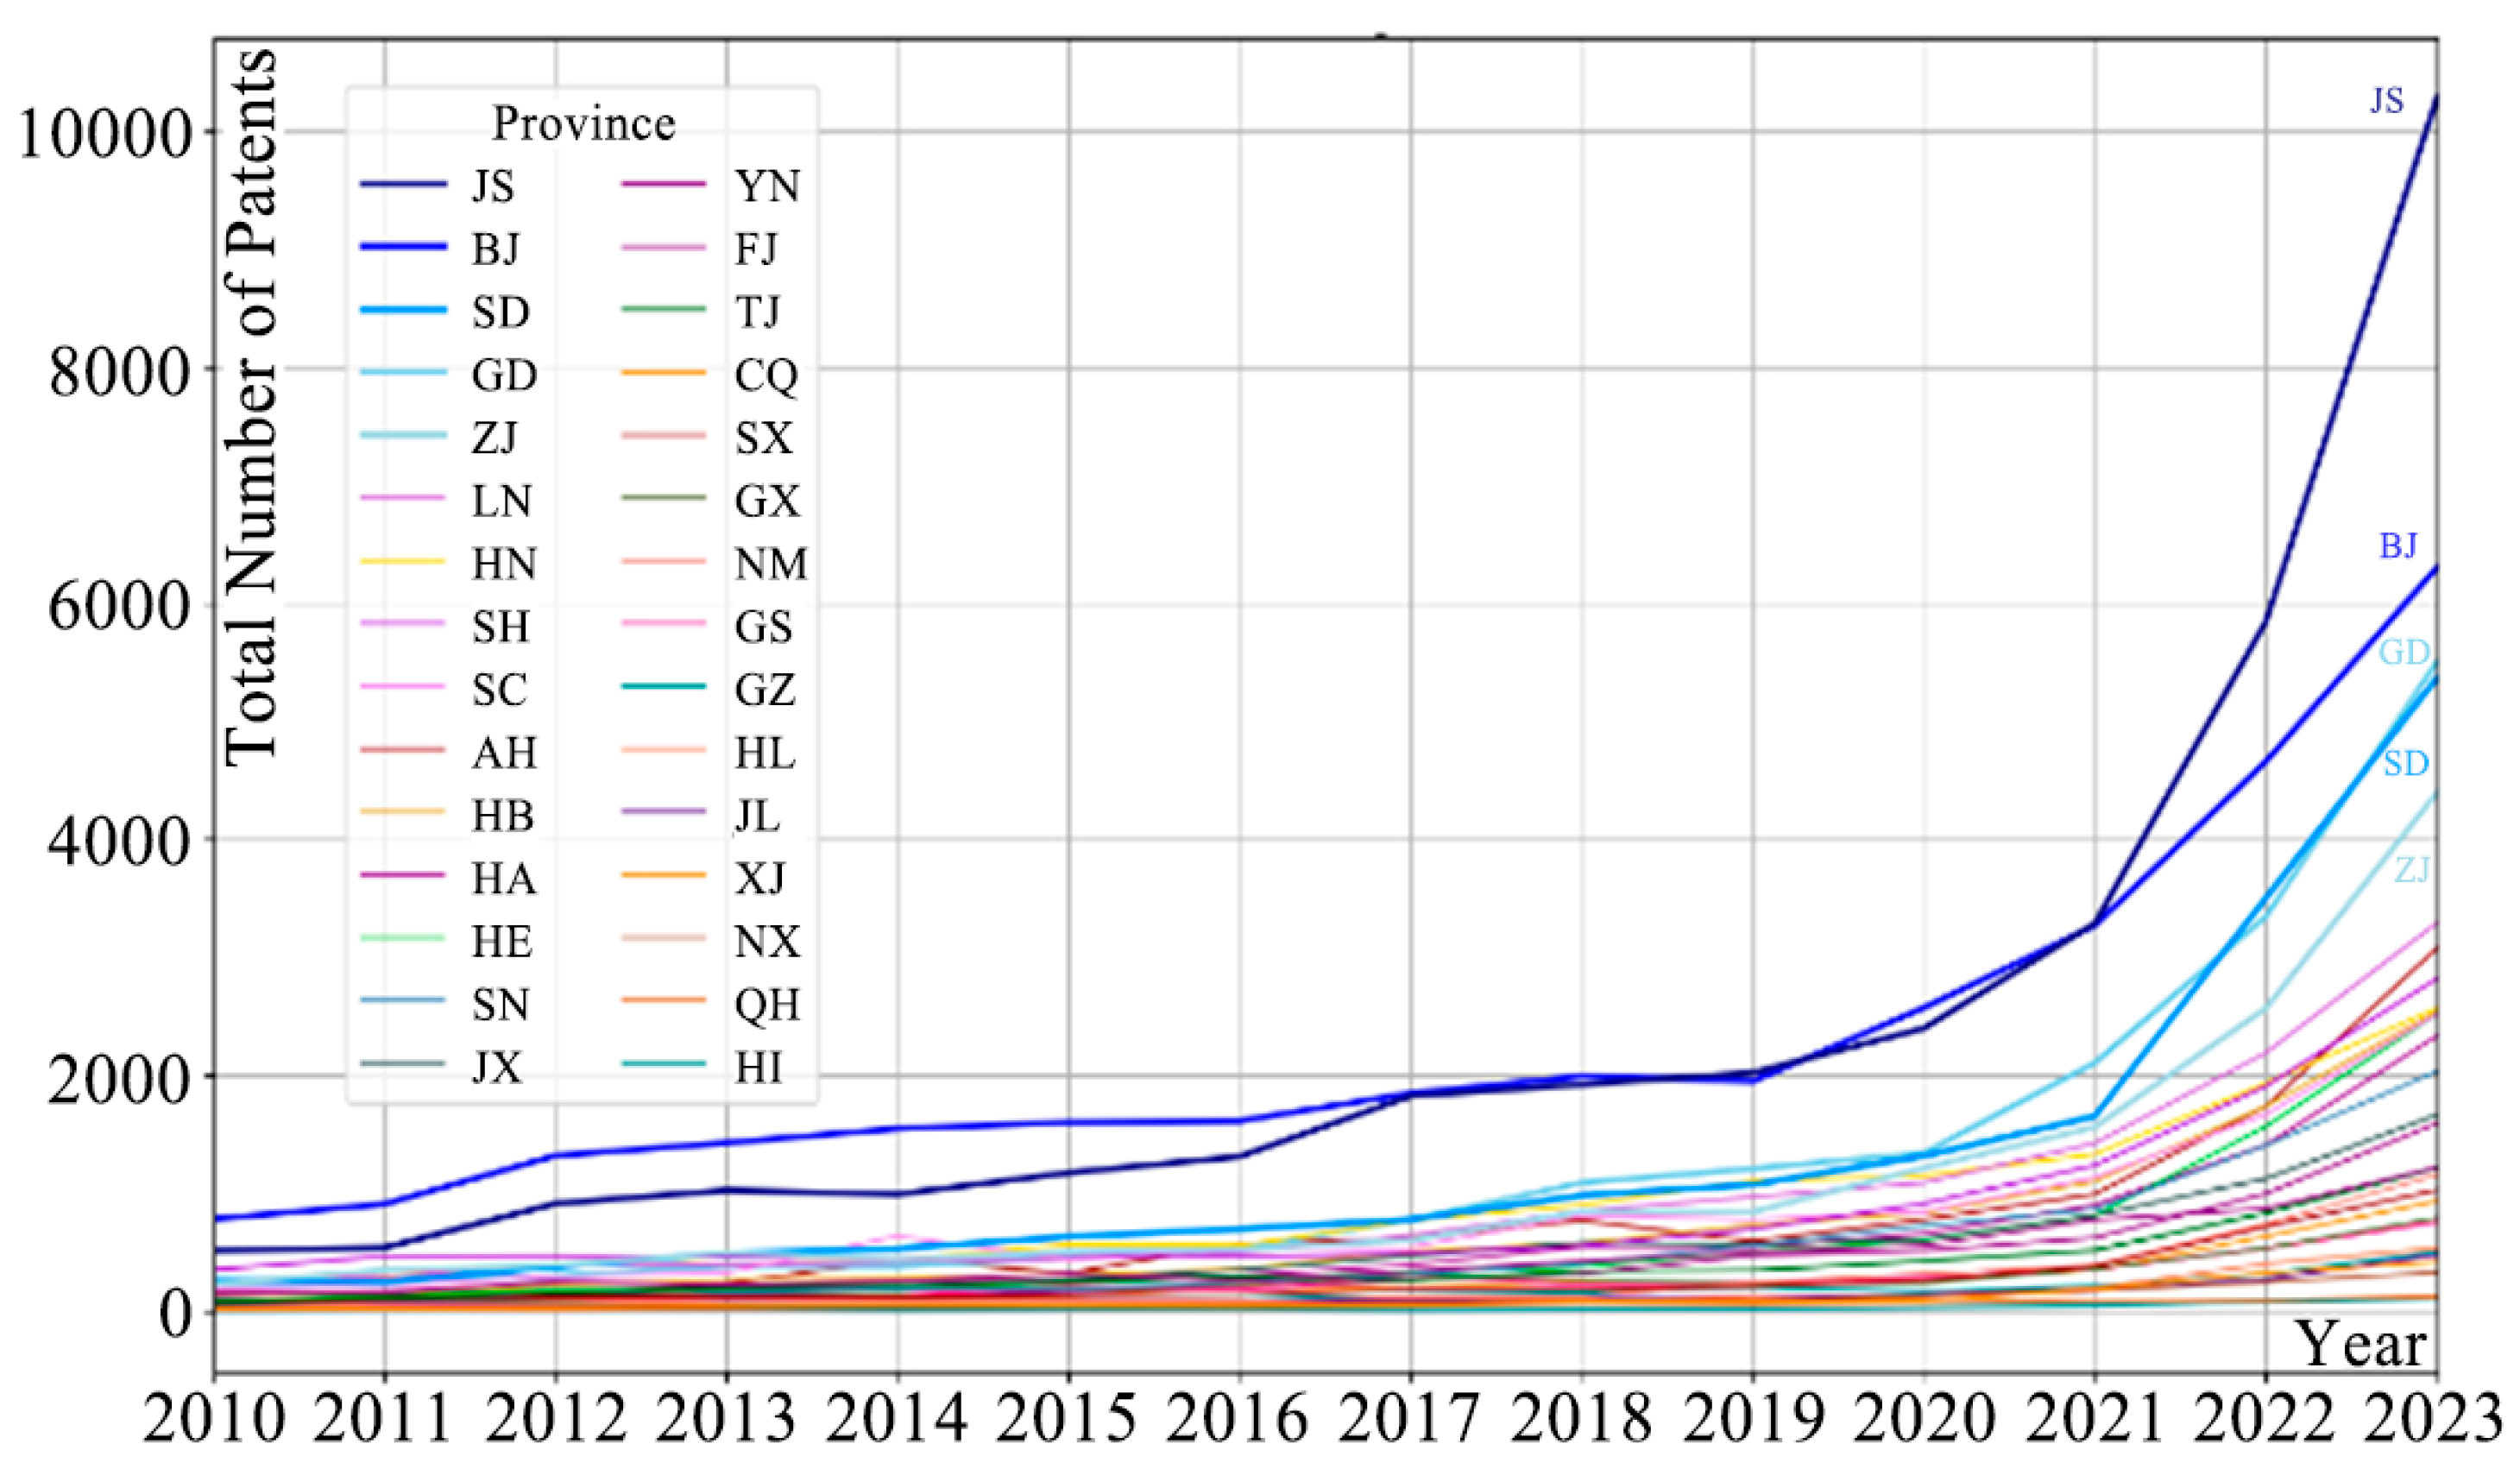
Further, this paper counts the evolutionary trend of green technology innovation in high-carbon manufacturing industries by province (Figure 4; the corresponding full names of the abbreviated provinces are shown in Table 1) and finds that the total amount (Figure 5) and the growth rate of green technology innovation in high-carbon manufacturing industries in the four eastern provinces and one city (Jiangsu, Beijing, Guangdong, Shandong, and Zhejiang) are higher than that of the other provinces. Therefore, this paper proposes Hypothesis H5: CBAM has a higher impact on eastern provinces than on central and western provinces.

4. Data and Methodology

4.1. Empirical Mode

4.1.1. DID Model

In this paper, CBAM was first formally proposed by the European Commission in December 2019 as a critical policy event on the basis of the H1 unfolding quasi-natural experiment. The high-dimension fixed-effect model and the DID method were applied to analyze the causes of the change of the GTI level in Chinese high-carbon manufacturing industries (steel, petrochemicals, non-ferrous metals, and cement), to reveal the impact effect of the CBAM in China’s high-carbon manufacturing industries on the green technological innovation. Refer to the research of previous scholars, the specific model is constructed as follows:
K G T i t = α + α 1 T r e a t × P e r i o d + δ X i t + γ i + φ t + ε i t
where i stands for the province, t stands for year, and the explanatory variable K G T stands for green technology innovation in China’s high-carbon manufacturing industries; the core explanatory variable T r e a t × P e r i o d stands for the dummy variable of CBAM; X i t is a series of control variables; γ i stands for the individual fixed effect; φ t stands for the city fixed effect; ε i t stands for the random error term. The estimated coefficient α 1 of the core explanatory variable T r e a t × P e r i o d represents the net policy effect of CBAM on green technology innovation in China’s high-carbon manufacturing industries.

4.1.2. Parallel Trend Test Model

When using the Difference-Differences method (DID) to make causal inferences, it should be satisfied that the treatment and control groups have the same development trend before the policy implementation, that is, the parallel trend hypothesis. To meet this requirement, this paper draws on the research methodology of Beck and other scholars (Beck et al., 2010) [42] to conduct a parallel trend test of the development trend of green technology innovation in high-carbon manufacturing industries in the experimental group (provinces and municipalities affected by the policy) and the control group (provinces and municipalities unaffected by the policy) before the proposal of the CBAM, with the following model:
K G T i t = α 0 + β 1 T r e a t × P e r i o d i t 6 + β 2 T r e a t P e r i o d i t 5 + + β 10 T r e a t P e r i o d i t 3 + δ X i t + γ i + φ t + ε i t
In Equation (2), T r e a t × P e r i o d denotes the year policy dummy variable set based on year t , and other variables have the same meaning as Equation (1). If there is no significant difference in the level of green technological innovation in high-carbon manufacturing industries between the treatment group and the control group before CBAM is proposed, that is, if β is not significantly different from 0, it indicates that the parallel trend test holds.

4.1.3. Test of Moderating Mechanism

According to Hypothesis H2, with the increase in public environmental concern, the positive impact of CBAM on green technology innovation in China’s high-carbon manufacturing industries is enhanced. We use the following model for regression analysis:
K G T i t = θ 0 + θ 1 T r e a t × P e r i o d × P A i t + θ 2 T r e a t × P e r i o d + θ 3 P A i t + θ 4 X i t + γ i + φ t + ε i t
In Equation (3), T r e a t × P e r i o d is a dummy variable, P A i t is a moderator variable-Public environmental concern, and X i t is a set of control variables. θ 1 and θ 2 denote the corresponding coefficients, and ε i t is the residual term.

4.1.4. Test of Mediating Mechanism

In this paper, when exploring the impact of CBAM on green technology innovation in China’s high-carbon manufacturing industries, based on Hypothesis H3: Government fiscal expenditure (Gov) is introduced as a mediating variable, and the corresponding mediating effect model is constructed, which is set as follows:
K G T i t = δ 0 + δ 1 T r e a t × P e r i o d + δ 2 X i t + γ i + φ t + ε i t
G o v i t = 0 + 1 T r e a t × P e r i o d + 2 X i t + γ i + φ t + ε i t
K G T i t = λ 0 + λ 1 T r e a t × P e r i o d + λ 2 G o v i t + λ 3 X i t + γ i + φ t + ε i t
where T r e a t × P e r i o d is a dummy variable, G o v i t is the mediating variable of government fiscal expenditure, and X i t is a set of control variables.

4.2. Data and Variables

This paper selects panel data from 30 provinces in China (excluding Tibet, Hong Kong, Macao, and Taiwan) from 2010 to 2023. The relevant data are mainly from the National Bureau of Statistics, China Statistical Yearbook, Provincial Statistical Yearbooks, China Population Statistical Yearbook, China Industrial Statistical Yearbook, General Administration of Customs, CNRDS database, Cathay Pacific database, and Global incoPat Patent Database, the missing data are made up using interpolation.

4.2.1. Independent Variable

CBAM is this paper’s core explanatory variable, represented by the dummy variable Treat × Period. According to the literature review, implementing CBAM will increase the export cost of high-carbon manufacturing industries. Therefore, this paper collects the total export trade of steel, cement, non-ferrous, and petrochemical industries in China’s provinces from 2015 to 2023, corresponding to the industry categories constrained by CBAM. Referring to the treatment method of scholars (Campello and Larrain, 2016) [43], 10 provinces and cities with export values in the top 1/3 were used as experimental groups, and Treat was the dummy variable of the treatment group. If the export value of high-carbon manufacturing industries is in the top 10, Treat = 1, and the rest as the control group, Treat = 0. The top 10 provinces with high-carbon manufacturing industries exports include Zhejiang, Jiangsu, Guangdong, Shandong, Shanghai, Fujian, Beijing, Liaoning, Hebei, and Jiangxi. The specific export value is shown in Table 2. In addition, the Period is a time dummy variable, bounded by the time 2019, when the policy began to be proposed. Considering the time lag of the policy, this paper lags the time node by one year and sets it to 2020.

4.2.2. Dependent Variable

Level of green technology innovation in high-carbon manufacturing industries (KGT). The number of authorized patents of green technology innovation reflects the investment and attention of green technology research and development to a certain extent. Referring to existing scholars’ research (Bian et al., 2019) [43], the number of patent authorizations is used to measure technological innovation. This paper uses the number of patent authorizations of the joint patent classification CPC-Y02P (green technology manufacturing) to measure the level of green technological innovation in high-carbon manufacturing industries. The previous article has elaborated on the specific data acquisition method, so it will not be repeated here.

4.2.3. Mechanism Variables

According to this paper’s hypothesis, CBAM not only directly promotes green technology innovation in high-carbon manufacturing industries by increasing export costs but also attracts the attention of exporter society and government to indirectly promote green technology innovation. This paper draws on the views of scholars such as Wu Libo (Wu et al., 2022) [44], using Baidu’s “haze” search index and “environmental pollution” search index product to open the root sign to measure the degree of public environmental concern (PA); Drawing on Li Fuzhu and other scholars (Li and Zhang, 2023) [45], fiscal expenditure as a share of GDP is used to measure the government’s financial support (GOV) in response to CBAM. Empirical evidence on the moderation and mediation of the two reveals that the former has a moderating effect and the latter has a mediating effect. Therefore, this paper regards the former as a moderating variable and the latter as a mediating variable, and the specific empirical process is described in the mechanism testing section.

4.2.4. Control Variables

This paper refers to the idea of Dong Zhiqing and other scholars (Dong and Wang, 2021) [46] and introduces the following control variables.
Industrial structure (str): This paper refers to Gan Chunhui and other scholars (Gan et al., 2011) [47] and adopts the ratio of the output value of the tertiary industry to the output value of the secondary industry as a measure of advanced industrial structure.
Economic development level (lgdp): This paper refers to Shen Jun and other scholars (Shen & Bai, 2013) [48], adopting the per capita gross national product of the region, GDP, as a measure of economic development level. In order to reduce heteroskedasticity, GDP is logarithmized.
Human capital level (hum): This paper refers to Liang Yannan and other scholars (Liang and Zhang, 2022) [49], using the number of students enrolled in general colleges and universities as a proportion of the region’s total population at the end of the year to measure the level of human capital.
Financial development level (fin): This paper refers to Sun Zao and other scholars (Sun and Hou, 2022) [50], who measure the financial development level by comparing the year-end deposit and loan balances of financial institutions to the GDP in each province.
Level of technology market development (tech): This paper refers to Ye Xiangsong and other scholars (Ye and Liu, 2018) [51], using the ratio of the total amount of technology market transactions to GDP in each province to measure the level of technology market development.
Degree of openness to the outside world (fdi): This paper refers to Chen Shiyi and other scholars (Chen and Chen, 2018) [52], using the ratio of foreign direct investment to GDP to measure the degree of openness to the outside world.
Level of industrialization (ind): This paper refers to Zhou Chaobo and other scholars (Zhou and Qin, 2020) [53], using the ratio of industrial-added value to each province’s GDP to measure the level of industrialization.
Table 3 presents the summary statistics of the main variables.

5. Empirical Results

5.1. Benchmark Regression Results Based on DID

This study employs the Difference-in-Differences (DID) method combined with a high-dimensional fixed-effects model to empirically analyze Equation (1). The primary objective is to precisely isolate the net effect of policy interventions. Specifically, it evaluates the actual impacts of the EU’s Carbon Boundary Adjustment Mechanism (CBAM) on green technological innovations within China’s high-carbon manufacturing industries, considering the complexities of the economic environment. The regression results are presented in Table 4.
The results, presented in Column 1, indicate that the regression coefficient between green technology innovation (KGT) in China’s high-carbon manufacturing industries and the CBAM policy dummy variable (treat × period, denoted as D) is 1.358. This positive coefficient suggests a potential correlation between the implementation of CBAM and increased green technology innovation in these industries. These findings provide initial support for Hypothesis 1 (H1).
In order to further validate and exclude potential other factors, this paper adds relevant control variables to the model, including industrial structure (str), economic development level (lgdp), human capital level (hum), financial development level (fin), technology market development level (tech), degree of openness to the outside world (fdi) and industrialization level (ind). The regression analysis, as shown in column (2), shows that the regression coefficient between CBAM’s policy dummy variable (D) and green technology innovation (KGT) in China’s high-carbon manufacturing industries is still positive (0.846) and significant. This indicates that Hypothesis H1 is valid, i.e., CBAM significantly promotes green technology innovation in China’s high-carbon manufacturing industries.

5.2. Result of Moderating Mechanism

From the literature review, it is clear that public environmental concern, as a social ideology, will impact the effect of policy implementation. Prior studies have found that public concern moderates green technology innovation. Therefore, this paper examines the influence mechanism of public concern through the moderating effect model, and the specific results are shown in Table 5.
The results show that if the moderating effect of public environmental concern is not considered, then public environmental concern has almost no effect on green technology innovation in China’s high-carbon manufacturing industries (Table 5, Column 1: PA = −0.001). When the moderating effect of public environmental concern is considered, it is found to have a positive moderating effect (Table 5, Column 2: D*PA = 0.021).
These results indicate that public environmental concern primarily facilitates green technology innovation indirectly rather than directly. Specifically, it amplifies the impact of CBAM on innovation practices within these industries. This amplification effect suggests that increased societal attention to CBAM influences decision-makers and R&D professionals in high-carbon manufacturing sectors to prioritize green technology innovation. Consequently, these findings provide empirical support for Hypothesis 2 (H2).

5.3. Result of Mediating Mechanism

To investigate the mechanisms through which the CBAM drives green technological innovation in China’s high-carbon manufacturing sectors, this study introduces government fiscal expenditure as a mediating variable. Grounded in Hypothesis 3 and supported by existing empirical evidence, this approach systematically identifies the policy’s operational pathways.
The results are shown In Table 6: According to columns (1–3), the core test coefficients have passed the significance test, indicating a mediating effect of government financial expenditure between CBAM and green technological innovation in high-carbon manufacturing industries. This paper refers to the test method of Wen Zhonglin (Wen et al., 2004) [54] for the mediating effect and measures that the mediating effect of government financial expenditure accounts for about 10.7% (0.013*6.964/0.846). From the numerical point of view, the total effect of technology introduction on carbon emissions is 0.846, stronger than the direct effect of 0.757 in emission reduction. Combined with the coefficient of indirect effect (0.013), it is found that there is a positive correlation between CBAM and the government’s fiscal expenditure and a positive correlation between the fiscal expenditure and the green technological innovation industry of high-carbon manufacturing industries. This suggests that the Chinese government attaches great importance to the impact of CBAM on its high-carbon manufacturing industries and tries to circumvent the barriers created by CBAM by supporting green technology innovation, i.e., Hypothesis 3 holds.
Notably, when employing a one-period lag structure in analyzing the CBAM policy variable (Columns 4–6), the regression coefficients demonstrate strengthened statistical significance at the 1% level (p < 0.01), empirically demonstrating the delayed manifestation of CBAM’s regulatory effects. Thus, the government’s financial support must be laid out in advance. The empirical results pass both Sobel and Bootstrap direct (BS1) and indirect effect (BS2) tests, indicating that the mediation model is real and effective. The empirical analysis reveals two distinct mechanisms through which CBAM drives green technology innovation in China’s high-carbon manufacturing sectors. First, CBAM directly stimulates innovation by raising export costs. Second, it operates indirectly through a dual-channel framework: public environmental awareness amplifies the policy effect (positive moderation), while government financial support facilitates technology adoption (significant mediation). These interacting pathways are systematically illustrated in Figure 6.

6. Robustness Test

6.1. Shrinkage Treatment

To cope with the bias of extreme values or outliers on statistical estimation, affecting the model’s validity. In this paper, drawing on the research of scholars Wei and Zhang (2019) [55], the explanatory variables and control variables were subjected to a 1% shrinking tail treatment, aiming to reduce the disturbance of extreme values on the overall analysis results to obtain more robust estimation parameters, which makes the research results more credible, and the results are shown in Table 7.
As can be seen in Table 7, the estimated coefficient on the interaction term CBAM dummy variable D remains significantly positive at the 1% level, indicating that the baseline regression conclusions remain robust.

6.2. Parallel Trend Test

The parallel trend test is an important prerequisite for the DID model. In this paper, 2020 is taken as the base period, and the results of the parallel trend test are shown in Figure 7.
As can be seen in Figure 7, the estimated coefficients of the interaction terms for all years before the CBAM event are insignificant. In contrast, the estimated coefficients of the interaction terms after the implementation are always significantly positive. This indicates that there is no significant difference between the treatment group and the control group in each year before the implementation of the CBAM. At the same time, there is a significant difference between the treatment group and the control group in each year after the implementation, i.e., it satisfies the requirement of parallel trend hypothesis testing. Furthermore, the increasing value of the regression coefficient means that the effect of CBAM on green technology innovation in China’s high-carbon manufacturing industries is increasing year by year.

6.3. Placebo Test

This paper used a random sampling method to conduct a placebo test to examine whether the previous estimates were affected by chance or other unobservable factors. Referring to a scholarly study (Li et al., 2016) [56], the treatment group was randomly generated and sampled 500 times.
As can also be seen from the kernel density plot (Figure 8), the distribution of estimated coefficients obtained from random sampling is around zero. It cannot cover the true value of 0.8459. Therefore, the effect of the DID policy study in this paper is not obtained by chance and cannot be affected by other policies or disturbances, which verifies the robustness of the results of the benchmark regression in this paper.

6.4. PSM-DID

To address potential limitations of the difference-in-differences (DID) approach, this study implements propensity score matching DID (PSM-DID) for enhanced empirical rigor. This methodological refinement serves three critical purposes: (1) mitigating sample selection bias through matched control groups, (2) minimizing systematic pre-treatment differences between experimental and control cohorts, and (3) reducing estimation errors inherent in standard DID applications. Through this optimized framework, we rigorously evaluate CBAM’s causal impacts on green technology innovation within China’s carbon-intensive manufacturing sectors.
This study employs a two-step approach to identify comparable control units for the experimental group. Following propensity score matching (PSM), we apply double difference-in-differences (DID) analysis to the valid support range. Specifically, Logit regression is used to estimate the propensity scores, followed by kernel-based matching of all control variables. It obtains the corresponding propensity score values and matching results for each province and city, as shown in Figure 8. The propensity score matching (PSM) method is combined to more accurately identify the causal relationship between implementing CBAM and green technology innovation in China’s high-carbon manufacturing industries. Moreover, whether PSM effectively matches the experimental group with the control group needs to be determined using the balance test to test the model’s validity. If the difference in the values of the control variables taken after matching is not significant between the two groups, it means that the matching is effective, and then the PSM-DID method can continue to be used for subsequent regression analysis. The balance test results are shown in Table 8 in this paper, using the t-test to determine whether there is a systematic deviation in the values of each control variable between the two groups’ balance tests. From column (8) of Table 8, after matching, none of the control variables are significant, indicating no significant difference between the experimental and control groups’ data. Therefore, PSM achieved a more favorable result.
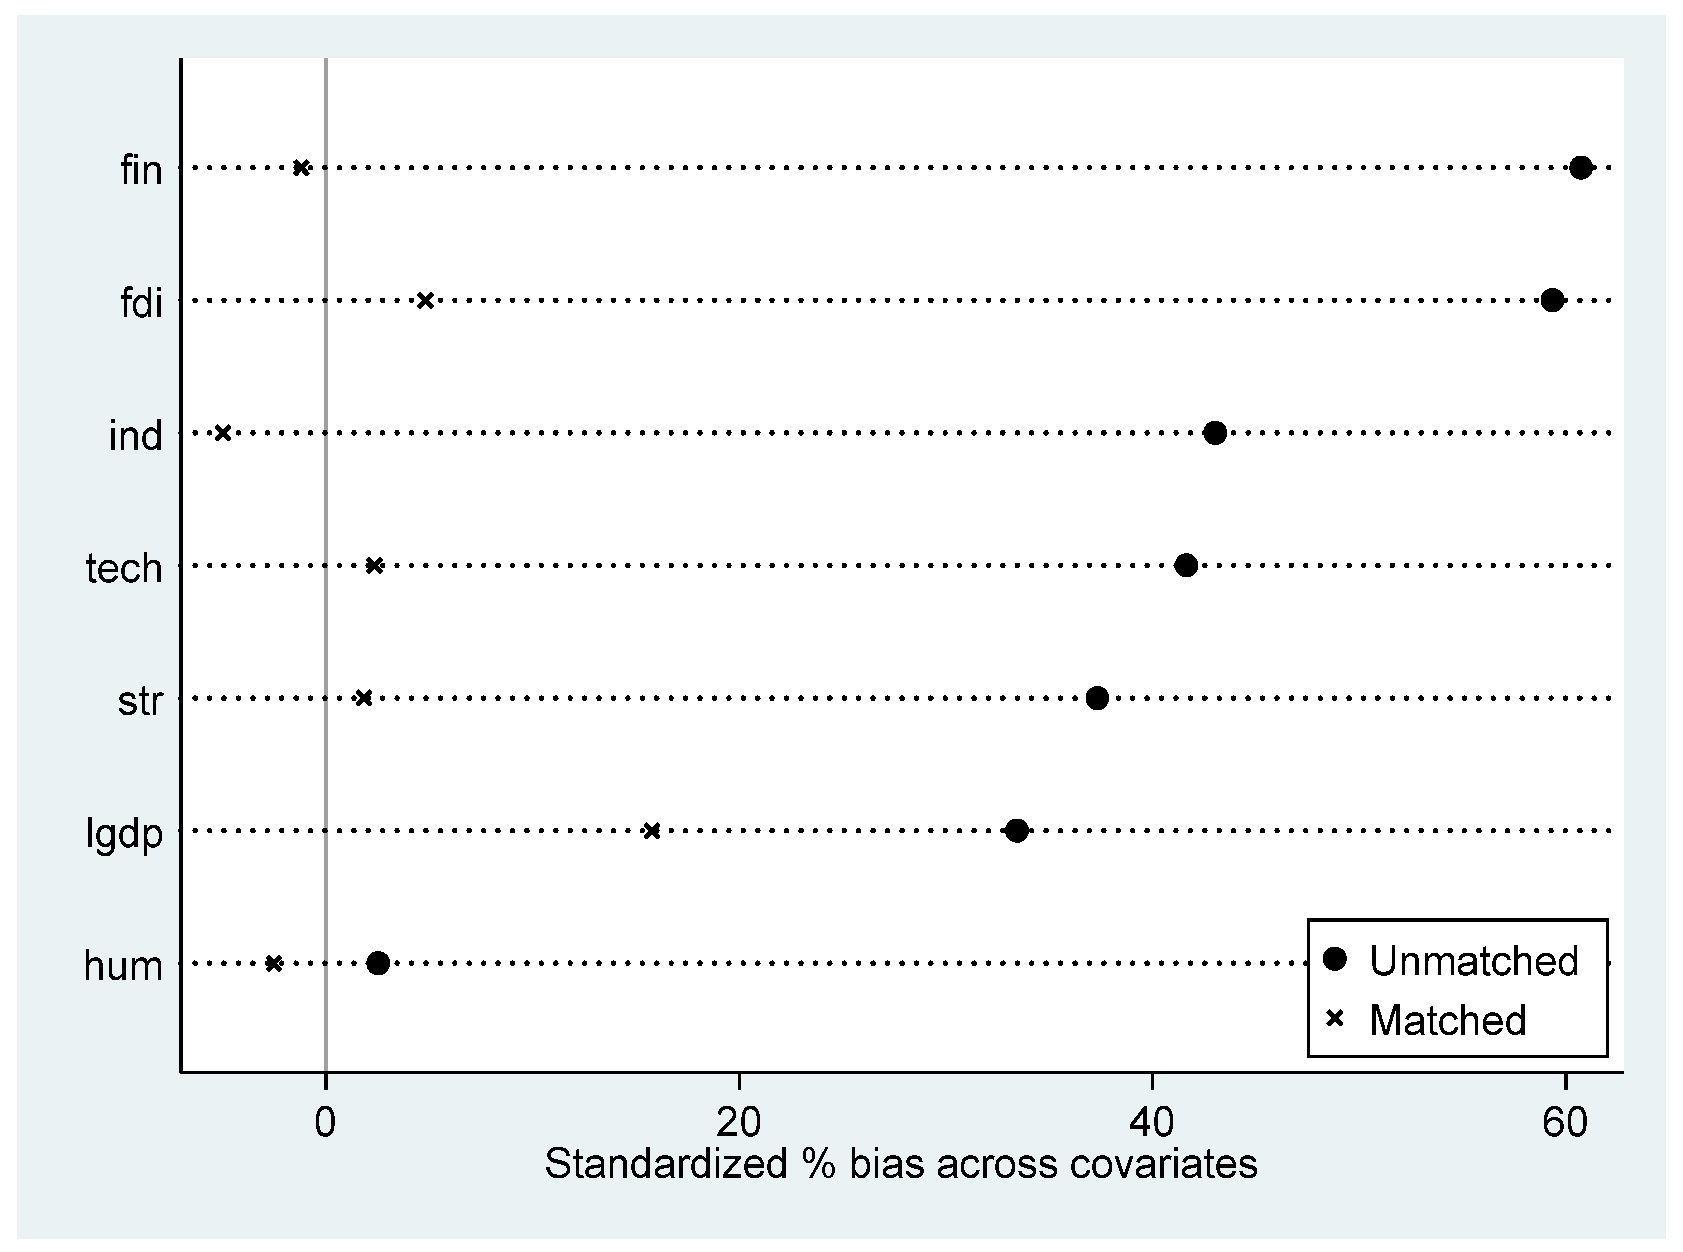
It is also important to assess the quality of the matches. To assess match quality, one can use the “psgraph” command to view a histogram of propensity scores, as detailed in Figure 9. Except for only a small number of provinces and municipalities outside the range of values (off support), most observations are within the common range of values (on support), consistent with the overlap hypothesis. It indicates that most of the samples can participate in the matching. Meanwhile, from Figure 10, most variables’ standardized bias (%bias) are significantly smaller and closer to the 0-axis after matching, indicating better balance and matching.
Further, after eliminating the samples that are not successfully matched, the remaining samples are substituted into the DID regression model for parameter estimation, which is conducive to mitigating the problem of selection bias in the baseline regression and can also be further compared with the baseline regression results to test its robustness. On this basis, the PSM-DID model can be empirically demonstrated, and the results are detailed in Table 9. As seen from Table 9, the coefficient of the interaction term D is 0.514 and significant, which is consistent with the baseline estimation results: it indicates that the CBAM significantly improves the level of green technological innovation in high-carbon manufacturing industries.

6.5. Instrumental Variable Method

To alleviate the endogeneity problem caused by the possible existence of reverse causality, this paper, based on data availability, refers to scholars (He and Zhang, 2024) [57] who selected the interaction term between whether each province or city was a trading port in modern times and the year as an instrumental variable. Further endogeneity tests were carried out on the basic model, and the results are shown in Table 10.
The results of the two-stage regression based on instrumental variables are reported in columns (2) and (3) in Table 10, respectively. The first stage regression results show that the estimated coefficients of the instrumental variables are significant at the 1% level, i.e., consistent with correlation. The second-stage regression results show that the estimated coefficients of the interaction terms are significantly positive at the 5% level. Moreover, we report the Kleibergen–Paap rk LM statistic to test the identification of the instrumental variables. It was found that the results of Kleibergen–Paap rk LM were significant. The results indicate that after further alleviating the endogeneity problem, CBAM still significantly enhances the green technology innovation level of China’s high-carbon manufacturing industries.

7. Heterogeneity Analysis

7.1. Analysis of Industry Heterogeneity

Based on H4, this paper launches an industry heterogeneity analysis for four industries: steel, cement, nonferrous, and petrochemical. The results are shown in Table 11, which shows that CBAM significantly promotes green technology innovation activities in these industries, but the impact effect presents industry differences.

7.2. Analysis of Regional Heterogeneity

Based on H5, this paper unfolds the regional heterogeneity analysis based on the benchmark regression. According to the research of Shen Xiaobo and other scholars (Shen et al., 2021) [58], Chinese provinces and cities are divided into two sub-samples of eastern and central-western regions and grouped into regressions (of which the eastern region includes Beijing, Tianjin, Hebei, Liaoning, Shanghai, Jiangsu, Zhejiang, Fujian, Shandong, Guangdong, and Hainan).
The results show that from column (1) of Table 12, in the eastern region, the coefficient of influence of CBAM on the level of green technological innovation is 0.964 and significant, indicating that CBAM has a significant positive role in promoting green technological innovation in the eastern region; similarly, from column (2), it can be seen that in the central and western regions, the coefficient of influence of CBAM on green technological innovation is 0.172 and significant. To ensure that the heterogeneity is absolute, this paper selects the Chow test to identify the heterogeneity between groups and pass the test. The empirical results demonstrate significant geographic disparity in CBAM’s innovation impacts across China’s manufacturing regions. Specifically, regression coefficient comparisons reveal stronger policy responsiveness in eastern provinces (β = 0.42, p < 0.01) compared to central (β = 0.18, p < 0.05) and western regions (β = 0.09, p > 0.1).

8. Conclusions and Policy Recommendations

8.1. Conclusions

This paper quantitatively analyzes the impact of CBAM on green technology innovation in China’s high-carbon manufacturing industry, using panel data from 30 provinces and cities in China (excluding Tibet, Hong Kong, Macao, and Taiwan) from 2010 to 2023. The DID method and high-dimensional fixed-effect model were used for analysis. The results are as follows:
Firstly, CBAM will significantly promote green technology innovation in China’s high-carbon manufacturing industries. With the increasing global emphasis on environmental protection and sustainable development, China, as a responsible power, has been actively promoting the development of a green economy and technological innovation in high-carbon manufacturing industries. After CBAM was put forward, the increase in green technological innovation in high-carbon manufacturing industries has accelerated significantly.
Secondly, public environmental concern positively moderates CBAM’s promotion of green technology innovation. The introduction of the CBAM intensified public environmental concerns in China’s high-carbon manufacturing sectors. This heightened awareness subsequently amplified policymakers’ focus on green technological innovation within these industries. Due to the increasing awareness of green consumption, low-carbon transition has become the mainstream trend of social development, which enhances the sensitivity of China’s high-carbon manufacturing industries to CBAM. Company leaders are glad to invest more resources in green technological innovations and form more green technological innovations.
Thirdly, government financial expenditures mediate CBAM to promote green technology innovation. After CBAM was proposed, the Chinese government introduced corresponding financial support policies and provided effective financial support for technology research and development, scientific and technological demonstration, and market promotion of green technological innovation. Thus, it provides enough power for the green technological innovation of China’s high-carbon manufacturing industries, stimulates their vitality, and guarantees the continuous improvement of their green technological innovation.
Fourthly, the eastern region’s petrochemical and non-ferrous industries are more significantly affected by CBAM. As the eastern region, including China’s major economically developed provinces, has a prosperous foreign trade business, the corresponding response to CBAM is more obvious. The region can adapt to CBAM more quickly, adjust production and trade strategies, and increase investment in green technology innovation, thus enhancing the level of green technology innovation. Due to more patents in the petrochemical and non-ferrous industries and fewer patents in the steel and cement industries, green technology innovations in the petrochemical and non-ferrous industries are more significantly affected by CBAM than the steel and cement industries.

8.2. Policy Recommendations

On the basis of the above conclusions, the study makes the following policy recommendations:
First, China should promote green technology innovation in high-carbon industries. Implementing CBAM has undoubtedly caused a certain degree of impact on China’s export trade, making China’s export products in high-carbon manufacturing industries face higher costs and market access thresholds. However, it also provides an opportunity for China to break down the trade barriers brought by CBAM through green technological innovation and realize the optimization and upgrading of the economic structure and sustainable development. Meanwhile, China needs to proactively negotiate with the European Union to understand the specific requirements and impacts of CBAM. Adhering to the principle of “common but differentiated responsibilities”, the government should make CBAM as beneficial as possible to the export of products from China’s high-carbon manufacturing industry.
Second, the government needs to increase financial support for green technology innovation. By setting up special funds to support key technology research and development and providing tax exemptions or incentives, the government should try to reduce the cost of innovation for enterprises and increase subsidies for green technology demonstration projects and industrialization applications. Furthermore, the government should optimize the fiscal expenditure structure to ensure that funds are precisely invested in the green technology innovation areas. Through in-depth analysis of industry characteristics and technology development trends, differentiated support policies should be formulated to maximize policy effects. Enterprises should develop new green and low-carbon technologies and products, apply for green manufacturing enterprises, and carry out industrial product green design demonstrations to enhance their international competitiveness.
Third, the government should actively guide the public toward green and low-carbon consumption, forcing high-carbon enterprises to undergo green transformation and upgrading. Public carbon concerns play a key role in promoting green technology innovation and consumption. China can stimulate market demand by fostering public preference for green consumption, which includes strengthening green branding and promotion and promoting the formation of a green consumption culture. China can further stimulate the public’s enthusiasm for green consumption through specific incentives, such as subsidies for green products, tax incentives, and point rewards. These incentives would increase the attractiveness of green products and services and enhance their market competitiveness, thereby supporting green technological innovation. To ensure the effectiveness of these policies, comprehensive public participation channels and feedback mechanisms should be established. Through these channels, the public can fully express their opinions and suggestions, which not only improves policy transparency but also helps China better grasp the changing trends of public demand. Extensive public participation and feedback provide a real-time basis for policy adjustment and optimization, ensuring China can promptly respond to market and societal changes. In this way, the government, the public, and the market can form a synergy to jointly promote the sustainable development of green technological innovation in China’s high-carbon manufacturing industries, realizing a win-win situation for economic growth and environmental protection.
Fourth, China can strengthen policy support for low-carbon development in the central and western regions. The low-carbon development in the central and western regions is facing problems such as insufficient funding, weak technological innovation capabilities, incomplete infrastructure, low synergy effects in the industrial chain, and further improvement in the business environment. By strengthening policy support for the central and western regions, such as establishing regional special funds, providing tax incentives, and optimizing the business environment, we can encourage enterprises in the central and western regions to actively participate in innovation activities and narrow the gap with the eastern region. Meanwhile, we encourage the central and western regions to strengthen cooperation with other regions and jointly address the challenges brought by CBAM through technical exchanges, resource sharing, and other means.

Author Contributions

Conceptualization: Z.L. and L.Y.; Methodology: L.Y. and M.S.; Software: L.Y. and M.S.; Validation: Z.L., L.Y. and M.S.; Investigation: L.Y. and M.S.; Resources: Z.L.; Data curation: L.Y. and M.S.; Writing—original draft preparation: L.Y.; Writing—review and editing: Z.L. and L.Y.; Visualization: Z.L. and M.S.; Supervision: Z.L.; Project administration: Z.L. and L.Y. All authors have read and agreed to the published version of the manuscript.

Funding

This research received no external funding.

Data Availability Statement

The data are available on request.

Acknowledgments

We are grateful to the anonymous reviewers for their suggestions.

Conflicts of Interest

The authors declare no conflicts of interest.

References

  1. Berrang-Ford, L.; Ford, J.D.; Paterson, J. Are we adapting to climate change? Glob. Environ. Change 2021, 21, 25–33. [Google Scholar] [CrossRef]
  2. Hallegatte, S. Strategies to adapt to an uncertain climate change. Glob. Environ. Change 2009, 19, 240–247. [Google Scholar] [CrossRef]
  3. Overland, I.; Sabyrbekov, R. Know your opponent: Which countries might fight the European carbon border adjustment mechanism? Energy Policy 2022, 169, 113175. [Google Scholar] [CrossRef]
  4. Eicke, L.; Weko, S.; Apergi, M.; Marian, A. Pulling up the carbon ladder? Decarbonization, dependence, and third-country risks from the European carbon border adjustment mechanism. Energy Res. Soc. Sci. 2021, 80, 102240. [Google Scholar] [CrossRef]
  5. Jia, Z.J.; Wu, R.X.; Liu, Y.; Wen, S.Y.; Lin, B.Q. Can carbon tariffs based on domestic embedded carbon emissions reduce more carbon leakages? Ecol. Econ. 2024, 220, 108163. [Google Scholar] [CrossRef]
  6. Fouré, J.; Guimbard, H.; Monjon, S. Border carbon adjustment and trade retaliation: What would be the cost for the European Union? Energy Econ. 2016, 54, 349–362. [Google Scholar] [CrossRef]
  7. Antimiani, A.; Costantini, V.; Kuik, O.; Paglialunga, E. Mitigation of adverse effects on competitiveness and leakage of unilateral EU climate policy: An assessment of policy instruments. Ecol. Econ. 2016, 128, 246–259. [Google Scholar] [CrossRef]
  8. Li, W.; Liu, X.; Lu, C. Analysis of China’s steel response ways to EU CBAM policy based on embodied carbon intensity prediction. Energy 2023, 282, 128812. [Google Scholar] [CrossRef]
  9. Gu, R.; Guo, J.; Huang, Y.; Wu, X. Impact of the EU carbon border adjustment mechanism on economic growth and resources supply in the BASIC countries. Resour. Policy 2023, 85, 104034. [Google Scholar] [CrossRef]
  10. Böhringer, C.; Carbone, J.C.; Rutherford, T.F. Embodied carbon tariffs. Scand. J. Econ. 2018, 120, 183–210. [Google Scholar] [CrossRef]
  11. Perdana, S.; Vielle, M. Making the EU Carbon Border Adjustment Mechanism acceptable and climate friendly for least developed countries. Energy Policy 2022, 170, 113245. [Google Scholar] [CrossRef]
  12. Yue, T.; Tong, J.; Qiao, Y.B.; Chen, L.J. Carbon governance or trade gaming: China’s approach to addressing the EU’s carbon border adjustment mechanism. J. Clean. Prod. 2024, 484, 144359. [Google Scholar] [CrossRef]
  13. Lin, B.; Li, A. Impacts of carbon motivated border tax adjustments on competitiveness across regions in China. Energy 2011, 36, 5111–5118. [Google Scholar] [CrossRef]
  14. Zhong, J.; Pei, J. Beggar thy neighbor? On the competitiveness and welfare impacts of the EU’s proposed carbon border adjustment mechanism. Energy Policy 2022, 162, 112802. [Google Scholar] [CrossRef]
  15. Li, J.F.; Wang, X.; Zhang, Y.X. Is it in China’s interest to implement an export carbon tax? Energy Econ. 2012, 34, 2072–2080. [Google Scholar] [CrossRef]
  16. Jones, C.I. R & D-based models of economic growth. J. Political Econ. 1995, 103, 759–784. [Google Scholar]
  17. Ghosh, M.; Luo, D.; Siddiqui, M.S.; Zhu, Y. Border tax adjustments in the climate policy context: CO2 versus broad-based GHG emission targeting. Energy Econ. 2012, 34, 154–167. [Google Scholar] [CrossRef]
  18. Krass, D.; Nedorezov, T.; Ovchinnikov, A. Environmental taxes and the choice of green technology. Prod. Oper. Manag. 2013, 22, 1035–1055. [Google Scholar] [CrossRef]
  19. Cheng, Y.; Sinha, A.; Ghosh, V.; Sengupta, T.; Luo, H. Carbon tax and energy innovation at crossroads of carbon neutrality: Designing a sustainable decarbonization policy. J. Environ. Manag. 2021, 294, 112957. [Google Scholar] [CrossRef]
  20. Åhman, M.; Nilsson, L.J.; Johansson, B. Global climate policy and deep decarbonization of energy-intensive industries. Clim. Policy 2017, 17, 634–649. [Google Scholar] [CrossRef]
  21. Ahmed, Z.; Ahmad, M.; Murshed, M.; Shah, M.I.; Mahmood, H.; Abbas, S. How do green energy technology investments, technological innovation, and trade globalization enhance green energy supply and stimulate environmental sustainability in the G7 countries? Gondwana Res. 2022, 112, 105–115. [Google Scholar] [CrossRef]
  22. Yu, C.Y.; Long, H.Y.; Zhang, X.; Tan, Y.F. The interaction effect between public environmental concern and air pollution: Evidence from China. J. Clean. Prod. 2023, 391, 136231. [Google Scholar] [CrossRef]
  23. Marquis, C.; Raynard, M. Institutional strategies in emerging markets. Acad. Manag. Ann. 2015, 9, 291–335. [Google Scholar] [CrossRef]
  24. Fritsche, I.; Jonas, E.; Kayser, D.N.; Koranyi, N. Existential threat and compliance with pro-environmental norms. J. Environ. Psychol. 2010, 30, 67–79. [Google Scholar] [CrossRef]
  25. Zhang, S.P.; Cheng, L.; Ren, Y.; Yao, Y. Effects of carbon emission trading system on corporate green total factor productivity: Does environmental regulation play a role of green blessing? Environ. Res. 2024, 278, 118295. [Google Scholar] [CrossRef] [PubMed]
  26. Quesnel, K.J.; Ajami, N.K. Changes in water consumption linked to heavy news media coverage of extreme climatic events. Sci. Adv. 2017, 3, e1700784. [Google Scholar] [CrossRef]
  27. Zhang, H.T.; Dong, J.R.; Zhang, W.Q.; Luo, J.H. Public environmental supervision, environmental non-governmental organizations, and industrial green and low-carbon transformation. Front. Environ. Sci. 2023, 10, 1074267. [Google Scholar] [CrossRef]
  28. Johnson, T.; Lora-Wainwright, A.; Lu, J. The quest for environmental justice in China: Citizen participation and the rural-urban network against Panguanying’s waste incinerator. Sustain. Sci. 2018, 13, 733–746. [Google Scholar] [CrossRef]
  29. Zhang, G.; Deng, N.; Mou, H.; Chen, X. The impact of the policy and behavior of public participation on environmental governance performance: Empirical analysis based on provincial panel data in China. Energy Policy 2019, 129, 1347–1354. [Google Scholar] [CrossRef]
  30. Oberndorfer, U.; Schmidt, P.; Wagner, M.; Ziegler, A. Does the stock market value the inclusion in a sustainability stock index? An event study analysis for German firms. J. Environ. Econ. Manag. 2013, 66, 497–509. [Google Scholar] [CrossRef]
  31. Du, X. How the market values greenwashing? Evidence from China. J. Bus. Ethics 2015, 128, 547–574. [Google Scholar] [CrossRef]
  32. Costa-Campi, M.T.; García-Quevedo, J.; Martínez-Ros, E. What are the determinants of investment in environmental R&D? Energy Policy 2017, 104, 455–465. [Google Scholar]
  33. Zhao, L.; Zhang, L.; Sun, J.; He, P. Can public participation constraints promote green technological innovation of Chinese enterprises? The moderating role of government environmental regulatory enforcement. Technol. Forecast. Soc. Change 2022, 174, 121198. [Google Scholar] [CrossRef]
  34. Cheng, X.; Wang, W.; Chen, X.; Song, M. Carbon Tariffs and Energy Subsidies: Synergy or Antagonism? Energy 2024, 306, 132563. [Google Scholar] [CrossRef]
  35. Jiang, F.X.; Wang, Z.J.; Bai, J.H. The dual effect of environmental regulations’ impact on innovation—An empirical study based on dynamic panel data of Jiangsu manufacturing. China Ind. Econ. 2013, 7, 2013. (In Chinese) [Google Scholar]
  36. Chien, F.; Anwar, A.; Hsu, C.C.; Sharif, A.; Razzaq, A.; Sinha, A. The role of information and communication technology in encountering environmental degradation: Proposing an SDG framework for the BRICS countries. Technol. Soc. 2021, 65, 101587. [Google Scholar] [CrossRef]
  37. Chishti, M.Z.; Sinha, A. Do the shocks in technological and financial innovation influence the environmental quality? Evidence from BRICS economies. Technol. Soc. 2022, 68, 101828. [Google Scholar] [CrossRef]
  38. Meltzer, J. A carbon tax as a driver of green technology innovation and the implications for international trade. Energy LJ 2014, 35, 45. [Google Scholar]
  39. Bai, Y.; Song, S.; Jiao, J.; Yang, R. The impacts of government R&D subsidies on green innovation: Evidence from Chinese energy-intensive firms. J. Clean. Prod. 2019, 233, 819–829. [Google Scholar]
  40. Liu, J.; Zhao, M.; Wang, Y. Impacts of government subsidies and environmental regulations on green process innovation: A nonlinear approach. Technol. Soc. 2020, 63, 101417. [Google Scholar] [CrossRef]
  41. Shao, Y.; Chen, Z. Can government subsidies promote the green technology innovation transformation? Evidence from Chinese listed companies. Econ. Anal. Policy 2022, 74, 716–727. [Google Scholar] [CrossRef]
  42. Beck, T.; Levine, R.; Levkov, A. Big bad banks? The winners and losers from bank deregulation in the United States. J. Financ. 2010, 65, 1637–1667. [Google Scholar] [CrossRef]
  43. Bian, Y.C.; Wu, L.H.; Bai, J.H. Does high-speed rail improve regional innovation in China? Financ. Res 2019, 6, 132–149. (In Chinese) [Google Scholar]
  44. Wu, L.B.; Yang, M.M.; Sun, K.G. Impact of public environmental attention on environmental governance of enterprises and local governments. China Popul. Resour. Env. 2022, 32, 1–14. (In Chinese) [Google Scholar]
  45. Li, F.Z.; Zhang, X.R. The green and low-carbon development effect of China’s new energy demonstration cities. Ziyuan Kexue 2023, 45, 1590–1603. (In Chinese) [Google Scholar] [CrossRef]
  46. Dong, Z.Q.; Wang, H. Validation of Market-based Environmental Policies: Empirical Evidence from the Perspective of Carbon Emission Trading Policies. Stat. Res. 2021, 38, 48–61. (In Chinese) [Google Scholar]
  47. Gan, C.H.; Zheng, R.G.; Yu, D.F. An empirical study on the effects of industrial structure on economic growth and fluctuations in China. Econ. Res. J. 2011, 46, 4–16. (In Chinese) [Google Scholar]
  48. Shen, J.; Bai, Q.X. China’s Efficiency of Financial System and Financial Scale. J. Quant. Tech. Econ. 2013, 30, 35–50. (In Chinese) [Google Scholar]
  49. Liang, Y.N.; Zhang, C. Population Aging, Digital Economy and Optimization of China’s Industrial Structure. Inq. Into Econ. Issues 2022, 12, 114–131. (In Chinese) [Google Scholar]
  50. Sun, Z.; Hou, Y.L. How does industrial intelligence reshape the employment structure of Chinese labor force. China Ind. Econ. 2019, 5, 61–79. (In Chinese) [Google Scholar]
  51. Ye, X.S.; Liu, J. Government Support, Technology Market Development and the Efficiency of Scientific and Technological Innovation. Econ. Perspect. 2018, 7, 67–81. (In Chinese) [Google Scholar]
  52. Chen, S.Y.; Chen, D.K. Air pollution, government regulations and high-quality economic development. Econ. Res 2018, 53, 20–34. (In Chinese) [Google Scholar]
  53. Zhou, C.B.; Qin, Y. The Impact of a Carbon Trading Pilot Policy on the Low-Carbon Economic Transformation in China—An Empirical Analysis Based on a DID Model. Soft Sci 2020, 34, 36–42+55. (In Chinese) [Google Scholar]
  54. Wen, Z.; Chang, L.; Hau, K.T.; Liu, H. Testing and application of the mediating effects. Acta Psychol. Sin. 2004, 36, 614. (In Chinese) [Google Scholar]
  55. Wei, Y.; Zhang, H. Will import liberalization increase China’s export domestic value added ratio: A re-estimation based on the gross export accounting framework. China Ind. Econ. 2019, 3, 24–42. (In Chinese) [Google Scholar]
  56. Li, P.; Lu, Y.; Wang, J. Does flattening government improve economic performance? Evidence from China. J. Dev. Econ. 2016, 123, 18–37. [Google Scholar] [CrossRef]
  57. He, W.W.; Zhang, Y.B. Does Trade Opening Promote the Urban-rural Common Prosperity?—Empirical Evidence from Cities at Prefecture Level and Above in China. South China J. Econ. 2024, 6, 57–76. (In Chinese) [Google Scholar]
  58. Shen, X.B.; Chen, Y.; Lin, B.Q. The Impacts of Technological Process and Industrial Structure Distortion on China’s Energy Intensity. Econ. Res. J. 2021, 56, 157–173. (In Chinese) [Google Scholar]
Figure 1. Research framework diagram.
Sustainability 17 02305 g001
Figure 2. Number of green technology innovation patents in China’s high-carbon manufacturing industries.
Sustainability 17 02305 g002
Figure 3. Number of patents in the two phases, 2010–2019 and 2020–2023.
Sustainability 17 02305 g003
Figure 4. Evolutionary trend of green technology innovation in China’s high-carbon manufacturing industries by province.
Sustainability 17 02305 g004
Figure 5. Total distribution of green technology innovation patents in China’s high-carbon manufacturing industries by provinces in 2023.
Sustainability 17 02305 g005
Figure 6. Impact pathway diagram.
Sustainability 17 02305 g006
Figure 7. Parallel trend test plot.
Sustainability 17 02305 g007
Figure 8. Randomized sample of placebo test results.
Sustainability 17 02305 g008
Figure 9. Histogram of propensity score matching.
Sustainability 17 02305 g009
Figure 10. Plot of standardized deviation of control variables.
Sustainability 17 02305 g010
Table 1. Abbreviations and full names of provinces.
JS—JiangsuBJ—BeijingSD—ShandongGD—GuangdongZJ—Zhejiang
LN—LiaoningHN—HunanSH—ShanghaiSC—SichuanAH—Anhui
HB—HubeiHA—HenanHE—HebeiSN—ShaanxiJX—Jiangxi
YN—YunnanFJ—FujianTJ—TianjinCQ—ChongqingSX—Shanxi
GX—GuangxiNM—Inner MongoriaGS—GansuGZ—GuizhouHL—Heilongjiang
JL—JilinXJ—XinjiangNX—NingxiaQH—QinghaiHI—Hainan
Data source: Announcement No. 7 of 2018 of the Ministry of Industry and Information Technology of the People’s Republic of China.
Table 2. Top 10 provinces of China’s key industries in terms of export value (in billions of USD).
ProvZJJSGDSDSHFJBJLNHEJX
Exports in 2023919.1745.1710.7675.3374.1265.9418.8143.7143.9144.6
Total exports 2015–20235540.15441.54906.94570.82577.62046.82032.61417.91191.1874.3
Data source: General Administration of Customs of the People’s Republic of China, industry associations.
Table 3. Summary statistics.
VarNameObsMeanSDMinMedianMax
kgt4200.62050.9830.000.2910.29
D4200.09520.2940.000.001.00
str4201.23500.6930.351.085.30
lgdp4209.79540.9726.959.9111.82
ind4200.32670.0840.100.330.58
hum4200.02130.0060.010.020.04
tech4200.01840.031-0.050.010.17
fin4203.27341.1451.523.068.13
fdi4201.86381.6260.001.6212.42
gov4200.23660.1010.080.220.64
PA420131.758173.8975.02121.51417.37
Table 4. Benchmark regression results.
(1)(2)
KGTKGT
D1.358 ***0.846 ***
(0.349)(0.238)
str −0.643 ***
(0.176)
lgdp −0.154 ***
(0.051)
ind −2.964 ***
(1.034)
hum −90.987 **
(36.509)
tech 7.468 **
(2.975)
fin 0.118
(0.130)
fdi −0.039
(0.024)
provYY
yearYY
_cons0.491 ***5.291 ***
(0.033)(1.117)
N420420
r20.7710.823
ar20.7450.800
Notes: Standard errors in parentheses. **, and *** respectively represent significance at the 5%, and 1% levels.
Table 5. Regression results of the moderating effect of public environmental concern.
(1)(2)
GTKGT
D0.808 ***0.565 ***
(0.238)(0.153)
PA−0.001 **0.002
(0.001)(0.001)
D × PA 0.021 **
(0.009)
str−0.617 ***−0.682 ***
(0.177)(0.183)
lgdp−0.166 ***−0.116 ***
(0.051)(0.038)
ind−2.873 ***−2.993 ***
(1.036)(0.924)
hum−90.263 **−64.460 *
(36.191)(31.716)
tech7.389 **6.476 **
(3.006)(2.874)
fin0.1090.155
(0.126)(0.120)
fdi−0.036−0.047 *
(0.025)(0.024)
provYY
yearYY
_cons5.538 ***4.065 ***
(1.113)(1.027)
N420420
dj. R20.8000.831
Notes: Standard errors in parentheses. *, **, and *** respectively represent significance at the 10%, 5%, and 1% levels, respectively.
Table 6. Regression results from the mediating effect of government fiscal expenditures.
(1)(2)(3)(4)(5)(6)
KGTGOVKGTKGTGOVKGT
D0.846 ***0.013 *0.757 ***
(0.238)(0.007)(0.232)
L.D 1.049 ***0.027 ***0.878 ***
(0.305)(0.007)(0.290)
GOV 6.964*** 6.307 ***
(1.868) (1.835)
lgdp−0.154 ***−0.005 *−0.121 **−0.105 **−0.004−0.081 *
(0.051)(0.003)(0.048)(0.041)(0.002)(0.040)
ind−2.964 ***0.014−3.061 ***−3.086 ***0.021−3.221 ***
(1.034)(0.069)(1.029)(1.031)(0.069)(1.007)
hum−90.987 **−2.056−76.668 **−94.685 **−1.756−83.611 **
(36.509)(1.646)(31.059)(37.857)(1.722)(32.980)
tech7.468 **0.1196.640 **7.616 **0.1386.743 **
(2.975)(0.163)(3.032)(3.159)(0.157)(3.209)
fin0.1180.054 ***−0.259 *0.1390.054 ***−0.203
(0.130)(0.007)(0.150)(0.136)(0.008)(0.153)
fdi−0.0390.000−0.040 *−0.0360.000−0.037
(0.024)(0.002)(0.023)(0.023)(0.002)(0.022)
prov
year
YYYYYY
_cons5.291 ***0.138 ***4.332 ***4.884 ***0.117 **4.146 ***
(1.117)(0.043)(1.020)(1.041)(0.043)(0.988)
Sobel Z4.362 ***
Bootstrap
_bs_1(BC)95% conf. interval
Bootstrap
_bs_2(BC)95% conf. interval
[0.1484–0.3068]
[1.1421–2.0491]
N420420420390390390
adj. R20.7990.9650.8160.8080.9670.820
Notes: Standard errors in parentheses. *, **, and *** respectively represent significance at the 10%, 5%, and 1% levels, respectively.
Table 7. Robustness test results for the reduced-tail treatment.
(1)
KGT_w
D0.807 ***
(0.199)
str_w−0.537 ***
(0.159)
lgdp_w−0.145 ***
(0.039)
ind_w−2.524 ***
(0.825)
hum_w−67.205 **
(25.899)
tech_w7.480 **
(3.097)
fin_w0.050
(0.079)
fdi_w−0.027
(0.027)
provY
yearY
_cons4.607 ***
(0.762)
N420
r20.879
ar20.862
Notes: Standard errors in parentheses. **, and *** respectively represent significance at the 5%, and 1% levels.
Table 8. Balance test for propensity score matching.
VariablesMeanBiast-Test
(1)(2)(3)(4)(5)(6)(7)(8)
Treated Control % Bias % Reduct
|Bias|
t p > |t|
strU1.4261.14037.3 4.060.000
M1.0351.0181.895.10.270.784
lgdpU10.0119.68833.4 3.250.001
M9.9899.83715.852.81.220.223
indU0.3500.31543.0 4.190.000
M0.3720.376−588.4−0.410.686
humU0.0210.0212.5 0.230.820
M0.0200.021−2.50−0.230.842
techU0.0280.01441.6 4.570.000
M0.0130.0122.494.30.300.764
finU3.7753.02360.7 6.660.000
M3.0763.090−1.298−0.140.891
fdiU2.4671.56359.3 5.560.000
M2.1572.0834.891.90.270.791
Notes: “U” means Unmatched; “M” means Matched.
Table 9. PSM-DID regression results.
(1)
kgt
D0.514 **
(0.220)
str−1.686
(1.207)
lgdp−0.154 *
(0.088)
ind−10.727
(6.503)
hum−346.096 **
(142.768)
tech22.052 *
(11.507)
fin0.533
(0.486)
fdi−0.046
(0.050)
provY
yearY
_cons13.702 **
(5.356)
N353
r20.887
ar20.867
Notes: “U” means Unmatched; “M” means Matched. *, **, respectively represent significance at the 10%, 5%, levels, respectively.
Table 10. Results of the instrumental variable method.
VariablesFirst-Stage Regression
(1)
Second-Stage Regression
(2)
IV0.017 ***
D 2.270 **
Control variablesYY
ProvYY
YearYY
N420420
Kleibergen–Paap rk LM statistic8.457 ***
Notes: **, and *** respectively represent significance at the 5%, and 1% levels, respectively.
Table 11. Analysis results of industry heterogeneity.
(1)(2)(3)(4)
Steel IndustryCement IndustryNon-Ferrous
Metals Industry
Petro-Chemical Industry
did0.173 **0.082 ***0.229 ***0.362 ***
(0.065)(0.025)(0.066)(0.120)
str−0.141 ***−0.040 **−0.199 ***−0.263 ***
(0.046)(0.018)(0.065)(0.094)
lgdp−0.037 **−0.015 ***−0.046 ***−0.057 **
(0.014)(0.004)(0.016)(0.023)
ind−0.553 *−0.397 ***−0.856 **−1.158 **
(0.281)(0.129)(0.344)(0.425)
hum−17.546 *−5.119−22.347 **−45.975 **
(9.070)(3.171)(9.993)(17.674)
tech1.5680.361 *2.166 **3.373 ***
(0.961)(0.211)(0.993)(1.213)
fin0.0520.0120.0260.027
(0.036)(0.009)(0.042)(0.054)
fdi−0.014 **−0.004−0.007−0.013
(0.007)(0.003)(0.008)(0.009)
provYYYY
yearYYYY
_cons0.999 ***0.426 ***1.516 ***2.350 ***
(0.288)(0.112)(0.352)(0.522)
N420420420420
adj. R20.6470.6670.7820.848
Notes: *, **, and *** respectively represent significance at the 10%, 5%, and 1% levels, respectively.
Table 12. Analysis results of regional heterogeneity.
(1)(2)
Eastern RegionCentral and Western Regions
D0.964 **0.172 *
(0.391)(0.099)
str−0.686 **−0.081
(0.274)(0.133)
lgdp−0.197−0.095 ***
(0.124)(0.021)
ind0.770−1.713 **
(5.137)(0.709)
hum−132.573−39.774 *
(92.671)(20.013)
tech0.6278.957 ***
(15.061)(2.337)
fin0.0680.006
(0.351)(0.096)
fdi−0.010−0.053 *
(0.062)(0.030)
provYY
yearYY
_cons6.334 *2.712 ***
(2.955)(0.524)
N154266
adj. R20.7930.848
chowtest4.14 ***
Notes: Standard errors in parentheses. *, **, and *** respectively represent significance at the 10%, 5%, and 1% levels, respectively. The difference between groups is tested using the Chow test. The p-value of this test statistic is shown in the table. This shows the rejection of the original hypothesis, indicating that the coefficients are significantly different between the groups.
Disclaimer/Publisher’s Note: The statements, opinions and data contained in all publications are solely those of the individual author(s) and contributor(s) and not of MDPI and/or the editor(s). MDPI and/or the editor(s) disclaim responsibility for any injury to people or property resulting from any ideas, methods, instructions or products referred to in the content.