1. Introduction
Climate change and water scarcity significantly impact sustainability in semi-arid areas, necessitating climate change adaptation, appropriate long-term planning, and the implementation of appropriate socioeconomic policies to enhance the sustainability of these regions [
1].
In Yemen, the most water-scarce nation in the world, every drop of water matters, as current groundwater extraction surpasses the yearly recharge [
2]. Moreover, water security is crucial for mitigating the impacts of human-induced and climate change-related effects on water resources, as climate change and variability significantly affect vital sectors such as agriculture and the economy [
3,
4]. Recently, a substantial portion of the population experiences acute water shortages. Approximately 90% of the available water resources are primarily allocated for irrigation, predominantly through traditional methods [
5]. In addition to these conventional irrigation practices, Yemen’s water resources encounter several challenges, including climate change, inadequate water management strategies, overexploitation of resources, and population growth. These factors contribute to socioeconomic instability and have precipitated water-related conflicts, which are sadly not monitored and are frequently too complex to be resolved by sheikhs or the legal system alone in Yemen [
6].
Conversely, a decade of conflict has exacerbated water scarcity and groundwater depletion, resulting in saltwater intrusion that threatens food and water security. In this context, the Tuban Delta (TD), which includes the major port city of Aden, faces severe water scarcity, making it one of Yemen’s most water-stressed regions.
The increasing population, overexploitation of groundwater, and climate change have impacted the area and highlighted the needs for studying these challenges [
2,
7]. Thus, hydrological research is required to evaluate the hydrological conditions and potential climatic risks facing the Tuban Delta to help address these challenges and the research progress of surface water in other water basins and communities in Yemen.
Most surface water resources in Yemen are utilized in the Upper and Middle Regions. These resources are impacted by agriculture-related pollution from fertilizers, chemical products, and untreated wastewater discharged directly into streams and canals. Conversely, the quality of groundwater has not been thoroughly studied regarding its suitability for irrigation or drinking purposes.
The primary sources of groundwater pollution include the following:
Natural radioactivity: Groundwater in Aden, similar to many regions globally, may contain naturally occurring radionuclides such as radium, uranium, and thorium, which can leach from geological formations. Harb et al. [
8] collected and analyzed 37 groundwater samples from 4 areas in the Aden governorate—Beer Ahmed, Beer Fadle, Daar Saad, and Al-Masabian. The findings indicated that the annual dose received was approximately 5–10 times higher than the WHO-recommended limit of 0.1 mSv/year for drinking water. Additionally, another study [
9] assessed the radioactivity of groundwater in the Juban District, revealing that high concentrations of radionuclides were primarily found in water from wells in the basement aquifer. This study determined that the mean annual effective dose for infants was nearly twenty times the WHO guideline level for drinking water. Thus, it is imperative to address the issue of groundwater quality through collaboration among local authorities, environmental agencies, health departments, and scientific institutions. This effort is essential to ensure the provision of safe and potable groundwater while minimizing health risks associated with radioactivity.
Salinity: According to Yemeni drinking water standards, the preferred electrical conductivity (EC) for drinking water is less than 1000 µS/cm, with a maximum allowable limit of up to 2500 µS/cm [
10]. However, testing of numerous samples from the lower region revealed elevated EC values, exceeding 3000 µS/cm in some wells. This salinity can be attributed to both the natural characteristics of the aquifer and the effects of saltwater intrusion, particularly in coastal areas. After analyzing available data from 2007 and 2021, there has been an increase in average EC mainly in LR, which exceeds the Yemeni standards for drinking water—5526.42 μS/cm and 4629 μS/cm—but it can still be used for other uses. The wells in the Middle and Upper Regions continue to provide drinkable water, with electrical conductivity (EC) concentrations around 2110 μS/cm as of 2021.
Nitrate: The concentrations of nitrate in Bir Ahmed and Bir Naser are approximately 75 mg/L and 58 mg/L, respectively, both exceeding the Yemeni standard of 50 mg/L. Regarding wastewater, cities and industries discharge untreated domestic and industrial wastewater into peri-urban areas. While the pollution risks from urban wastewater are more apparent, untreated wastewater from rural settlements also poses a significant threat to aquifers. To evaluate groundwater pollution in the Bir Nasser and Bir Ahmed water fields in TD, ref. [
11] collected 20 groundwater samples from February to July 2021. The results indicated that most physical, chemical, and biological parameters were above the permissible limits set by WHO. The primary causes of this pollution include the use of cesspits, the proximity of wells to agricultural lands that utilize chemical and animal fertilizers, random well drilling, and excessive pumping rates [
11].
Moreover, no specific estimates of water resource availability in TD have been made thus far. However, some estimates exist for Yemen as a whole or for specific governorates. For example, one assessment indicated that Lahj’s potential water resources amount to 130 million cubic meters (MCM) per year [
12]. TD is situated downstream of the Tuban Wadi Basin. Consequently, the total renewable water resources in TD will be the sum of inflows from the highlands of Tuban Wadi, rainfall and runoff from the three regions, and groundwater flow from the highlands.
Based on this brief introduction, the following are the main research gaps in Yemen in general, and in TD in particular, which have also been recognized by [
1,
3,
13]:
Groundwater quality: limited studies on groundwater radioactivity, salinity, and nitrate levels, and their impacts on water scarcity and pollution.
Impact of water scarcity: insufficient analysis of how water scarcity influences social conflicts.
Hydrological assessments: need for detailed hydrological studies to evaluate current and future conditions under climate and socioeconomic changes.
Wastewater management: lack of strategies for managing untreated wastewater and agricultural runoff.
These gaps need actual contributions from scientific people and international organization to mitigate potential risk and ensure water sustainability in the region. The following are some proposed contributions:
- ○
Propose integrated strategies for efficient water use.
- ○
Recommend frameworks for pollution control and safe drinking to mitigate risks from water pollution.
- ○
Predict the impacts of climate change and growth on the limited water resources.
- ○
Develop frameworks combining traditional and modern agricultural and managerial methods.
Based on the Un-Habitat mission in Yemen [
14], this paper contributes to water resource management in Yemen by assessing the current resources, both renewable and non-conventional. Then, it quantifies the gap in water supply and demand under current and future water conditions considering different socioeconomic and climate scenarios. It offers recommendations for sustainable solutions such as introducing drip irrigation and desalination of seawater to improve the security of water.
2. Materials and Methods
Figure 1 outlines the steps involved in conducting the hydrological assessment aimed at estimating the unmet water demand. Notably, each step actively engages stakeholders in various processes, including data collection, verification, addressing information gaps, discussing the current situation, proposing future scenarios, and selecting potential adaptation measures. This collaborative approach ensures a comprehensive understanding of the challenges and opportunities in water resource management.
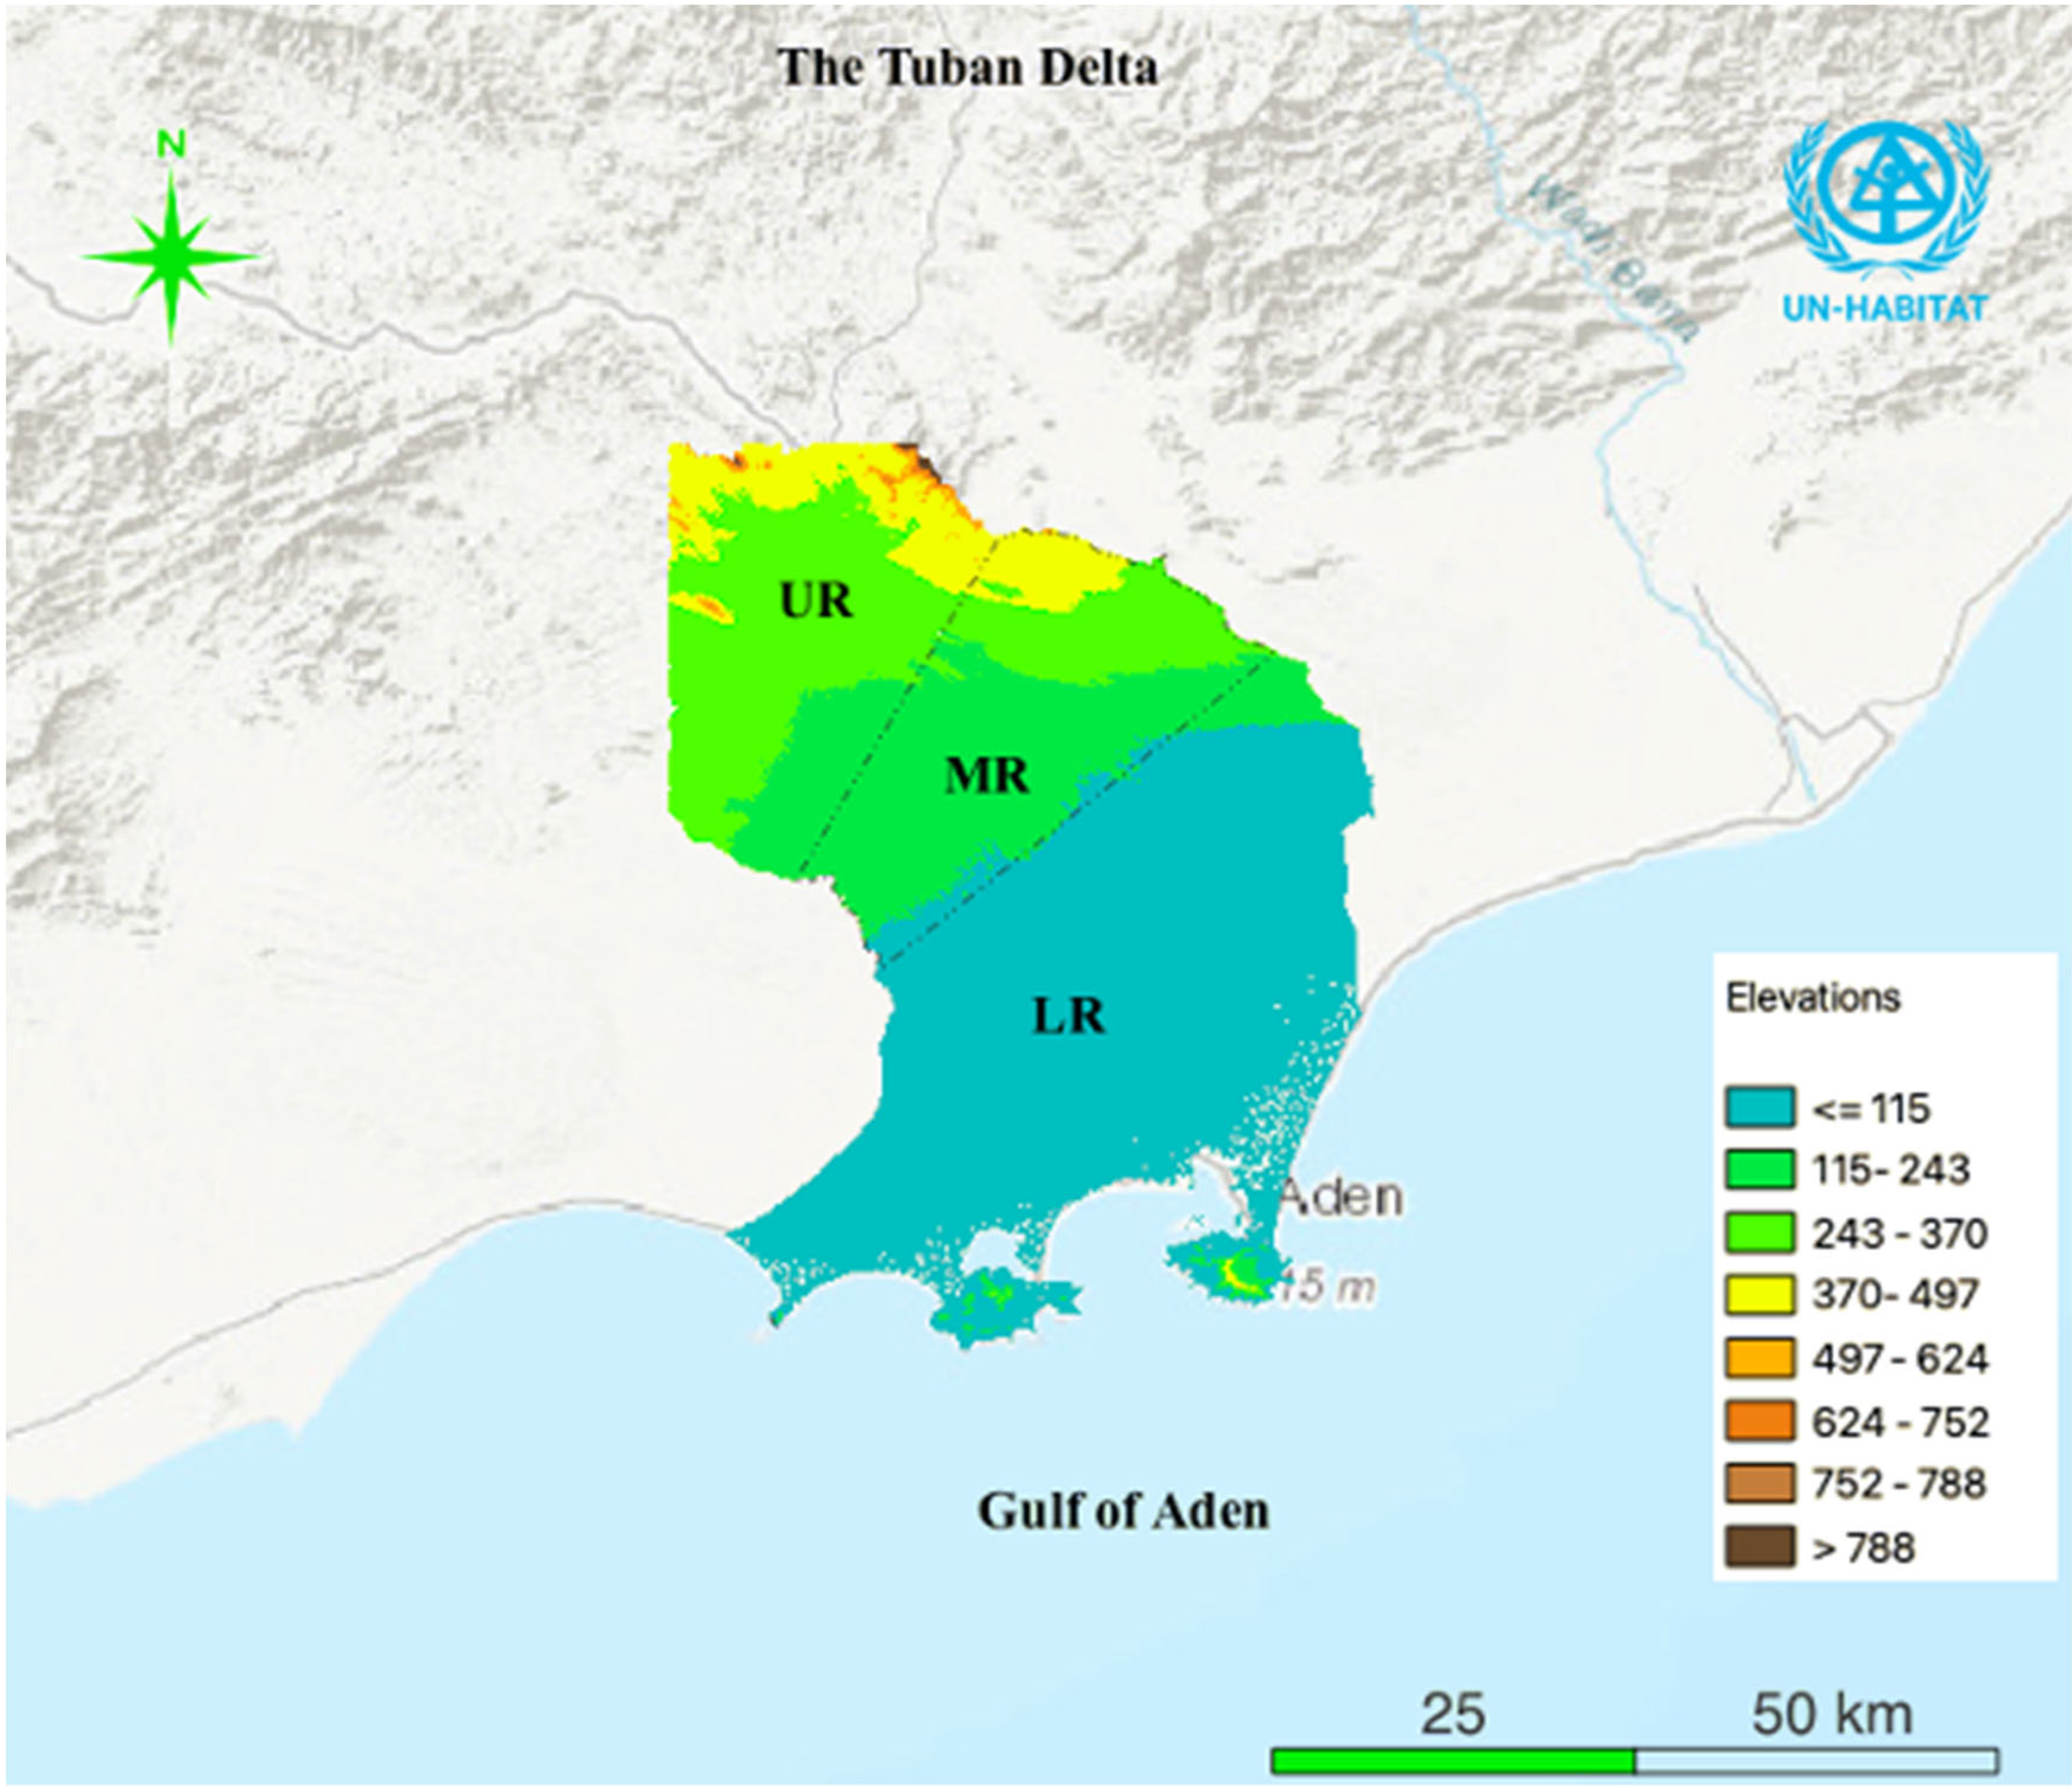
2.1. Study Area
TD is situated downstream of the Wadi Tuban basin, which covers a total area of 7360 km
2 and consists of seven sub-basins: Maytem, Saelah Qataba, Worzan, As-Sodan, Tuban, Al Enteshari, and Agreen [
10].
Geographically, the Tuban Delta is located between 44.65–45.1° E and 12.7–13.3° N, with topography ranging from 10 m below to about 800 m above mean sea level. Administratively, TD is divided into three regions: the Upper Region (UR), the Middle Region (MR), and the Lower Region (LR).
To delineate the watershed of TD, QGIS and the HEC-HMS model were utilized.
The digital elevation model for the study area was obtained from the Shuttle Radar Topography Mission (SRTM) of the United States Geological Survey. Ten break points (outlets) were established, leading to the creation of several sub-basins that were subsequently merged into one administrative watershed, as shown in
Figure 2. The Tuban Delta is divided into three regions: UR with an area of 450 km
2 and a population of 36,900 people; MR with an area of 570 km
2 and a population of 85,950 people; and LR with an area of 1030 km
2 and a population of 1,133,000 people.
2.2. Data Collection
Different sorts of data were required, namely hydrological data, land and water uses, demographic and socioeconomic data, and climatic projections, to carry out the hydrology study and to carry out the related analysis. Therefore, data were collected from four main sources as follows:
- 1.
Desk review: some of the required information was gathered from open-access websites and earlier studies.
Consultation: Due to the war in Yemen, most data were outdated. Consequently, after 2015, it was difficult to obtain reliable data. As a result, numerous consultation meetings were arranged to correct the data that were gathered. The following national organizations contributed to the gathering and validation of the data: Environmental Protection Agency (EPA), National Water Resources Authority (NWRA), Ministry of Agriculture and Irrigation and Fish Wealth (MAIFW), Ministry of Water and Environment (MWE), and Local Water and Sanitation Corporation (LWSC).
It is worth mentioning that consultations were conducted in four national workshops in Aden, and in meetings with some decision makers. In addition to validating the data, these consultations continued until the end of the project to confirm the results of this research.
- 2.
Remote sensing: Due to the war, there have been no rainfall records available since 2015. To address this gap, monthly rainfall rates were obtained from the Multi-Source Weighted-Ensemble Precipitation (MSWEP), a global precipitation product that provides a 3-hourly resolution at 0.1°. This product integrates gauge, satellite, and reanalysis data to deliver high-quality precipitation estimates. The monthly rainfall rates were then processed in QGIS to calculate the annual precipitation for 2022. In general, QGIS 3.28 is good software to use; however, it has some limitations including the following:
- ○
Combining QGIS with other software for simulations and modeling can be difficult.
- ○
The interface may be less intuitive for hydrological analyses compared with specialized software.
- ○
QGIS is not designed for real-time data processing, which can hinder dynamic studies.
- ○
Creating custom visuals may require extra effort or external tools.
- ○
As an open-source platform, QGIS does not offer the same level of customer support as commercial alternatives.
- 3.
Field visits: In February 2023, local government officials and representatives from the water user associations (WUAs) were interviewed. Subsequently, three field trips were conducted to the Upper, Middle, and Lower Regions of TD, during which, three focus group discussions (FGDs) were held at each location, involving farmers, men, and women. The following subjects were discussed during the focus group discussions:
Local issues and demographic trends.
Institutional structures.
Socioeconomic activities (agriculture, water consumption, and land use).
Climate-related risks (including sea level rise, drought, saltwater intrusion, and flooding).
Additionally, to estimate groundwater abstraction and assess the quality of water discharged from wells, local team members conducted several field visits to collect data on agricultural and domestic wells. The collected data included water levels, average abstraction rates, temperature, and electrical conductivity (EC), which were then compared with data from 2007.
2.3. Climate Scenarios
The climate modeling community under the Coupled Model Intercomparison Project (CMIP) utilizes two main frameworks to predict climate change impacts: CMIP5 and CMIP6. CMIP5 focuses on representative concentration pathways (RCPs), and CMIP6 projects socioeconomic trends through shared socioeconomic pathways (SSPs).
Examining the performance of CMIP5 and CMIP6, global climate models (GCMs) across various countries revealed that CMIP6 GCMs significantly improved the reproduction of temperature and rainfall patterns. While CMIP5 models excelled in replicating geographical distributions, they were less effective at simulating spatial variability for most climatic variables, except for minimum temperatures at different timeframes [
15].
Consequently, the Meteorological Research Institute Earth System Model Version 2.0 (MRI-ESM 2.0) was selected under CMIP6, with expectations that it would perform better in many experiments scheduled for CMIP6 compared with earlier models from CMIP5 [
16]. The CMIP6 data archives make MRI-ESM2-0 outputs readily accessible for research purposes. Moreover, MRI-ESM2-0 has shown improvements in simulating atmospheric circulation, ocean currents, and sea ice [
17]. These improvements are relevant for understanding large-scale climate drivers that influence Yemen’s climate. In general, the model is based on prediction; therefore, it will not be 100% accurate. However, the main aim is to highlight the possible related risks and the affected areas.
It is worth mentioning that, despite their effectiveness in forecasting future climate conditions, climate models are susceptible to uncertainties pertaining to data inputs, model parameterization, and future emission assumptions. Therefore, in order to guarantee trustworthiness, model outputs must be verified using empirical data or stakeholder consultation, which is a vital pillar of this work.
Future projections in this report, based on CMIP6 and aligned with the Intergovernmental Panel on Climate Change (IPCC)’s Sixth Assessment Report [
18], are conducted under climatic scenarios SSP3 and SSP5. These scenarios are influenced by increasing global conflicts and traditional socioeconomic activities:
SSP3 is linked to RCP7, indicating significant challenges in adaptation and mitigation due to conflicts and instability.
SSP5 is associated with RCP8.5, suggesting substantial obstacles in mitigation, leading to increased fossil fuel consumption.
Overall, both SSP3 and SSP5 represent high-emission high-impact scenarios. However, the rate of emission reduction over the past 13 years is not optimistic enough to consider lower emission scenarios like SSP2.
Some climate projections extending to 2100 are supported by the United Nations Economic and Social Commission for Western Asia (UNESCWA). Additional projections were sourced from various climate service platforms, including the Climate Change Knowledge Portal (CCKP), developed by the World Bank (WB) to meet the needs of development practitioners and policymakers.
Moreover, the timeframes for the extreme events scenarios have been modified from 2010–2039, 2035–2060, 2060–2089, and 2070–2099 to 2023–2040, 2041–2060, 2061–2080, and 2081–2100.
2.4. Water Availability
Water availability in a specific area or watershed is determined by the sum of incoming water and direct runoff within that study area. Previous estimates have been utilized to assess the incoming water.
Runoff water availability can be calculated by subtracting evaporation and infiltration from the total rainfall [
19]. The main methods for estimating runoff and water availability include the following:
Rational method.
Cook’s method.
Curve number method.
These methods provide a framework for evaluating runoff and understanding water availability in a given watershed [
20]. The rational method is utilized in this paper to estimate water availability using the following equations [
20]:
where WA = water availability (MCM/year), C = weighted runoff coefficient, Ci = land use coefficient, Ai = land area (km
2), R = average yearly rainfall data (m/year), Ri = rainfall at station i, and m = number of rainfall stations.
In this research, the rational method is only used to estimate available water in TD. Regarding its accuracy, the rational method is helpful for small urbanized areas since it offers a straightforward method for estimating peak runoff based on rainfall intensity and watershed features. However, in intricate large watersheds where terrain and fluctuating land use play important roles, its accuracy may decrease, which is not the case in TD. Moreover, the rational method may not give accurate estimates for extreme events of heavy rainfall or droughts.
2.5. Future Projections
Future projections of unmet demand have been conducted based on water demand and resource projections, considering different scenarios that cover domestic demand, agricultural demand, and water resources.
2.5.1. Water Demand Projection
Recently, environmental flow has not been incorporated into national water plans in Yemen. However, it is recommended to include this demand in future water management strategies. An average environmental flow of 10–30 L/s at the basin outlet could significantly contribute to water sustainability in TD. Thus, the total demand projections in the three regions have been estimated based on the current domestic water use (DWU) and agricultural water use (AWU) as follows:
DWU projections up to 2100 have been estimated based on average water consumption per capita assuming that the non-revenue water (NRW) will be eliminated by 2040. Thus, domestic water consumption starting from 2040 will be 90, 99, and 96 L/day in LR, MR, and UR, respectively.
On the other hand, the domestic water demand projection depends on population growth. Thus, future population and DWU projections up to 2100 can be estimated based on the following two scenarios:
- (a)
DWUn: normal increase, which means the rate of growth of 3% will stay the same up to 2100 using the following equation:
where PF is the future population at time T, PP is the present population, R is the growth rate (3%), and n is the number of years.
- (b)
DWUr: Reduction in the population growth rate, which means a growth rate of 3% until 2040, 2.5% from 2040 to 2060, 2% from 2060 to 2080, then 1.5% from 2080 to 2100. In this case, Equation (5) is used.
- -
r1, r1 are the growth rates in the specific period.
- -
n1, n2 are the number of years for each period.
- 2.
For agricultural water use (AWU) projections: the following two scenarios have been assessed, as shown in
Table 1:
- (a)
AWUa: constant land and irrigation practices.
- (b)
AWUb: constant land, modern irrigation starts with 50% in 2040, 70% in 2060, and 100% in 2080.
2.5.2. Water Supply Projections
For the water supply scenarios, the following two have been considered based on the use of non-conventional water resources (NCWRs):
Reference NCWR (NCWRr): no increase in current NCWR.
Improved NCWR (NCWRi): In this scenario, treated wastewater (TWW) is estimated to meet 33% of domestic water demand. The same percentage will be applied for future projections, with all TWW being reused.
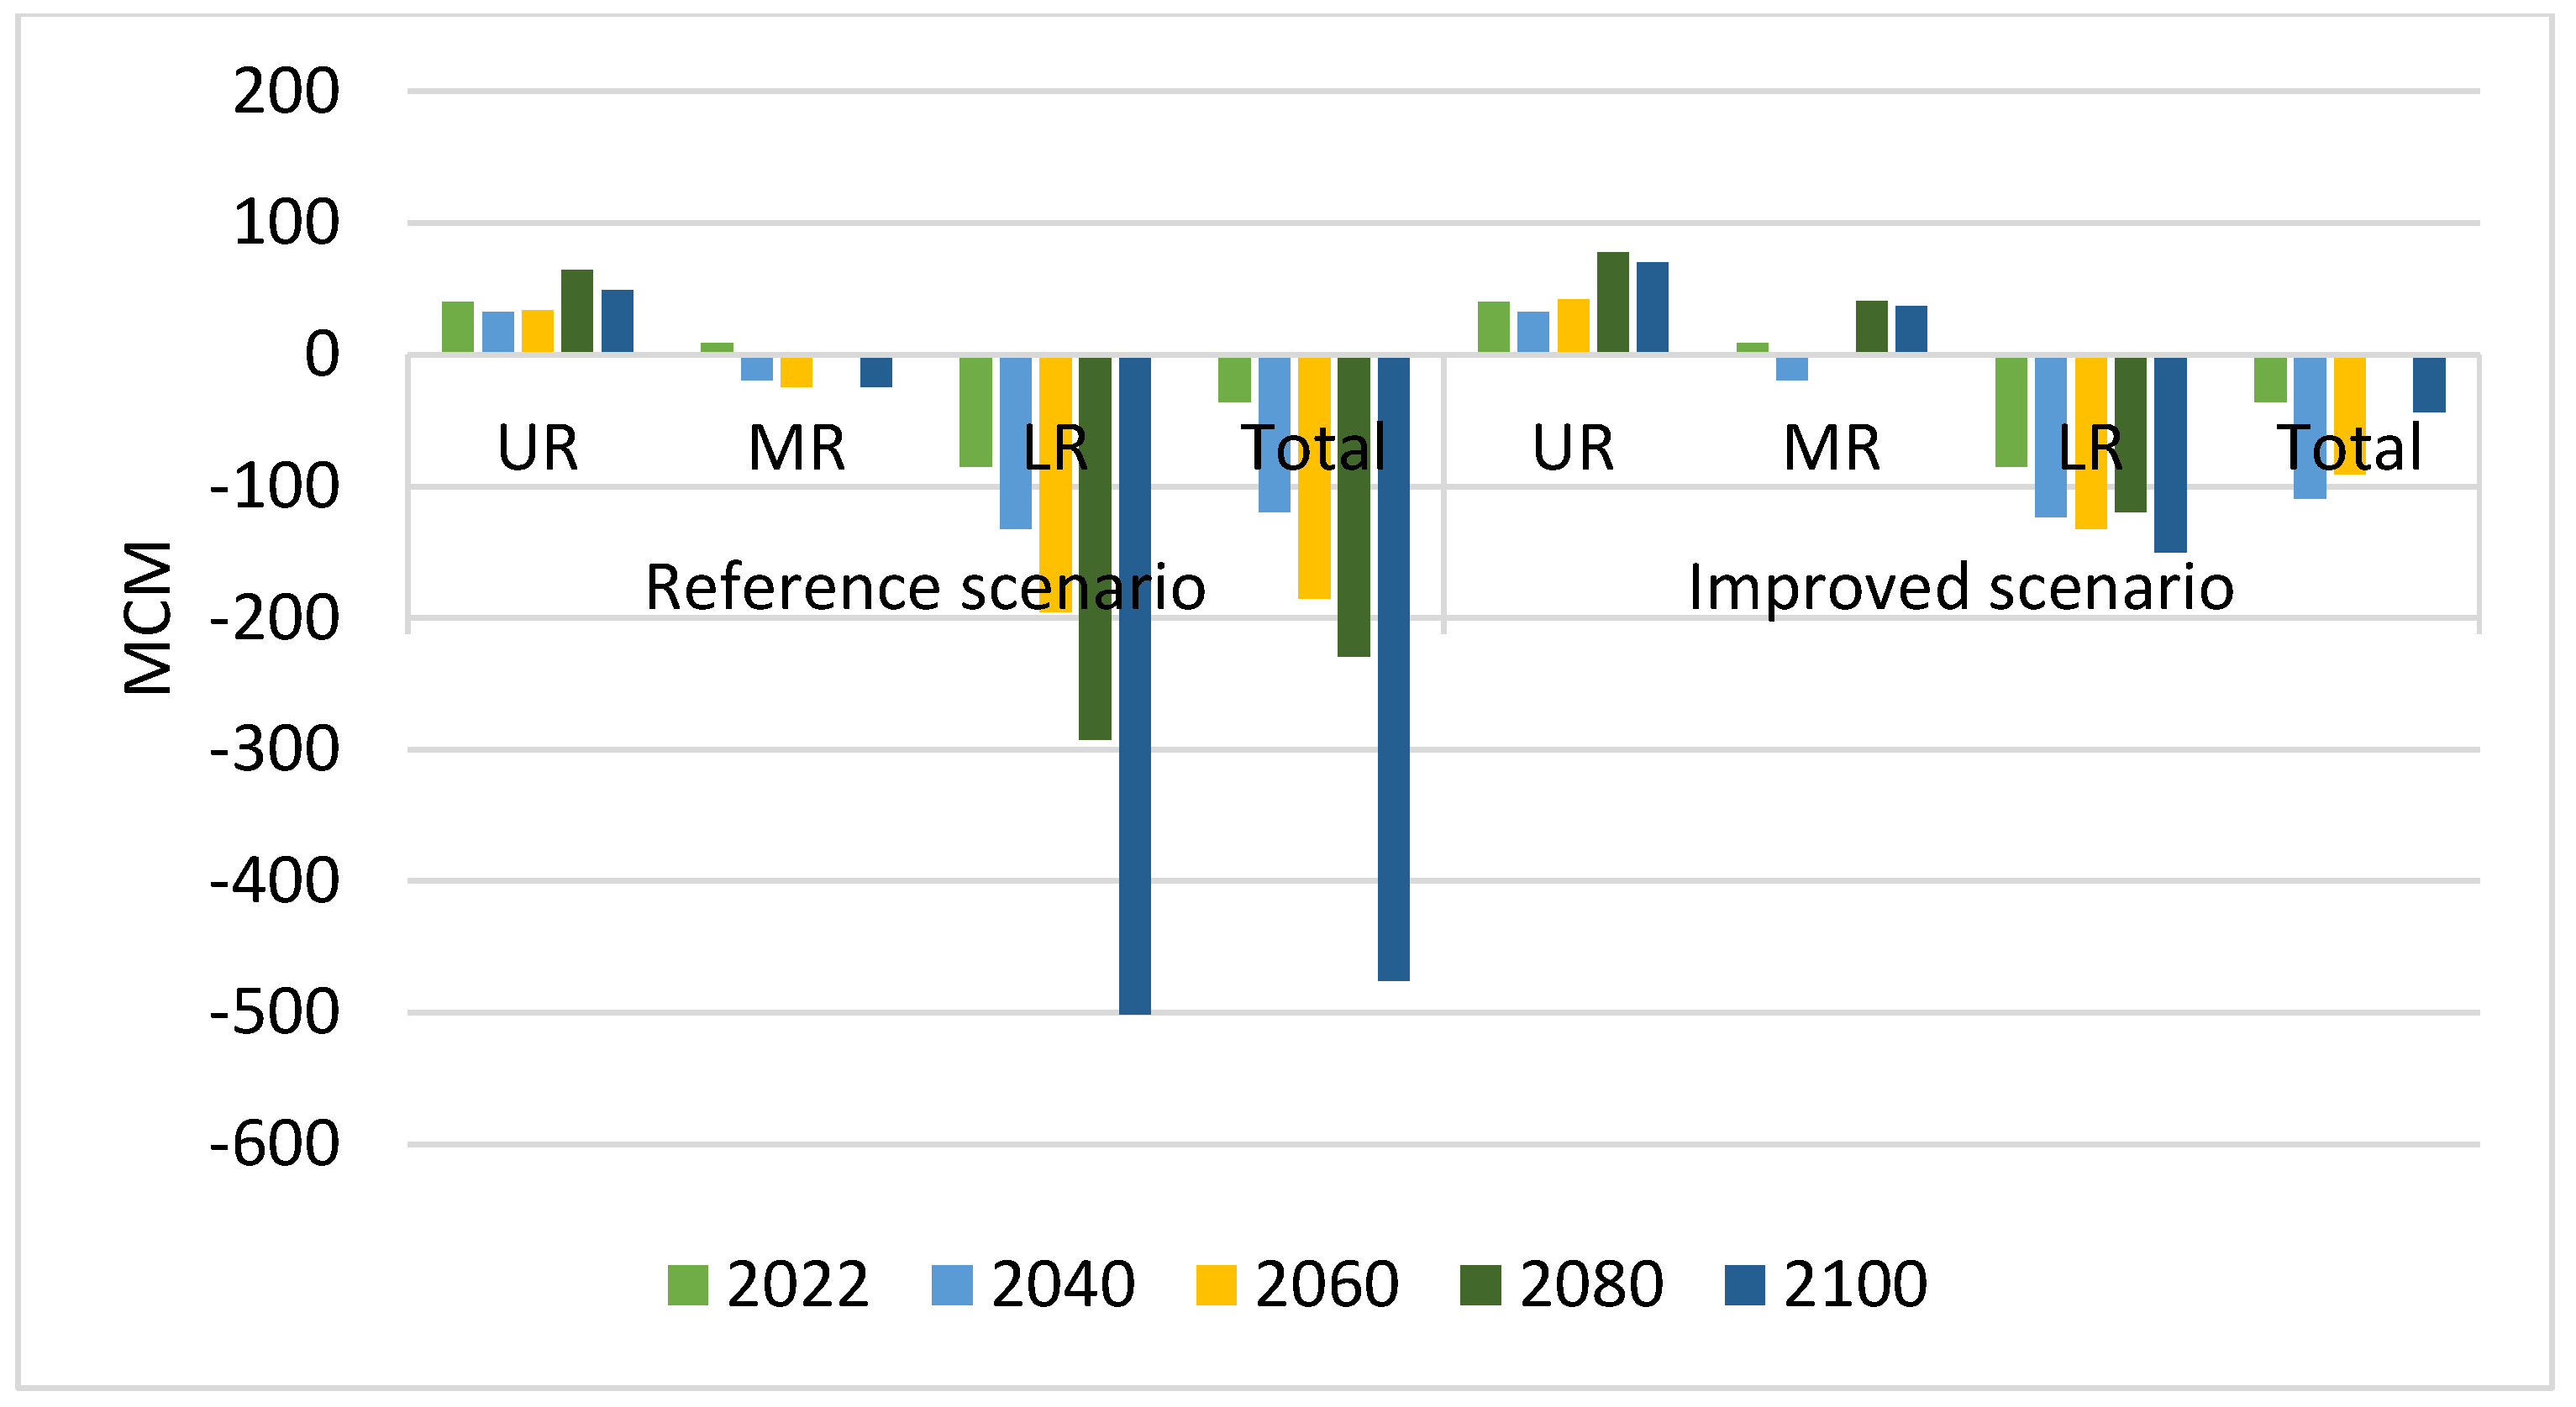
4. Conclusions
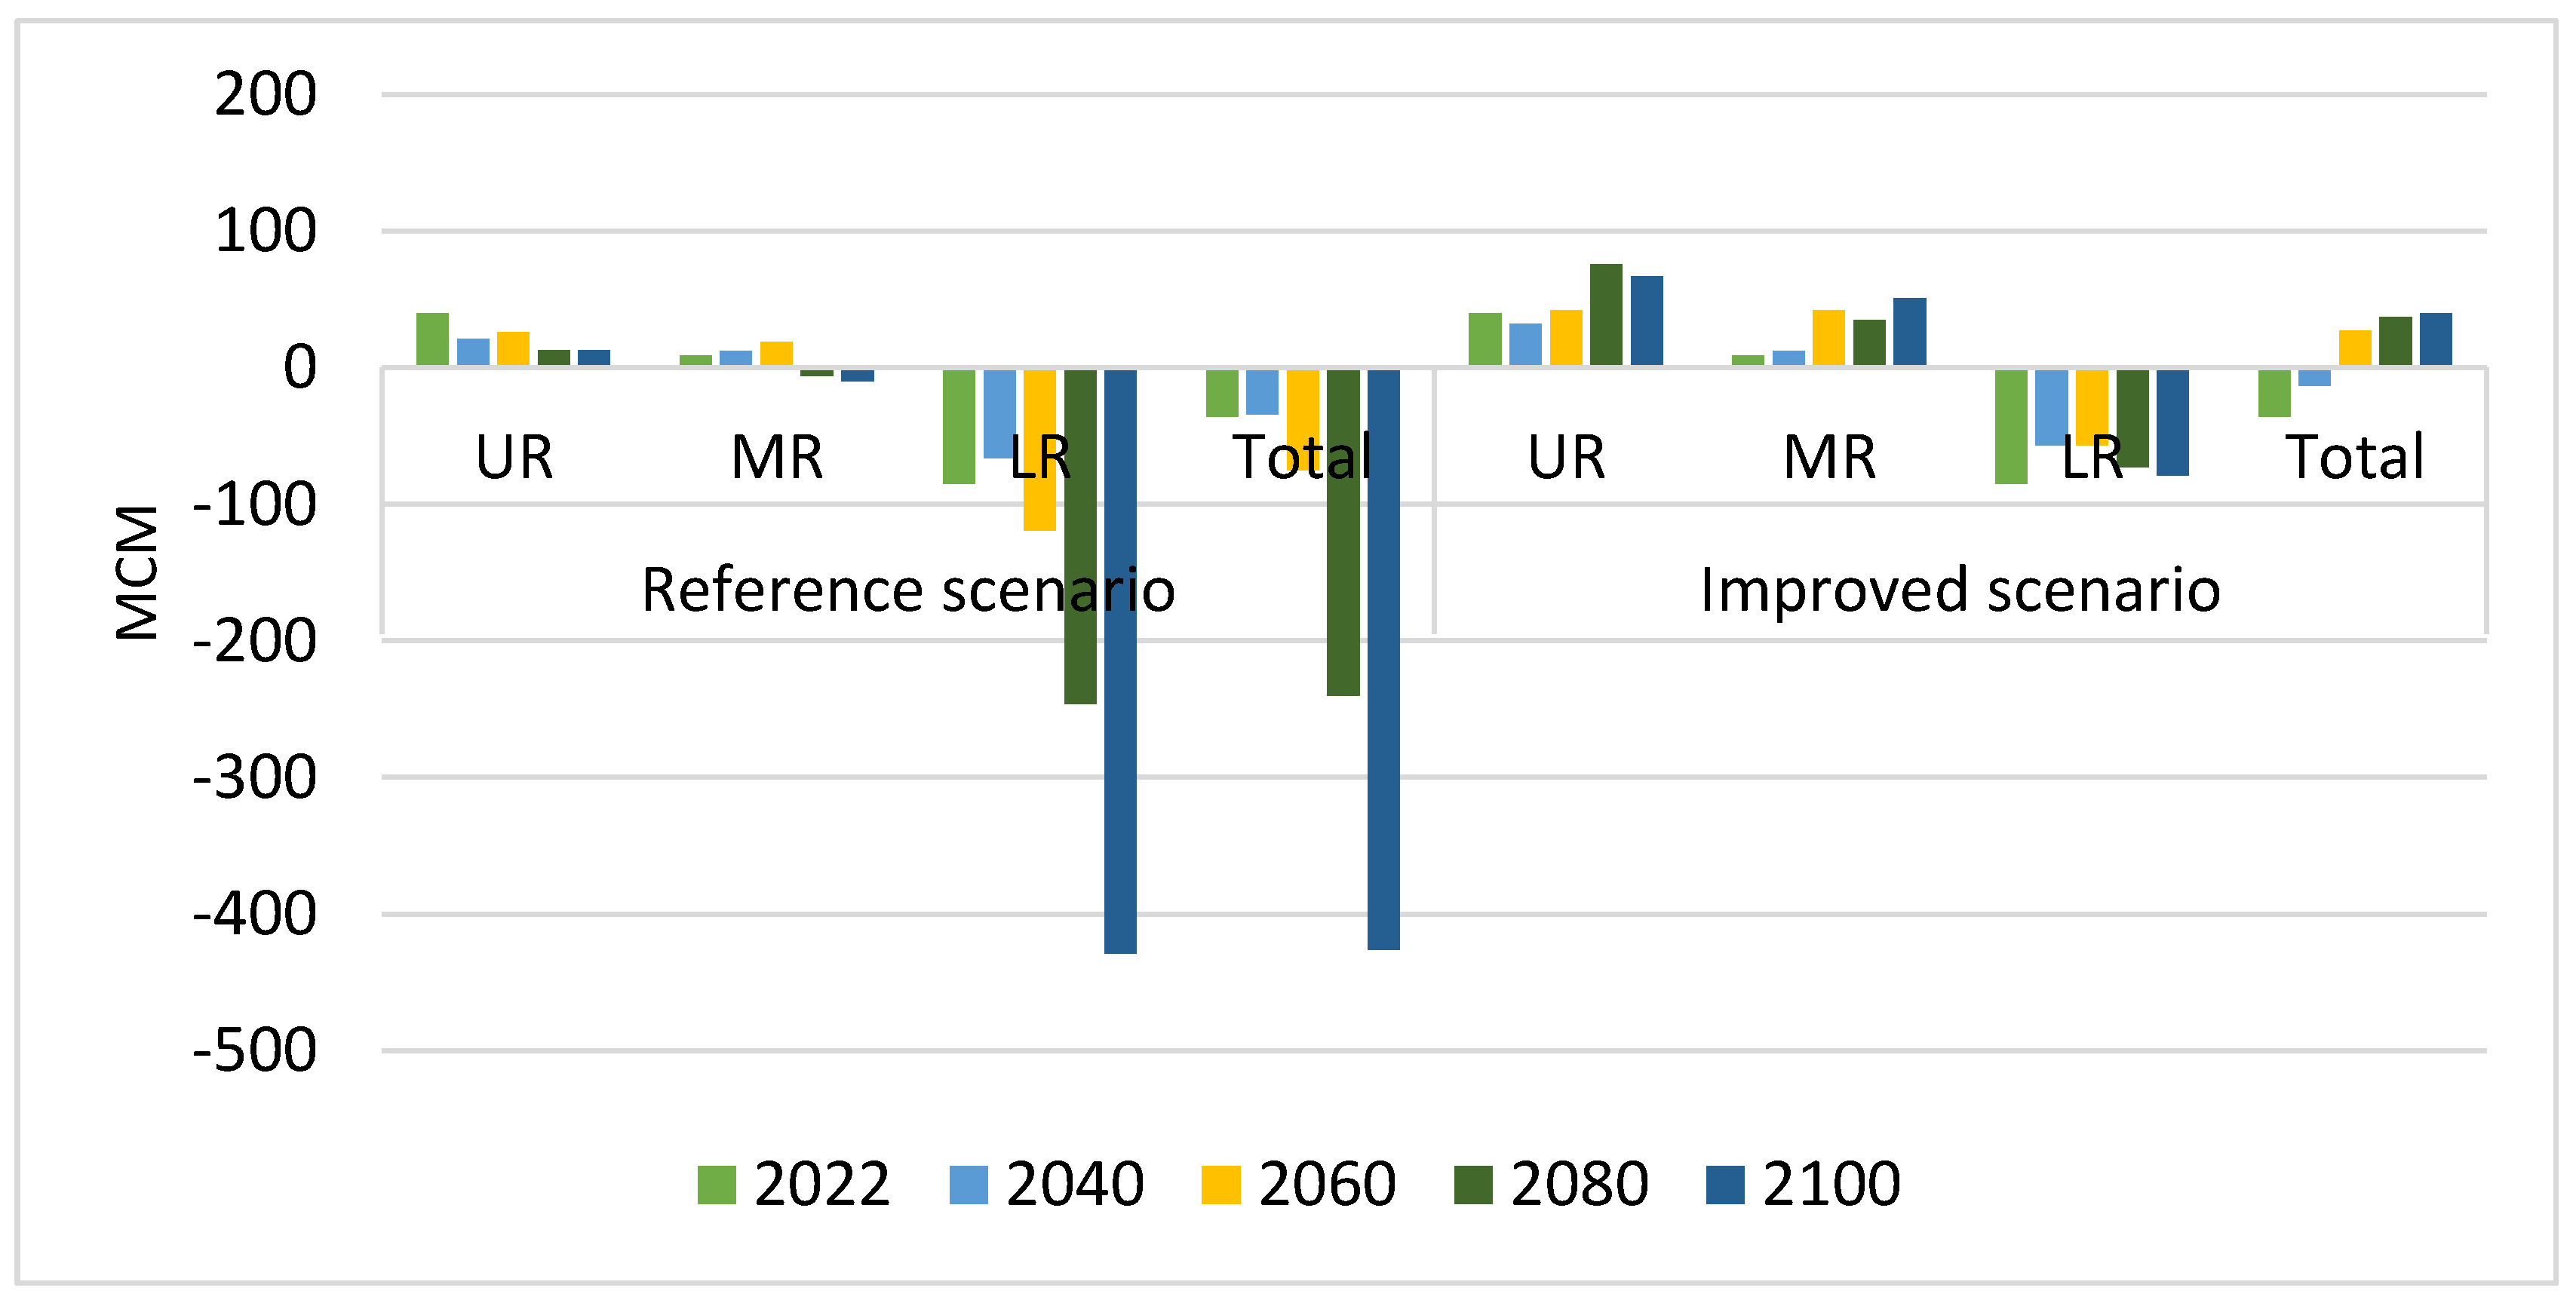
Water scarcity, over-exploitation, and climate change are the primary threats facing the Tuban Delta. Therefore, an advanced hydrological assessment is essential to propose potential adaptation measures and provide policy recommendations. This assessment takes into account the hydrological year of 2022 for analysis and the development of future scenarios.
The 2022 estimations of water supplies and demand indicate a total water deficit of 36 MCM. Additionally, the development of various dams and rainwater harvesting techniques, along with the overuse of surface water in the upper section of the Tuban watershed (upstream), has reduced flood risks but diminished surface water availability in TD downstream. As a result, limited water reaches the Lower Region, and no water flows to the ocean, compelling communities and farmers to rely primarily on groundwater with renewable energy, leading to an increased water deficit of 84 MCM in LR, which might keep increasing due to internal migration, population expansion, and climate change.
The MRI-ESM2-0 climate model has been employed to project future conditions under SSP3 and SSP5. The results indicate a significant variation in water availability estimates across the three regions up to 2100. Under the reference scenario, the water deficit could exceed 400 MCM in 2100 for both climatic pathways. However, examining the improved scenarios shows a better situation in TD. To conclude, all these scenarios predict severe water shortages in LR, which might range from 60 to 80 MCM under the improved scenarios. Therefore, LR requires additional water resources, such as a 50 MCM seawater desalination plant, to address the ongoing water scarcity.


 ,
, 


