Article

Spatiotemporal Differentiation and Attribution Analysis of Ecological Vulnerability in Heilongjiang Province, China, 2000–2020

School of Geographical Sciences and Tourism, Jilin Normal University, Siping 136000, China
*
Author to whom correspondence should be addressed.
Sustainability 2025, 17(5), 2239; https://doi.org/10.3390/su17052239
Submission received: 17 January 2025 / Revised: 1 March 2025 / Accepted: 3 March 2025 / Published: 4 March 2025

Abstract

:
Heilongjiang Province, a major grain-producing region in China, faces ecological vulnerabilities that directly affect its sustainable development. A scientific assessment of the spatiotemporal characteristics of ecological vulnerability and its influencing factors in Heilongjiang is crucial for a deeper understanding of environmental issues and provides theoretical support for enhancing regional ecological governance capabilities. The SRP model, combined with the AHP-CRITIC weighting method, was employed to assess Heilongjiang Province’s ecological vulnerability’s temporal and regional differentiation trends between 2000 and 2020. The aggregation kinds of ecological vulnerability were examined using spatial autocorrelation. GeoDetector was used to determine the main elements affecting ecological vulnerability in the province. Additionally, the ecological vulnerability status in 2030 was predicted using the CA-Markov model. The findings indicate that (1) the average EVI values for Heilongjiang Province during the three periods were 0.323, 0.317, and 0.347, respectively, indicating a medium level of ecological vulnerability across the province; the ecological vulnerability initially decreased and then worsened. Spatially, the distribution followed a pattern of “high in the east and west, and low in the north and south”. (2) Spatial agglomeration is evident, with high-high (H-H) aggregation primarily occurring in heavily and extremely vulnerable areas characterized by high human activity, while low–low (L-L) aggregation is mainly found in mildly and marginally vulnerable areas with a favorable natural background. (3) Biological abundance, net primary productivity, dry degree, and PM2.5 were the main drivers of ecological vulnerability, with interactions between these factors amplifying their impact on ecological vulnerability. (4) The CA-Markov model prediction results indicated an upward trend in the overall ecological vulnerability of Heilongjiang Province by 2030, reflecting a decline in the ecological environment. The study indicates that the ecological vulnerability of Heilongjiang Province is closely linked to its natural geographic conditions and is influenced through the interplay of several environmental elements. Based on the vulnerability zoning results, this paper proposes governance recommendations for regions with different vulnerability levels, aiming to provide theoretical support for future ecological restoration and sustainable development.

1. Introduction

The ecosystem is essential to human survival and development, providing a critical foundation for the sustainable development of society and the economy [1]. In recent years, due to the impact of global climate change and the increasing population [2,3,4,5], the restoration and self-purification capacity of ecosystems has been steadily weakening. Numerous extreme climate events have occurred globally, and ecological issues such as energy shortages, soil erosion, land desertification, and the sharp decline in biodiversity have become more frequent [6,7,8]. Human greenhouse gas emissions also have a significant impact on climate and environmental changes [9]. Because of this, assessing ecological vulnerability has steadily emerged as a major area of interest and concentration for numerous international organizations and institutions [10]. Implementing a holistic system view of the living community, which includes mountains, waters, forests, lakes, grasslands, and deserts, depends on identifying and scientifically evaluating the formation mechanisms of ecosystem vulnerability. This approach is extremely important for ecological environmental construction and the sustainable development of human society in China [11].
Ecological vulnerability is defined as the ecological response of ecosystems to external environmental disturbances under specific spatial and temporal conditions [12,13]. It results from the combined influence of natural environmental factors and anthropogenic activities [14] and has gradually become one of the most important indicators of ecological environmental quality and sustainable development. In the 20th century, the International Biological Program (IBP) initially researched ecological vulnerability. As research deepened, many domestic and international scholars developed a series of evaluation models based on different principles and objectives. These include the “driving force-pressure-state-impact-response” (DPSIR) model [15], the “sensitivity-resilience-pressure” (SRP) model [16], the “remote sensing ecological index” model [17], the “vulnerability scoping diagram” (VSD) model [18,19], and the “pressure-state-response” (PSR) model [20], among others, for selecting indicator factors. The SRP model, which emphasizes the interplay between natural and social forces, is built around the fundamental idea of ecosystem stability. It assesses ecological vulnerability from three dimensions: ecological sensitivity, ecological resilience, and ecological pressure, providing a more comprehensive understanding of the characteristics of regional ecological vulnerability. It is applicable to urban settings and has been extensively utilized in studies on ecological vulnerability [21,22]. In calculating the weights of indicators, most scholars primarily use methods such as artificial neural networks [23], analytic hierarchy processes [24], the entropy weight method [25], principal component analysis [26,27], and the comprehensive evaluation method [28] to measure the contribution of each indicator. However, single evaluation methods have various limitations. As research progresses, evaluation approaches have gradually shifted towards a combination of methods. This integrated approach leverages the strengths of both methods, making the results more scientifically robust and objective. The CRITIC weighting method effectively considers the differences and correlations among indicators, thereby minimizing errors caused by information overlap between them [29]. As a result, the indicator weights in this study are determined by combining the AHP with the CRITIC weighting approach. Few studies have focused on modeling projections for conditions of future environmental change, with most recent studies primarily focusing on the dynamic assessment of the geographical and temporal evolution of regional ecological vulnerability [30]. In terms of study areas, Current evaluations of ecological vulnerability are primarily focused on arid and semi-arid zones [31,32,33], extreme disaster areas [34,35], the Himalayas [36,37], the Tibetan Plateau [38,39,40], karst regions [41,42], wetlands [43], forests [44], and other ecologically fragile areas. The ecological fragility of China’s Heilongjiang Province, a significant grain-producing region, is, nevertheless, poorly understood.
Heilongjiang Province is a key region in China, both in terms of agricultural and ecological resources, and plays a critical role as the “ballast of national food security”, making it vital to the country’s food and ecological security. Since 2000, the unreasonable development and utilization of land resources has led to the increasing degradation of black soil, resulting in soil erosion and desertification, which in turn causes a decline in land fertility. Due to the unique geographical location of Heilongjiang Province, spring droughts and flood disasters are also significant ecological and environmental issues. Additionally, with the continuous advancement of urbanization, the discharge of water used for production and daily life has impacted the water resources of the Songhua River Basin. These factors highlight the immense pressure on the ecological environment of Heilongjiang Province, making the strengthening of ecological protection and construction a matter of urgent importance. With the development of technology, the capabilities of Geographic Information System (ArcGIS 10.8) software in data processing and spatial analysis have significantly improved. In their study on urban forest management and the application of tree databases in urban greening, Nattasit Srinurak et al. [45] defined the tree survey and analysis process by integrating GIS and a web-based interface. CA-Markov models were initially widely used for assessing future land use changes and have since yielded promising results in various other fields [46]. Using Heilongjiang region as a case study, the study examines the ecological vulnerability of the region in 2000, 2010, and 2020 using remote sensing and GIS software. By integrating the AHP-CRITIC method with a GeoDetector, a more comprehensive perspective on factor analysis is provided, revealing the interactions of indicator factors over different periods and further deepening the understanding of the spatiotemporal dynamics of ecological vulnerability. Additionally, the application of the CA-Markov model offers a new approach for predicting trends in ecological vulnerability. This study not only advances the theoretical understanding of ecological vulnerability but also provides forward-looking predictions and new scientific evidence for regional ecological environment management and the creation of policies for sustainable development.

2. Materials and Methods

2.1. Study Area

The northeastern Chinese province of Heilongjiang (43°26′–53°33′ N, 121°11′–135°05′ E) has a total land area of 473,000 km2. It includes the Daxinganling region and twelve cities at the prefectural level (Figure 1). According to the Heilongjiang Provincial Statistical Yearbook, the population was 31.71 million by the end of 2020, the GDP was 1369.85 billion yuan, and the urbanization rate was 65.6%. Heilongjiang Province is characterized by numerous mountain ranges with an average altitude of 300 to 1000 m. The climate is cold-temperate and temperate continental, featuring four distinct seasons with concurrent rainfall and heat. The average annual temperature is between −5.3 °C and 5 °C, while the average annual precipitation is between 400 and 650 mm. Heilongjiang Province is rich in natural resources, with vast forested areas, diverse wetland types, and prominent ecological functions, holding significant ecological importance. Due to its proximity to Russia, the Heilongjiang River Basin forms a unique cross-border ecological corridor along the China–Russia border. The black soil arable land area of Heilongjiang Province, which makes up 56.1% of Northeast China’s total area, is 1.04 × 10⁵ km2, making it the province with the biggest area of arable land in China. It is one of China’s main bases for grain production and is essential to the long-term viability of the country’s agricultural sector [47]. The study region excludes the districts of Songling and Gaghdach.

2.2. Data Sources

This study selects the years 2000, 2010, and 2020 as crucial time periods to investigate the spatiotemporal changes in ecological vulnerability in Heilongjiang Province. Data for these years are relatively complete in both domestic and international databases, providing accurate information for ecological vulnerability analysis. Additionally, these years coincide with significant policy implementation and environmental change periods in Heilongjiang. In 2000, the province adopted several important measures for ecological protection and environmental governance, while 2020 marks a crucial milestone in China’s comprehensive advancement of ecological civilization. Therefore, the study utilized topographic, meteorological, remote sensing, land use, socio-economic, and other data for Heilongjiang Province covering the years 2000, 2010, and 2020 (Table 1). To ensure consistency and accuracy across all datasets, the raster data resolution was uniformly set to 1 km × 1 km, and the spatial data were projected using the Krasovsky coordinates Albers projection.

2.3. Methodology

Based on remote sensing and GIS technology, this work uses the SRP model in conjunction with the AHP-CRITIC approach for weighted aggregation to examine the spatiotemporal differentiation characteristics of ecological vulnerability in Heilongjiang Province over three periods. Its motivating factors are investigated using the geographical detector model, and the distribution pattern of ecological vulnerability in 2030 is predicted using the CA-Markov model. Figure 2 shows the framework for the investigation.

2.3.1. Selection of Evaluation Indicators

A total of 13 specific indicators were chosen to build the assessment index system based on pertinent vulnerability research publications, the SRP ecological vulnerability evaluation model [48,49], and the actual ecological conditions in Heilongjiang Province (Table 2). The selection followed the principles of systematics, timeliness, scientific validity, and data accessibility while incorporating both natural and anthropogenic factors. “Ecological sensitivity” refers to the way an ecosystem responds to external disturbances [50]. Six indicators are selected from the perspectives of topography and climate: elevation, slope, annual average temperature, annual precipitation, PM2.5, and dry degree. Ecological resilience is the capacity of an ecosystem to recover from external disturbances as long as the disruption does not rise above the recovery threshold [51]. Four indicators are selected from the perspective of ecological vitality: landscape diversity index, normalized vegetation index, biological abundance, and net primary productivity of vegetation. The extent of pressure from outside disturbances on an ecosystem, usually resulting from human activity, is referred to as ecological pressure [6]. It is represented by three indicators: population density, GDP per capita, and land use intensity.

2.3.2. Index Standardization and the Determination of Weights

(1)
Index Standardization
Due to differences in the nature and attributes of each evaluation indicator, positive and negative indicators must be standardized separately using the polar deviation standardization method [52]. The following formula is applied:
Positive indicators:
R m = x i x m i n x m a x x m i n
Negative indicators:
R n = x m a x x i x m a x x m i n
where Rm and Rn are the standardized values of indicator i, xi is the original value of indicator i and xmax and xmin are the maximum and minimum values of the i-th indicator, respectively.
(2)
Determination of Weights
Diakoulaki initially suggested the entropy weighting approach, which is improved upon by the CRITIC weighting method [53]. The standard deviation and correlation coefficient, which are then utilized to generate weight values, show the variability and disagreement between indicators. A larger standard deviation results in a higher weight assignment, while a higher correlation coefficient indicates less conflict, leading to a smaller weight assignment. The calculation formulas are as follows:
ω i = 1 m i = 1 m X i j X ¯ j 2     i = 1,2 , , n
ρ i j = c o v X i ,     X j ω i ,     ω j   i ,       j = 1,2 , , n
W j = ω j i = 1 n 1 ρ i j
E j = W j j = 1 n W j
where ωi is the standard deviation of the i-th indicator; ρij is the correlation coefficient of the i-th and j-th indicators; Wj represents the information content of the j-th indicator in the evaluation indicator system; and Ej indicates the objective weight of the j-th indicator.
The AHP method was chosen for subjective weighting, while the CRITIC method was used for objective weighting. The AHP method relies primarily on expert judgment to assess the reasonableness of indicator weights, making it highly subjective [54]. Therefore, the two methods are combined, and the formulas are as follows:
W = λ β i + 1 λ β j
where W, βi, and βj represent the combined, subjective, and objective weight values, respectively. Based on the formula for determining the comprehensive weight of the indicators, λ is set to 0.5 [55] to guarantee the impartiality of the calculation findings.

2.3.3. Integrated Ecological Vulnerability Assessment

In this paper, the Ecological Vulnerability Index (EVI) is employed to quantify the degree of ecological vulnerability, using the following formula:
E V I = i = 1 n X j × W i j
where EVI is the Ecological Vulnerability Index, Wij is the standardized data for each indicator, n is the total number of indicators, and Xj is the aggregate weight of the j-th indication. The EVI and the degree of ecological vulnerability in the area are positively correlated.
The natural breaks method is a commonly used classification technique for spatial data. It automatically determines the breakpoints based on the fluctuations in the data distribution curve, reducing errors introduced by subjective selection. This method reflects the data’s variation trends, making the classification results more interpretable and visually intuitive. Based on the ecological vulnerability index’s standardization and the findings of earlier research [56], the vulnerability index was divided into five groups using the natural breakpoint technique [24]. These levels are slight vulnerability [0~0.231], light vulnerability (0.231~0.314], medium vulnerability (0.314~0.412], heavy vulnerability (0.412~0.510], and extreme vulnerability (0.510~1].

2.3.4. Spatial Autocorrelation

The degree of reliance between a given unit’s attribute values and those of its nearby units is known as spatial autocorrelation [57]. It is separated into local and global Moran’s I indices [58]. A certain attribute value’s spatial relationship throughout the entire study region is evaluated using the global Moran’s I. Global Moran’s I ∈ [−1, 1]; when Global Moran’s I > 0, it indicates spatial positive correlation; when global Moran’s I < 0, it indicates spatial negative correlation; and when Global Moran’s I = 0, it suggests no significant spatial autocorrelation. The local Moran’s I reveals the spatial distribution of local heterogeneity [59]. By analyzing spatial clustering using the local Moran’s I index, a LISA map can be generated. Ecological vulnerability is classified into five clustering patterns within a 95% confidence interval: high-high clustering (H-H), high-low clustering (H-L), low-high clustering (L-H), low-low clustering (L-L), and no significant clustering (no significant). The specific details are provided in Table 3 [60].
G l o b a l   M o r a n s   I = i = 1 n j = 1 n w i j x i x ¯ x j x ¯ i = 1 n j = 1 n w i j i = 1 n x i x ¯
L o c a l   M o r a n s   I i = x i x ¯ S 2 j w i j x j x ¯
where xi and xj represent the landscape ecological risk values for the i-th and j-th evaluation units; x ¯ is the average landscape ecological risk value across all evaluation units; wij is the spatial weight matrix; and S is the sum of all elements in the spatial weight matrix.

2.3.5. GeoDetector

A statistical technique called GeoDetector is utilized to find the causes of geo-graphic events and detect their spatial heterogeneity [61]. It was put forth by Wang Jinfeng [62] and associates and consists of the ecological, factor, risk, and interaction detectors. Both a factor detector and an interaction detector are used in the investigations in this publication. The amount that the independent variable, represented by q, explains the dependent variable is revealed using a factor detector. Stronger explanatory power of the independent variable X in explaining changes in the dependent variable Y is indicated by a greater value of q.
q = 1 h = 1 L N h σ h 2 N σ 2
where the stratification of the independent variable or factor is denoted by h = 1, …, L; the number of cells in stratum h and the entire area is Nh; and the ecological vulnerability variances in stratum h and the entire area are denoted by σh2 and σh2, respectively.
To determine if the explanatory power of ecological vulnerability is increased or decreased when several independent variables interact, interaction detectors are utilized [63]. The types of interactions are presented in Table 4.

2.3.6. CA-Markov Model

The dynamic evolution of complex systems is frequently simulated using cellular automata (CA), a dynamic mathematical model that functions in discrete states in both time and space [64], as modeled by
S i j t + 1 = f q S i j t
where the state of the ij-th cell is denoted by S, the time moments by t and t + 1, the transition function by f, and the neighborhood by q.
Markov models are used to simulate the prediction of future conditions based on the transfer probabilities between the initial and intermediate periods [53] and are modeled as
S e = S O P e
where Se is the state after e cycles; SO is the initial state; e is the number of cycles; and Pe is the transition probability matrix.
The correctness of the spatial patterns between the expected and actual findings is verified using the Kappa coefficient, which is computed using the CROSSTAB module in IDRISI Selva software (v17.02). When Kappa < 0.4, it indicates a poor consistency between the simulated and actual results, with low simulation accuracy. The results of the simulation are average at best when 0.4 < Kappa < 0.75. A high degree of consistency between the simulated and real results, together with good simulation performance, is indicated when Kappa is greater than 0.75 [65]. The following formula can be used to determine the Kappa coefficient:
K a p p a = p 0 p c p p p c
where p0, pp, and pc represent the percentages of correct modeling under actual conditions, ideal conditions, and random conditions, respectively.

3. Results

3.1. Features of Heilongjiang Province’s Ecological Vulnerability Changes over Time

The percentage of the area in Heilongjiang Province corresponding to the three vulnerability levels, as shown in Table 5, reveals the temporal changes in ecological vulnerability. The average Ecological Vulnerability Index (EVI) values from 2000 to 2020 were 0.323, 0.317, and 0.347, in that order. This indicates a trend of initial stabilization followed by a worsening of ecological vulnerability. The areas categorized as having mild, slight, and moderate vulnerability predominantly dominated the province, accounting for 73.98%, 70.62%, and 68.85% of the total area, respectively. Although the percentage of the study area classified under various ecological vulnerability classes varies significantly over time, these numbers suggest that more than half of the region constantly falls under these vulnerability categories. Overall, Heilongjiang Province’s ecological vulnerability has been gradually increasing, as evidenced by a decline in the percentage of places with high vulnerability grades and an increase in the percentage of areas with lower vulnerability classes. Between 2000 and 2010, the areas classified as slightly, moderately, and severely vulnerable increased by 5.57%, 0.28%, and 6.53%, respectively. In contrast, the proportion of areas with mild and extreme vulnerability declined by 9.22% and 3.17%, respectively. Notably, the reduction in extremely vulnerable areas contributed to a relative decrease in the overall ecological vulnerability of Heilongjiang Province during this period. From 2010 to 2020, the regional vulnerability index of Heilongjiang Province increased. The slightly vulnerable area decreased from 142,884 km2 to 92,439 km2, a reduction of 11.51%. Meanwhile, the moderately vulnerable and extremely vulnerable areas increased by 2.78% and 8.22%, respectively. This trend indicates that ecosystems in the province were under growing pressure during this period.
To further analyze the area transformation characteristics across different vulnerability levels, the area transfer matrix was visualized. An ecological vulnerability level transfer map from 2000 to 2020 in Figure 3 displays the findings. Between 2000 and 2010, areas with slight vulnerability predominantly transitioned to mild vulnerability, with a smaller proportion shifting to moderate vulnerability. Mild vulnerability mainly transitioned to slight vulnerability, with the remainder moving to moderate vulnerability. Moderate vulnerability primarily transitioned to severe vulnerability, while severe vulnerability largely shifted to moderate and extreme vulnerabilities. Approximately half of the extreme vulnerability area transitioned to moderate vulnerability. The total area transitioning out of slight vulnerability was 17,855.8 km2, with 9706 km2 shifting to lower vulnerability categories and 83,852 km2 transitioning to higher vulnerability classes. This further suggests a reduction in ecological vulnerability between 2000 and 2010. Between 2010 and 2020, all vulnerability classes predominantly shifted towards higher vulnerability categories, further indicating an increase in ecological vulnerability during this period.

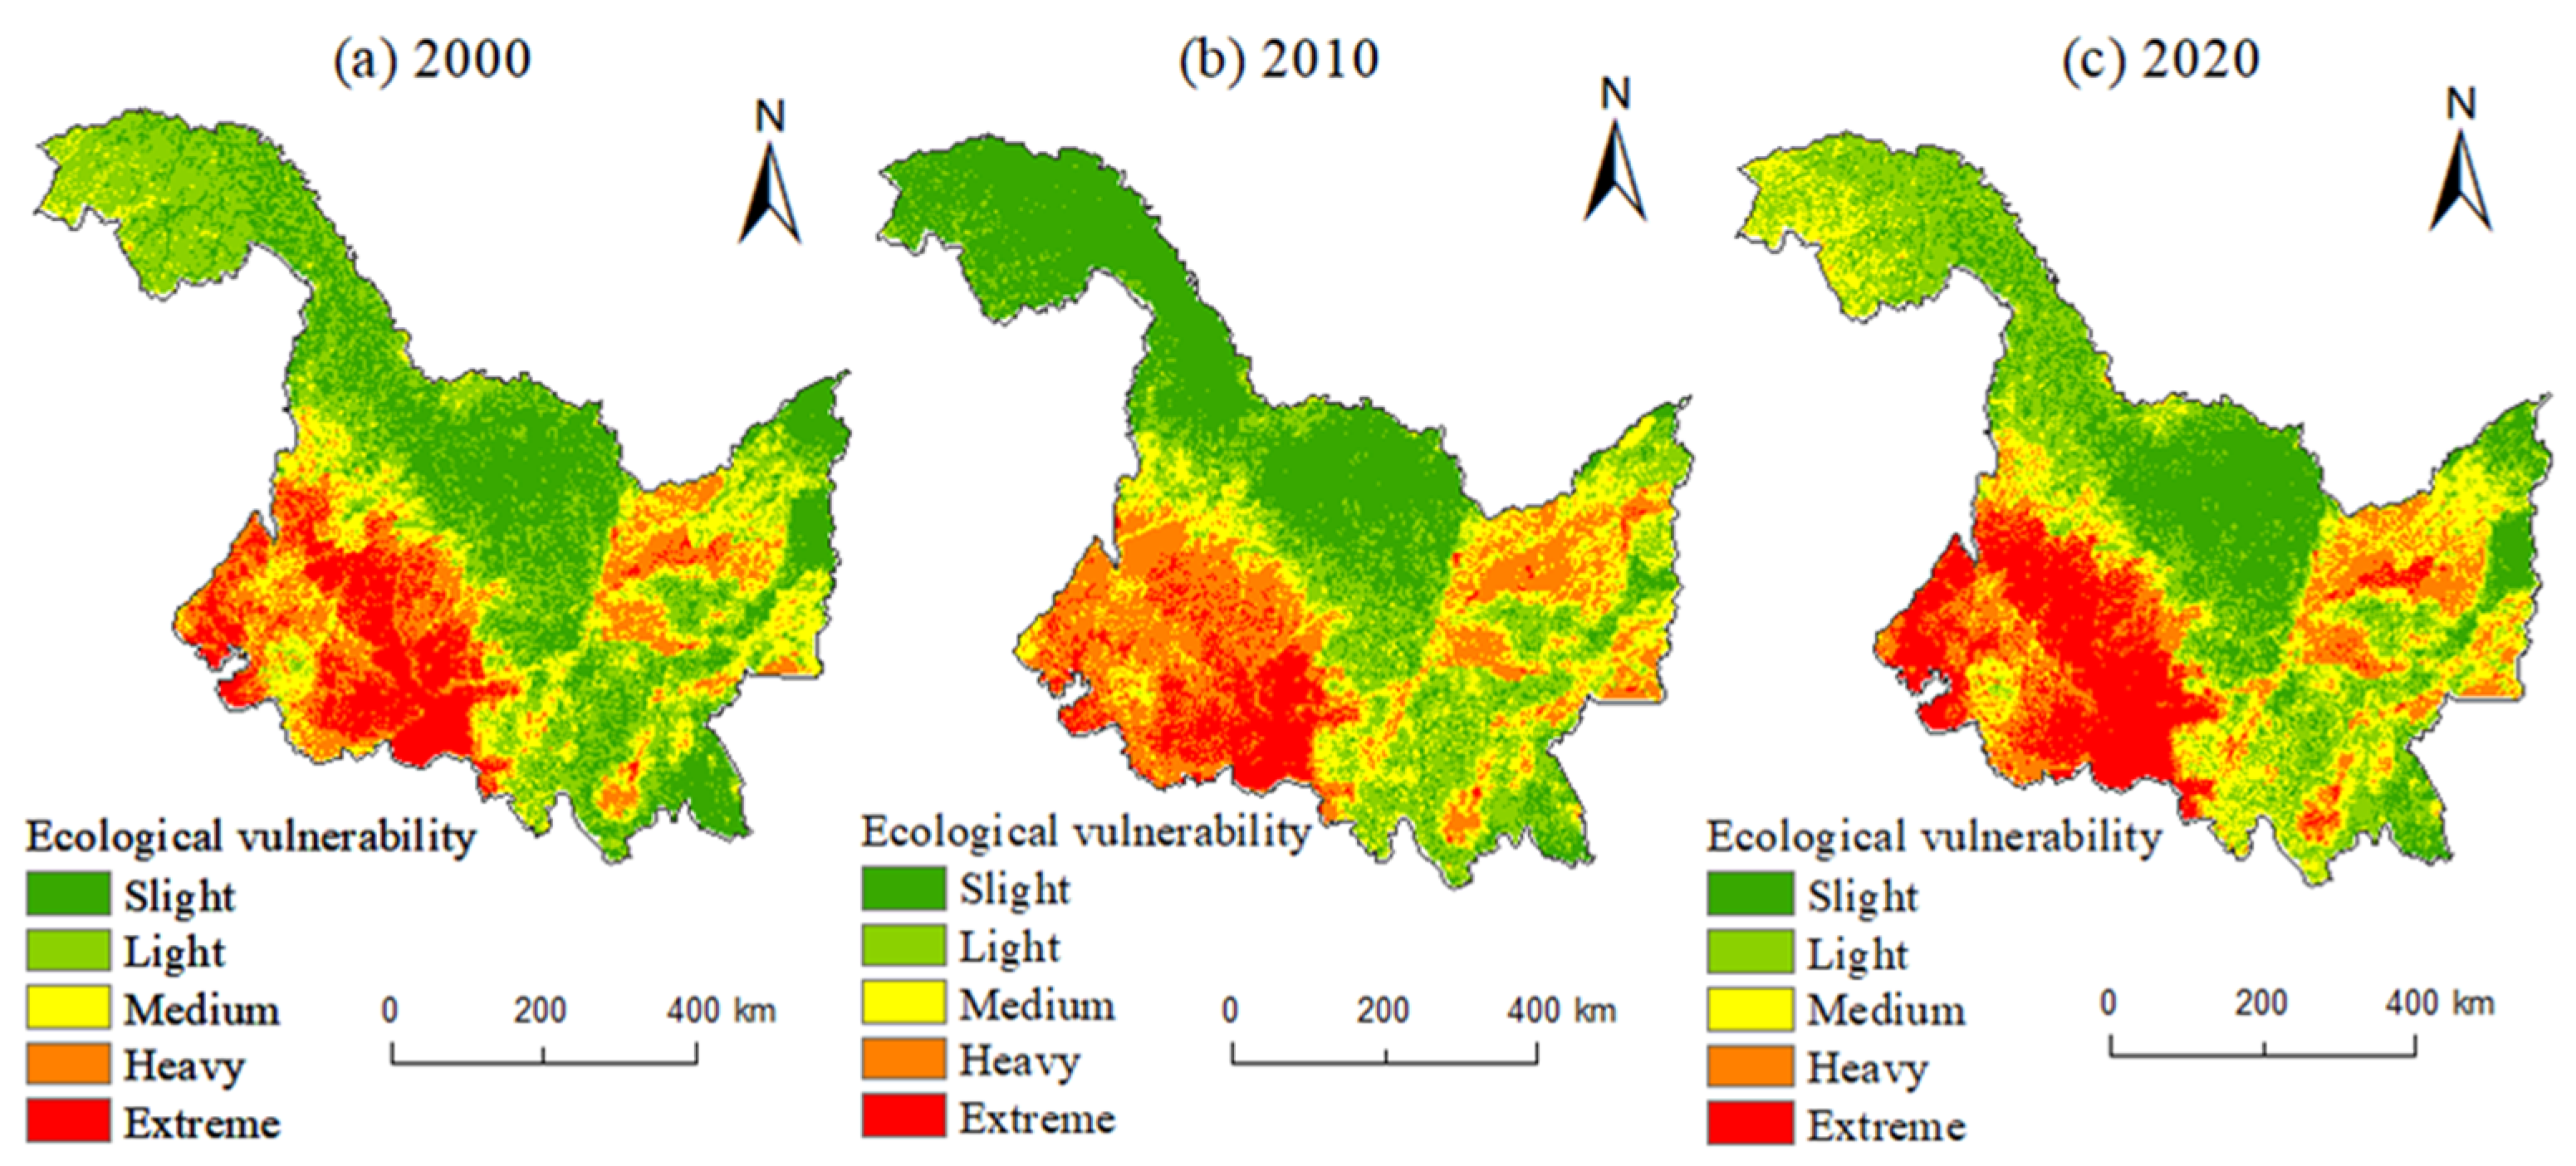
3.2. Features of Ecological Vulnerability’s Spatial Distribution

The results of the weighted indicators were summed up using ArcGIS 10.8 software to generate the ecological vulnerability distribution map of Heilongjiang Province for the period from 2000 to 2020 (Figure 4). As shown in Figure 4, the spatial heterogeneity is evident, with a distribution pattern of ‘higher in the east and west, lower in the north and south’. The north-western (Daxing’anling Region, Heihe City), north-eastern (Yichun City), and south-eastern (Mudanjiang City) regions of Heilongjiang Province are predominantly characterized by mild and slight vulnerability. These areas are marked by elevation, woodland land use types, high vegetation cover, strong soil water retention capacity, and low population density, contributing to favorable ecological conditions. In contrast, the western (Qiqihar City, Daqing City, Harbin City) and central (Suihua City) regions are dominated by heavy and extreme vulnerability. These areas are densely populated and frequently disturbed by human activities, with rapid economic development and industrialization exacerbating PM2.5 pollution and increasing arid climate, causing the ecological environment to deteriorate. From 2000 to 2010, the mean EVI value in Heilongjiang Province decreased from 0.323 to 0.317. During this period, the Daxinganling area shifted from light to slight vulnerability, while part of the extreme vulnerability areas in Qiqihar City and Suihua City changed to heavy vulnerability areas, indicating a decrease in vulnerability. However, from 2010 to 2020, the mean EVI increased from 0.317 to 0.347, reflecting an overall increase in vulnerability. During this time, parts of Daxinganling transitioned from slight to medium vulnerability, the north-western Heihe region shifted from slight to light, Qiqihar City changed from medium to extreme vulnerability, and the southern part of Harbin City transitioned from light to medium vulnerability.
A further comparison of the differences in ecological vulnerability among the municipalities was made based on the average ecological vulnerability values for the three periods, as shown in Figure 5. The mean ecological vulnerability values for each city ranged from 0.21 to 0.49, with Qiqihar having the highest three-period average and Yichun having the lowest. Among them, Yichun City, Daxing’anling Region, Qitaihe City, and Mudanjiang City had EVI values between 0.2 and 0.3. In contrast, Shuangyashan City, Qitaihe City, Hegang City, Jixi City, and Jiamusi City had EVI values between 0.3 and 0.4. The remaining municipalities had average EVI values greater than 0.4 across the three periods.

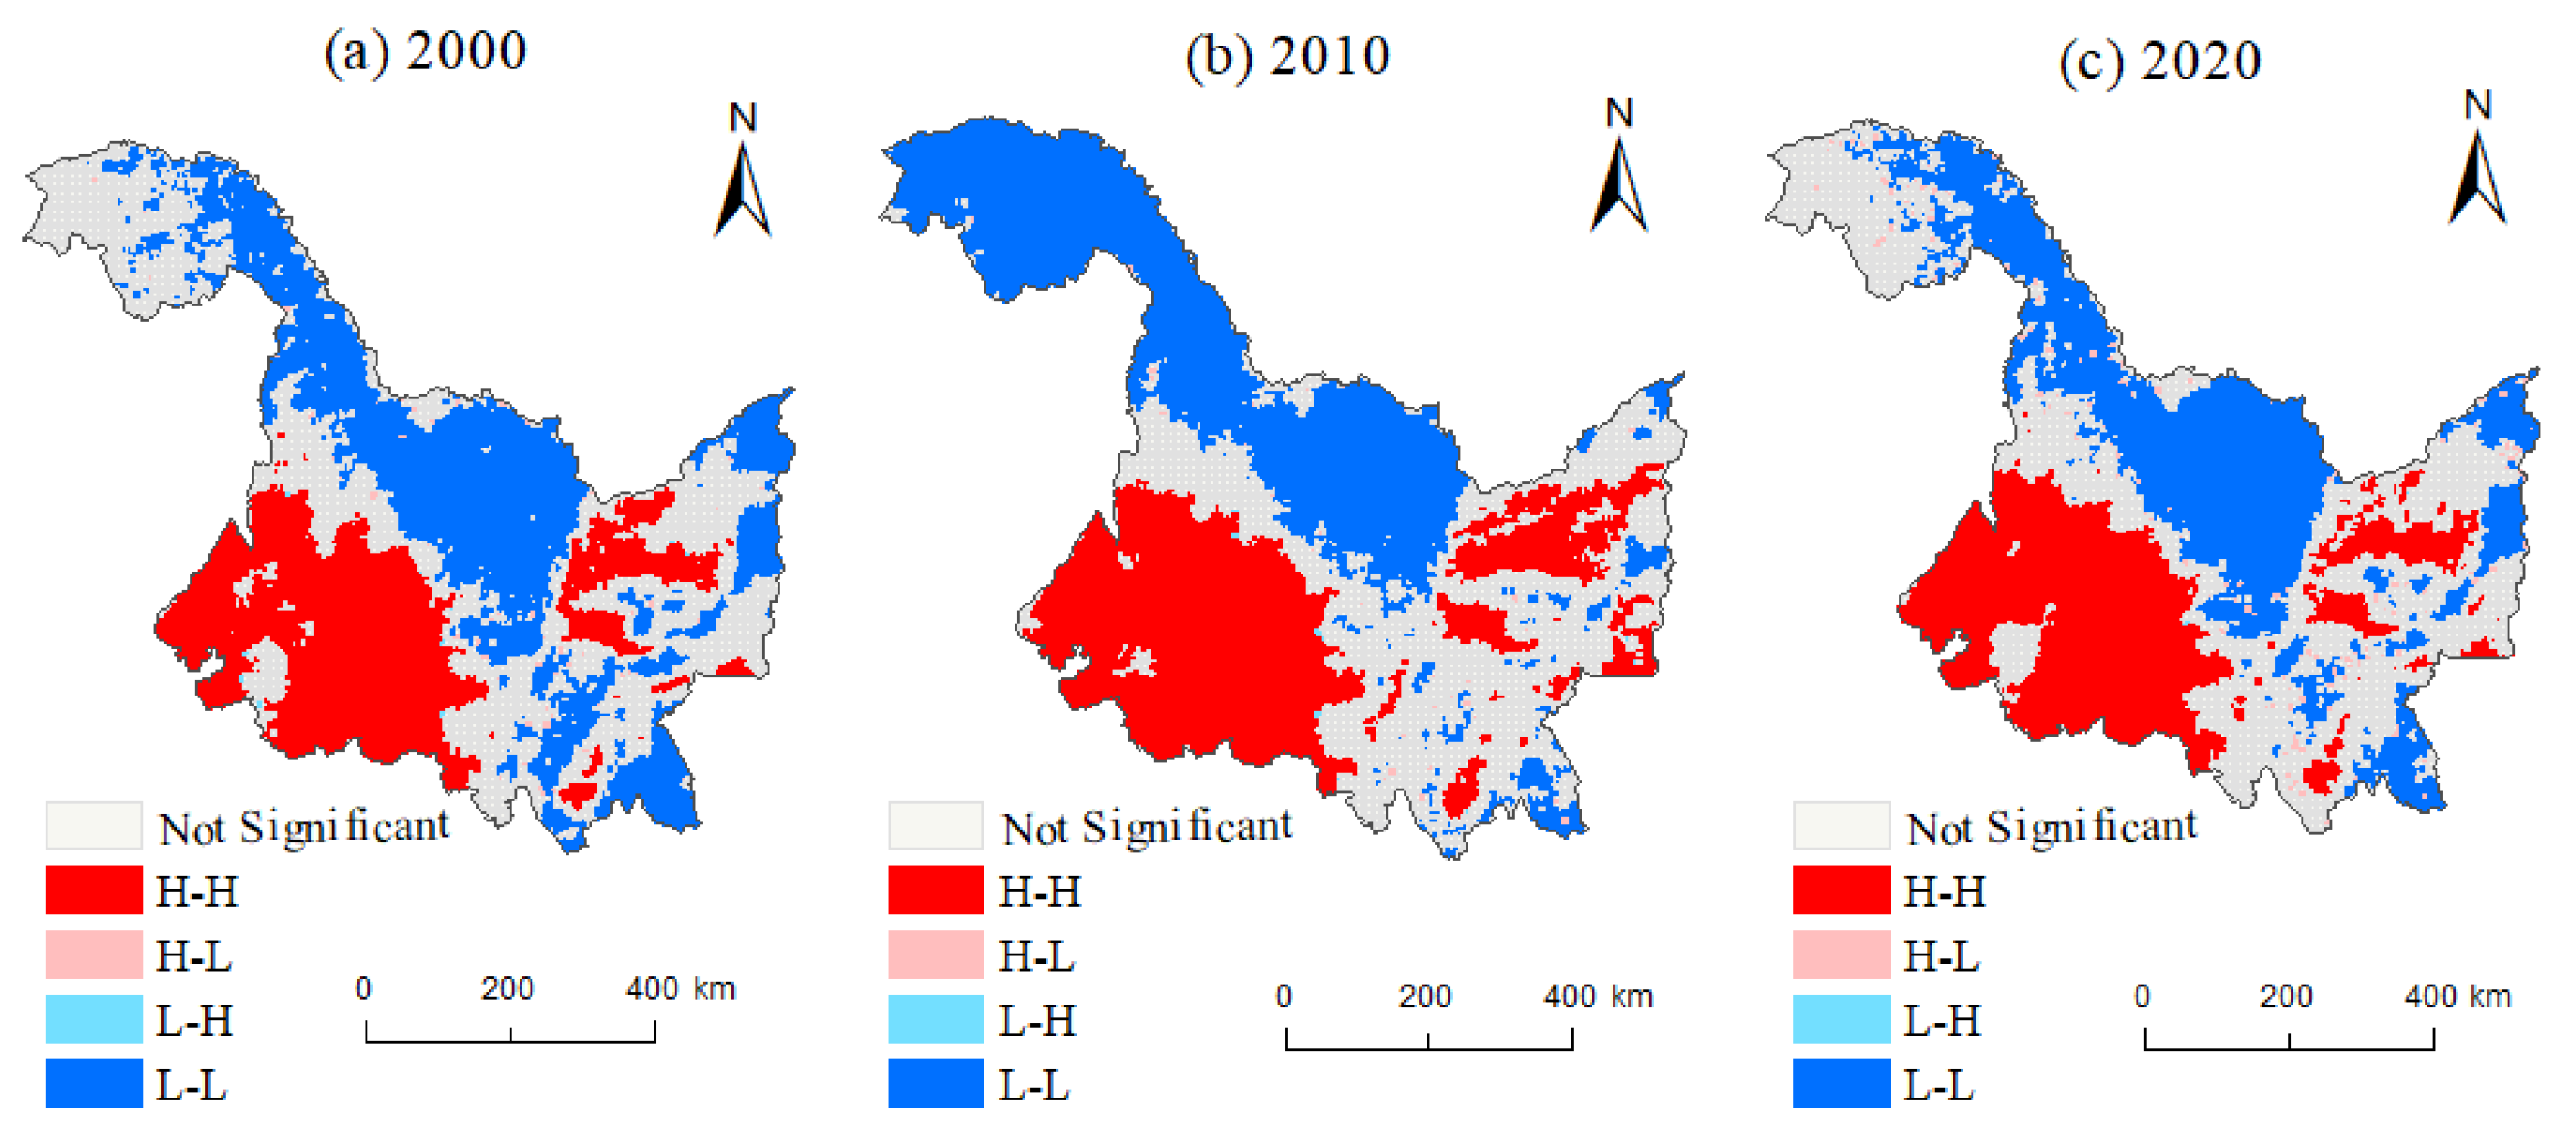
3.3. Analysis of Ecological Vulnerability via Spatial Correlation

For 2000, 2010, and 2020, the corresponding Moran’s I values were 0.916, 0.927, and 0.919, respectively. This suggests that ecological vulnerability in Heilongjiang Province is significantly spatially clustered and positively correlated. Between 2000 and 2020, Heilongjiang Province’s degree of spatial agglomeration and correlation first strengthened before subsequently diminishing. The LISA map was created using the Moran’s I value, as seen in Figure 6. High-high (H-H) and low-low (L-L) agglomeration are the two main agglomeration types in the research region; low-high (L-H) and high-low (H-L) agglomeration make up a comparatively lesser percentage of the total. The H-H areas are mostly found in the eastern (Hegang City, Jiamusi City, Shuangyashan City) and southwestern (Qiqihar City, Daqing City, Suihua City, Harbin City) regions of the study area, where severe and extreme ecological vulnerability predominates. The percentage of this area increased from 27.28% in 2000 to 28.67% in 2020, with a reduction in area of 1835.27 km2. The L-L aggregation area is primarily distributed in the northeastern (Yichun City), northwestern (Heihe City), and southeastern (Mudanjiang City) parts of the study area, where ecological vulnerability is mainly dominated by mild and slight vulnerability. The area share decreased from 37.55% in 2000 to 35.00% in 2020, with a reduction in area of 11,480.82 km2. This suggests that Heilongjiang Province’s total area of ecological vulnerability, both in the high and low value, is shrinking. Less than 1% of the entire land is made up of the high-low and low-high regions, which are dispersed unevenly.

3.4. Driving Factor Analysis

The study organizes 13 indicator factors into a unified format spatial dataset and applies the natural breaks method for discretization. These factors are treated as independent variables. The study region is divided using a 5 km × 5 km grid, and the dependent variable is the mean EVI values for the three periods. The q-values of each factor are calculated to assess its explanatory power regarding the spatial distribution of ecological vulnerability. Factors with q-values greater than 0.1 are considered to have a strong explanatory influence on ecological vulnerability. Building on the single-factor effects, the interacting q-values are calculated to determine whether significant synergistic effects exist between factors.
The factor detection results from the GeoDetector (Version 2017) are presented in Table 6, which shows the findings from the identification of the main causes of ecological vulnerability. Each indicator factor’s explanatory capacity for Heilongjiang Province’s ecological vulnerability over the three phases is significant, as indicated by the p-value of 0. The top five q-values in 2000 were biological abundance (0.586), dry degree (0.558), net primary productivity (0.515), PM2.5 (0.460), and population density (0.408), with biological abundance exhibits the strongest explanatory power in relation to ecological vulnerability. In 2010, the top five q-values were net primary productivity (0.652), biological abundance (0.625), PM2.5 (0.598), dry degree (0.597), and annual average temperature (0.433), with net vegetation productivity emerging as the dominant factor of ecological vulnerability, followed by biological abundance. The top five indicators in 2020 were the same as those in 2010, although the magnitude of the q-values slightly changed. It can be observed that biological abundance, net primary productivity, dry degree, and PM2.5 are the primary factors affecting the shifts in Heilongjiang Province’s ecological vulnerability’s regional distribution, with q-means of 0.591, 0.583, 0.547, and 0.515, respectively. In contrast, the q-means of population density, GDP per capita, and landscape diversity index are all less than 0.1, indicating their relatively minor influence. Additionally, the q-mean for the degree of land use is 0.312, making it the anthropogenic factor with the strongest explanatory power for ecological vulnerability in Heilongjiang Province.
To assess the extent of the explanatory power of ecological vulnerability after the interaction of any two factors, an interaction analysis was conducted, and the results are presented in Figure 7. The analysis of indicator interactions across the three phases consistently revealed either a two-factor enhancement or a non-linear enhancement. This indicates that the explanatory power of ecological vulnerability, when accounting for the interaction between any two factors, surpasses that of any single factor alone. It implies that rather than being purely determined by individual elements or their straightforward cumulative implications, Heilongjiang Province’s ecological vulnerability is shaped by the combined effects of several driving forces.
With a q-value of 0.723, biological abundance (X9) and PM2.5 (X5) showed the highest correlation in 2000. In 2010, the strongest interaction occurred between net primary productivity (X10) and PM2.5 (X5), with a q-value of 0.789. In 2020, the strongest interaction was between net primary productivity (X10) and desiccation (X6), with a q-value of 0.710. These findings further confirm that biological abundance, net primary productivity, dry degree, and PM2.5 are key factors with strong explanatory power for ecological vulnerability in Heilongjiang Province.

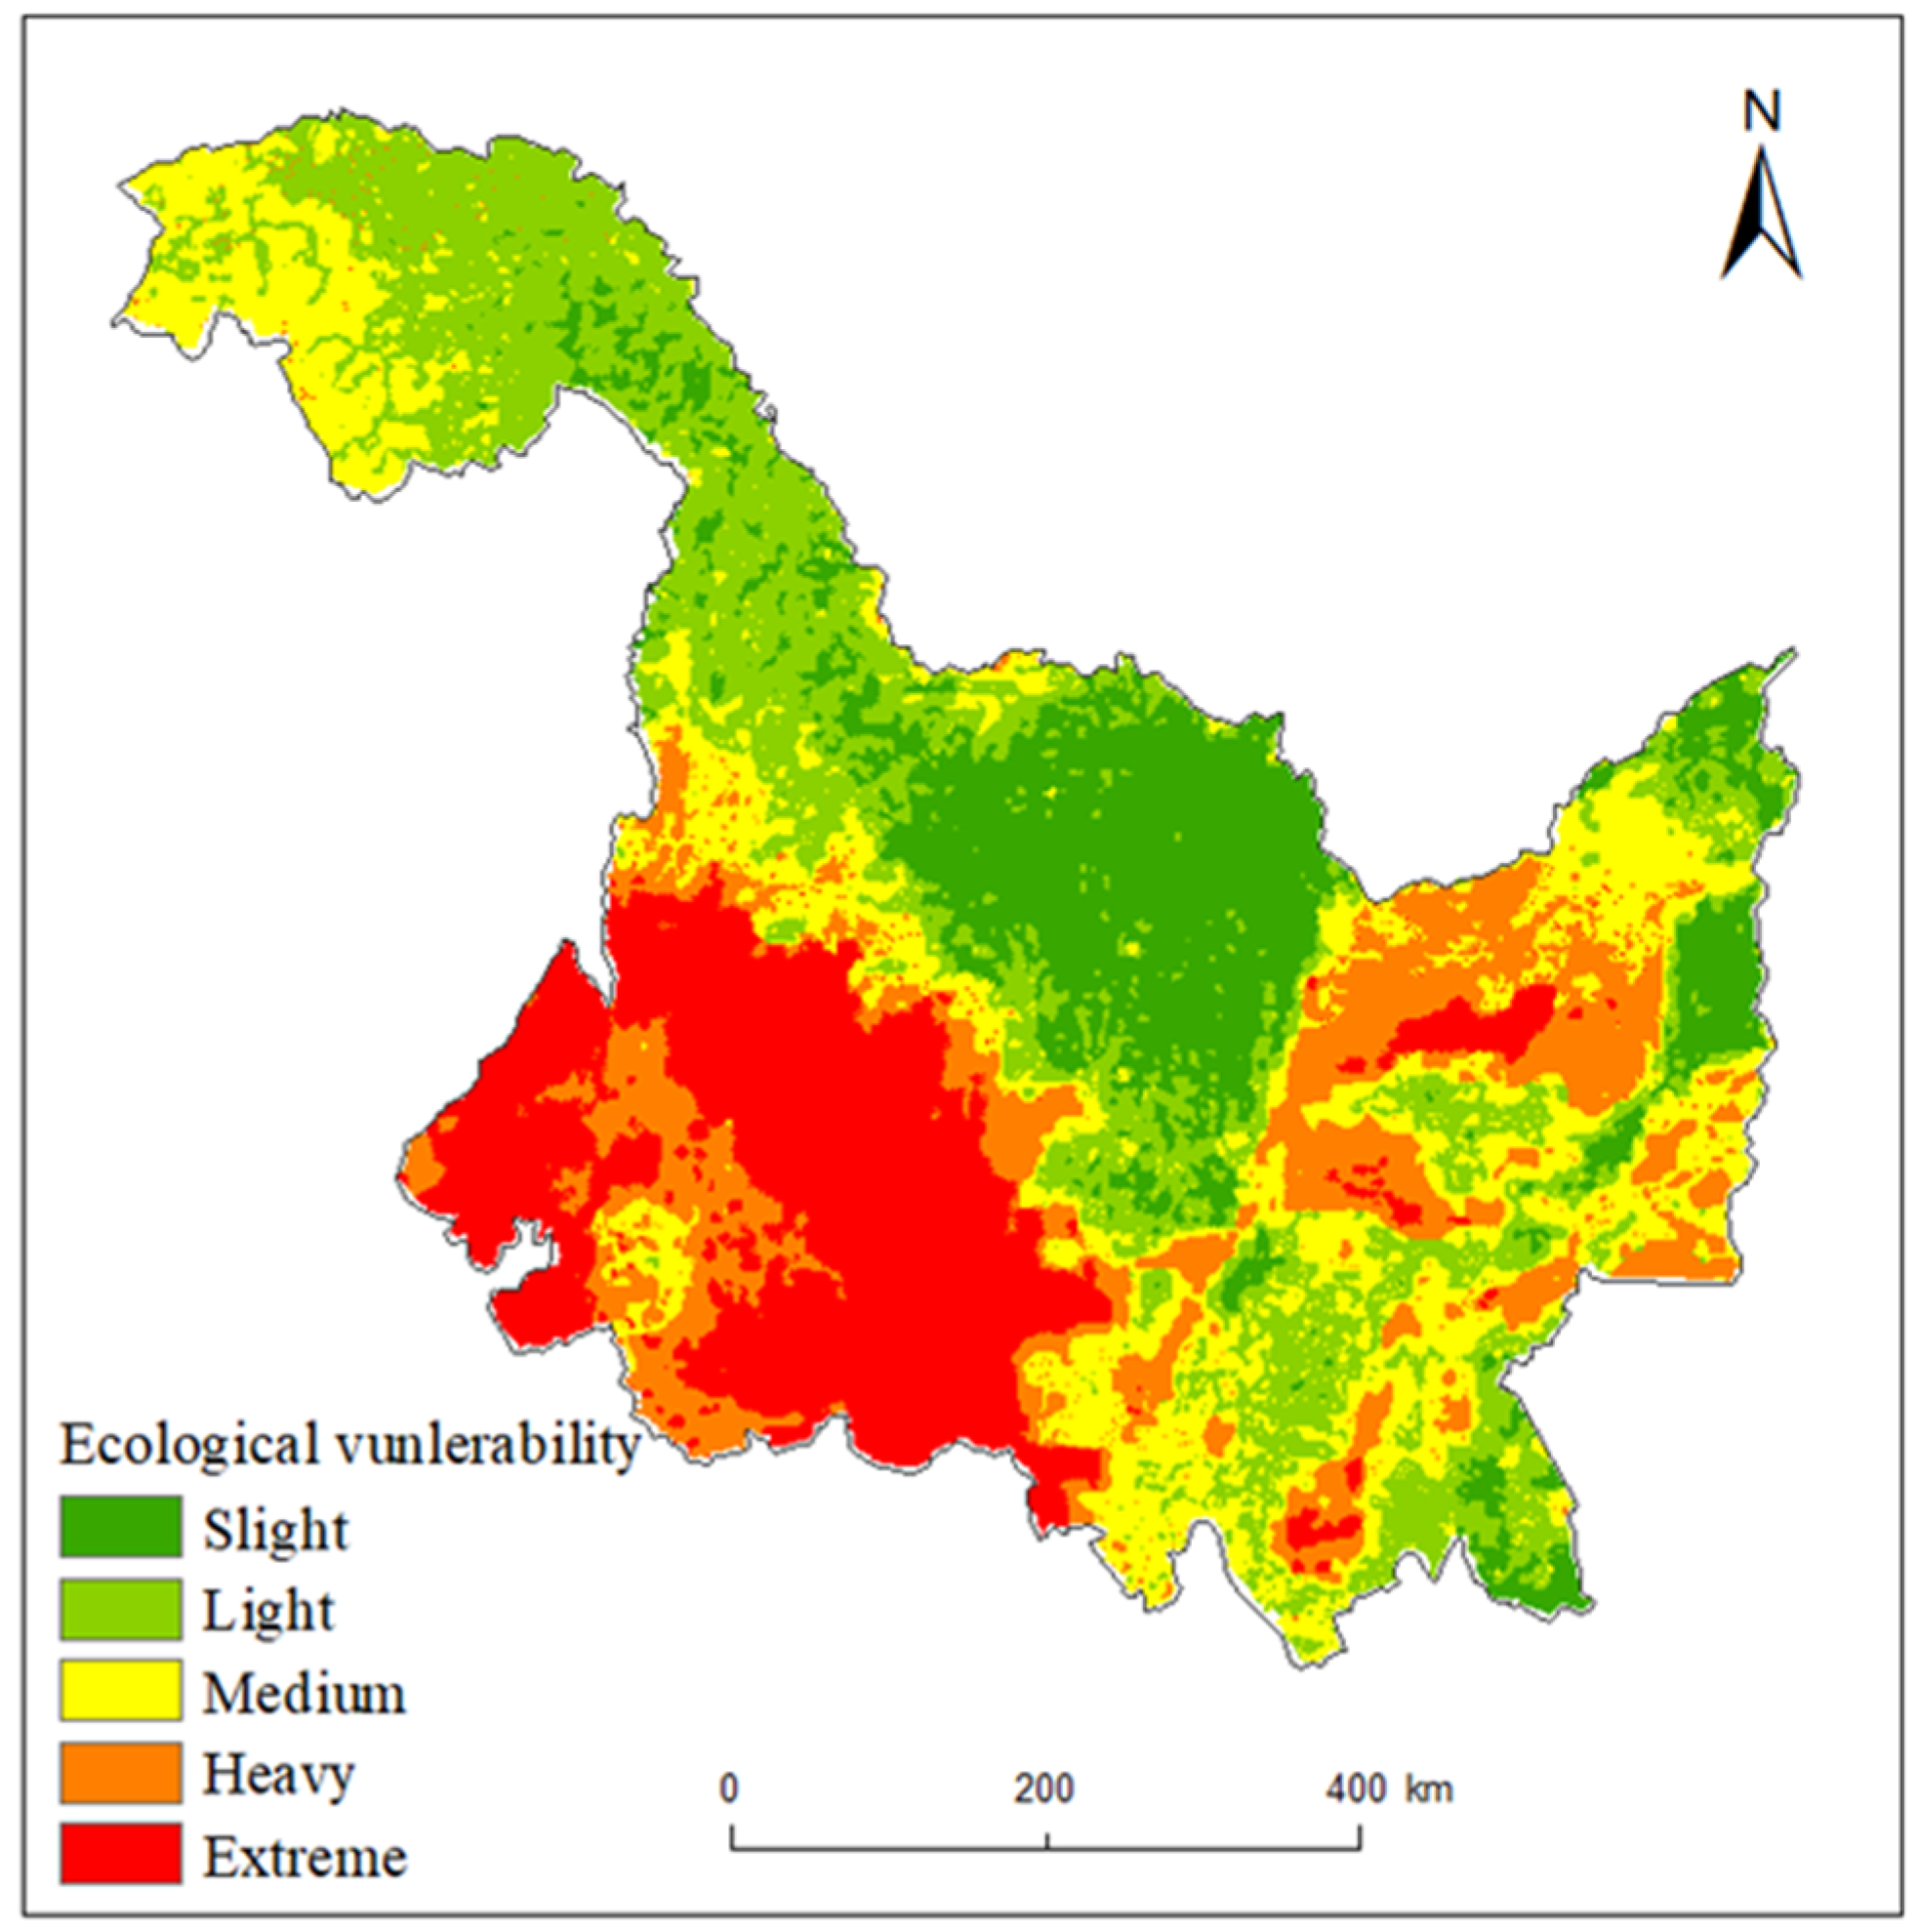
3.5. CA-Markov Predictive Analytics

Using the CA-Markov model in the IDRISI program, ecological vulnerability data from 2010 in Heilongjiang Province served as the baseline. The ecological vulnerability of Heilongjiang Province in 2020 was simulated using the ecological vulnerability transition matrix from 2000 to 2010. The proportional error was set to 0.15 and the iteration coefficient was 10. The simulation results were then compared with the 2020 data for accuracy verification. The simulated and real 2020 data showed a high degree of consistency, as indicated by the computed Kappa coefficient of 0.77, which is higher than 0.75. This suggests that the model is suitable for predicting the ecological vulnerability of Heilongjiang Province in 2030. The ecological vulnerability data for 2010 and 2020 were used to predict the vulnerability of Heilongjiang Province in 2030, with the results presented in Figure 8. Overall, in 2030, Heilongjiang Province is expected to be predominantly characterized by light and medium vulnerability, with the percentages of slightly vulnerable, lightly vulnerable, mediumly vulnerable, heavily vulnerable, and extremely vulnerable areas being 16.37%, 25.99%, 22.23%, 15.74%, and 19.68%, respectively. While the area proportion of low vulnerability grades fell, the area share of high vulnerability grades rose compared to 2020. Specifically, the area of slight vulnerability decreased by 20,729 km2, a reduction of 4.73%, and the area of light vulnerability decreased by 3968 km2, a decrease of 0.91%. Conversely, the area shares of heavy and extreme vulnerability increased by 0.51% and 3.67%, respectively. This indicates that by 2030, the ecological vulnerability of Heilongjiang Province will have worsened, highlighting the need for strengthened ecological protection measures.

4. Discussion

The study combines the SRP model with the AHP-CRITIC method for weighted analysis to examine the spatiotemporal distribution characteristics of ecological vulnerability in Heilongjiang Province across three periods. Additionally, the study uses the geographical detector model to explore the driving factors and employs the CA-Markov model to predict ecological vulnerability distribution in 2030.
The results of the study indicate that the ecological vulnerability of Heilongjiang Province follows a distribution pattern of “high in the east and west, low in the north and south”. This pattern is primarily attributed to the higher altitudes in the northern and southern regions of Heilongjiang Province, where the land use is predominantly forested. Additionally, these areas host several national nature reserves (e.g., the Mudanfeng National Nature Reserve and the Fenglin National Nature Reserve), which provide a favorable natural environment with a strong ecological recovery capacity, leading to a predominance of slight and mild vulnerability. The western part of Heilongjiang Province, located in the western section of the Songnen Plain, is characterized by land use primarily dominated by arable land. This area experiences frequent human interference and a drier climate, leading to significant soil moisture loss. Consequently, there is a higher prevalence of saline and infertile soils, which reduces the region’s resistance to external disturbances, resulting in a higher degree of ecological vulnerability. Over the past two decades, the ecological vulnerability in Heilongjiang Province has generally followed a pattern of improvement followed by deterioration. The improvement observed from 2000 to 2010 may be closely related to the implementation of ecological restoration projects, such as the “Three-North Shelterbelt Program”, initiated in 1980, and the “Grain-for-Green Program” and wetland restoration initiatives, which began in 2000. During this period, Heilongjiang Province focused on promoting the development of light industry, while also undergoing economic restructuring and industrial upgrading. In addition, the implementation of the “Environmental Protection Regulations of Heilongjiang Province” contributed to improvements in environmental quality. From 2010 to 2020, ecological vulnerability in Heilongjiang Province predominantly shifted towards higher vulnerability levels, with areas of environmental degradation mainly concentrated in the Daxing’anling Area, Heihe City, and Mudanjiang City. This trend could be associated with the growth of the tourism industry [66,67]. These regions are rich in natural resources, with some natural attractions developed into tourist sites. The growth of tourism often leads to issues such as land reclamation and infrastructure development, which put pressure on the ecological environment and contribute to the exacerbation of ecological vulnerability. Meanwhile, with the acceleration of urbanization, the land use structure in Harbin has undergone significant changes [68], causing ecological vulnerability to rise and ecosystem stability to diminish. Using the GeoDetector to analyze the driving factors behind the spatial distribution of ecological vulnerability in Heilongjiang Province, the results indicate that both natural and human factors influence ecological vulnerability. However, natural factors are the primary drivers of the spatial distribution of ecological vulnerability, compared to human factors. This finding differs from previous studies, such as that by Zhang Huilin et al. [69], who identified population density and GDP as the primary drivers of ecological vulnerability in Shanxi Province. This may be related to the level of economic development; compared to more developed regions, Heilongjiang Province has a relatively lower level of economic development. As a result, population density and per capita GDP have a lesser impact on ecological vulnerability in the province. This study finds that biological abundance is the most significant factor in explaining ecological vulnerability in Heilongjiang. Biological abundance is influenced by land use types, with larger areas of forests, grasslands, and water bodies corresponding to higher levels of biological abundance. For example, the Daxing’anling region, with its high forest coverage and rich biodiversity, exhibits lower ecological vulnerability. The discovery not only provides an important basis for the ecological vulnerability assessment in Heilongjiang Province, but also a valuable reference for other regions to conduct ecological vulnerability research under similar environmental backgrounds. Compared to 2020, the CA-Markov model predicts an increase in ecological vulnerability by 2030. It is recommended that relevant authorities focus on areas with rising vulnerability, strengthen ecological protection measures tailored to local conditions, promote green development, and ensure regional ecological security.
Based on the ecological vulnerability characteristics of different regions, relevant authorities should implement scientifically sound and region-specific protection measures. For example, the Daxing’anling and Xiaoxing’an mountains, which are primarily slightly and mildly vulnerable, serve as the ecological source of Heilongjiang Province and should focus on reducing anthropogenic interference while maintaining existing protective policies. The western region of Heilongjiang Province, which is primarily characterized by severe and extreme ecological vulnerability, is densely populated and industrialized. Since PM2.5 is a key factor contributing to ecological vulnerability in the province, strengthening air pollution control should be a key focus, in line with the “Air Pollution Control Regulations of Heilongjiang Province” issued by the provincial government. Ecological vulnerability is not the result of a single factor alone; therefore, the government should also consider the interaction of various factors and implement integrated management measures to coordinate their effects. The ecological environment is closely linked to human life and socioeconomic development. Local governments should strengthen the promotion of environmental protection policies, deepen public awareness of environmental conservation, and make ecological protection a shared value, thereby achieving harmony between humans and nature.
This study has some limitations. At present, there is no standardized index system in place for evaluating ecological vulnerability. The influence of government policies, natural disasters (such as heavy rainfall, floods, droughts, etc.), and other human interventions has not been taken into account when selecting the indicators. Additionally, due to data availability constraints, the time series used in this study is relatively short, which may affect the precision of the ecological vulnerability assessment results. Therefore, future research should focus on developing a more comprehensive vulnerability assessment system that incorporates multiple factors.

5. Conclusions

(1)
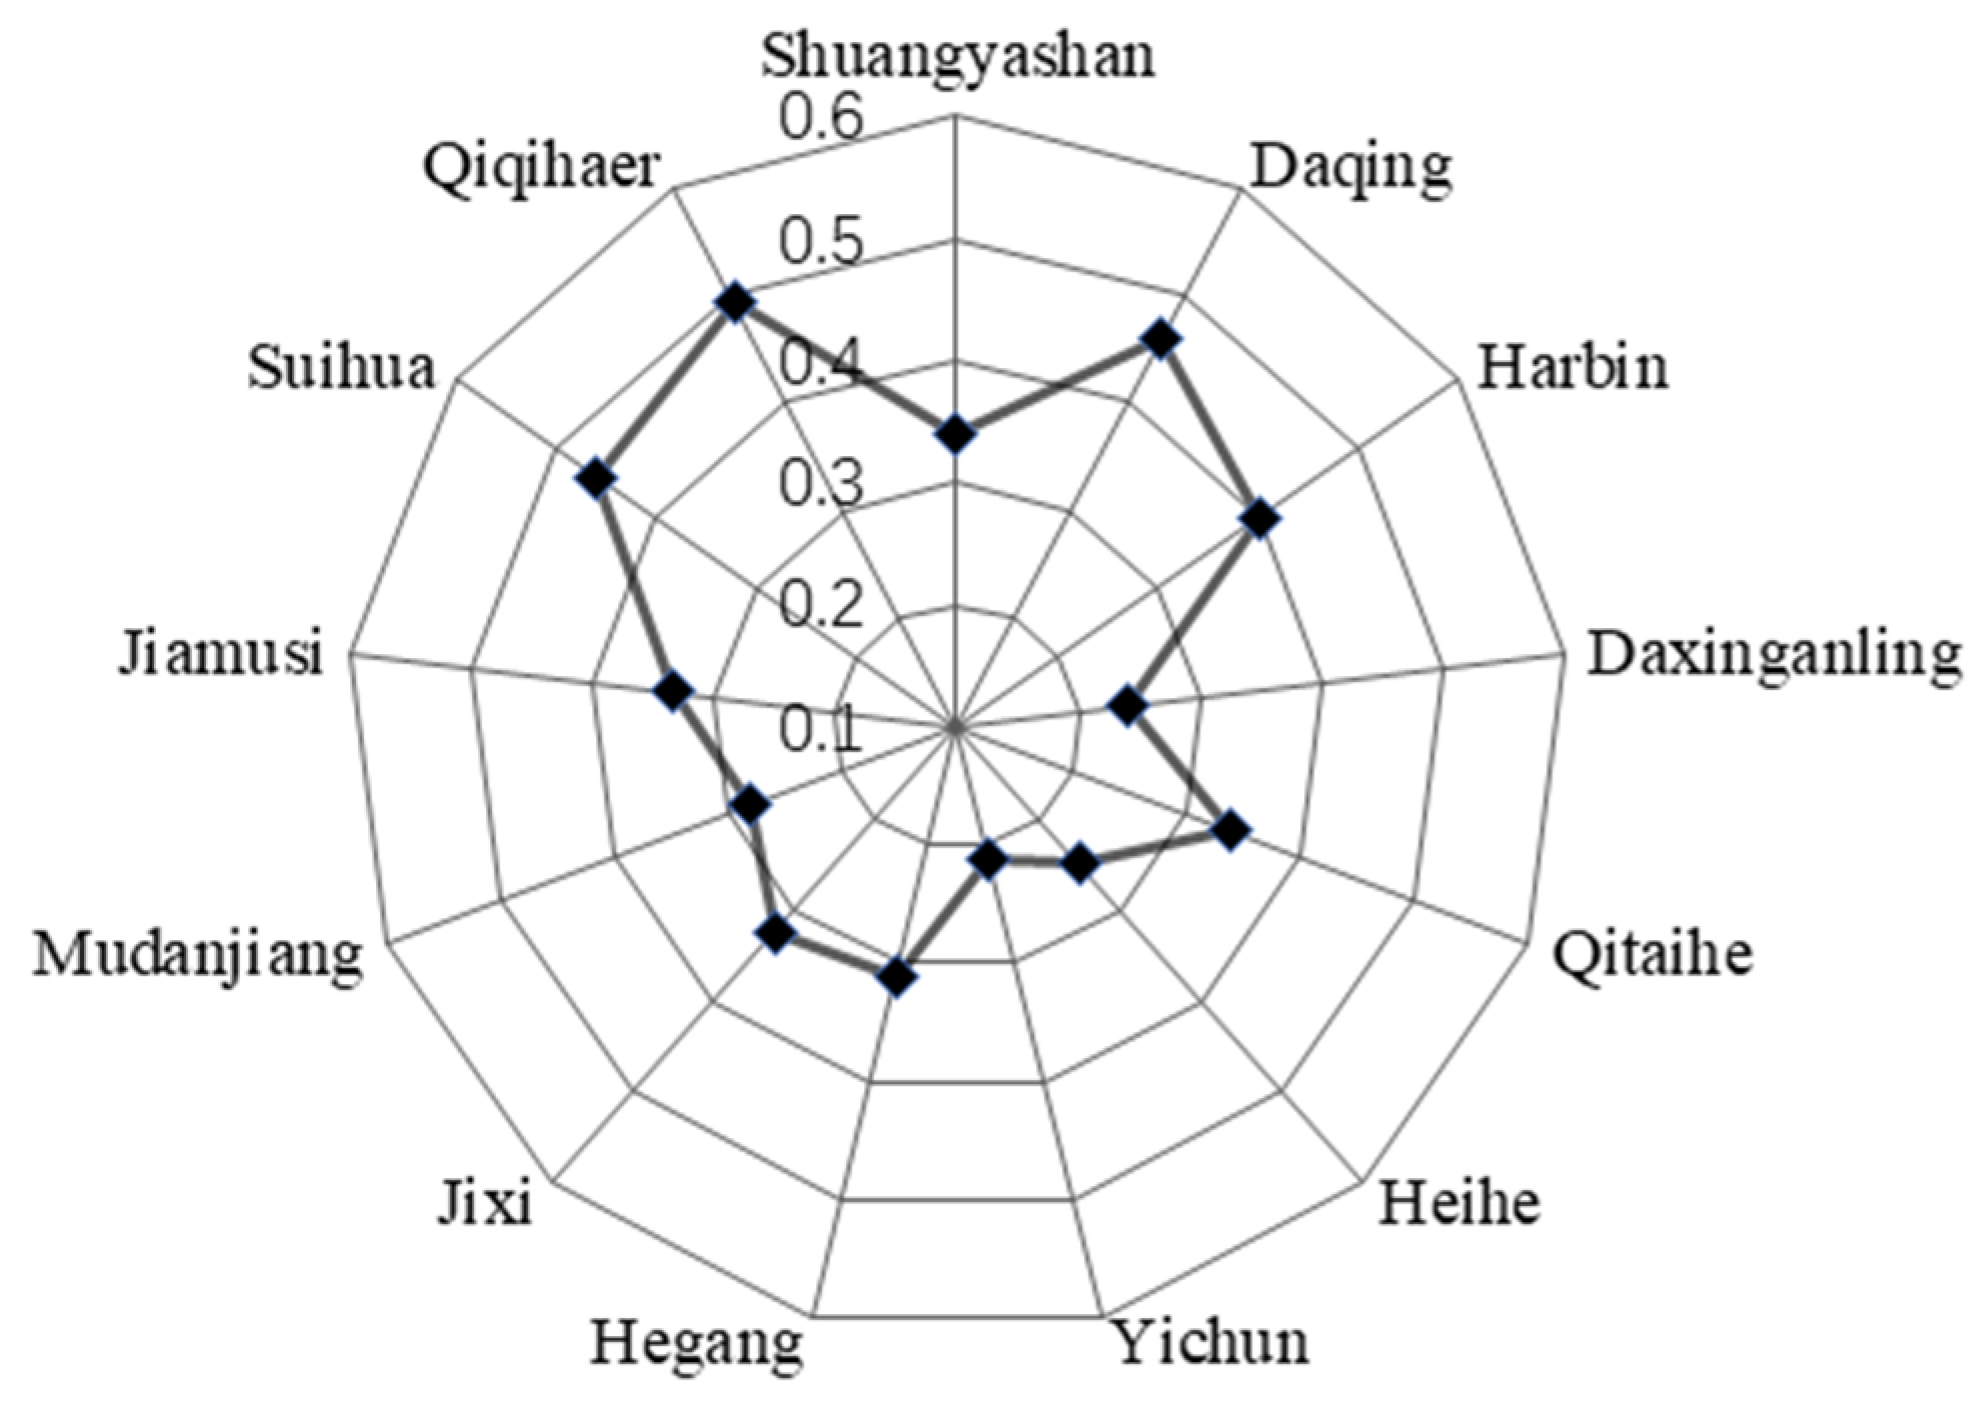
The total ecological vulnerability of Heilongjiang Province remained at a moderate level between 2000 and 2020, showing a trend of first slowing down and then growing. The distribution was “high in the east and west, low in the north and south.” At the municipal level, Daxing’anling, Heihe, Mudanjiang, and Hegang were categorized as less than moderately vulnerable, but Shuangyashan, Qitaihe, Harbin, Jixi, and Jiamusi showed moderate ecological sensitivity. Suihua, Qiqihar, and Daqing, on the other hand, displayed ecological vulnerability levels that were greater than moderate. This finding provides a scientific foundation for regional ecological management and protection by highlighting the variations in ecological vulnerability across Heilongjiang Province’s various regions.
(2)
Heilongjiang Province’s ecological vulnerability has notable spatial clustering features, mostly consisting of low-low and high-high clustering regions. While the low-low clustering areas are mostly found in locations with good natural conditions, such as moderate and lightly sensitive zones, the high-high clustering areas are predominantly found in severely and extremely vulnerable regions with strong human activity. The regional distribution of ecological vulnerability during the relevant period is consistent with these tendencies. The temporal and spatial stability of vulnerability distribution is further supported by the spatial distribution characteristics, which align with the patterns of ecological vulnerability changes over time.
(3)
Numerous factors impact Heilongjiang Province’s ecological vulnerability’s spatial distribution characteristics. The four most significant factors affecting the study area are biological abundance, net primary productivity, dryness, and PM2.5. Moreover, the highest interactions between these factors occurred in different years when they were combined. This highlights the importance of ecological complexity and the interaction of multiple factors, suggesting that future ecological protection efforts should consider the synergistic effects of various factors.
(4)
Ecological vulnerability can be predicted using the CA-Markov model. By 2030, Heilongjiang Province’s total ecological vulnerability is predicted to rise, with a greater proportion of regions having severe and extreme vulnerability and a decrease in the proportion of regions with low and moderate vulnerability. In addition to creating more focused and targeted ecological protection measures, relevant authorities should focus more on high-vulnerability areas, especially the extremely susceptible areas in the province’s west and south.

Author Contributions

Conceptualization, Y.L. and J.L.; methodology, Y.L.; software, Y.L.; validation, Y.Z. (Yue Zhu), C.W. and Y.Z. (Yuqi Zhang); formal analysis, Y.L.; investigation, Y.L. and J.L.; resources, Y.L. and J.L.; data curation, C.W.; writing—original draft preparation, Y.Z. (Yue Zhu); writing—review and editing, Y.L. and J.L.; visualization, Y.Z. (Yuqi Zhang); supervision, J.L.; project administration, Y.L. and J.L.; funding acquisition, J.L. All authors have read and agreed to the published version of the manuscript.

Funding

This research was funded by the National Natural Science Foundation of China (41977411); Science and Technology Development Program of Jilin Province (YDZJ202501ZYTS492); the Jilin Provincial Department of Education (JJKH20240563CY); and the Social Science Foundation of Jilin Province (2022B40).

Institutional Review Board Statement

Not applicable.

Informed Consent Statement

Not applicable.

Data Availability Statement

Data are contained within the article.

Conflicts of Interest

The authors declare no conflicts of interest.

References

  1. Tang, Q.; Wang, J.M.; Jing, Z.R.; Yan, Y.L.; Niu, H.B. Response of ecological vulnerability to land use change in a resource-based city, China. Resour. Policy 2021, 74, 102324. [Google Scholar] [CrossRef]
  2. Xue, L.Q.; Wang, J.; Zhang, L.C.; Wei, G.H.; Zhu, B.L. Spatiotemporal analysis of ecological vulnerability and management in the Tarim River Basin, China. Sci. Total Environ. 2018, 649, 876–888. [Google Scholar] [CrossRef] [PubMed]
  3. Wu, X.L.; Tang, S.Y. Comprehensive evaluation of ecological vulnerability based on the AHP-CV method and SOM model: A case study of Badong County, China. Ecol. Indic. 2022, 137, 108758. [Google Scholar] [CrossRef]
  4. Kumar, P.; Gupta, S.; Dagar, V. Sustainable energy development through non- residential rooftop solar photovoltaic adoption: Empirical evidence from India. Sustain. Dev. 2024, 32, 795–814. [Google Scholar] [CrossRef]
  5. Kumar, P.; Pandey, R.; Fürst, C.; Joshi, P.K. The role of information infrastructure for climate change adaptation in the socio-ecological system of the Central Himalaya: Availability, utility, and gaps. Socio Ecol. Pract. Res. 2021, 3, 397–410. [Google Scholar] [CrossRef]
  6. Wang, P.; Zhao, W.; Ke, X.L. Evaluation and Spatiaotemporal Evolution of Ecological Vulnerability of Qianjiang Based on SRP Model. Res. Soil. Water Conserv. 2021, 28, 347–354. [Google Scholar]
  7. Wang, Y.; Li, X.M.; Zhang, F.; Wang, W.W.; Xiao, R.B. Effects of rapid urbanization on ecological functional vulnerability of the land system in Wuhan, China: A flow and stock perspective. J. Clean. Prod. 2020, 248, 119284. [Google Scholar] [CrossRef]
  8. Wolters, M.L.; Sun, Z.; Huang, C.; Kuenzer, C. Environmental awareness and vulnerability in the Yellow River Delta: Results based on a comprehensive household survey. Ocean Coast. Manag. 2016, 120, 1–10. [Google Scholar] [CrossRef]
  9. Srinurak, N.; Wonglangka, W.; Sukwai, J. Smart Urban Forest Initiative: Nature-Based Solution and People-Centered Approach for Tree Management in Chiang Mai, Thailand. Sustainability 2024, 16, 11078. [Google Scholar] [CrossRef]
  10. Jackson, L.E.; Bird, S.L.; Matheny, R.W.; O’Neill, R.V.; White, D.; Boesch, K.C.; Koviach, J.L. A regional approach to projecting land-use change and resulting ecological vulnerability. Environ. Monit. Assess. 2004, 94, 231–248. [Google Scholar] [CrossRef]
  11. He, L.; Shen, J.; Zhang, Y. Ecological vulnerability assessment for ecological conservation and environmental management. J. Environ. Manag. 2018, 206, 1115–1125. [Google Scholar] [CrossRef] [PubMed]
  12. Beroya-Eitner, M.A. Ecological vulnerability indicators. Ecol. Indic. 2016, 60, 329–334. [Google Scholar] [CrossRef]
  13. Qiu, B.K.; Li, H.L.; Zhou, M.; Zhang, L. Vulnerability of ecosystem services provisioning to urbanization: A case of China. Ecol. Indic. 2015, 57, 505–513. [Google Scholar] [CrossRef]
  14. Zheng, H.L.; Wang, Y.H.; Ma, W. Evaluation of Eco-environmental Vulnerability of Pearl River Delta Based on PSR Mode. Bull. Soil. Water Conserv. 2022, 42, 210–217+381. [Google Scholar]
  15. Niemeijer, D.; Groot, R.S. Framing environmental indicators: Moving from causal chains to causal networks. Environ. Dev. Sustain. 2008, 10, 89–106. [Google Scholar] [CrossRef]
  16. Jiang, B.H.; Chen, W.; Dai, X.A.; Xu, M.; Liu, L.F.; Sakai, T.; Li, S.L. Change of the spatial and temporal pattern of ecological vulnerability: A case study on Cheng-Yu urban agglomeration, Southwest China. Ecol. Indic. 2023, 149, 110161. [Google Scholar] [CrossRef]
  17. Alwan, I.A.; Aziz, N.A. Monitoring of surface ecological change using remote sensing technique over Al-Hawizeh Marsh, Southern Iraq. Remote Sens. Appl. Soc. Environ. 2022, 27, 100784. [Google Scholar] [CrossRef]
  18. Robielos, R.A.C.; Lin, C.J.; Senoro, D.B.; Ney, F.P. Development of vulnerability assessment framework for disaster risk reduc tion at three levels of geopolitical units in the Philippines. Sustainability 2020, 12, 8815. [Google Scholar] [CrossRef]
  19. Li, J.W.; Yuan, Y.T.; Zhang, Y.; Liu, M. Study on the Spatial Pattern and Zoning of Ecological Vulnerability in Island and Territorial Waters Based on VSD Model—A Case Study of Juehua Island. Sustainability 2024, 16, 10452. [Google Scholar] [CrossRef]
  20. Dinda, S.; Chatterjee, N.D.; Ghosh, S. Modelling the future vulnerability of urban green space for priority-based management and green prosperity strategy planning in Kolkata, India: A PSR-based analysis using AHP-FCE and ANN-Markov model. Geocarto Int. 2022, 37, 6551–6578. [Google Scholar] [CrossRef]
  21. Liu, X.W.; Zhou, H.C.; Li, P. A conceptual analysis of ecosystem stability. Acta Ecol. Sin. 2004, 24, 2635–2640. [Google Scholar]
  22. Song, G.; Li, Z.; Yang, Y.; Semakula, H.M.; Zhang, S. Assessment of ecological vulnerability and decision-making application for prioritizing roadside ecological restoration: A method combining geographic information system, Delphi survey and Monte Carlo simulation. Ecol. Ind. 2015, 52, 57–65. [Google Scholar] [CrossRef]
  23. Park, Y.S.; Chon, T.S.; Kwak, I.S.; Lek, S. Hierarchical community classification and assessment of aquatic ecosystems using artificial neural networks. Sci. Total Environ. 2004, 327, 105–122. [Google Scholar] [CrossRef]
  24. Nguyen, A.K.; Liou, Y.A.; Li, M.H.; Tran, T.A. Zoning eco-environmental vulnerability for environmental management and protection. Ecol. Indic. 2016, 69, 100–117. [Google Scholar] [CrossRef]
  25. Teng, Y.; Zhan, J.; Liu, S.; Agyemanga, F.B.; Li, Z.; Wang, C.; Liu, W. Integrating ecological and social vulnerability assessment in Qinghai Province, China. Phys. Chem. Earth 2022, 126, 103115. [Google Scholar] [CrossRef]
  26. Sun, Z.; Liu, Y.; Sang, H. Spatial-Temporal Variation and Driving Factors of Ecological Vulnerability in Nansi Lake Basin, China. Int. J. Environ. Res. Public Health 2023, 20, 2653. [Google Scholar] [CrossRef]
  27. Kamran, M.; Yamamoto, K. Analysis and visualization of spatio-temporal variations of ecological vulnerability in Pakistan using satellite observation datasets. Environ. Sustain. Indic. 2024, 23, 100425. [Google Scholar] [CrossRef]
  28. Furlan, A.; Bonotto, D.M.; Gumiere, S.J. Development of environmental and natural vulnerability maps for Brazilian coastal at Sao Sebastiao in Sao Paulo State. Environ. Earth Sci. 2011, 64, 659–669. [Google Scholar] [CrossRef]
  29. Luo, N.; He, M.; Gao, H. Comprehensive evaluation method for a distribution network based on improved AHP-CRITIC combination weighting and an extension evaluation model. Power Syst. Prot. Control 2021, 49, 86–96. [Google Scholar]
  30. Ru, S.F.; Ma, R.H. Evaluation, spatial analysis and prediction of ecological environment vulnerability of Yellow River Basin. J. Nat. Resour. 2022, 37, 1722–1734. [Google Scholar] [CrossRef]
  31. Wu, H.W.; Guo, B.; Fan, J.F.; Yang, F.; Han, B.M.; Wei, C.X.; Lu, Y.F.; Zang, W.Q.; Zhen, X.Y.; Meng, C. A novel remote sensing ecological vulnerability index on large scale: A case. Ecol. Indic. 2021, 129, 107955. [Google Scholar] [CrossRef]
  32. Weng, C.Y.; Bai, Y.P.; Chen, B.H.; Hu, Y.C.; Shu, J.Y.; Chen, Q.; Wang, P. Assessing the vulnerability to climate change of a semi-arid pastoral social–ecological system: A case study in Hulunbuir, China. Ecol. Inf. 2023, 76, 102139. [Google Scholar] [CrossRef]
  33. Raj, A.; Sharma, L.K. Spatial E-PSR modelling for ecological sensitivity assessment for arid rangeland resilience and management. Ecol. Model. 2023, 478, 110283. [Google Scholar] [CrossRef]
  34. Afrin, R.; Sultana, R.; Alam, M.S. A Comprehensive analysis of drought vulnerability in the Barind region of Bangladesh: A socio-ecological systems approach. Ecol. Indic. 2024, 160, 111863. [Google Scholar] [CrossRef]
  35. Buxton, M.; Haynes, R.; Mercer, D.; Butt, A. Vulnerability to Bushfire Risk at Melbourne’s Urban Fringe: The Failure of Regulatory Land Use Planning. Geogr. Res. 2011, 49, 1–12. [Google Scholar] [CrossRef]
  36. Gupta, A.K.; Nandy, S.; Nath, A.J.; Mehta, D.; Pandey, R. Spatially Explicit climate change vulnerability assessment of ecological systems along altitudinal gradients in the Indian Himalayan region. Environ. Sustain. Indic. 2024, 22, 10037. [Google Scholar] [CrossRef]
  37. Nandy, S.; Singh, C.; Das, K.K.; Kingma, N.C.; Kushwaha, S.P.S. Environmental vulnerability assessment of eco-development zone of Great Himalayan National Park, Himachal Pradesh, India. Ecol. Indic. 2015, 57, 182–195. [Google Scholar] [CrossRef]
  38. Xu, X.N.; Yang, Q.W.; Xiang, G.P.; Liu, T.; Yang, M.J.; Xiong, X.; Jiang, T. Comprehensive evaluation of the Ruoergai Prairie ecosystem upstream of the Yellow River. Ecol. Evol. 2022, 10, 1047896. [Google Scholar] [CrossRef]
  39. Li, J. An Assessment of Ecological Protection Importance Based on Ecosystems Services and Vulnerabilities in Tibet, China. Sustainability 2022, 14, 12902. [Google Scholar] [CrossRef]
  40. Hua, T.; Zhao, W.W.; Cherubini, F.; Hu, X.P.; Pereira, P. Sensitivity and future exposure of ecosystem services to climate change on the Tibetan Plateau of China. Landsc. Ecol. 2021, 36, 3451–3471. [Google Scholar] [CrossRef]
  41. Guo, B.; Zang, W.Q.; Luo, W. Spatial-temporal shifts of ecological vulnerability of Karst Mountain ecosystem-impacts of global change and anthropogenic interference. Sci. Total Environ. 2020, 742, 140256. [Google Scholar] [CrossRef] [PubMed]
  42. Chen, Y.; Xiong, K.; Ren, X.; Cheng, C. Vulnerability Comparison between Karst and Non-Karst Nature Reserves—With a Special Reference to Guizhou Province, China. Sustainability 2021, 13, 2442. [Google Scholar] [CrossRef]
  43. Ghosh, S.; Das, A. Urban expansion induced vulnerability assessment of East Kolkata Wetland using Fuzzy MCDM method. Remote Sens. Appl. Soc. Environ. 2019, 13, 191–203. [Google Scholar] [CrossRef]
  44. Bourgoin, C.; Oszwald, J.; Bourgoin, J.; Gond, V.; Blanc, L.; Dessard, H.; Phan, T.V.; Sist, P.; Läderach, P.; Reymondin, L. Assessing the ecological vulnerability of forest landscape to agricultural frontier expansion in the Central Highlands of Vietnam. Int. J. Appl. Earth Obs. Geoinf. 2020, 84, 101958. [Google Scholar] [CrossRef]
  45. Fornaciari, M.; Muscas, D.; Rossi, F.; Filipponi, M.; Castellani, B.; Giuseppe, A.D.; Proietti, C.; Ruga, L.; Orlandi, F. CO2 Emission Compensation by Tree Species in Some Urban Green Areas. Sustainability 2024, 16, 3515. [Google Scholar] [CrossRef]
  46. Quan, W.T.; Zhang, S.Y.; Liu, Y. Monitoring and Evaluation of Ecological Environment Changes in Dongzhuang Reservoir Basin in Shaanxi Province Based on Remote Sensing Ecological Index. Bull. Soil. Water Conserv. 2022, 42, 96–104+113. [Google Scholar]
  47. Chen, X.H.; Gu, Y.; Pan, W. The coordinated development characteristics and dynamic response mechanism of defense-absorption-renewal of rural resilience system in Heilongjiang Province, China. Acta Ecol. Sin. 2024, 44, 6976–6988. [Google Scholar]
  48. Ma, L.X.; Kang, H.; He, D.; Liu, J.W.; Tang, H.J.; Wu, S.Q.; Li, X.X. The evolution process of ecological vulnerability and its quantitative analysis of influencing factors: A case study of Longdong area. Environ. Sci. Pollut. Res. Int. 2023, 30, 51464–51490. [Google Scholar] [CrossRef]
  49. Cai, X.; Li, Z.; Liang, Y. Temporal changes of ecological vulnerability in the arid area based on ordered weighted average model. Ecol. Indic. 2021, 133, 108398. [Google Scholar] [CrossRef]
  50. Liu, Y.M.; Yang, S.N.; Han, C.L.; Ni, W.; Zhu, Y.Y. Variability in regional ecological vulnerability: A case study of Sichuan Province, China. Int. J. Disaster Risk Sci. 2020, 11, 696–708. [Google Scholar] [CrossRef]
  51. Qiao, Q.; Gao, J.X.; Wang, W.; Tian, M.R.; Lv, S.H. Method and application of ecological frangibility assessment. Res. Environ. Sci. 2008, 21, 117–123. [Google Scholar]
  52. Hou, K.; Li, X.; Wang, J.; Zhang, J. Evaluating Ecological Vulnerability Using the GIS and Analytic Hierarchy Process (AHP) Method in Yan’an, China. Pol. J. Environ. Stud. 2016, 25, 599–605. [Google Scholar]
  53. Diakoulaki, D.; Mavrotas, G.; Papayannakis, L. Determining objective weights in multiple criteria problems: The critic method. Comput. Oper. Res. 1995, 22, 763–770. [Google Scholar] [CrossRef]
  54. Zou, T.H.; Chang, Y.X.; Chen, P. Evaluation of eco-environmental vulnerability in Jilin Province based on an AHP-PCA entropy weight model. Chin. J. Eco-Agric. 2023, 31, 1511–1524. [Google Scholar]
  55. Tang, L.; Hu, X.J.; Luo, Z.W.; Wei, B.J.; Wang, Y.Z.; Zhang, Y.L.; Shao, R.Y.; Chen, C.Y. Spatiotemporal coupling of ecological vulnerability and urbanization level and their interactive influencing factors: A case study of Hunan province. Acta Ecol. Sin. 2024, 44, 4662–4677. [Google Scholar]
  56. Tang, Q.; Wang, J.; Jing, Z. Tempo-spatial changes of ecological vulnerability in resource-based urban based on genetic projection pursuit model. Ecol. Ind. 2021, 121, 107059. [Google Scholar] [CrossRef]
  57. Darand, M.; Dostkamyan, M.; Rehmani, M.I.A. Spatial Autocorrelation Analysis of Extreme Precipitation in Iran. Russ. Meteorol. Hydrol. 2017, 42, 415–424. [Google Scholar] [CrossRef]
  58. Zhang, C.; Lv, W.Y.; Zhang, P.; Song, J.C. Multidimensional spatial autocorrelation analysis and it’s application based on improved Moran’s I. Earth Sci. Inform. 2023, 16, 3355–3368. [Google Scholar] [CrossRef]
  59. Batlle, J.R.M.; Van Der Hoek, Y. Clusters of High Abundance of Plants Detected from Local Indicators of Spatial Association (LISA) in a semi-deciduous tropical forest. PLoS ONE 2018, 13, e0208780. [Google Scholar]
  60. Ding, Q.; Shi, X.; Zhuang, D.; Wang, Y. Temporal and Spatial Distributions of Ecological Vulnerability under the Influence of Natural and Anthropogenic Factors in an Eco-Province under Construction in China. Sustainability 2018, 10, 3087. [Google Scholar] [CrossRef]
  61. Jing, H.C.; Liu, Y.H.; He, P. Spatial Heterogeneity of Ecosystem Services and Its Influencing Factors in Typical Areas of the Qinghai-Tibet Plateau: A Case Study of Nagqu City. Acta Ecol. Sin. 2022, 42, 2657–2673. [Google Scholar]
  62. Wang, J.F.; Xu, C.D. Geodetector: Principle and prospective. Acta Geogr. Sin. 2017, 72, 116–134. [Google Scholar]
  63. Wang, Y.Q.; Yao, S.B.; Hou, M.Y. Spatial-temporal differentiation and its influencing factors of agricultural eco-efficiency in China based on geographic detector. Chin. J. Appl. Ecol. 2021, 32, 4039–4049. [Google Scholar]
  64. Gu, H.; Huan, C.; Yang, F. Spatiotemporal Dynamics of Ecological Vulnerability and Its Influencing Factors in Shenyang City of China: Based on SRP Model. Int. J. Environ. Res. Public. Health 2023, 20, 1525. [Google Scholar] [CrossRef]
  65. Liu, F.; Qin, T.L.; Girma, A.; Wang, H.; Weng, B.S.; Yu, Z.L.; Wang, Z.L. Dynamics of Land-Use and vegetation Change Using NDVI and Transfer Matrix: A Case Study of the Huaihe River Basin. Pol. J. Environ. Stud. 2018, 28, 213–223. [Google Scholar] [CrossRef]
  66. Wang, H.R. Study on the Development of Forest Ecotourism in Greater Khingan Mountains of Heilongjiang Province. Northen Hortic. 2019, 21, 165–170. [Google Scholar]
  67. Xue, Y.H. Study on the Measurement and Influencing Factors of Green Development Level of Tourism Industry in Heilongjiang Province. Master’s Thesis, Harbin University of Commerce, Harbin, China, 2022. [Google Scholar]
  68. Zhang, T.; Hu, Y.Z.; Hu, H.H.; Lei, T.T. Prediction of Land Use and Habitat Quality in Harbin City Based on the PLUS- InVEST Model. Environ. Sci. 2024, 45, 4709–4721. [Google Scholar]
  69. Zhan, H.L.; Wang, W.G.; Wang, J.; Zhao, X.J.; Bo, Y.L.; Hou, Y.J. Analysis on evolution of ecological vulnerability of Shanxi Province based on the remote sensing and GIS technique. Remote Sens. Technol. Appl. 2024, 39, 478–491. [Google Scholar]
Figure 1. An outline of the research area.
Sustainability 17 02239 g001
Figure 2. The study’s framework diagram.
Sustainability 17 02239 g002
Figure 3. Ecological vulnerability level transfer map from 2000 to 2020.
Sustainability 17 02239 g003
Figure 4. Heilongjiang Province’s ecological vulnerability’s spatial distribution.
Sustainability 17 02239 g004
Figure 5. Ecological vulnerability index over multiple years for municipalities in Heilongjiang Province.
Sustainability 17 02239 g005
Figure 6. Local spatial autocorrelation LISA clustering map of ecological vulnerability in Heilongjiang Province.
Sustainability 17 02239 g006
Figure 7. Results of the interaction factor of ecological vulnerability in Heilongjiang Province.
Sustainability 17 02239 g007
Figure 8. Forecast of ecological vulnerability in Heilongjiang Province in 2030.
Sustainability 17 02239 g008
Table 1. Data sources and uses.
DatatypesSourceResolution/mUse
Topographic dataResource and Environmental Science Data Platform
(https://www.resdc.cn/) (accessed on 15 February 2024)
90 mObtain elevation, slope
Meteorological dataNational Earth System Science Data Center (http://www.geodata.cn/) (accessed on 15 February 2024)1 kmObtain annual average temperature, annual precipitation, dry degree
Land use dataResource and Environmental Science Data Platform
(https://www.resdc.cn/) (accessed on 15 February 2024)
30 mObtain degree of land use, biological abundance, landscape diversity indices
Remote sensing dataNASA (https://www.nasa.gov/) (accessed on 15 February 2024)1 kmObtain NDVI, net primary productivity
Socioeconomic dataWorldPop (https://www.worldpop.org/) (accessed on 15 February 2024)-Obtain population density
Heilongjiang Statistical Yearbook-Obtain GDP per capita
Other dataCHAP (https://data.tpdc.ac.cn/) (accessed on 15 February 2024)1 kmObtain PM2.5
Table 2. Indices for evaluating ecological vulnerability.
StandardElementFactorNature of the Indicator
SensitivityTopographic factorElevation (X1)
Slope (X2)
+
+
Meteorological factorAnnual average temperature (X3)
Annual precipitation (X4)
PM2.5 (X5)
Dry degree (X6)
+

+
+
ResilienceEco-vitality factorsLandscape diversity (X7)
NDVI (X8)
Biological abundance (X9)
Net primary productivity (X10)


PressureAnthropogenic stress factorsPopulation density (X11)
GDP per capita (X12)
+
+
Table 3. The meaning behind various LISA clustering models.
Clustering TypesConnotation
High-high clustering (H-H)Characteristics of spatial clustering where both the region and the surrounding regions have a fair amount of ecological risk.
High-low clustering (H-L)Features of spatial clustering when the surrounding area’s ecological vulnerability is low, and the region’s is high.
Low-high clustering (L-H)Features of spatial clustering where the ecological sensitivity of the surrounding area is great but that of the region is minimal.
Low-low clustering (L-L)Characteristics of spatial clustering where both the region and the surrounding area have comparatively low ecological vulnerability.
Not significantNo significant spatial clustering characteristics.
Table 4. The type of interaction.
Source for JudgingInteraction Type
q(X1∩X2) < Min[q(X1),q(X2)]Weakened, non-linear
Min[q(X1),q(X2)] < q(X1∩X2) < Max[q(X1),q(X2)]Weakened, single factor non-linear
q(X1∩X2) > Max[q(X1),q(X2)]Enhanced, double factors
q(X1∩X2) = q(X1) + q(X2)Independent
q(X1∩X2) > q(X1) + q(X2)Enhanced, non-linear
Table 5. Change in area of vulnerability.
Level of Vulnerability200020102020
Area/km2Percentage/%Area/km2Percentage/%Area/km2Percentage/%
Slight vulnerability118,46327.04142,88432.6192,43921.1
Light vulnerability130,24829.7389,83520.5120,29327.46
Medium vulnerability75,46917.2276,71417.5188,88720.29
Heavy vulnerability66,38615.1595,00821.6866,72815.23
Extreme vulnerability47,60910.8733,7367.769,74915.92
Table 6. Findings from the identification of the main causes of ecological vulnerability.
Driving Factorq-ValueMean q-ValueRanking of Mean q-Values
200020102020
Elevation0.2910.420.2850.3326
Slope0.2450.30.2380.2618
Annual average temperature0.2750.4330.3310.3465
Annual precipitation0.2450.1480.1430.17810
PM2.50.460.5980.5160.5254
Dry degree0.5580.5970.4860.5473
Landscape diversity0.0640.0730.070.06913
NDVI0.3880.2060.1460.2479
Biological abundance0.5860.6250.5610.5911
Net primary productivity0.5150.6520.580.5832
Population density0.0490.120.0470.07212
GDP per capita0.0490.0850.1170.08411
Degree of land use0.3290.3260.2810.3127
Disclaimer/Publisher’s Note: The statements, opinions and data contained in all publications are solely those of the individual author(s) and contributor(s) and not of MDPI and/or the editor(s). MDPI and/or the editor(s) disclaim responsibility for any injury to people or property resulting from any ideas, methods, instructions or products referred to in the content.

