1. Introduction
In the actual global environment, sustainability and resilience have become key factors in shaping corporate strategies. Sustainability, which refers to the ability to preserve or enhance systems over time without exhausting resources or damaging natural processes, is gaining importance in business operations. Resilience, meanwhile, focuses on an organization’s capacity to adapt to disruptions and continue functioning in the face of challenges, whether they be environmental, economic, or social.
The confluence of these two concepts helps us highlight their importance in the context of corporate sustainability entrepreneurship, where companies not only strive to achieve economic success but also aim to contribute positively to environmental and societal well-being. In accordance with this dual pursuit, the economic state of a corporation and its commitment to “green politics”—policies and practices aimed at reducing environmental impact—are deeply intertwined. Nowadays, corporations face numerous challenges in modern economies, with sustainability [
1,
2,
3,
4] being a central concern. The growing recognition of the need to enhance sustainable economic performance within organizations has led to the continuous rise of corporate sustainability entrepreneurship. This emerging form of corporate entrepreneurial behavior [
5,
6,
7,
8] focuses on identifying, developing, and capitalizing on sustainable economic opportunities [
9,
10] related to corporate social responsibility (CSR) and broader sustainability issues [
11]. In general, sustainable entrepreneurs replace traditional business practices, systems, and processes with superior products and services that prioritize social and environmental benefits [
12].
Corporate entrepreneurship is a form of entrepreneurship that occurs within established organizations through the initiation of new ventures [
8]. This concept and its behavioral manifestation—corporate entrepreneurial innovativeness—can take the form of sustained radical innovation [
13], strategic renewal, or business venturing. The context in which corporate entrepreneurship operates reflects a corporation’s character, shaped by generic environmental factors influencing industry players [
14].
While much research focuses on the costs associated with the transition to green entrepreneurship, many researchers explore how financial success can drive sustainability and innovation. Companies with strong financial results are often better positioned to invest in sustainability initiatives. These investments can include adopting green technologies, improving energy efficiency, and developing sustainable products. Financially healthy companies can afford to pursue these initiatives without the immediate pressure of short-term profitability, allowing them to focus on long-term gains that come from enhanced sustainability.
Nurul et al. [
15] conclude that we have to consider various dimensions of sustainability, including environmental, social, and governance (ESG) factors and how they correlate with financial metrics such as profitability, return on assets, and stock market performance. These factors can drive parallel and coherent corporate decisions and behaviors [
16,
17,
18] that collectively define the corporation’s sustainability trajectory.
Taking into account the results of previous studies in the specialized literature, the main objective of this paper is to analyze the factors that can influence the green policy for Romania corporations. This study provides valuable insights to the existing literature by offering empirical validation of previous claims regarding the complex relationships between financial performance, proactive orientation, innovation, and ecological performance across various sectors by focusing on the Romanian context to explain how these factors influence sustainability efforts.
While substantial progress has been made in understanding the determinants of corporate sustainability entrepreneurship and its implications, there are still key research gaps, particularly in financial sustainability, sector-specific challenges and the role of policy. This research paper addresses these gaps through interdisciplinary and cross-regional studies that will improve our ability to effectively integrate sustainability into corporate strategy, ensuring economic and environmental resilience in a rapidly changing global landscape.
The research paper is structured as follows:
Section 2 presents a theoretical approach to corporate sustainability entrepreneurship.
Section 3 focuses on the study context and research hypothesis.
Section 4 presents the materials and methods used in this research,
Section 5 and
Section 6 reveal and discuss the results, and
Section 7 presents the conclusions based on the analysis conducted, its limitations, and future research.
The analysis reveals moderate to strong positive correlations between financial performance, proactive orientation, innovation, and ecological performance, seeking to contribute to a deeper understanding of the dynamic relationship between business success and environmental responsibility.
2. The Corporate Sustainability Entrepreneurship—A Theoretical Approach
Corporate sustainability entrepreneurship has emerged as a pivotal concept in business research, exploring the intersection of sustainability, innovation, and economic performance. While the concept has gained significant traction, the existing body of literature reveals diverse perspectives, theoretical frameworks, and empirical findings that shape our understanding of the field. This analysis synthesizes key contributions and identifies research gaps that warrant further exploration.
Key factors driving the rise of corporate sustainability entrepreneurship include the organization’s corporate status, its role as an innovator or pioneer [
14], and its focus on the complex and often challenging nature of sustainability.
The research we review explore the key theoretical frameworks and empirical studies that have shaped our understanding of corporate sustainability, resilience, and their interplay with economic factors and green policies. As Elkington [
19] outlined in the Triple Bottom Line framework, the concept of corporate sustainability emphasizes the need for businesses to balance economic, environmental, and social objectives.
The literature indicates that corporate sustainability is often linked with concepts such as Green Human Resource Management (GHRM), sustainable entrepreneurship, and green innovation. Studies have examined how GHRM practices contribute to environmental performance, including recruitment, training, and employee engagement in sustainability initiatives. Similarly, green innovation, particularly in product design and lifecycle management, has been analyzed in regard to its financial implications, with conflicting findings on whether it enhances profitability.
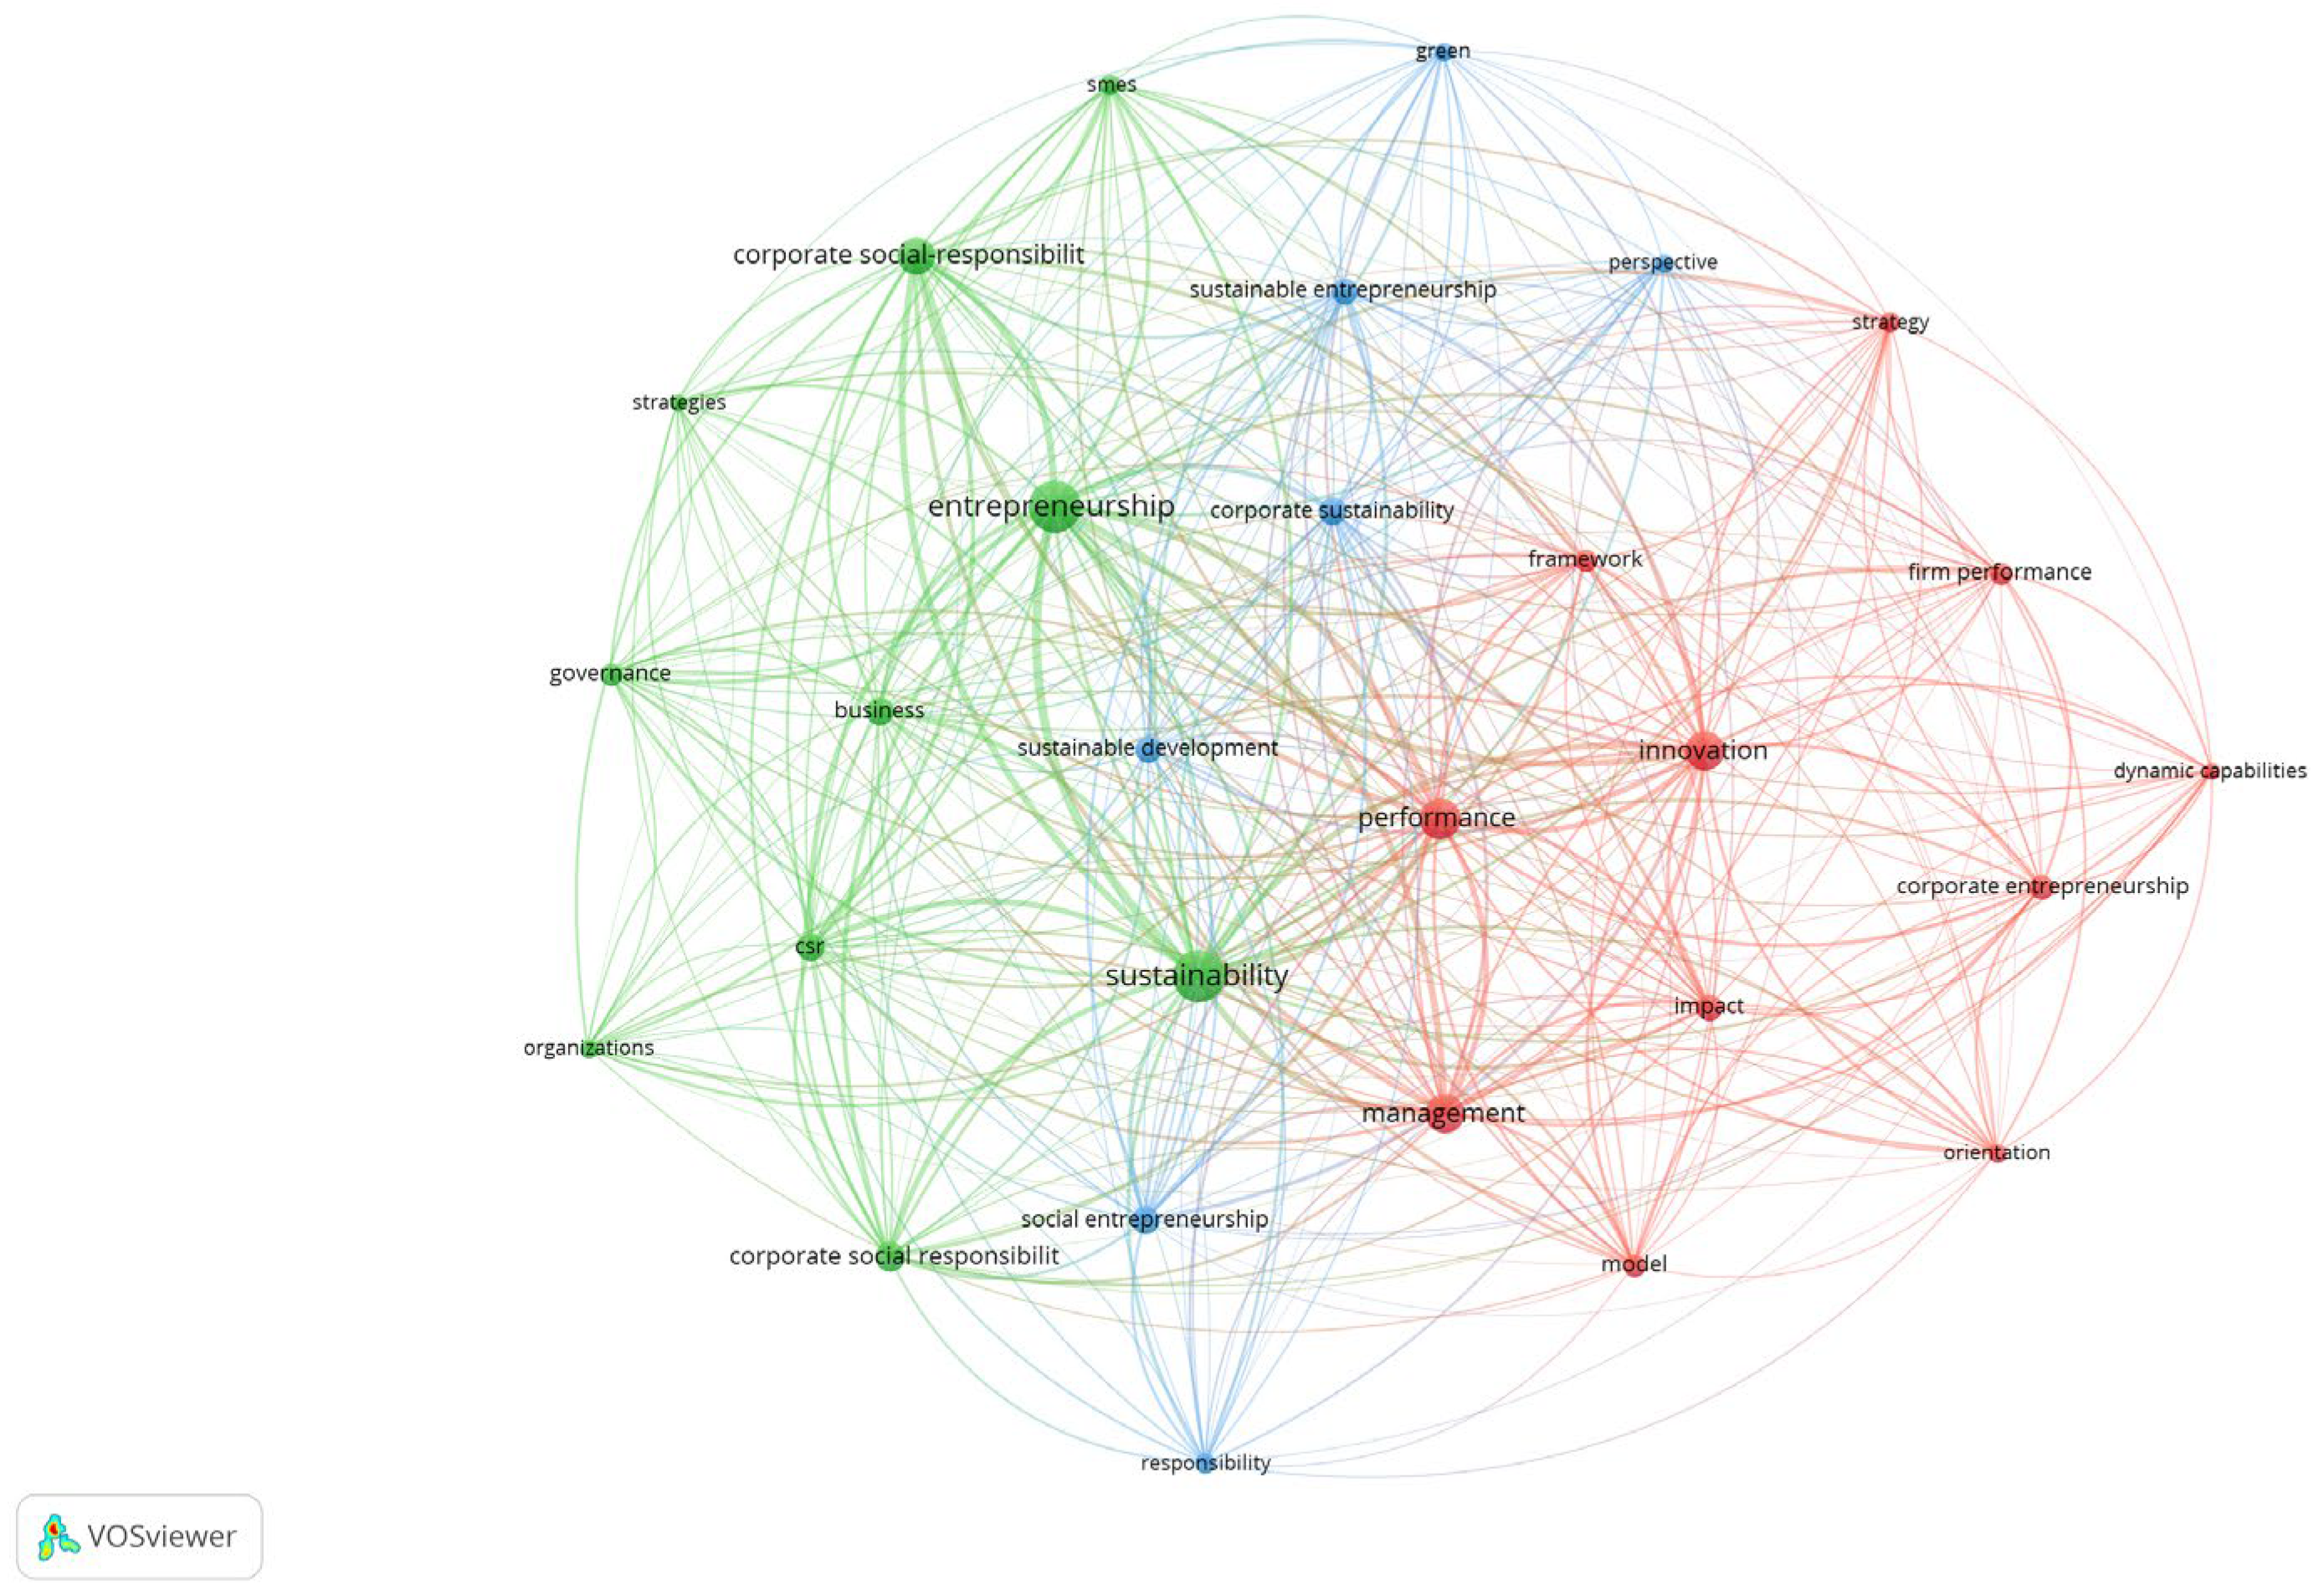
Figure 1 is a visual depiction of the network of keywords frequently found in research papers indexed in the Web of Science database on “
corporate sustainability entrepreneurship”. Only studies in English on “
corporate sustainability entrepreneurship” were selected, the analysis period being 1999–2024, resulting in 657 studies indexed in Web of Science. The USA represents the most active country in this field with 95 articles, England and Germany following the USA with 82 and 77 research papers, respectively. The other countries which have more contributions in terms of the number of published articles are China (68 papers), Spain (49 papers), Italy (46 papers), Canada (33 papers), and Australia (33 papers).
A node represents each keyword in this network, and the node size reflects how frequently that keyword appears across several research studies.
Figure 1 shows the relevance of each keyword through the nodes, and sizes of nodes indicate the importance level. The larger node means that the keyword is more relevant within the sample. The figure also explains the correlations between two or more keywords, which are represented by curves; they explain the frequency level of occurrence among keywords. The thicker line means that the simultaneous emergence of two connected keywords is more frequent. The shortness of the line also means the stronger relationship between the two connected keywords. The main findings deduced from the visualization map of the correlation network between the keywords indicate that 28 items were recorded and grouped into three clusters, which generated 362 connections, with a total number of powerful links of 4301.
The bibliometric analysis based on the research papers selected by topic “corporate sustainability entrepreneurship” reveals three primary research clusters. The red cluster contains the most related keywords in the area of corporate sustainability entrepreneurship (11 related words). The largest nodes in this group correspond to the concepts of performance, management, and innovation, highlighting the strong connection with “corporate sustainability entrepreneurship”; these are central themes in corporate sustainability, emphasizing the strategic integration of sustainability into business operations. The green cluster is the second largest group by number of related terms (10 related words), and corporate social responsibility, entrepreneurship, and sustainability are the most prominent nodes; this cluster highlights the role of corporate responsibility in fostering sustainable business models. The blue cluster shows mainly corporate sustainability, sustainable entrepreneurship, sustainable development, responsibility, green, and social entrepreneurship; these areas focus on regulatory influences and the broader implications of sustainability in corporate decision-making
So, numerous studies have examined the relationship between corporate sustainability and economic performance with varying results. For instance, Orlitzky, Schmidt, and Rynes [
20] conducted a meta-analysis demonstrating a positive correlation between corporate social responsibility (CSR) and financial performance. This suggests that companies investing in sustainable practices often experience improved profitability.
The connection between Green Human Resource Management practices and the environmental performance of organizations is crucial for improving a company’s environmental performance [
21]. The authors argue that Green Human Resource Management, which includes recruitment, training, and employee involvement in sustainability initiatives, are a company’s essential assets.
The general approach to Green Product Innovations involves modifications regarding the impact of the entire product life cycle on the environment, reducing the pressure this process has on the environment [
22]. On the one hand, specialized literature shows us that green innovation is closely related to the company’s profitability [
23,
24]; on the other hand, other opinions show exactly the opposite: there is no such connection between them. Implementing sustainability initiatives presents significant financial challenges for organizations, primarily due to the upfront costs associated with adopting new technologies, changing processes, and meeting regulatory requirements. These costs can strain financial resources, particularly in the short term, as companies invest in infrastructure, training, and compliance measures.
Even if the transition to green entrepreneurship involves costs with financial implications, strong financial performance can significantly boost a company’s ability to be more sustainable and innovative [
25]. Companies with robust financial health are better equipped to make the necessary investments in sustainability and innovation [
26], ultimately leading to long-term benefits for the company and the environment. A company’s financial performance can significantly influence its capacity to become more sustainable and innovative [
27,
28].
Transition to green entrepreneurship involves costs with financial implications, and strong financial performance can significantly boost a company’s ability to be more sustainable and innovative [
25]. Companies with robust financial health are better equipped to make the necessary investments in sustainability and innovation, ultimately leading to long-term benefits for both the company and the environment [
26].
Porter and van der Linde [
29] introduced the “Porter Hypothesis”, which posits that well-designed environmental regulations can stimulate innovation and in turn improve economic performance. But implementing sustainability initiatives often presents significant financial challenges for organizations, primarily due to the upfront costs associated with adopting new technologies, changing processes, and meeting regulatory requirements. These costs can strain financial resources, particularly in the short term, as companies invest in infrastructure, training, and compliance measures.
In this context, we consider that financial health is a critical enabler of a company’s ability to integrate sustainability into its operations, ensuring that it can innovate and compete effectively in a market increasingly driven by environmental concerns, but the relationship is not always straightforward.
According to research papers written by Romanian authors about corporate sustainability entrepreneurship in Romania [
30,
31,
32,
33,
34,
35,
36], we find out that the phenomenon is characterized as an emerging and dynamic field that integrates sustainable practices into entrepreneurial activities within corporate settings. The works explore how Romanian companies are increasingly adopting sustainability principles to drive innovation, improve competitive advantage, and address environmental and social challenges. The research emphasizes the importance of aligning corporate strategies with sustainable development goals to ensure long-term success and resilience in the market. Through these studies, synthetized in
Table 1, a comprehensive understanding of how sustainability is being integrated into corporate entrepreneurship in Romania is developed, highlighting the challenges and opportunities faced by organizations in this context.
This study focuses on Romania, a country with a specific socio-economic landscape to analyze how corporations’ economic health influences and is influenced by their sustainability efforts and environmental policies. By examining the dependencies between corporate economic performance and the adoption of green practices, this research seeks to contribute to a deeper understanding of the dynamic relationship between business success and environmental responsibility. The findings of this study aim to provide insights that can inform both corporate strategy and policy-making, highlighting the importance of integrating sustainability and resilience into the core of business operations in Romania and beyond.
Despite extensive research on corporate sustainability entrepreneurship, several gaps remain:
- -
Financial Constraints and Long-term Viability: While some studies confirm a positive correlation between CSR and financial performance, others suggest negligible or negative impacts. Further investigation is needed into the conditions under which sustainability initiatives contribute to long-term profitability.
- -
Sector-specific Analyses: The impact of sustainability practices varies across industries, yet limited research has explored how sector-specific factors influence corporate sustainability strategies.
- -
Small and Medium Enterprises (SMEs): While large corporations have been extensively studied, SMEs face unique challenges in adopting sustainable practices. Research should address barriers, incentives, and best practices tailored to smaller enterprises.
- -
Regulatory and Policy Impact: The extent to which governmental policies facilitate or hinder corporate sustainability remains underexplored. Comparative studies across different regulatory environments could provide valuable insights.
- -
Sustainability in Emerging Economies: The bulk of research is concentrated in developed nations. Studies on corporate sustainability in emerging economies, including Romania, highlight the need for localized frameworks that account for economic, cultural, and regulatory differences.
Corporate sustainability entrepreneurship represents a dynamic and evolving field of study. While substantial progress has been made in understanding its drivers and implications, key research gaps persist, particularly in financial sustainability, sector-specific challenges, and the role of policy. Our paper works on addressing these gaps through interdisciplinary and cross-regional studies, which will enhance our ability to integrate sustainability into corporate strategy effectively, ensuring economic and environmental resilience in a rapidly changing global landscape.
3. Study Context and Research Hypothesis
The main idea of our research is to analyze the factors that can influence the green policy for Romania corporations. So, we try to group the data from the companies and find the interdependencies between them. In order to achieve this goal, we group these data as subjective financial performance, objective financial performance, innovation performance, pro-active orientation, age of firms, and green performance within Romanian corporations. We estimate the cross-dependencies for possible pairs of our collected parameters to obtain the most informative model for Romania transport (and possibly companies in other fields). As long as we focus particularly on transport, we also compare the ecological performance of transport firms against the other ones.
The sustainability factors we analyze include the following items:
company invests more than competitors in R&D and innovations for environmental protection (Investment);
the “green” products and services offered by the company are superior to those of the competition (Superiority);
the company have a better “green” reputation than the competition (Reputation);
the company has a competitive advantage in environmental protection based on the lowest costs (Advantage).
The Research Hypotheses are developed in the following paragraphs.
a. Managerial satisfaction: Strong financial results enable companies to invest in sustainability since they are less focused on short-term profits and more focused on long-term gains [
27,
28]. Although much of the literature explores the costs of transitioning to green entrepreneurship [
37,
38], financial success can drive sustainability and innovation. The companies’ financial stability managers view green investments as strategic, while those facing financial uncertainty prioritize short-term goals. This hypothesis examines whether better economic health fosters more green investments among Romanian corporations. The parameters that we gather that belong to this group are the following:
We measure the outcome of each of these factors on the sustainability characteristics and also on all of the parameters we list below concerning innovation and proactive orientation.
H1. Managerial satisfaction with a company’s financial performance influences proactive orientation and green policies adoption.
b. Proactivity: Proactive approaches target sustainability challenges and opportunities before they arise [
39]. In this way, sustainability is integrated into core strategies, driving innovation and long-term competitiveness [
40]. Besides improving environmental performance, this strategy will help businesses stay ahead of potential regulatory changes and meet rising consumer demands. This hypothesis investigates whether a proactive stance towards environmental issues leads to more effective environmental solutions and better green performance than companies responding to external pressures. With the purpose to estimate the proactivity in the company, we include the following questions in the questionnaire:
Are the technologies used by the company the latest ones (Usage)?
Does the company anticipate the potential of new technologies/practices (Anticipation)?
Does the company systematically try to acquire and implement new technologies (Implementation)?
Is the company’s research and development department a leader in the field (R&D)?
We would like to understand how each of these factors is influenced by managerial satisfaction on financial performance, and how, in turn, they drive innovation and sustainability.
H2. Proactive business orientation enhances innovation and green performance.
c. Managerial innovation: Innovative companies are more likely to develop solutions that reduce environmental impact [
41,
42]. The adoption of eco-friendly technologies often leads to improved economic efficiency [
43]. Innovative managers are also more inclined to pursue green initiatives, since they are better equipped to identify sustainability opportunities. This hypothesis explores managers’ self-perception as innovative and their willingness to implement green policies in Romanian corporations. As long as it is hard to objectively estimate innovation, we try to evaluate the following items:
Research activity (Activity),
The degree of product novelty within the company (Novelty),
Usage the latest technologies within the company (Latest),
Speed of development of new products by the company (Speed),
Share of new products within the range of company’s products (Share).
Again, we are looking into the possible interconnections between each and every of the mentioned above characteristics.
H3. Managers who perceive themselves as innovative are more likely to pursue green policies.
d. Maturity: Previous studies suggest that younger companies are more likely to engage in sustainability [
41,
44,
45], as they are founded in an era where environmental responsibility is critical. Although established companies have more resources to invest in sustainability, they may be slower to make changes driven more by regulatory compliance or corporate social responsibility (CSR) commitments than innovation. The main idea for this hypothesis is that newer companies are often founded during a period when sustainability and environmental responsibility are increasingly recognized as critical business imperatives.
Established and stable companies might have more resources to invest in sustainability initiatives. Also, they might be more entrenched in traditional practices that are harder to change. However, after receiving the research data, we found support for the opposite claim, i.e., we test if there is a correlation between the age of a company and its commitment to ecological practices is insignificant within the Romanian context.
This hypothesis tests whether age influences an organization’s ecological efforts in Romania.
H4. Company age affects proactive and innovative orientation of firms as well as their commitment to ecological practices.
e. Sectorial differences: Infrastructure and services play an important role in economic, social, and political progress. Although it is a major greenhouse gas emitter, it lacks the expertise to implement green technologies [
46]. This hypothesis examines whether Romanian transport companies adopt sustainable practices behind other sectors.
H5. Transport companies in Romania are less inclined to adopt green technologies than other sectors.
Hypotheses H1-H3 explore the factors influencing green performance within Romanian corporations. By testing these hypotheses, we are able to discover how financial health, innovation, and proactive business practices influence environmental sustainability efforts.
Hypotheses H4 and H5 study how specific characteristics of Romanian companies, such as their industry sector and age, affect their ecological performance and attitudes toward sustainability.
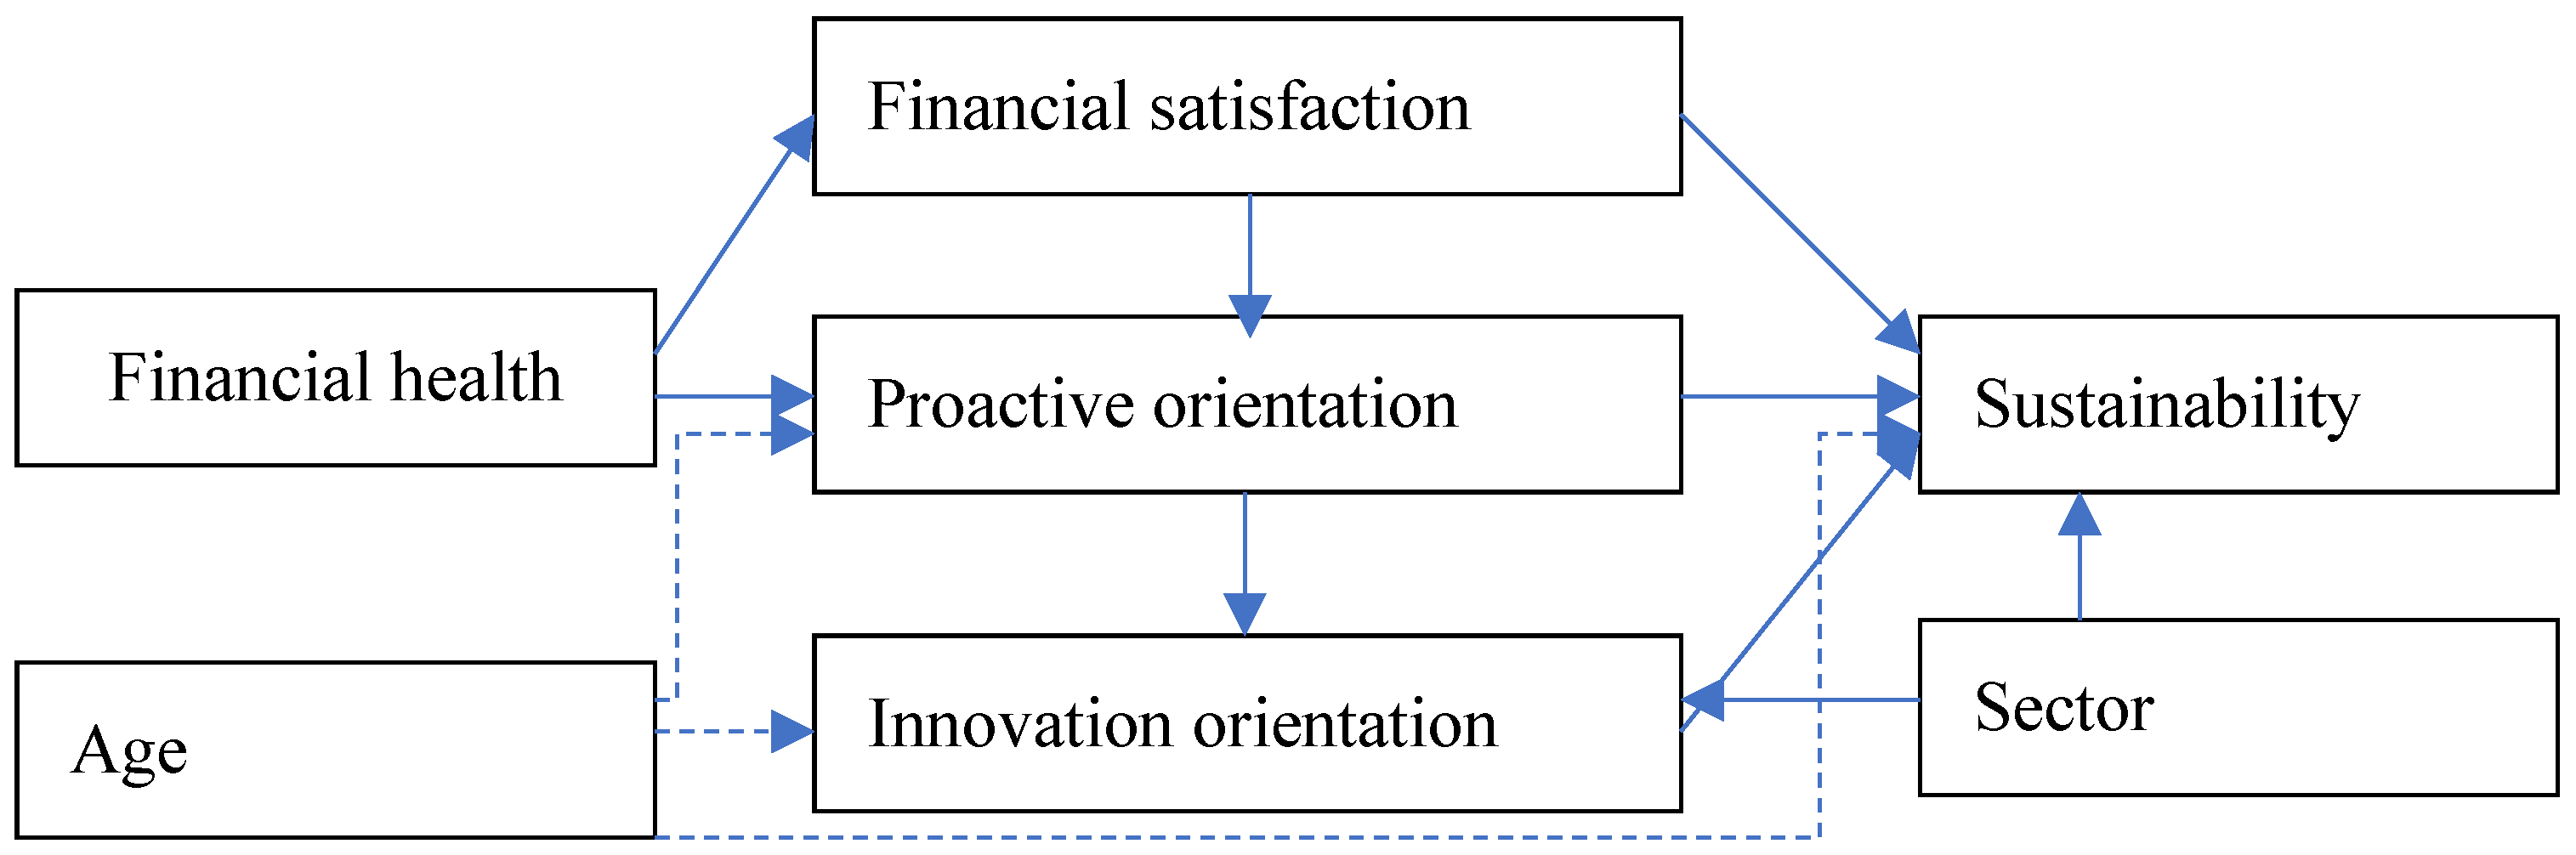
Figure 2 shows the research model of this study. The proposed model describes the relationships between financial health, innovation, and proactive business practices; the Romanian companies’ specific characteristics and management perception; and the ecological performance and attitudes toward sustainability.
We want to investigate the applicability of this model, so we do not need to investigate these relationships with, for example, PLS-type analysis as proposed, but instead apply correlation analysis to every possible pair of parameters to see whether we can approve the hypotheses for each pair.
This study proposes several direct and indirect relationships as illustrated in
Table 2.
4. Materials and Methods
4.1. Sample and Data Collection
To examine how managerial attitudes, company characteristics, and financial health influence environmental sustainability practices within Romanian corporations, questionnaires were conducted with 149 CEOs and CFOs of companies in Romania during the 1st trimester of the 2024. They were asked about economic health and strategy. Accordingly, companies were chosen using convenience sampling to select companies for study, which involves choosing the most readily accessible respondents based on feasibility and timeline considerations, paying attention to convenience sampling, meaning that companies were selected based on accessibility, feasibility, and time constraints rather than a strictly randomized or stratified approach. This allowed for a practical and efficient collection of data from relevant companies.
Shifting focus to the content validity (face validity), the current study developed the research instrument though building on the prior theoretical basis. To achieve this, a pre-testing was accomplished, and semi-structured interviews were conducted with representatives from academic institutions and practitioners (owners/managers in Romanian companies) who are acquainted with business strategy and were not included in the subsequent research. Accordingly, some slight changes were made to the research instrument based on the pre-test. With the intention of increasing the clearness of the research survey, the respondents were given introductory notes describing the research’s purposes and approaches. Moreover, to ensure consistency among the measure items and to avoid confusion among the respondents, all instrument items were measured on a seven-point Likert scale and seven-point semantic differentials, with response options ranging from “strongly disagree”, coded as 1, to “strongly agree”, coded as 5. The online questionnaire was prepared in Romanian, the native language of the participants. Further, this study used a structured research survey and followed the backtranslation (forward–backward translations) procedure suggested by Brislin [
47] to translate the research measures. In order to build and understand the best fit model for the dependencies between independent, moderate, and dependent variables, we performed pairwise correlation analysis for all the possible pairs of values and reached the conclusion that all the researched variables are basically correlate.
4.2. Data Analysis and Research Instrument
After obtaining the data on the “green performance” and “financial performance” of the companies included in the study, we can perform their analysis: examination of the distribution of companies across different fields, an evaluation of the average number of employees, and the investigation of age of companies in the sample.
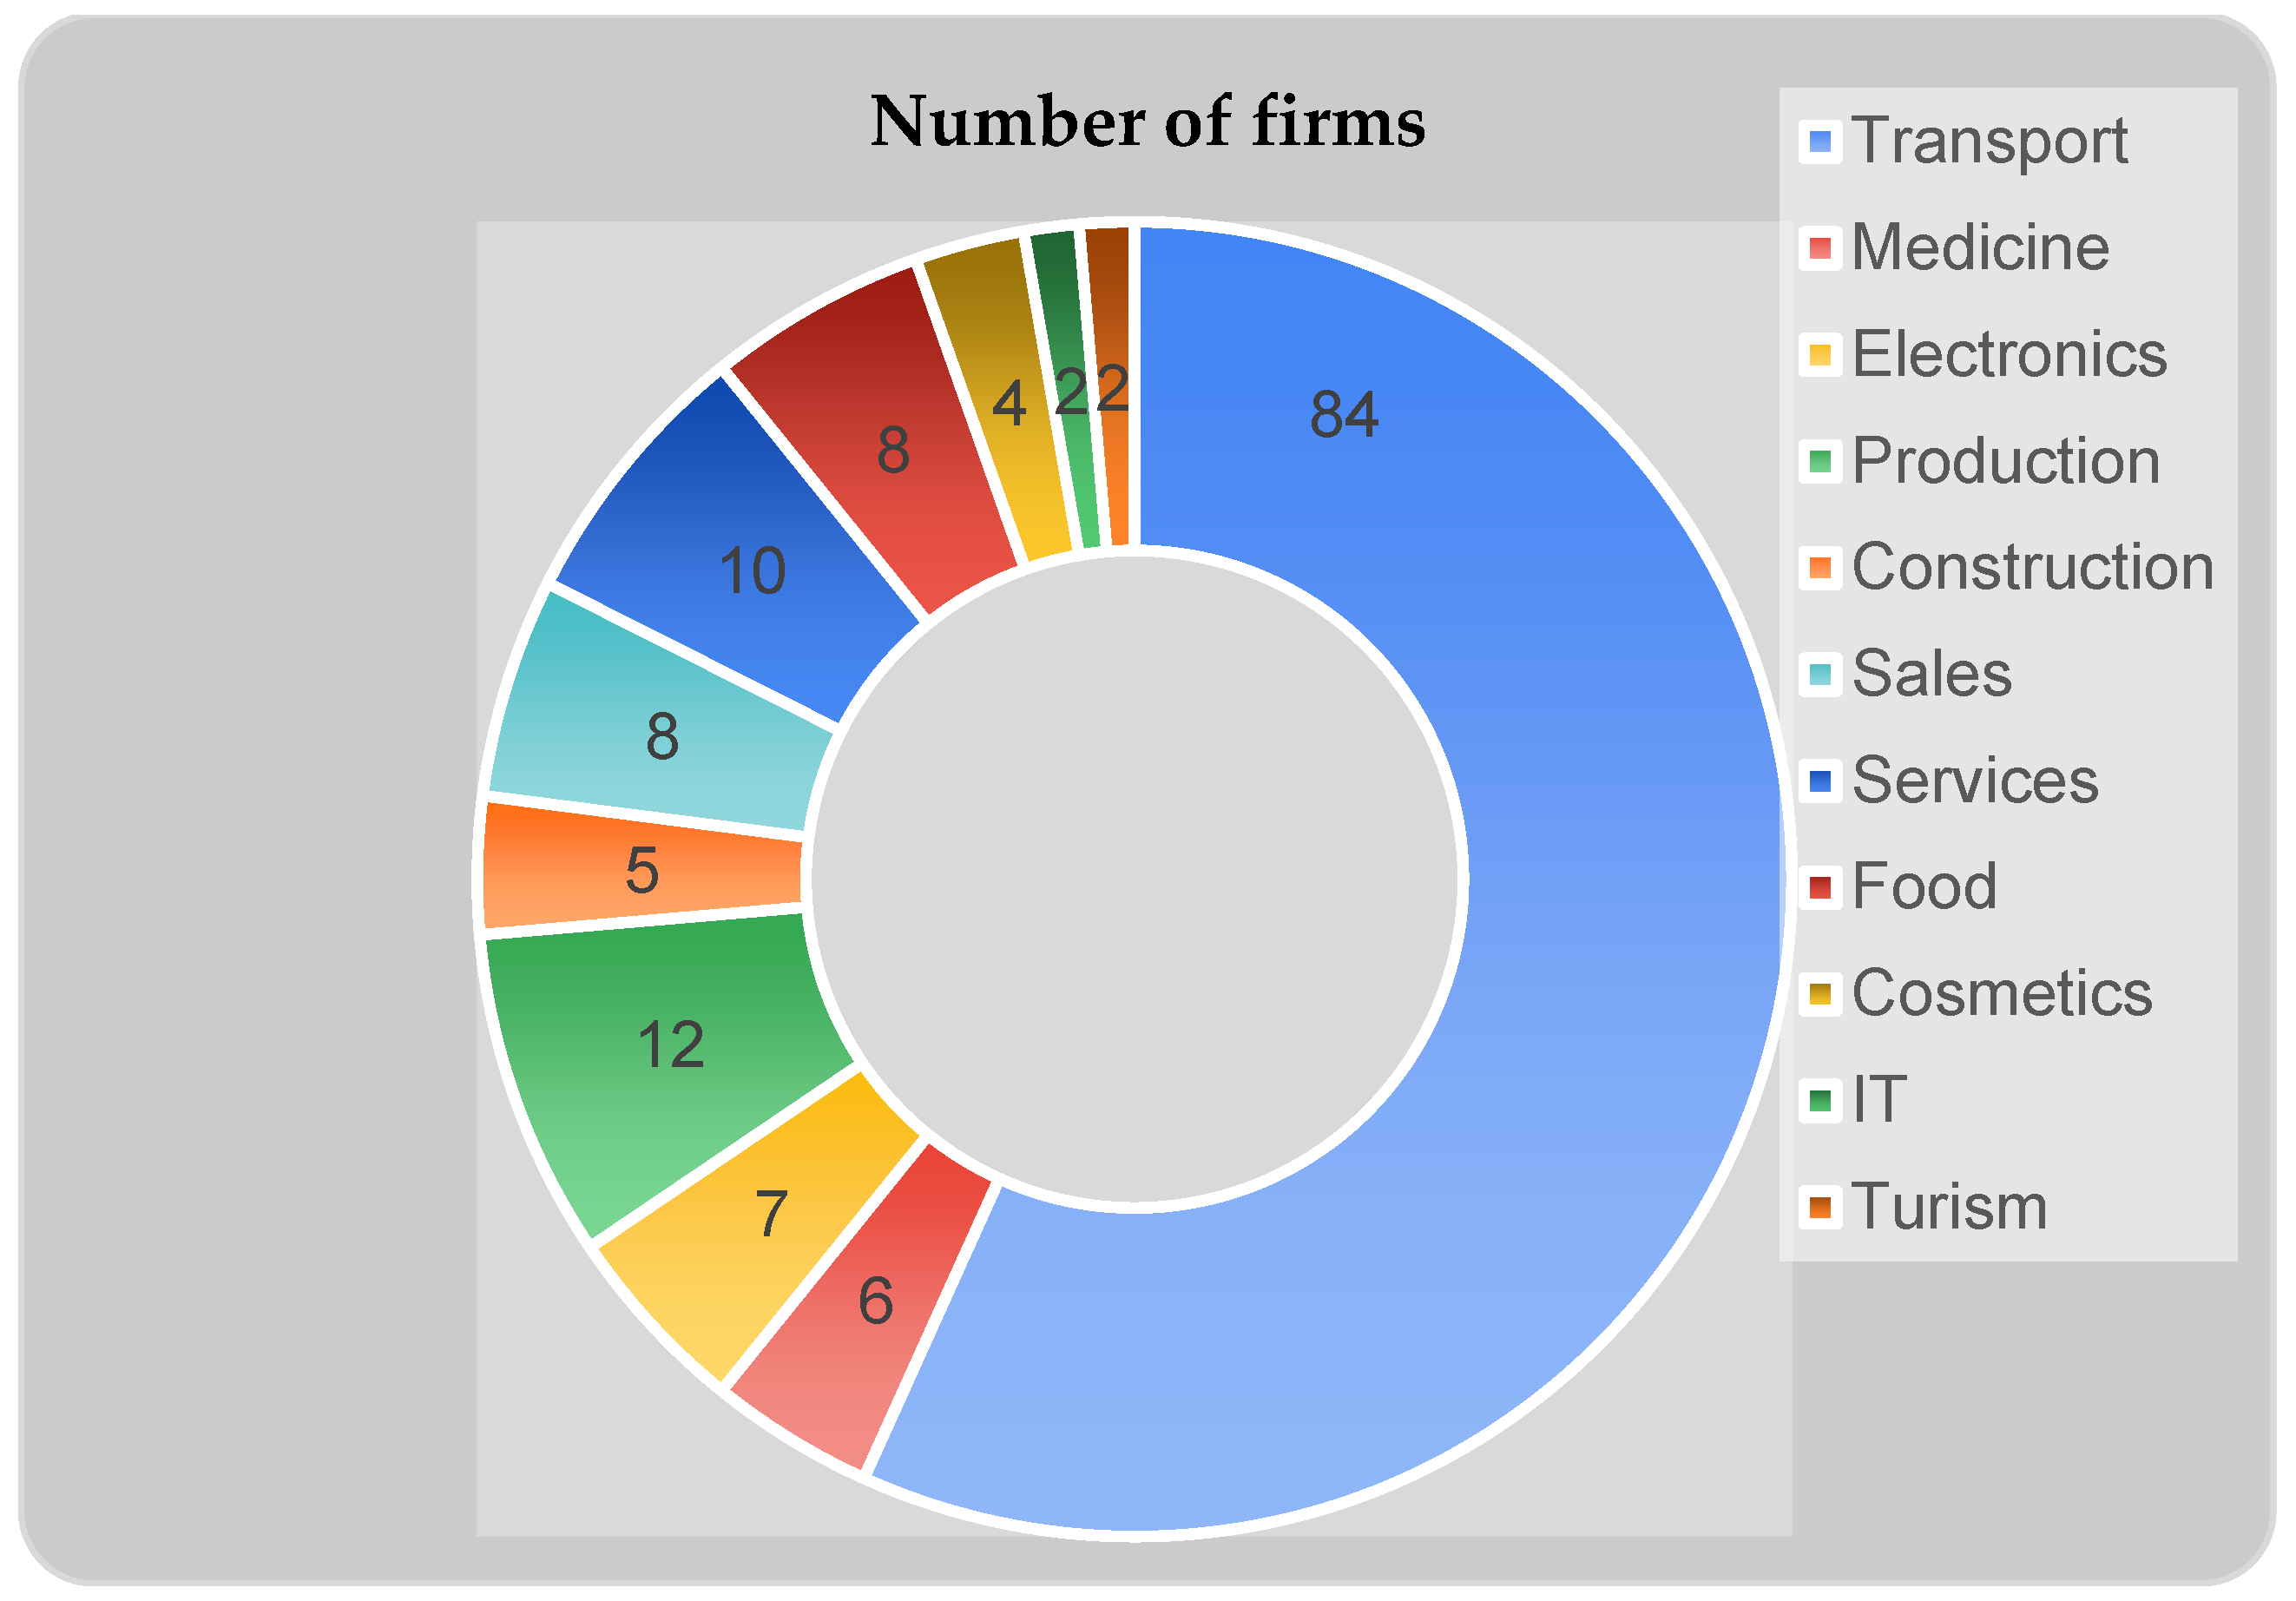
Our database includes companies from various fields, allowing for a broad analysis of how different industries approach green performance and financial performance. The analyzed fields include transport, manufacturing, food, medicine, services, finance, and others.
Figure 3 shows the distribution of companies by field and the frequency of companies in each industry in the questionnaire. This analysis helps in understanding the representation of different sectors in the study.
The average number of employees per company is an important indicator that could influence financial and green performance. Larger companies might have more resources to invest in sustainability initiatives, while smaller companies may face more constraints. According to the Romanian legislation, large companies are those with greater than 1000 employees, while mid-range companies are those with a number of workers within the range of 20–100. All the other companies are considered small-range companies. In our database, we identified only two large companies and eight companies of middle size, while the overwhelming majority of our companies could be considered small ones. Our distribution suggests that small-sized enterprises are well represented in the data, which may be typical for the Romanian market.
The age of the companies represents another critical variable. Younger companies might be more agile and innovative in their green practices, while older companies might have more established processes and a historical track record to consider. The histogram shows the age distribution of companies and how long these companies exist. The histogram helps us to identify whether the sample includes a balanced mix of young and old companies or whether there is a predominance of companies from a particular age group.
Figure 4 indicates a broad age range, with a substantial number of very young companies (e.g., less than 12 years old) and young companies (from 12 to 24 years old). Also, we obtain a significant representation of middle-aged companies (from 24 to 40 years old) and old companies. This distribution allows for an analysis of how company age might correlate with green performance and financial outcomes. The distribution of firm ages is close to exponential, which signifies a steady grows of Romanian market.
4.3. Statistical Analysis of Hypotheses H1–H5
To evaluate Hypotheses H1–H5, we investigated the relationship between green performance and financial performance across the sampled data using a combination of visual and statistical methods tailored to address the specific characteristics of the dataset. Given the dataset’s size (less than 200 observations) and its failure to satisfy key assumptions of normality and homogeneity of variances, special consideration was given to selecting robust statistical techniques.
Analysis of variance (ANOVA) was initially considered as a method for assessing differences in mean values of dependent variables across categorical groups. However, ANOVA relies on assumptions of normality and homogeneity of variances, which were not met in this dataset, as verified by Shapiro–Wilk and Levene’s tests [
48,
49]. While robust ANOVA variants (e.g., Welch’s ANOVA) can handle violations of homogeneity, the small sample size and non-normality prompted us to favor non-parametric and generalized methods to ensure reliable results.
Spearman’s rank correlation and Kendall’s Tau were selected to assess monotonic relationships between variables without assuming linearity or normal distributions [
50,
51,
52].
Spearman’s rank correlation quantifies the strength and direction of monotonic relationships, making it suitable for exploring potential dependencies between financial performance metrics (e.g., revenue, ROI) and green performance indicators (e.g., investment in sustainability).
Kendall’s Tau, though computationally more intensive, offers additional robustness in handling ties and smaller datasets, providing complementary insights [
50].
To assess the dependency of green performance on financial metrics and proactive orientations, we employed GLMs, which allow for flexible modeling of relationships across a wide range of distributions [
53]. GLMs were particularly advantageous in this study because they account for non-normality in the dependent variables, enabling us to investigate key relationships effectively despite dataset limitations.
To compare ecological and financial performance metrics between groups (e.g., transport versus non-transport companies), the Mann–Whitney U test was used as a non-parametric alternative to
t-tests [
54]. This method does not rely on assumptions of normality or equal variances and is robust for datasets with outliers or skewed distributions.
Partial correlation analysis was performed to evaluate the relationships between financial and ecological performance while controlling for potential confounding factors (e.g., innovation activity or company age). This technique allowed us to isolate the unique contributions of specific variables, ensuring more accurate interpretations of the dependencies [
48,
50].
Visual tools, including scatter plots and histograms, were employed as preliminary methods for exploring relationships between variables. These visualizations provided insights into potential trends and guided the selection of appropriate statistical techniques [
55]. Dependency graphs and detailed summaries are included in the appendix for transparency and reproducibility.
Statistical methods and workflow
Exploratory Analysis: Initial data exploration involved scatter plots to identify trends and patterns [
55].
Correlation Analysis: Spearman’s rank correlation and Kendall’s Tau quantified the strength of monotonic relationships between variables [
51,
52].
Group Comparisons: Mann-Whitney U tests evaluated differences between categorical groups [
54].
Modeling Dependencies: GLMs modeled relationships between financial metrics, innovation activity, and green performance considering non-normality [
53].
Controlled Analysis: Partial correlation analysis controlled for confounders, enhancing the robustness of the findings [
48,
50].
Confidence Level and Interpretation
All statistical tests were conducted at a 95% confidence level.
p-values were interpreted alongside effect sizes to assess statistical and practical significance [
50]. Effect size calculations, such as r = z/√N, provided insights into the magnitude of observed differences.
By adopting this multi-method approach, we ensured that the statistical analysis of Hypotheses H1–H3 was robust, reliable, and tailored to the unique characteristics of the dataset. This combination of methods provided comprehensive insights into the interplay between green and financial performance, overcoming the limitations posed by small sample size and non-normal data distributions.
The confidence level for all statistical tests was fixed at 0.95, ensuring robust conclusions regarding the relationship between financial and ecological performance metrics.
To evaluate Hypothesis H4, data were stratified into six age groups, as shown in
Figure 4. For each age group, correlations were assessed using three statistical methods:
Pearson Correlation Coefficient: This metric measured the linear correlations between variables, providing insights into strength and directionality [
48,
56].
Spearman’s Rank Correlation Coefficient: This non-parametric method was employed to capture monotonic relationships between variables [
48,
51].
Kendall’s Tau: This metric assessed ordinal associations and offered robust insights into data with potential ties [
49,
52].
The p-values for each test were calculated to evaluate the null hypothesis of no correlation within the given confidence level of 0.95. These complementary statistical approaches provided a nuanced understanding of the relationships under investigation, ensuring the robustness of the conclusions.
Transport companies in Romania face significant challenges in pursuing a sustainable future. The key issues include the limited availability of biofuels, the high cost of electric vehicles for road transport—especially considering the inadequate infrastructure to support them—which makes companies using these vehicles less competitive. Additionally, the advanced age of the trucks in use exacerbates [
57] their environmental impact.
To evaluate Hypothesis H5, we employed the Mann–Whitney U Test, a non-parametric statistical method, to compare the distributions of ecological parameters between transport and non-transport sector samples. This test is particularly suitable for datasets that may not meet the assumptions of normality required for parametric tests, such as the independent sample
t-test [
54].
The Mann–Whitney U Test assesses whether one group tends to have systematically higher or lower values compared to another group. In this analysis, the transport sector is the first group, and all non-transport sectors are the second. The test evaluates the null hypothesis (H0) that the distributions of ecological performance metrics for the two groups are identical. Rejection of the null hypothesis implies significant differences in these distributions, supporting the alternative hypothesis that the ecological performance of the transport sector is systematically lower than that of other sectors.
To ensure the robustness of the finding’s assumptions, the Mann–Whitney U Test was verified, including the independence of samples and ordinal or continuous scale of the ecological parameters. In addition to the
p-value, the effect size (using metrics such as
, where
is the test statistic and
is the total number of observations) was calculated to measure the practical significance of the differences [
58]. The confidence level for rejecting the null hypothesis was set to 0.95, providing a high threshold for statistical significance.
This method allowed us to determine whether ecological performance in the transport sector systematically lags behind other sectors, addressing the central question of the hypothesis. A complete set of test results, including descriptive statistics, effect sizes, and
p-values, is presented in
Table 3,
Table 4,
Table 5,
Table 6 and
Table 7 of the Results and Discussion sections.
5. Results
To evaluate Hypotheses H1–H3, a comprehensive correlation analysis was conducted to examine the relationship between green performance and financial performances/proactive orientation/innovation parameters across the sample for every pair of the parameters. The statistical significance of the correlations was assessed, and the results of all p-values were analyzed.
To further ensure the robustness of these findings, we calculated Kendall’s Tau, Pearson correlation coefficients, and Spearman’s Rank Correlation Coefficients.
Table 3 summarizes Pearson correlation coefficients, with their corresponding
p-values, effect sizes, and upper/lower bounds for 95% confidence level, which represent the strength and direction of linear relationships between financial and ecological parameters.
Table 3.
Statistical evaluation of pairwise connections.
Table 3.
Statistical evaluation of pairwise connections.
| Connection | Pearson Corr. | p-Value | 95% CI (Lower) | 95% CI
(Upper) | Effect Size (R2) |
|---|
| Brut/Investment | 0.47501 | <0.001 | 0.33970 | 0.59106 | 0.22563 |
| Brut/Superiority | 0.45167 | <0.001 | 0.31315 | 0.57138 | 0.20401 |
| Brut/Reputation | 0.42611 | <0.001 | 0.28431 | 0.54966 | 0.18157 |
| Brut/Advantage | 0.47501 | <0.001 | 0.33970 | 0.22563 | 0.22563 |
| Profit/Investment | 0.45167 | <0.001 | 0.31315 | 0.57138 | 0.20401 |
| Profit/Superiority | 0.45740 | <0.001 | 0.31964 | 0.57622 | 0.20921 |
| Profit/Reputation | 0.42611 | <0.001 | 0.28431 | 0.54966 | 0.18157 |
| Profit/Advantage | 0.53427 | <0.001 | 0.40811 | 0.64041 | 0.28545 |
| ROA/Investment | 0.50931 | <0.001 | 0.37912 | 0.61973 | 0.25940 |
| ROA/Superiority | 0.50118 | <0.001 | 0.36973 | 0.61296 | 0.25118 |
| ROA/Reputation | 0.44155 | <0.001 | 0.30170 | 0.56280 | 0.19497 |
| ROA/Advantage | 0.49285 | <0.001 | 0.36015 | 0.60601 | 0.24291 |
| Sales/Investment | 0.45635 | <0.001 | 0.31845 | 0.57533 | 0.20825 |
| Sales/Superiority | 0.47534 | <0.001 | 0.34008 | 0.59134 | 0.22595 |
| Sales/Reputation | 0.43801 | <0.001 | 0.29770 | 0.55980 | 0.19185 |
| Sales/Advantage | 0.51372 | <0.001 | 0.38422 | 0.62339 | 0.26391 |
| EPS/Investment | 0.49975 | <0.001 | 0.36808 | 0.61177 | 0.24975 |
| EPS/Superiority | 0.50360 | <0.001 | 0.37253 | 0.61498 | 0.25362 |
| EPS/Reputation | 0.46283 | <0.001 | 0.32582 | 0.58081 | 0.21421 |
| EPS/Advantage | 0.56394 | <0.001 | 0.44289 | 0.66480 | 0.31803 |
| ROI/Investment | 0.53255 | <0.001 | 0.40610 | 0.63899 | 0.28361 |
| ROI/Superiority | 0.57284 | <0.001 | 0.45340 | 0.67207 | 0.32815 |
| ROI/Reputation | 0.51600 | <0.001 | 0.38687 | 0.62529 | 0.26626 |
| ROI/Advantage | 0.49641 | <0.001 | 0.36423 | 0.60898 | 0.24642 |
| Rate/Investment | 0.48533 | <0.001 | 0.35151 | 0.59971 | 0.23554 |
| Rate/Superiority | 0.47641 | <0.001 | 0.34130 | 0.59224 | 0.22697 |
| Rate/Reputation | 0.45895 | <0.001 | 0.32141 | 0.57753 | 0.21064 |
| Rate/Advantage | 0.51853 | <0.001 | 0.38979 | 0.62739 | 0.26887 |
| Usage/Investment | 0.45881 | <0.001 | 0.32125 | 0.57742 | 0.21051 |
| Usage/Superiority | 0.46205 | <0.001 | 0.32492 | 0.58014 | 0.21349 |
| Usage/Reputation | 0.49123 | <0.001 | 0.35828 | 0.60465 | 0.24131 |
| Usage/Advantage | 0.60519 | <0.001 | 0.49188 | 0.69835 | 0.36626 |
| Anticipation/Investment | 0.68294 | <0.001 | 0.58618 | 0.76049 | 0.46641 |
| Anticipation/Superiority | 0.74644 | <0.001 | 0.66521 | 0.81021 | 0.55718 |
| Anticipation/Reputation | 0.70292 | <0.001 | 0.61086 | 0.77624 | 0.49410 |
| Anticipation/Advantage | 0.72059 | <0.001 | 0.63282 | 0.79008 | 0.51925 |
| Implementation/Investment | 0.47999 | <0.001 | 0.34540 | 0.59524 | 0.23039 |
| Implementation/Superiority | 0.47228 | <0.001 | 0.33658 | 0.58876 | 0.22305 |
| Implementation/Reputation | 0.47653 | <0.001 | 0.34143 | 0.59233 | 0.22708 |
| Implementation/Advantage | 0.48443 | <0.001 | 0.35048 | 0.59896 | 0.23467 |
| R&D/Investment | 0.61512 | <0.001 | 0.50377 | 0.70636 | 0.37837 |
| R&D/Superiority | 0.70647 | <0.001 | 0.61525 | 0.77902 | 0.49910 |
| R&D/Reputation | 0.74928 | <0.001 | 0.66878 | 0.81241 | 0.56141 |
| R&D/Advantage | 0.68256 | <0.001 | 0.58572 | 0.76019 | 0.46589 |
| Activity/Investment | 0.41129 | <0.001 | 0.26771 | 0.53700 | 0.16916 |
| Activity/Superiority | 0.43760 | <0.001 | 0.29724 | 0.55945 | 0.19149 |
| Activity/Reputation | 0.37389 | <0.001 | 0.22619 | 0.50479 | 0.13980 |
| Activity/Advantage | 0.52648 | <0.001 | 0.39903 | 0.63397 | 0.27718 |
| Novelty/Investment | 0.52648 | <0.001 | 0.39903 | 0.63397 | 0.27718 |
| Novelty/Superiority | 0.49255 | <0.001 | 0.35979 | 0.60575 | 0.24260 |
| Novelty/Reputation | 0.49525 | <0.001 | 0.36290 | 0.60801 | 0.24527 |
| Novelty/Advantage | 0.44097 | <0.001 | 0.30104 | 0.56231 | 0.19445 |
| Latest/Investment | 0.51542 | <0.001 | 0.38619 | 0.62481 | 0.26566 |
| Latest/Superiority | 0.49907 | <0.001 | 0.36730 | 0.61120 | 0.24907 |
| Latest/Reputation | 0.44927 | <0.001 | 0.31042 | 0.56934 | 0.20184 |
| Latest/Advantage | 0.42007 | <0.001 | 0.27753 | 0.54451 | 0.17646 |
| Speed/Investment | 0.47623 | <0.001 | 0.34110 | 0.59209 | 0.22680 |
| Speed/Superiority | 0.44546 | <0.001 | 0.30611 | 0.56612 | 0.19843 |
| Speed/Reputation | 0.43867 | <0.001 | 0.29844 | 0.56035 | 0.19243 |
| Speed/Advantage | 0.38970 | <0.001 | 0.24368 | 0.51845 | 0.15187 |
| Share/Investment | 0.47591 | <0.001 | 0.34072 | 0.59181 | 0.22649 |
| Share/Superiority | 0.43409 | <0.001 | 0.29328 | 0.55646 | 0.18843 |
| Share/Reputation | 0.42337 | <0.001 | 0.28124 | 0.17925 | 0.17925 |
| Share/Advantage | 0.39062 | <0.001 | 0.24470 | 0.51924 | 0.15259 |
These coefficients indicate moderate positive linear relationships between financial/proactive/innovation and ecological parameters. While not particularly strong, the correlations suggest that financial success is associated with improved green performance.
We may see from the table that the p-values for all financial, proactive orientation, and innovation metrics are below 0.001, confirming strong statistical significance. This provides further statistical justification for rejecting the null hypothesis (no correlation between parameters), reinforcing the finding that significant relationships exist between financial, proactive, and ecological parameters. These results also indicate that financial success positively influences proactive orientation, though the relationships are less direct compared to the associations with sustainability or ecological policies.
Additionally, paired t-tests and a GLM approach were performed to compare proactive orientation parameters and ecological parameters. These tests confirmed at a 95% confidence level that proactive orientation metrics influence innovation and ecological policies within firms. This supports the idea that proactive behaviors often drive ecological initiatives and sustainability efforts, demonstrating a strong alignment between corporate proactivity and environmental responsibility.
Paired t-tests with GLM were performed to compare the means of proactive orientation parameters and ecological parameters. With a 95% confidence level, these tests confirmed that proactive orientation metrics influence innovation and ecological policies within firms. The analysis suggests that proactive orientation and ecological orientation are closely related, with proactive behaviors often driving ecological initiatives and sustainability efforts and innovation metrics confirm that they are associated with ecological performance.
We calculated the mean differences between financial perception parameters and ecological parameters to further investigate whether ecological performance systematically differs from financial performance. The results show that the average financial perception parameters are comparable to the ecological performance means. The results confirmed that the differences between financial and ecological parameters are normally distributed, with a mean difference approximately equal to one. This finding implies that financial performance is perceived as marginally superior to ecological performance, though the overall differences are small.
A similar analysis was conducted to evaluate the relationships between financial parameters and proactive orientation metrics, including the usage of the latest technologies, anticipation of technological potential, implementation of innovative practices, and the quality of R&D departments. Pearson correlation coefficients for these relationships are presented in
Table 4.
Table 4.
Pearson Correlation Coefficients for Financial Parameters vs. Proactive Orientation Metrics.
Table 4.
Pearson Correlation Coefficients for Financial Parameters vs. Proactive Orientation Metrics.
| Finance Parameter | Usage | Anticipation | Implementation | R&D |
|---|
| Brut | 0.3147 | 0.3166 | 0.3619 | 0.1380 |
| Profit | 0.3147 | 0.3166 | 0.3619 | 0.1380 |
| ROA | 0.3939 | 0.3865 | 0.4390 | 0.2139 |
| Sales | 0.3352 | 0.3194 | 0.3653 | 0.1973 |
| EPS | 0.5137 | 0.3250 | 0.5036 | 0.4628 |
| ROI | 0.3557 | 0.3576 | 0.4064 | 0.2036 |
| Rate | 0.3101 | 0.3005 | 0.3740 | 0.1862 |
The p-values for the first three proactive orientation metrics (usage, anticipation, and implementation) are below 0.002, indicating strong statistical significance. These results suggest that financial success positively influences proactive orientations, though the relationships are less direct compared to the associations with sustainability or ecological policies. The paired t-tests at a 95% confidence level were also conducted to compare the means of financial perception parameters and proactive orientation metrics. The results confirmed that proactive orientation parameters (usage, anticipation, implementation, and R&D) are statistically similar to financial perception parameters.
However, the correlation with the R&D metric is notably weaker, with p-values ranging from 0.1862 to 0.203 with exception to earnings per share. These results suggests that R&D quality functions as an independent variable in the model rather than being directly associated with financial performance, but it depends on earnings per share.
For Hypotheses H1, H2 and H3, the analyses demonstrate significant positive correlations between proactive or innovative orientations and ecological performance. These relationships are also supported by multiple statistical measures, including Pearson, Spearman, and Kendall correlations, as well as paired t-tests with high confidence levels (95%). These findings underscore the interconnectedness of proactive strategies, innovation, and sustainability efforts. This analysis highlights the role of innovation as a key driver for sustainable practices within firms, suggesting that firms with stronger innovation capabilities also perform better in ecological domains.
Hypothesis H4 investigates the correlation of firm’s age significantly and sustainability-related factors, including ecological orientation, proactive orientation, and innovation. The data were grouped into six age categories (
Figure 4), and correlation analyses were performed using Pearson correlation coefficients, Spearman’s rank correlation, and Kendall’s Tau. The results of the correlation analysis between firm age and sustainability parameters (Ecological, Proactive, and Innovation) are summarized in
Table 5.
Table 5.
Correlation Coefficients of Firm Age vs. Sustainability Parameters.
Table 5.
Correlation Coefficients of Firm Age vs. Sustainability Parameters.
| Statistic Type | Pearson
Correlation | Pearson Corr.
p-Value | Kendall’s Tau | Kendall’s Tau p-Value |
|---|
| Investment | 0.072107 | 0.38380 | 0.043435 | 0.51919 |
| Superiority | 0.035746 | 0.66623 | 0.020159 | 0.76472 |
| Reputation | 0.049634 | 0.54912 | 0.016800 | 0.80292 |
| Advantage | 0.027455 | 0.74046 | 0.002748 | 0.96748 |
| Usage | −0.066387 | 0.42275 | −0.077150 | 0.25534 |
| Anticipation | −0.014650 | 0.85972 | −0.032507 | 0.63238 |
| Implementation | −0.037566 | 0.65034 | −0.068874 | 0.31103 |
| R&D | −0.021184 | 0.79829 | −0.028766 | 0.67108 |
| Activity | −0.042306 | 0.60967 | −0.050520 | 0.45434 |
| Novelty | −0.082723 | 0.31753 | −0.085707 | 0.20692 |
| Latest | −0.052320 | 0.52764 | −0.044099 | 0.51676 |
| Speed | −0.103980 | 0.20851 | −0.114359 | 0.09266 |
| Share | −0.065416 | 0.42958 | −0.061930 | 0.36145 |
The correlation analysis results, summarized in
Table 5, indicate weak and statistically insignificant relationships between firm age and sustainability-related factors across Pearson correlation and Kendall’s Tau measures. The absolute values of the correlation coefficients remain low (mostly below 0.1) against a threshold
p-value 0.05 for a 95% confidence level, suggesting a lack of meaningful association. Since all
p-values are greater than 0.05, none of these correlations are statistically significant.
Consequently, Hypothesis H4 is rejected. Instead, the results support the null hypothesis that firm age does not significantly impact sustainability performance, proactive strategies, or innovation orientation. This implies that factors such as firm-specific capabilities, market dynamics, and leadership choices play a more dominant role than mere chronological age in shaping sustainability and innovation efforts.
In the following, we evaluate Hypothesis H5, which posits that sustainability-related factors differ significantly between the transport sector and other industries. To test this, the Mann–Whitney U Test was employed to compare the distributions of ecological, proactive orientation, and innovation parameters between transport and non-transport firms.
The results of the Mann–Whitney U Test for ecological parameters (Investment, Superiority, Reputation, and Advantage), proactive orientation parameters (Usage, Anticipation, Implementation, and R&D), and innovation parameters (Activity, Novelty, Latest, Speed, and Share) are summarized in
Table 6.
Table 6.
Mann–Whitney U Test for Ecological Performance of Transport vs. Non-transport Firms.
Table 6.
Mann–Whitney U Test for Ecological Performance of Transport vs. Non-transport Firms.
| Ecological Parameter | p-Value for Mann-Whitney U Test | Mann–Whitney U Test | Effect Size |
|---|
| Investment | 9.534 × 10⁻⁶ | 3765.5 | 309.5 |
| Superiority | 1.560 × 10⁻⁶ | 3863.0 | 317.5 |
| Reputation | 6.479 × 10⁻⁶ | 3787.5 | 311.3 |
| Advantage | 1.289 × 10⁻⁶ | 3872.0 | 318.2 |
| Usage | 1.327 × 10⁻⁴ | 3601.0 | 296 |
| Anticipation | 1.386 × 10⁻⁵ | 3736.0 | 307 |
| Implementation | 5.778 × 10⁻⁶ | 3783.5 | 311 |
| R&D | 5.812 × 10⁻⁵ | 3652.0 | 300.2 |
| Activity | 3.905 × 10⁻⁵ | 3680.0 | 302.5 |
| Novelty | 1.820 × 10⁻⁴ | 3578.0 | 294.1 |
| Latest | 2.750 × 10⁻⁴ | 3551.5 | 291.9 |
| Speed | 4.073 × 10⁻⁵ | 3670.0 | 301.7 |
| Share | 2.747 × 10⁻⁵ | 3696.0 | 303.8 |
The significant result of the Mann–Whitney U Test was large effect size combined with very low
p-values across all ecological parameters as well as significant differences in ecological performance between transport and non-transport firms. Specifically, transport companies exhibit significantly lower ecological performance compared to their counterparts in other sectors. Also, the results in
Table 6 suggest that transport firms consistently underperform in proactive orientation compared to non-transport firms.
Similar to ecological and proactive parameters, the important result of Mann-Whitney U Test was effect size combined with the p-values for all innovation parameters, which was notably small, signifying a significant disadvantage for transport companies. The disparity is statistically significant across all metrics. To sum up, the results of the Mann–Whitney U Tests consistently demonstrate that transport firms underperform relative to non-transport firms in terms of ecological considerations, proactive orientation, and innovation. The very low p-values for all parameters confirm statistically significant disparities between the two groups.
The findings suggest that the transport sector faces unique challenges in achieving sustainability. These challenges may stem from inherent characteristics of the industry, such as heavy reliance on fossil fuels and stringent operational constraints. Addressing these issues requires targeted interventions, including the adoption of advanced technologies, stricter environmental policies, and enhanced innovation efforts.
Future research should explore the underlying factors contributing to these disparities and investigate potential strategies for improving sustainability in the transport sector. It should also be investigated whether other factors, such as industry type, market dynamics, or leadership styles, play a more pivotal role in driving sustainability and innovation outcomes.
6. Discussion
In this empirical study, the researchers analyzed the influence of sustainability strategies on corporate economic performance, innovation efforts, and proactive strategies from a management perspective and the impact of maturity of companies and its sector on this influence. As illustrated in
Table 7, the results show that the managerial perception of innovation and proactivity has significant effects on the green policies adoption in the Romanian context. This result is consistent with other studies such as [
34], which analyzed the relationship between the CSR and financial performance in Romania and found that CSR actions carried out by companies from Romania in accordance with ISO 26000 positively impact financial performance.
Table 7.
Mann–Whitney U Test for Innovation Performance of Transport vs. Non-transport Firms.
Table 7.
Mann–Whitney U Test for Innovation Performance of Transport vs. Non-transport Firms.
| # | Paths | Decision |
|---|
| H1 | Managerial Satisfaction with Financial Performance (MSFP)⟶Green Policies Adoption (GPA | Supported |
| Managerial Satisfaction with Financial Performance (MSFP)⟶Proactive Business Orientation (PBO) | Supported |
| H2 | Proactive Business Orientation (PBO)⟶Green Policies Adoption (GPA) | Supported |
| Proactive Business Orientation (PBO)⟶Innovation Orientation (OI) | Supported |
| H3 | Innovation Orientation (OI)⟶Green Policies Adoption (GPA) | Supported |
| H4 | Company Age (CA)⟶Green Policies Adoption (GPA) | Not Supported |
| Company Age (CA)⟶Proactive Business Orientation (PBO) | Not Supported |
| Company Age (CA)⟶ Innovation Orientation (OI) | Not Supported |
| H5 | Sectorial differences (SD)⟶Green Policies Adoption (GPA) | Supported |
| Sectorial differences (SD)⟶Innovation Orientation (OI) | Supported |
In the following, we discuss the results of testing the various hypotheses, highlighting significant connections between factors with implications for both theory and practice in corporate sustainability.
Managerial satisfaction:
Statistical and correlation analyses were applied to investigate Hypothesis H1, which suggests that managerial satisfaction with financial performance influences the adoption of green policies in Romanian companies. The results indicated that there is a significant relationship between financial performance (e.g., profitability, ROI) and ecological performance (e.g., ecological investment, reputation) with
p-values close to zero, leading to the rejection of the hypothesis that no correlation exists. Various correlation measures such as Pearson, Kendall’s Tau, and Spearman’s Rank were used to assess the relationships. While the correlations were not very strong, they were still significant for most pairs of financial and ecological parameters. The studies show that financial performance metrics were closely aligned with ecological performance parameters, with minimal differences in their means, confirming that financial performance is viewed similarly to ecological performance. The analysis aligns with the literature [
27,
28,
37,
38,
59] suggesting that financial success supports green policies and innovation, showcasing that strong financial results encourage long-term green investments rather than focusing on short-term profits.
Managerial innovation:
Hypothesis H2, which posits that managers who perceive themselves as innovative are more likely to pursue green policies, was evaluated through correlation and statistical methods. The results showed significant positive correlations between proactive orientation (such as usage, anticipation, implementation, and R&D) and ecological parameters, with
p-values close to zero, leading to the rejection of the hypothesis that no correlation exists. The findings were further supported by Kendall’s Tau and Spearman’s Rank Correlation, confirming a strong relationship between proactivity and ecological orientation. The t-statistics analysis indicated that the means of proactive orientation and ecological parameters were statistically similar, with a 95% confidence level. This suggests that proactive orientation, which drives innovation, also significantly influences ecological policies within firms which goes in line with Yin et al. [
41], Ionescu et al. [
42], Shah et al. [
21], and Skordoulis et al. [
60]. The analysis supports the hypothesis that managers who view themselves as innovative are more likely to pursue green policies, as innovation and ecological efforts are closely linked within organizations. As Singh et al. [
43] stated, the adoption of eco-friendly technologies leads to improved economic efficiency as innovative managers are more inclined to pursue green initiatives since they are better equipped to identify sustainability opportunities.
Proactivity:
To test Hypothesis H3, which suggests that proactive business orientation enhances green performance, correlation analysis and statistical tools were employed. The results revealed significant positive correlations between innovation parameters (such as activity, novelty, speed, and share) and ecological parameters, with
p-values close to zero, leading to the rejection of the hypothesis that no correlation exists. The correlations were confirmed by Spearman’s and Kendall’s Tau coefficients, further supporting the relationship between innovation and ecological performance. The paired t-statistics analysis, with a 95% confidence level, indicated a strong correspondence between innovation parameters and ecological performance. The analysis supports the hypothesis that a proactive approach to environmental issues, by integrating sustainability into core strategies, leads to better green performance and innovation, enabling companies to stay competitive and meet regulatory and consumer demands. Proactive approaches, as explained by Ari et al. [
39] and Carchano et al. [
61], target sustainability challenges and opportunities before they arise. This strategy drives innovation and long-term competitiveness [
40,
62,
63,
64,
65,
66] and strengthens businesses for potential regulatory changes and rising consumer demands.
Maturity:
Hypothesis H4, which posits that company age significantly affects commitment to ecological practices, was tested by analyzing data across six age groups of companies. The results showed very weak correlations between company age and ecological, proactive orientation, and innovation parameters, rejecting the main hypothesis and supporting the opposite hypothesis that firm age has no impact on these parameters. Specifically, the Pearson, Spearman, and Kendall’s Tau correlation coefficients for ecology, proactive, and innovation parameters were all very low, with
p-values close to zero, leading to the rejection of the hypothesis that company age influences these factors. The analysis indicates that company age does not significantly impact ecological efforts, proactive orientation, or innovation, supporting the idea that younger companies are not inherently more committed to sustainability as found in other context [
44,
45] and that established firms can also engage in ecological practices, regardless of their age [
67,
68,
69].
Sectorial differences:
Hypothesis H5, which suggests that transport companies in Romania are less inclined to adopt green technologies than other sectors, was tested through a comparison of ecological, proactive orientation, and innovation parameters between transport and non-transport companies. The analysis revealed that transport companies tend to have significantly lower ecological performance as well as weaker proactive orientation and innovation parameters compared to non-transport companies, which corresponds with the findings of Petcu [
70], Pertheban [
64], and Sovacool [
71]. Stan [
46] stated that they are considered as a major greenhouse gas emitter, but the expertise to implement green technologies is lacking. The Mann–Whitney U Test showed very low
p-values for all parameters, indicating a significant difference between transport and non-transport firms. Transport companies were found to have lower values in ecological performance, proactive orientation (usage, anticipation, and implementation), and innovation (activity, novelty, speed, and share). The results support the hypothesis that Romanian transport companies lag behind other sectors in adopting green technologies, likely due to infrastructure limitations and a lack of expertise in implementing sustainable practices.
Collaboration between policymakers, industry leaders, and researchers are critical in fostering a more sustainable and innovative future for this vital industry.
7. Conclusions
This study provides valuable insights into the existing literature by offering empirical validation of previous claims regarding the complex relationships between financial performance, proactive orientation, innovation, and ecological performance across various sectors by focusing on the Romanian context to explain how these factors influence sustainability efforts.
The analysis revealed moderate to strong positive correlations between financial performance, proactive orientation, innovation, and ecological performance. While proactive and innovation parameters have a significant impact on ecological policies, financial performance plays a more moderate, indirect role. Transport companies, despite utilizing more modern and environmentally conscious vehicles than the national average, lag behind non-transport firms in terms of ecological performance, proactive orientation, and innovation. This suggests that although the transport sector is making strides in modernizing its fleet, it still faces significant challenges in adopting comprehensive green practices compared to other industries.
Moreover, the study found that firm age does not play a critical role in determining ecological, proactive, or innovation performance, indicating that younger or older firms do not significantly differ in their commitment to sustainability. Managers’ subjective estimations of their companies’ financial health were shown to align somewhat with real financial performance, suggesting that while these perceptions reflect financial reality, they are influenced by additional factors beyond objective financial metrics. Proactive orientation was more strongly shaped by subjective financial perceptions than by actual financial data, indicating that managerial bias or expectations may play a role in shaping strategic decisions. These results underscore the critical role of financial health, managerial innovation, and proactive strategies in advancing corporate sustainability. They suggest that businesses with stable finances and innovative leadership are better positioned to address environmental challenges, contributing to long-term competitiveness and compliance with evolving market demands. The findings also provide a theoretical basis for further integrating sustainability into corporate decision-making frameworks.
However, the sample was limited to Romanian corporations, which may restrict the generalizability of the findings to other contexts. Future research could address this limitation by expanding the geographic scope or by increasing the number of companies analyzed to explore the dynamics of our variables in other countries or regions to provide a more comprehensive understanding of how contextual factors influence green policies. In addition, the impact of macroeconomic factors on sustainability performance could help to fully understand and enhance the sustainability efforts of companies. Investigating the role of industry-specific variables and longitudinal studies could also provide deeper insights into the long-term impacts of financial stability and innovation on sustainability, for instance, examining the potential barriers to the adoption of green technologies in the transport sector and exploring ways to bridge the gap between financial performance and ecological outcomes.
The relevance and significant contribution of the current research consists in the analysis of the concept and determinants of corporate sustainability entrepreneurship, which can be used in studies of other researchers. A future research direction could be the creation of a scenario regarding the future evolution of corporate sustainability entrepreneurship initiatives in the Romanian business environment.
This study highlights the pivotal role of financial stability, innovation, and proactive orientation in fostering green policies. By empirically validating these relationships, the research contributes to a deeper understanding of the drivers of corporate sustainability and provides actionable insights for both scholars and practitioners in the field.


 ,
, 
