Article

Optimizing Supply Chain Financial Strategies Based on Data Elements in the China’s Retail Industry: Towards Sustainable Development

1
School of Economics and Management, Beijing Jiaotong University, Beijing 100044, China
2
School of Information and Communication Engineering, Beijing University of Posts and Telecommunications, Beijing 100876, China
3
College of Information Engineering, Zhejiang University of Technology, Hangzhou 310023, China
4
School of Economics, Beijing Technology and Business University, Beijing 100048, China
*
Author to whom correspondence should be addressed.
Sustainability 2025, 17(5), 2207; https://doi.org/10.3390/su17052207
Submission received: 20 January 2025 / Revised: 20 February 2025 / Accepted: 20 February 2025 / Published: 3 March 2025

Abstract

:
China’s retail industry faces unique challenges in supply chain financing, particularly for small and medium-sized enterprises (SMEs) that often struggle to secure loans due to insufficient credit ratings and collateral in the business environment of China. This paper presents a groundbreaking approach that integrates real-time data elements into financing models, addressing the critical issue of information asymmetry between financial institutions and retail SMEs. By leveraging dynamic data such as orders, receivables, and project progress, our novel framework moves beyond the limitations of traditional asset-based lending, employing advanced data analytics for enhanced credit assessment and risk management. Applying the Stackelberg game theory, we explore the strategic interactions between suppliers and purchasers in the retail supply chain, identifying optimal financing strategies that improve capital flow efficiency and reduce overall costs. Our comprehensive data-driven model incorporates various scenarios, including the traditional supply chain financing model (Model T) and the innovative data-element secured financing model (Model G). The latter further considers risk assessment, risk appetite, volume, and schedule factors, providing a holistic approach to financial decision-making. Through rigorous mathematical modeling and numerical analysis, we demonstrate the effectiveness of our proposed framework in optimizing supply chain financing strategies. The results highlight the potential for data-driven approaches to unlock new financing opportunities for SMEs, fostering a more collaborative and efficient ecosystem within the retail industry. This study presents comprehensive data-driven strategies that unlock new financing opportunities for SMEs, providing a practical roadmap for stakeholders to foster a more collaborative and efficient supply chain financing ecosystem. The significance of studying supply chain finance for small and medium-sized enterprises (SMEs) lies in optimizing financing models to address the financing difficulties faced by SMEs. This helps improve their market competitiveness and promotes resource sharing and collaboration among all parties in the supply chain, thereby achieving sustainable economic development.

1. Introduction

In recent years, the state has continuously raised the importance of the security and stability of the industrial chain supply chain and elevated the development of the supply chain industry to the national strategic level on the basis of the support of many policies. For China’s retail industry, the production of retail products is characterized by a wide range of processes, a variety of production methods, and the entire retail process requires the general contractor and its subcontractors at all levels to invest a large amount of manpower, retail materials, and various types of retail machinery and equipment, and requires a large amount of financial support, which is the basis for the production and operation activities of China’s retail industry enterprises. However, in China’s retail industry enterprises, small and medium-sized enterprises account for a large proportion, and most of the small and medium-sized enterprises have limited funds of their own, often needing to obtain funds through commercial bank loans and other means. However, due to the limited credit of SMEs, it is difficult to obtain loans, or the loan interest rate is high. To address the financing problems of capital-constrained small and medium-sized enterprises in the retail supply chain, an effective solution is proposed by using data-element technology, in which the core enterprise’s good credit is transferred to the relevant retail enterprises in the entire retail supply chain in the data-element platform, to make up for the lack of credit of capital-constrained small and medium-sized enterprises in the retail supply chain, and to alleviate the actual financing problems of the retail industry enterprises. This paper puts forward a new financing model suitable for retail enterprises in light of the actual situation of the retail industry and provides new solutions for commercial banks to carry out credit services for retail enterprises. For the secondary supply chain of upstream suppliers and downstream core enterprises, different financing guarantee strategies (credit guarantee, data confirmation guarantee) are considered, and the optimal operation strategies of upstream suppliers and downstream core enterprises under different guarantee strategies are solved based on the Stackelberg game, including the strategies of determining the pricing, production volume, financing volume, etc. The optimal operation strategies of upstream suppliers and downstream core enterprises under the two models are evaluated, and the equilibrium solution results of the two models are compared to obtain the optimal operation strategy of enterprise financing.
Supply chain finance (SCF) is a central component of supply chain management, linking buyers, sellers, and financial institutions to help firms reduce financing costs, enhance efficiency, optimize capital flow, and manage risks within the supply chain through financial tools and strategies. The theoretical development of SCF has evolved from early foundational explorations to more comprehensive investigations into the integration of operations and finance, creating a robust theoretical framework and application model.
During the development of SCF theory, scholars have proposed various models to integrate operations and finance. For instance, Cai and Chen et al. incorporated third-party logistics (3PL) as financial providers into SCF models and compared these with traditional bank-led SCF models, finding that 3PL-led SCF services offer significant advantages [1]. Research on practical applications primarily focuses on specific financing strategies such as prepayment financing and trade credit. Busch and Gray posited that prepayment financing models can enhance the turnover efficiency of production enterprises’ working capital, thereby reducing financing costs [2]. Gullien et al. developed a debt model to prevent default risk and proposed relevant feasibility recommendations [3]. In the realm of trade credit, Gupta and Wang investigated optimal inventory levels for suppliers providing trade credit to retailers under conditions of random demand and time discreteness [4].
Furthermore, Hofmann et al. noted that financial institutions and core enterprises can generate greater returns through accounts receivable financing by attracting a large number of customers [5]. Wu et al., based on a non-cooperative replenishment model, explored the supplier-Stackelberg game with demand and default risks, analyzing the impact of trade credit periods on supply chain profits [6]. Yang et al. modeled the relationship between financial constraints, financing channels, and operational decisions in supply chains with financially constrained retailers and suppliers, examining how trade credit can shift demand risk [7].
In the domain of third-party logistics and financial innovation, Raghavan et al. proposed that joint decision-making in supply chains with two financially constrained entities is more beneficial than decentralized decision-making, both for the entire supply chain and external financial institutions [8]. Chen et al. integrated prepayment financing and retailer investment models into a two-stage Stackelberg model to study the impact of risk-averse manufacturers on supply chain decisions and performance [9]. Additionally, Huang et al. investigated the impact of transportation costs on supply chain decisions, finding that variable transportation cost strategies can increase total profits for retailers, third-party logistics companies, and the entire supply chain [10]. Zhao et al. developed a three-party game model, considering financing services provided by third-party e-commerce platforms, exploring the coordination mechanisms of SCF [11].
Recently, the elementarization of data has emerged as a new direction in SCF research. Zeng et al. argued that the potential value of data elements must be realized through processes such as data processing to drive the capitalization and commoditization of data [12]. Applying data elements to supply chain finance can leverage big data to enhance the reliability and adaptability of supply chain finance, thereby improving supply chain efficiency and financing security [13,14,15,16,17,18,19,20,21]. However, the data-element market system in China remains underdeveloped, and there is a research gap in leveraging data elements to empower SCF and develop new financing models. Applying data elements to SCF can leverage big data characteristics to enhance the reliability and adaptability of SCF, thereby improving supply chain efficiency and financing security.
In summary, research on supply chain finance not only covers the historical development of its theoretical foundations but also addresses practical applications and the evolving role of third-party logistics. The integration of traditional financial strategies with data-driven innovations is crucial for optimizing supply chain operations and financing, which is a key direction of our research.
In this paper, we first address the theoretical foundations and problem description in Section 2, where we explore the fundamental concepts of supply chain financing and introduce the challenges faced by the retail industry. Section 3 then focuses on the establishment of a supply chain financing model, incorporating data elements and the Stackelberg game theory to develop a robust framework. This chapter details the model’s formulation, assumptions, and solution methodology. Section 4 provides a numerical analysis of the proposed model, using real-world data to test and validate its effectiveness and applicability. Finally, Section 5 offers a conclusion, summarizing the key findings and discussing the implications of the model, along with recommendations for future research and practical applications.

2. Problem Formulation

2.1. Problem Description

The retail industry is often characterized by a unique set of challenges, predominantly the frequent capital shortages faced by retail companies. These shortages stem from the complexity of cost control during the retail process. The situation is exacerbated by the common practice of companies leveraging their position to demand advance payments from suppliers, leading to a paradox where suppliers amass substantial receivable accounts but find themselves with insufficient liquidity. This predicament is further complicated by the reluctance of financial institutions to approve loans for SME suppliers, citing their insufficient credit ratings as the primary concern.
Small and medium-sized enterprises (SMEs) in the retail industry are typically characterized by flexibility and a strong ability to adapt to market conditions. However, they also face a range of unique challenges. First, SMEs in the retail sector are often smaller in scale and have limited resources, which results in relatively weak investments in areas such as finance, technology, and human capital. This limitation makes it difficult for them to gain a competitive edge in an intensely competitive market. Second, supply chain management in retail enterprises is often complex, particularly when dealing with multiple suppliers and distributors, which increases management difficulty. Additionally, inventory management and logistics costs require more refined control.
Moreover, SMEs frequently experience capital shortages, which directly affect their daily operations and growth potential. Retail SMEs typically rely on short-term financing to maintain operations and meet procurement needs. However, due to their lower credit ratings, financial institutions are often unwilling to extend loans, preventing these enterprises from accessing low-cost financing options. On the other hand, given the short product life cycles and rapidly changing market demands, SMEs need to possess quick responsiveness. However, financial and resource constraints often hinder this flexibility.
Despite these challenges, retail SMEs often compensate for financial limitations through innovative business models and personalized customer services. They tend to focus more on local market demands and niche market development, enhancing their competitiveness through flexible operations and targeted marketing strategies. In terms of technology application, although SMEs are typically late adopters, they have increasingly recognized the importance of data and digitalization. By leveraging new technological tools, they are improving management practices, optimizing supply chain efficiency, and providing more convenient shopping experiences for customers.
Otherwise, the financing difficulties faced by small and medium-sized enterprises (SMEs) not only affect the stability of supply chains but may also exacerbate social inequality and environmental risks [22,23,24,25,26,27]. By leveraging data elements to reduce information asymmetry, the equitable distribution of financial resources can be promoted, minimizing resource waste and project delays caused by disruptions in the capital chain, thereby supporting the United Nations Sustainable Development Goals (SDG 8 and SDG 9). The model presented in this paper provides a new perspective in the sustainable finance literature—empowering inclusive growth through technology.
Addressing this complex issue, this paper introduces a novel approach that integrates data-element technology into the supply chain financing model. This integration is proposed to bridge the information asymmetry gap between banks and enterprises, potentially reducing the cost of supply chain financing loans. The innovative model is particularly pertinent given the traditional reliance on credit guarantees from retail companies as the primary means for suppliers to secure funding from financial entities.
As shown in Figure 1, the operational flowchart further delineates six primary processes, beginning with the announcement of procurement information by core enterprises and culminating in the disbursement by banks and core enterprises. This structured approach not only ensures transparency and efficiency in supply chain financing process but also underscores the significance of optimizing capital flow in the retail industry, where it is crucial for the successful execution of projects.
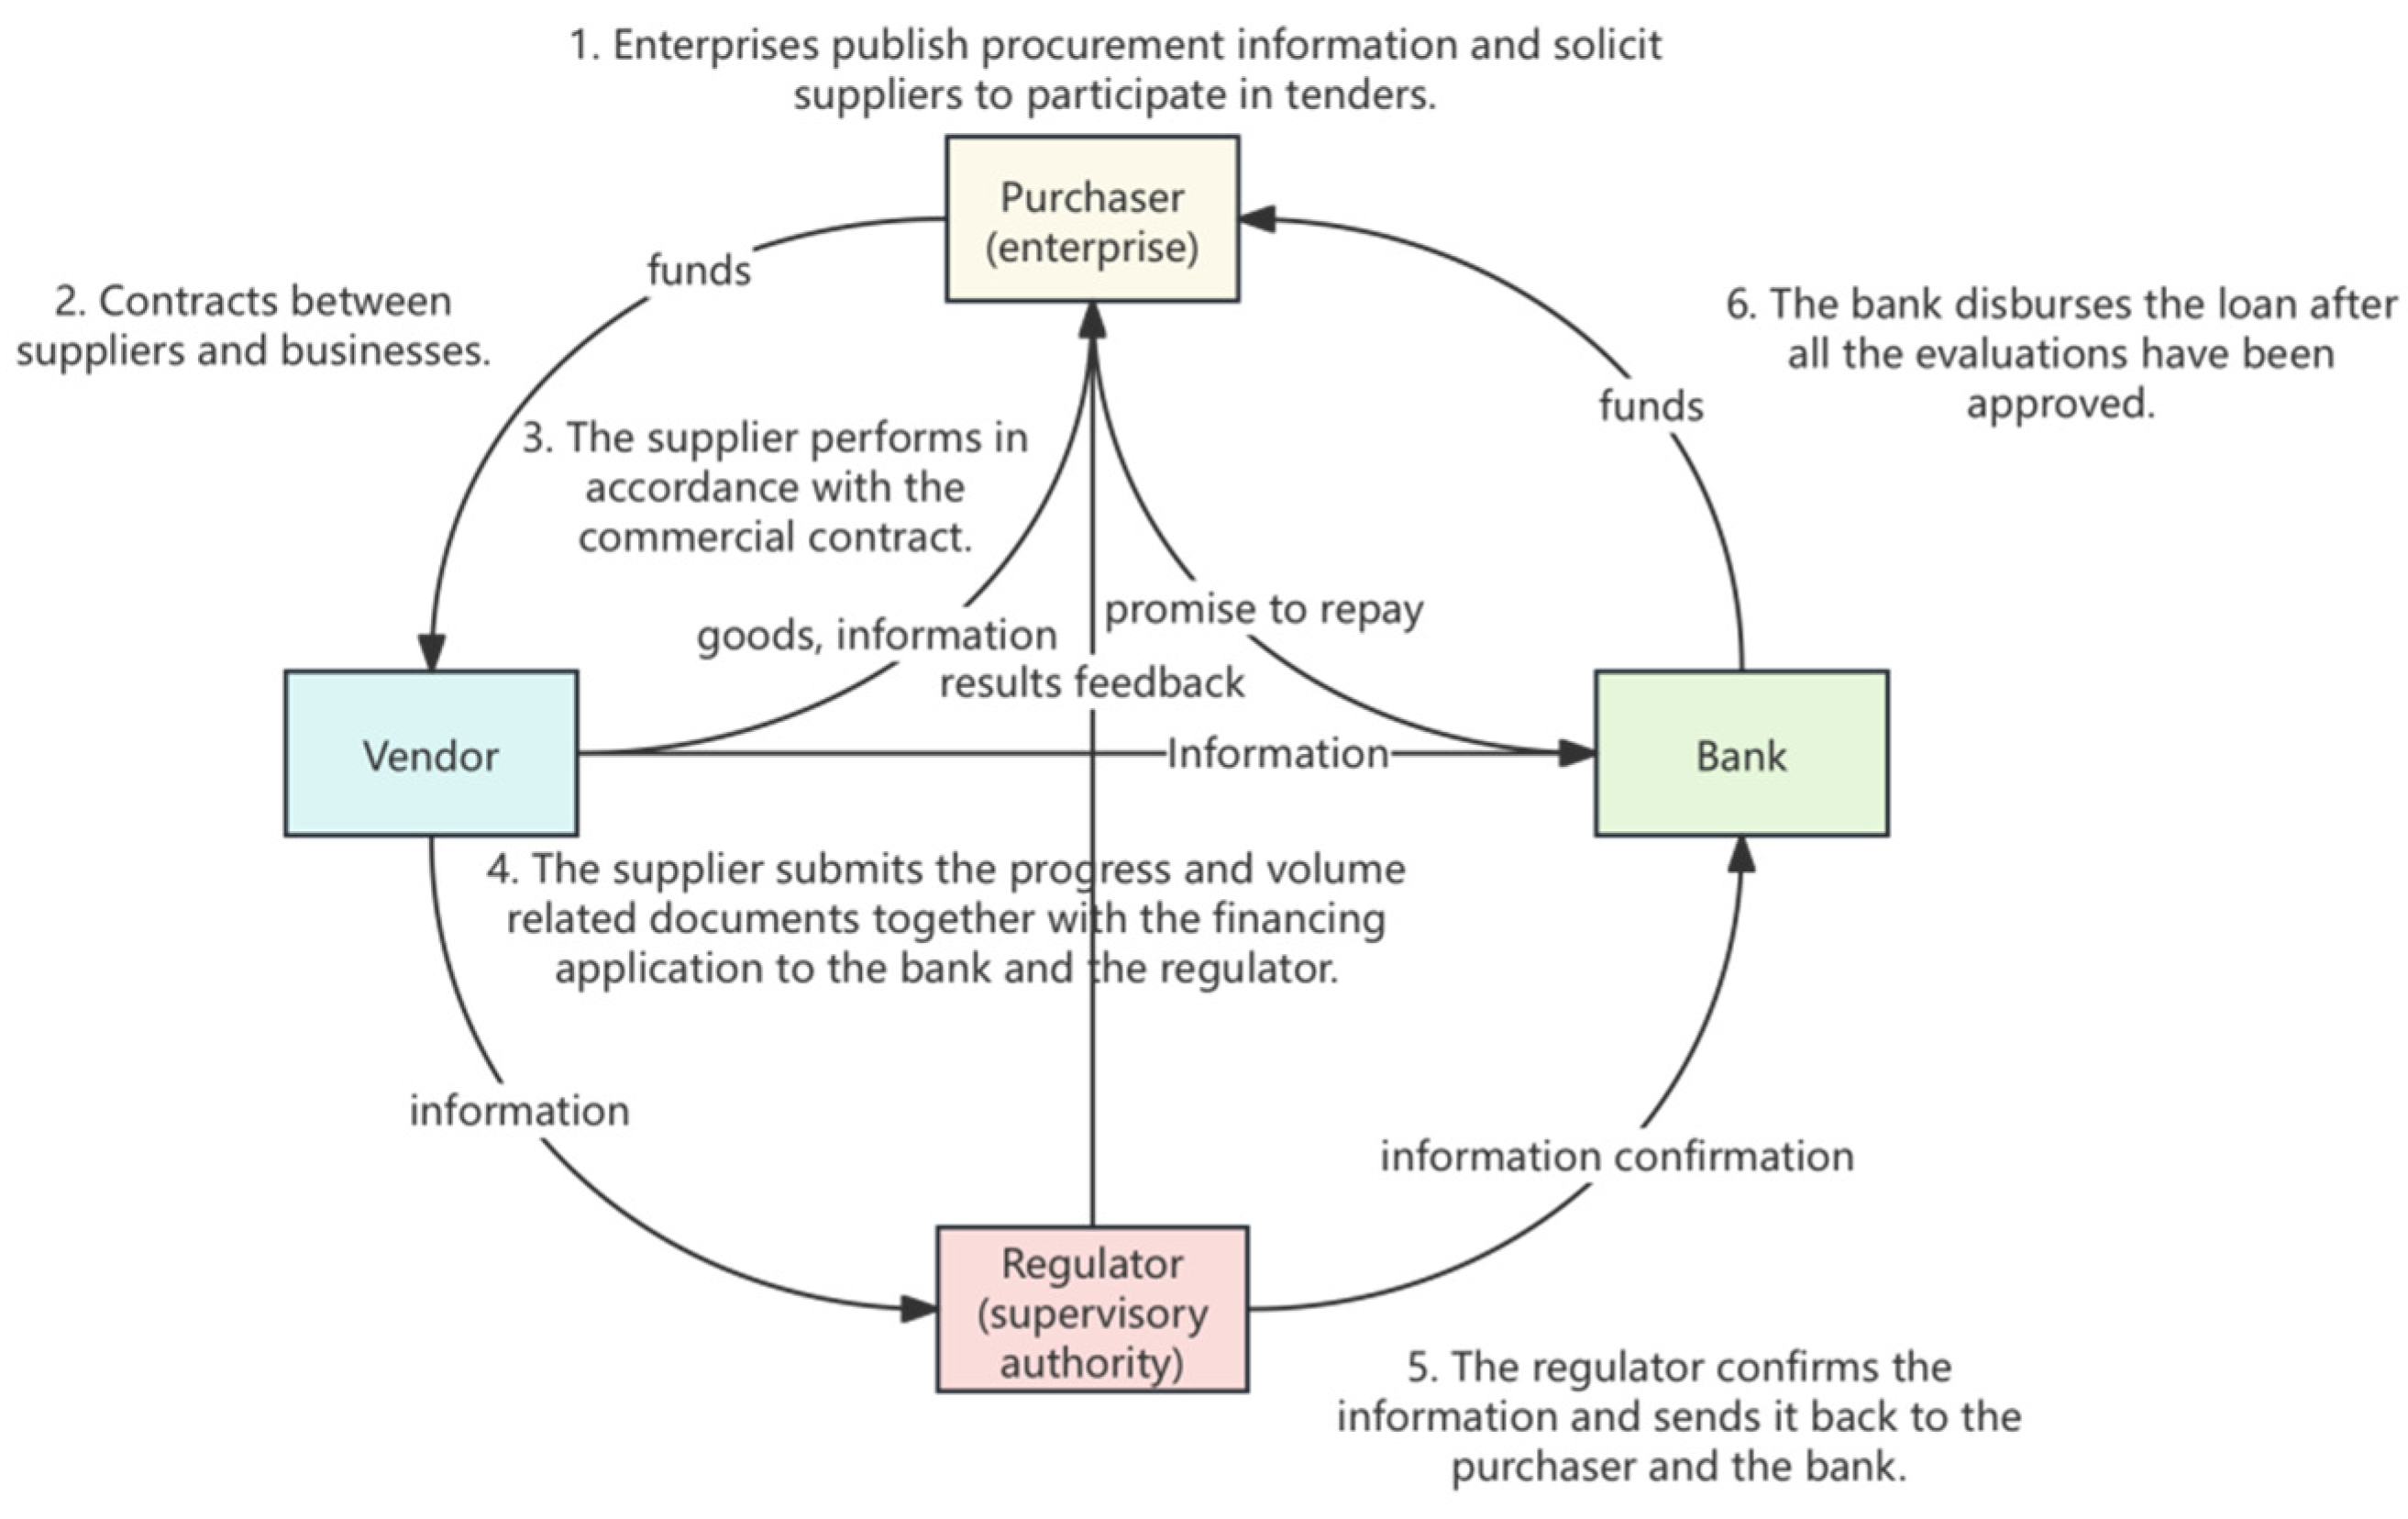
  • Core Enterprises Announce Procurement Information: Upon project requirement determination, core enterprises disseminate comprehensive procurement details, including retail plans, necessary equipment and materials, and project timelines. A bidding date is set, allowing supply chain enterprises to understand their needs and prepare their bids. Enterprises submit detailed proposals based on the information published by the core enterprise, encompassing company profiles, experience with similar projects, implementation plans, cost and pricing quotations, and operational information. During this phase, regulatory bodies verify the authenticity of the information, conducting credit checks, performance reviews, and pricing audits on the bidding enterprises. Only enterprises confirmed to be authentic and compliant by the regulatory bodies proceed to the next bidding stage.
  • Contract Signing: After bid evaluation, core enterprises select the supply chain enterprise best meeting the project needs and sign a contract detailing project requirements, schedules, payment methods, and responsibilities.
  • Supplier Contract Fulfillment: Suppliers commence the project plan implementation as per contract stipulations, submitting retail progress and product lists to the regulatory body at specific milestones.
  • Supplier Progress Feedback: Suppliers submit progress and workload-related vouchers along with financing applications to banks and regulatory bodies. Upon receipt and verification of this information, the regulatory body provides feedback to the core enterprise.
  • Regulatory Body Information Submission to Banks: Post-verification, the regulatory body forwards performance reports and audit findings to banks, encompassing compliance checks, project progress, and financial details.
  • Bank and Core Enterprise Disbursement: Upon confirmation of the information, the bank verifies and disburses funds directly to suppliers in accordance with the contract and performance. Suppliers then deliver goods as per the contract and project progress. Upon project completion, the core enterprise makes the final payment to the bank, concluding the cooperation process.
This entire process is conducted under stringent supervision and verification, ensuring compliance and reducing supply chain financial risks while facilitating smooth project progress. Overall, this supply chain financing model leverages the strengths of all participants, optimizing and efficiently operating each link in the supply chain, offering an enterprise a cooperation model that meets market demands and modern management standards.
To elucidate the proposed model’s application, the paper constructs and analyzes two distinct perspectives: the traditional credit guarantee supply chain financing model and the innovative data-element guarantee financing model. The supply chain under consideration is composed of upstream suppliers and downstream purchasers, or core enterprises. In this dynamic, suppliers offer products to purchasers at a wholesale price w that accounts for the production cost c , with the purchasers ordering a specific quantity Q .

2.2. Meaning of Data-Element Warranties

The data element guarantees that by digitizing and making visible the operations and behaviors among supply chain enterprises, authorized and demanding users can access exactly the information they need, even at the lowest level of the business. This approach provides an objective, realistic, and comprehensive picture of the logistics, business, information, and financial flows in supply chain operations. Through the mapping of raw business and behavioral data as well as further data processing and mining, the problem of information asymmetry between business entities can be attenuated. In addition, based on the accurate portrait of the actual operating ability, profitability, development ability, and debt repayment ability of each business entity, financial institutions can make financial lending decisions based on this information. This data-element guarantee makes the information in the supply chain have the characteristics of real-time data, transparency, relevance, and traceability.
In supply chain financing, the management of credit and risk is the core. The financial end determines the price of financing products based on the trust level of the enterprise. Through the establishment of a data platform, the information symmetry, mutual synergy, risk control, and efficiency enhancement of the financial side to the industrial side are achieved, so as to realize the optimal pricing of financing products and guarantee the maximization of the overall value of each participating subject in supply chain financing. Therefore, the data-element guarantee is realized by collecting corresponding information and obtaining risk ratings according to the determined data-element types, and banks and other financial institutions will decide corresponding loan interest rates according to the credit ratings, thus enabling suppliers and purchasers to reformulate the optimal decision-making in order to obtain the highest profits.

2.3. Problem Solving Methods (Stackelberg Game)

In the Stackelberg game, participants are divided into two roles: leader and follower. The leader chooses a strategy before the followers make a decision, while the followers react to the leader’s choice. This sequential decision-making process reflects the power and information asymmetry in many scenarios in reality.
In the retail industry supply chain financing problem, retail firms can be regarded as leaders and suppliers as followers. When faced with supply chain financing decisions, retail firms can prioritize their most advantageous financing options, such as using their credit guarantees to obtain funds. Based on the retail company’s decision, the supplier will make a reactive decision, such as whether to accept the financing conditions proposed by the retail company, or whether to seek other financing channels.
The application of the Stackelberg game approach to supply chain financing decisions in the retail industry is reasonable. Firstly, the leader–follower structure is applicable to financing decisions in the retail industry supply chain. As the core role in the supply chain, retail enterprises have more information and resources. Therefore, considering retail firms as leaders and suppliers as followers can better reflect the power distribution and decision-making sequence in reality. Secondly, the decision-making of retail firms and suppliers is sequential, with retail firms making the choice of financing strategy first and suppliers responding accordingly. This sequential decision-making process is consistent with the way the parties in the retail supply chain interact in reality. Finally, the Stackelberg game framework can help retail companies and suppliers to analyze each other’s optimal response strategies and adjust their own strategies accordingly, so as to maximize their own interests. In summary, the Stackelberg game method has a certain theoretical basis and application feasibility in solving the retail industry supply chain financing decision-making problem, which can help the participants to formulate reasonable financing strategies, optimize the efficiency of the supply chain, and achieve a win-win situation.

3. Establishment of Supply Chain Financing Model for Retail Industry Based on Data Elements and Stackelberg Game

In this chapter, we establish a supply chain financing model for the retail industry using data elements and the Stackelberg game theory. We began by defining key descriptions and notations to clearly outline the framework and variables involved. Next, we articulate the model assumptions, which provides a foundation for understanding the contextual and operational constraints. Finally, we detail the process of modeling and solving the problem, leveraging data-driven insights to enhance financial strategies and decision-making within the retail supply chain. The scenarios we consider include the traditional supply chain financing model (Model T) and the data-element secured financing model (Model G). In model G, the basic model is considered with the addition of the model of risk assessment value and risk appetite and the model with the addition of volume and schedule. This comprehensive approach aims to optimize financial flow and risk management, ultimately contributing to a more efficient and resilient industry.

3.1. Descriptions and Notations

The descriptions and notations in this paper are shown in the Table 1 below.

3.2. Model Assumptions

In order to make the model closer to the real situation, the assumptions used in this paper are as follows.
  • Information symmetry: All supply chain participants have access to the same data elements. This assumption of information symmetry is critical for the effective implementation of data-driven financing strategies and the mitigation of potential risks arising from information asymmetry.
  • Rational decision-making: Parties involved aim to maximize their respective profits. This assumption allows for the application of game-theoretic approaches, such as the Stackelberg game, to model and analyze the strategic interactions among the participants.

3.3. Modelling

3.3.1. Traditional Supply Chain Financing Model (T-Model)

In the traditional credit-guaranteed supply chain financing model, the purchaser applies for financing from the bank due to capital constraints, and the loan interest rate is determined. Both suppliers and purchasers (core firms) seek to maximize their benefits, and their profit functions are as follows, respectively:
π s t = w c Q
π p t = p w Q w Q B r = p w w r Q + B r
Assuming that order quantity and price are inversely proportional, substituting Q = a b p into the above equation gives the following:
π p t = p w w r Q + B r = p w w r ( a b p ) + B r
It can be shown that π p t is a concave function with respect to p . The p -partial derivative can be found with respect to π p t :
d π p t d p = a b p + p w w r × b = 0
So, it can be concluded that making π p t the largest p * = a + w b ( 1 + r ) 2 b .
By substituting Q = a b p , the optimal order quantity for the purchaser can be obtained as follows:
Q * = a w b ( 1 + r ) 2 b
Substituting gives the supplier’s profit as follows:
π s t = w c Q = [ a w b 1 + r ] ( w c ) 2 b
Similarly, it can be shown that π s t is a concave function with respect to w . The partial derivative can be found with respect to w for π s t .
d π s t d w = b 1 + r w c + a w b ( 1 + r ) 2 b = 0
So, it can be derived such that π s t is maximized: w * = a + b c ( 1 + r ) 2 b ( 1 + r ) .
Substituting the original profit expression, the optimal profit for the supplier and the buyer can be obtained as follows:
π s t = [ a b c 1 + r ] 2 8 b 2 ( 1 + r )
π p t = [ a b c 1 + r ] 2 16 b 2 + B r

3.3.2. Data-Element Secured Financing Model (Model G)

  • Basic model
Uncertainty demand is first considered, and the relationship between the core firm’s material demand and its actual ordering as a means of updating the profit functions of the core firm and the supplier is considered next.
The core firm’s expected material usage is determined by a combination of product purchases and the level of engineered material demand.
When x q , then the following is obtained:
s q = x
When x > q , then the following is obtained:
s q = Q
The material use of the core business is thus given as follows:
s q = E min x , Q = 0 + f x min x , Q d x = 0 Q y + f x d y d x
s q = Q 0 Q F ( x ) d x
The amount of material expected to be out of stock in the core business is as follows:
L q = Q + x Q f x d x = 0 + x Q f x d x 0 Q x Q f x d x
L q = E x Q + 0 Q Q x f x d x = E x Q + 0 Q f ( x ) ( x Q 1 d y ) d x
L q = E x Q + 0 Q 0 y f ( x ) d x d y = E x Q + 0 Q F x F ( 0 ) d x
L q = E x 0 Q 1 d x + 0 Q F x d x = E x s ( Q )
The material expectation residuals for core businesses is as follows:
I q = 0 Q Q x f x d x = Q Q f ( x ) ( x Q 1 d y ) d x = 0 Q 0 y f ( x ) d x d y
I q = 0 Q F ( x ) d x = Q s ( q )
The profit of the core firm consists of sales revenue, residual income, product cost, out-of-stock loss, and loan interest; so, the expected profit function of the core firm is as follows:
π p g = p s q + v I q w Q c u L q ( w Q B ) r = p s q + v Q v s q w Q c u ( E x s ( q ) ) ( w Q B ) r
π p g = p v + c u s q + ( v w w r ) Q c u E ( x ) + B r
The supplier’s profit, on the other hand, consists only of sales revenue and material costs; so, the supplier’s expected profit function is as follows:
π s g = w c Q
The data elements contain a number of indicators of the main business and other indicators. Five of these representative indicators are selected to build the evaluation model, including return on net assets, profitability of the main business, interest coverage multiples, sales growth rate, and accounts receivable turnover rate, respectively.
The importance of each indicator in the evaluation system is set as η i ( i represents the indicator), and the values of all indicators are normalized to obtain the score value of the indicator δ i ; at this time, the enterprise corresponding to the data-element score value is as follows:
s = i = 1 5 η i δ i
Banks can therefore decide on different lending rates based on the combined scores of the data elements representing the financing capacity of the firms measured, which in turn influences the financing decisions along the entire supply chain. This is based on the data elements to obtain their score s . A higher s score indicates lower risk and s is incorporated into the establishment of the financing model. It can be assumed that the effect of s on the bank rate r is r = r 0 β s ,     β > 0 .
Then, the profit of suppliers and purchasers (core firms) is as follows:
π p g = p v + c u s q + ( v w w r ) Q c u E ( x ) + B ( r 0 β s )
Starting from the profit function of the supplier and the purchaser, the supplier’s profit function is as follows:
π s g = w c Q
The profit function of the purchaser is as follows:
π p g = p v + c u s q + ( v w w r ) Q c u E ( x ) + B ( r 0 β s )
Substituting s q , the purchaser’s profit function becomes the following:
π p g = p v + c u ( Q 0 Q F ( x ) d x ) + ( v w w r ) Q c u E ( x ) + B ( r 0 β s )
Q is derived as follows:
d π p g d Q = p v + c u ( 1 F ( Q ) ) + ( v w w r ) = 0
Thus, the following is obtained:
Q * = F 1 ( 1 v w ( r + 1 ) p v c u )
Substituting the above expression into π s g = ( w c ) Q gives the following:
π s g = ( w c ) F 1 ( 1 v w ( r + 1 ) p v c u )
d π s g d w = 0
It can be seen that the value of w is difficult to derive; therefore, we assume that the demand distribution function is uniform and follows [ a m p , b m p ] .
At this point, we obtain the following:
Q * = ( b a ) ( 1 v w ( r + 1 ) p v c u ) + ( a m p )
π s g = ( w c ) [ ( b a ) ( 1 v w w r p v c u ) + ( a m p ) ]
d π s g d w = ( b a ) ( 1 v w w r p v c u ) + ( a m p ) + ( w c ) ( b a ) 1 + r p v c u = 0
w * = ( m p a 1 ) ( p v c u ) 2 ( 1 + r ) + c 2
Substituting r = r 0 β s gives the following:
Q * = F 1 ( 1 v w ( r + 1 ) p v c u ) = F 1 ( 1 v w ( r 0 β s + 1 ) p v c u )
When the demand distribution function is uniform and follows [ a m p , b m p ] , the following is obtained:
Q * = ( b a ) ( 1 v w ( r 0 β s + 1 ) p v c u ) + ( a m p )
w * = ( m p a 1 ) ( p v c u ) 2 ( 1 + r 0 β s ) + c 2
2.
Consideration of risk assessment value and risk appetite
Since purchasers and suppliers face financial constraints and are more sensitive to market risk performance, this paper assumes that purchasers and suppliers are risk-averse and well-capitalized banks are risk-neutral. k i denotes the risk attitude of decision-makers in the supply chain, and a higher k i indicates that firm i is more risk-averse and closer to a risk-averse firm. Since the risk attitude does not involve actual profit changes, we choose to use utility function representation here. That is to say, risk will make the decision-maker’s perceived utility decrease, while profit does not change.
Then, the profit of the supplier and the purchaser (the core business) remains the same:
π s g = w c Q
π p g = p v + c u s q + ( v w w r ) Q c u E ( x ) + B ( r 0 β s )
Meanwhile, the utility functions of suppliers and purchasers (core firms) are as follows:
U s g = w c Q k s d
U p g = p v + c u s q + ( v w w r ) Q c u E ( x ) + B ( r 0 β s ) k p d
According to the study, it can be obtained that the financing risk d is not only related to some indicators of the retail enterprise such as the return on net assets and profitability of the main business, but also related to the amount of money that the enterprise wants to finance. And as the amount of financing of the enterprise increases, we believe that the financing risk perception will also increase. It is assumed that on the basis of the assessed financing risk that does not involve the amount of financing, the financing risk d that considers the amount of financing shows a positive correlation with the amount of financing, and d = d 0 + λ ( Q w B ) , d 0 is the baseline financing risk that does not involve the amount of financing.
Thus, the following can be obtained:
U s g = w c Q k s [ d 0 + λ ( Q w B ) ]
U p g = p v + c u s q + ( v w w r ) Q c u E ( x ) + B ( r 0 β s ) k p [ d 0 + λ ( Q w B ) ]
Substituting s q , the purchaser’s utility function becomes as follows:
U p g = p v + c u ( Q 0 Q F ( x ) d x ) + ( v w w r ) Q c u E ( x ) + B ( r 0 β s ) k p [ d 0 + λ ( Q w B ) ]
Q is derived as follows:
d U p g d Q = p v + c u ( 1 F ( Q ) ) + ( v w w r ) k p λ w = 0
Thus, the following is obtained:
Q * = F 1 ( 1 v w ( r + 1 + k p λ ) p v + c u )
Substituting the above expression into U s g = w c Q k s d gives the following:
U s g = ( w c ) F 1 ( 1 v w ( r + 1 ) p v + c u ) k s [ d 0 + λ ( Q w B ) ]
d U s g d w = 0
It can be seen that the value of w is difficult to derive; so, we again assume that the demand distribution function is uniform and follows [ a m p , b m p ] .
Thus, the following is obtained:
Q * = ( b a ) ( 1 + v w ( r + 1 + k p λ ) p v + c u ) + ( a m p )
U s g = ( w c ) [ ( b a ) ( 1 + v w ( r + 1 + k p λ ) p v + c u ) + ( a m p ) ] k s [ d 0 + λ ( Q w B ) ]
d U s g d w = ( b a ) ( 1 + v w ( r + 1 + k p λ ) p v + c u ) + ( a m p ) + ( w c ) ( b a ) r + 1 + k p λ p v + c u k s λ Q = 0
w * = b m p k s λ Q p v + c u 2 r + 1 + k p λ b a + v 2 r + 1 + k p λ + c 2
Substituting r = r 0 β s gives the following:
Q * = F 1 ( 1 v w ( r 0 β s + 1 + k p λ ) p v + c u )
When the demand distribution function is uniform and obeys [ a m p , b m p ] , the following is obtained:
Q * = ( b a ) ( 1 v w ( r 0 β s + 1 + k p λ ) p v + c u ) + ( a m p )
w * = b m p k s λ Q p v + c u 2 r 0 β s + 1 + k p λ b a + v 2 r 0 β s + 1 + k p λ + c 2
3.
Considering the supplier delivery level
Continuing from Model 2 and incorporating the supplier’s delivery level, referred to as the pass rate or qualification rate, we can model the interaction as follows. It is assumed that the supplier completes orders at a certain delivery level, and the supplier can increase the product qualification rate by exerting effort, such as improving the production process. Let us define the delivery level as e 0 ,   1 , where the effort cost for the supplier to achieve the delivery level e is h e 2 . The supplier effort cost factor h reflects the operational efficiency of the supplier; a lower cost factor h indicates that a lower effort cost is required to achieve the same delivery level.
π s g = w c e Q h e 2
π p g = p v + c u s q + v w w r e Q c u E x + B r 0 β s
Simultaneously, the utility functions for the supplier and the purchaser (core enterprise) are as follows:
U s g = w c e Q h e 2 k s d = w c e Q h e 2 k s d 0 + λ Q w B
U p g = p v + c u s q + v w w r e Q c u E x + B r 0 β s k p d 0 + λ Q w B
Following the same solution approach as previously described, substituting s q into the equation, the purchaser’s utility function becomes the following:
U p g = p v + c u Q 0 Q F x d x + v w w r e Q c u E x + B r 0 β s k p d 0 + λ Q w B
d U p g d Q = p v + c u 1 F Q + v w w r e k p λ w = 0
Therefore, the following is obtained:
Q * = F 1 1 + v e w r e + e + k p λ p v + c u
Substituting the above expression into U s g = w c e Q h e 2 k s d , we can obtain the following:
U s g = w c e F 1 1 + v e w r e + e + k p λ p v + c u h e 2 k s d = w c e F 1 1 + v e w r e + e + k p λ p v + c u h e 2 k s d 0 + λ Q w B
d U s g d w = 0
Determining the value of w is challenging. Therefore, we similarly assume that the demand distribution function is uniform and follows a m p , b m p :
Q * = b a 1 + v e w r e + e + k p λ p v + c u + a m p
U s g = w c e b a 1 + v e w r e + e + k p λ p v + c u + a m p h e 2 k s d 0 + λ Q w B
d U s g d w = e b a 1 + v e w r e + e + k p λ p v + c u + a m p e w c b a r e + e + k p λ p v + c u = 0
w * = b m p k s λ Q p v + c u 2 r e + e + k p λ b a + v e 2 r e + e + k p λ + c 2
Substituting r = r 0 β s into the equation, we obtain the following:
Q * = F 1 1 + v e w r 0 β s + 1 e + k p λ p v + c u
When the demand distribution function is uniform and follows the interval a m p , b m p , we obtain the following:
Q * = b a 1 + v e w r 0 β s + 1 e + k p λ p v + c u + a m p
w * = b m p k s λ Q p v + c u 2 r 0 β s + 1 e + k p λ b a + v e 2 r 0 β s + 1 e + k p λ + c 2
4.
A multi-stage financing model considering the transience of the supply chain
The transient nature of the supply chain is characterized by rapid fluctuations in the financial needs of core enterprises at various stages of the supply chain, as well as uncertainties in material requirements. This characteristic presents new challenges to traditional financing models. Ignoring the dynamic nature of the supply chain can lead to the inefficient matching of capital supply and demand, thereby increasing a company’s financial risk. Therefore, based on Model 3, a multi-stage financing model that considers transience is proposed. The model introduces time series variables to capture the dynamic changes in the capital and material needs of the supply chain, optimizing financing decisions at each stage.
Affected by the time series variables, and considering the differing financial and material needs at each decision stage, it is assumed that the material requirements, initial capital, supplier delivery levels, and data elements affecting bank interest rates vary across stages. The utility functions for the supplier and the purchaser (core enterprise) can be expressed as follows:
U s g t = w t c e t Q t h e t 2 k s d t = w t c e t Q t h e t 2 k s d 0 + λ Q t w t B t
U p g t = p v + c u s q t + v w t w t r e t Q t c u E x t + B t r 0 β s t k p d 0 + λ Q t w t B t
Following the same solution approach as previously described, the following is obtained:
U p g t = p v + c u Q t 0 Q t F t x t d x t + v w t w t r e t Q t c u E x t + B t r 0 β s t k p d 0 + λ Q t w t B t
d U p g t d Q t = p v + c u 1 F t Q t + v w t w t r e t k p λ w t = 0
The solution obtained is as follows:
Q t * = F t 1 1 + v e t w t r e t + e t + k p λ p v + c u
Substituting the above expression into U s g t = w t c e t Q t h e t 2 k s d t , we can obtain the following:
U s g t = w t c e t F t 1 1 + v e t w t r e t + e t + k p λ p v + c u h e t 2 k s d t = w t c e t F t 1 1 + v e t w t r e t + e t + k p λ p v + c u h e t 2 k s d 0 + λ Q t w t B t
d U s g t d w t = 0
Q t * = b t a t 1 + v e t w t r e t + e t + k p λ p v + c u + a t m p
U s g t = w t c e t b t a t 1 + v e t w t r e t + e t + k p λ p v + c u + a t m p h e 2 k s d 0 + λ Q t w t B t
d U s g t d w t = e t b t a t 1 + v e t w t r e t + e t + k p λ p v + c u + a t m p e t w t c b t a t r e t + e t + k p λ p v + c u
Setting d U s g t d w t = 0 and solving for w t we can obtain the following:
w t * = b t m p k s λ Q t p v + c u 2 r e t + e t + k p λ b t a t + v e t 2 r e t + e t + k p λ + c 2
Substituting r = r 0 β s t into the equation, we can obtain the following:
Q t * = b t a t 1 + v e t w t [ ( r 0 β s t + 1 ) e t + k p λ ] p v + c u + a t m p
w t * = b t m p k s λ Q t p v + c u 2 [ ( r 0 β s t + 1 ) e t + k p λ ] b t a t + v e t 2 [ ( r 0 β s t + 1 ) e t + k p λ ] + c 2
This model extends the single-stage financing decision to a multi-stage financing approach, which can more accurately reflect the dynamic changes in material demand and other factors within the supply chain. By introducing time series variables, decision parameters such as the distribution of material demand can be dynamically adjusted according to actual circumstances, optimizing financing decisions at each decision stage. This multi-stage financing model can more precisely adapt to the transient changes at various links in the supply chain, further enhancing the efficiency of matching capital supply and demand and improving the financial security of the enterprise.

4. Numerical Analysis of Retail Industry Supply Chain Financing Model Based on Data Elements and Stackelberg Game

Due to the complexity of the optimal solutions obtained, which are not easily analyzed intuitively, this section will conduct a numerical case study. Without the loss of generality, taking the multi-stage financing model that considers the transience of the supply chain as an example, the equilibrium solutions for the optimal profits of both suppliers and purchasers have already been derived. Therefore, a numerical analysis will be performed on these two equilibrium solutions. As indicated by the above model, the financing strategy of the core enterprise and the manufacturer’s optimal equilibrium profit are mainly influenced by various data elements of the supply chain, the supplier’s delivery level, bank interest rates, market demand, and other factors.
In the context of actual supply chain coordination, when the supplier’s delivery level decreases, the bank interest rate will be appropriately increased to ensure the stability of supply chain financing. Therefore, an analysis of the supplier’s delivery level and bank interest rates over time will be conducted. The analysis will be carried out over five decision stages ( t = 1 ,   2 ,   3 ,   4 ,   5 ) . A wholesale price w = 5 , a product salvage value v = 3 , and a demand range   b = 1000 , a = 10 are assumed; an initial function related to the supplier’s delivery level e and the bank interest rate is set, which varies with t. The function for e is set to increase over time t, while the function for the bank interest rate r is set to decrease over t . The following diagram illustrates the quantitative analysis results that can be obtained.
In Figure 2, the blue curve represents the procurement quantity that remains at the initial predicted decision level across multiple decision stages, assuming no change over time. The orange curve, on the other hand, represents the optimal procurement quantity, considering the transience of the supply chain, that is, during the actual production and delivery process, with measures to strengthen supervision over suppliers. When the delivery level increases or decreases, the corresponding bank interest rate decreases or increases, respectively. When the delivery level increases and the bank interest rate decreases, the optimal procurement quantity increases. As shown in Figure 3, when the delivery level improves over time and the bank interest rate is correspondingly reduced, the wholesale price also decreases.

5. Conclusions

In today’s retail industry supply chain management, the financing problem is still an important bottleneck restricting the development of small and medium-sized enterprises (SMEs). Based on the theoretical framework of data elements and Stackelberg game, this paper puts forward some financing strategy suggestions for the retail industry supply chain.
According to the research in this paper, a new supply chain financing model for the retail industry is proposed by introducing data elements and Stackelberg game theory. This study shows that data-element technology has significant advantages in solving the information asymmetry between banks and enterprises, reducing the supply chain financing cost and improving the supply chain efficiency. Meanwhile, the Stackelberg game model can effectively optimize the operational decisions of suppliers and core enterprises and maximize the interests of all parties. The data elements can significantly improve the transparency of supply chain information, enhance the ability of financial institutions to assess the credit of enterprises, and reduce the risk and cost of financing. The Stackelberg game model can optimize the pricing and production decisions of each link in the supply chain and improve the overall efficiency and coordination of the supply chain, achieving sustainability in the supply chain.
This paper presents some innovative research perspectives and results in the research process. Firstly, data-element technology is introduced. This study applies data-element technology to supply chain financing in the retail industry for the first time, which solves the information asymmetry problem in the traditional financing model and improves the financing efficiency and transparency. Second, Stackelberg game theory is applied. The game relationship between core enterprises and suppliers in the supply chain is deeply analyzed using Stackelberg game theory, and the theoretical basis and practical application scheme for optimizing the financing strategy are proposed.
In order to improve the transparency and traceability of supply chain information, constructing a comprehensive data-element platform is proposed, which can provide comprehensive and real-time information and improve the coordination efficiency of each link in the supply chain. By using the Stackelberg game model, the pricing and production decisions of suppliers and core enterprises can be optimized to maximize the interests of all parties, thus improving the overall efficiency of the supply chain. For example, in a specific case, a game model can be designed with the buyer (core enterprise) as the leader, so that the upstream and downstream enterprises can obtain a reasonable profit distribution through optimized decision-making. At the same time, data-element technology can enhance the credit rating of SMEs through the credit transmission of core enterprises and improve the overall credit level of the entire supply chain. In this way, SMEs can obtain lower financing costs in supply chain financing. Specifically, a credit scoring system based on data elements can be developed to provide financial institutions with a more accurate basis for credit assessment through the real-time updating of data on the operating conditions of enterprises. A sound risk assessment and control system is also established through the data-element platform. The dynamic monitoring and real-time risk rating of the operating conditions of enterprises in the supply chain are achieved, ensuring timely detection and response to potential risks.
Differentiated financing strategies can also be developed based on the Stackelberg game model, providing personalized financing solutions for enterprises with different credit ratings and financing needs. For example, for core enterprises with high creditworthiness, low-cost funds can be obtained through direct financing channels, while for SMEs with low creditworthiness, loan interest rates can be appropriately increased.
In future research, more complex practical situations, such as capacity constraints, inventory costs, market fluctuations, and other factors, can be considered to further improve the Stackelberg game model and make it closer to practical applications. For example, the real-time dynamics of the model can be considered to achieve rapid responses and decision-making adjustments to real-time data in the supply chain.

Author Contributions

Conceptualization, H.Z. and W.J.; methodology, H.Z. and W.J.; software, H.Z. and X.C.; validation, H.Z., W.J., J.M. and X.C.; formal analysis, H.Z.; writing—original draft preparation, H.Z., W.J., J.M. and X.C.; writing—review and editing, H.Z.; visualization, H.Z.; supervision, H.Z.; project administration, H.Z.; funding acquisition, W.J. All authors have read and agreed to the published version of the manuscript.

Funding

This research was funded in part by the National Natural Science Foundation of China under Grants 62401070; in part by National Social Science Foundation Youth Program under Grant 24CTJ011; and in part by Zhejiang Provincial Natural Science Foundation of China under Grant No. LQ24F030023.

Institutional Review Board Statement

Not applicable.

Informed Consent Statement

Not applicable.

Data Availability Statement

Dataset available on request from the authors.

Conflicts of Interest

The author declares no conflicts of interest.

References

  1. Cai, X.; Chen, J.; Xiao, Y.; Xu, X. Fresh-product supply chain management with logistics outsourcing. Omega 2013, 41, 752–765. [Google Scholar] [CrossRef]
  2. Busch, L.; Gray, D. Supply chain finance: The next big opportunity. Supply Chain. Manag. Rev. 2014, 12, 57–60. [Google Scholar]
  3. Gullien, G.; Badell, M.; Puigjaner, L. A holistic frame work for short-term supply chain management integrating corporate production financial planning. Int. J. Prod. Econ. 2007, 106, 288–306. [Google Scholar] [CrossRef]
  4. Gupta, D.; Wang, L. A stochastic inventory model with trade credit. Manuf. Serv. Oper. Manag. 2009, 11, 4–18. [Google Scholar] [CrossRef]
  5. Hofmann, E.; Zumsteg, S. Win-win and No-win situations in supply chain finance; The case of accounts receivable programs. Supply Chain. Forum Int. J. 2015, 16, 30–50. [Google Scholar] [CrossRef]
  6. Wu, C.; Zhao, Q.; Xi, M. A retailer-supplier supply chain model with trade credit default risk in a supplier-Stackelberg game. Comput. Ind. Eng. 2017, 112, 568–575. [Google Scholar] [CrossRef]
  7. Yang, A.S.; Birge, R.J. Trade credit, risk sharing, and inventory financing portfolios. Manag. Sci. 2017, 64, 3667–3689. [Google Scholar] [CrossRef]
  8. Raghavan NR, S.; Mishra, V.K. Short-term financing in a cash-constrained supply chain. Int. J. Prod. Econ. 2011, 134, 407–412. [Google Scholar] [CrossRef]
  9. Chen, Y.; Weiguo, F.; Baofeng, Z. Financing a risk-averse manufacturer in a pull contract: Early payment versus retailer investment. Int. Trans. Oper. Res. 2020, 28, 2548–2580. [Google Scholar]
  10. Huang, S.; Fan, Z.; Wang, X. The impact of transportation fee on the performance of capital-constrained supply chain under 3PL financing service. Comput. Ind. Eng. 2019, 130, 358–369. [Google Scholar] [CrossRef]
  11. Zhao, J.; Duan, Y. The coordination mechanism of supply chain finance based on tripartite game theory. J. Shanghai Jiaotong Univ. (Sci.) 2016, 21, 370–373. [Google Scholar] [CrossRef]
  12. Zeng, J.; Glaister, K.W. Value creation from big data: Looking inside the black box. Strateg. Organ. 2017, 16, 105–140. [Google Scholar] [CrossRef]
  13. Yan, N.; Sun, B.; Zhang, H.; Liu, C. A partial credit guarantee contract in a capital-constrained supply chain: Financing equilibrium and coordinating strategy. Int. J. Prod. Econ. 2016, 173, 122–133. [Google Scholar] [CrossRef]
  14. Zong, S.; Huang, N. Optimal financing decision with financial constraints for a manufacturer in a low-carbon supply chain. Environ. Sci. Pollut. Res. 2023, 30, 86998–87015. [Google Scholar] [CrossRef]
  15. Qiangqiang, W.; Bin, Z. Financing and equilibrium decision of capital constrained supply chain under asymmetric information. Oper. Res. Manag. Sci. 2024, 33, 23. [Google Scholar]
  16. Blackman, I.D.; Holland, C.P.; Westcott, T. Motorola’s global financial supply chain strategy. Supply Chain. Manag. Int. J. 2013, 18, 132–147. [Google Scholar] [CrossRef]
  17. Dada, M.; Hu, Q. Financing newsvendor inventory. Oper. Res. Lett. 2008, 36, 569–573. [Google Scholar] [CrossRef]
  18. Jiang, L.; Hao, Z. Alleviating supplier’s capital restriction by two-order arrangement. Oper. Res. Lett. 2014, 42, 444–449. [Google Scholar] [CrossRef]
  19. Leora, K. The Role of “Reverse Factoring” in Supplier Financing of Small and Medium Sized Enterprises; World Bank: Washington, DC, USA, 2004; pp. 102–103. [Google Scholar]
  20. Zhen, X.; Shi, D.; Li, Y.; Zhang, C. Manufacturer’s financing strategy in a dual-channel supply chain: Third-party platform, bank, and retailer credit financing. Transp. Res. Part E 2020, 133, 101820. [Google Scholar] [CrossRef]
  21. Wang, F.; Yang, X.; Zhuo, X.; Xiong, M. Joint logistics and financial services by a 3PL firm: Effects of risk preference and demand volatility. Transp. Res. Part E 2019, 130, 312–328. [Google Scholar] [CrossRef]
  22. Tahi Hamonangan Tambunan, T. Development of small and medium enterprises in a developing country: The Indonesian case. J. Enterprising Communities People Places Glob. Econ. 2011, 5, 68–82. [Google Scholar]
  23. Martins, A.; Branco, M.C.; Melo, P.N.; Machado, C. Sustainability in small and medium-sized enterprises: A systematic literature review and future research agenda. Sustainability 2022, 14, 6493. [Google Scholar] [CrossRef]
  24. Sun, K.; Ooi, K.B.; Wei-Han Tan, G.; Lee, V.H. Small and medium-sized enterprises’ path to sustainable supply chains: Exploring the role of supply chain finance and risk management. Supply Chain. Manag. Int. J. 2024, 30, 1–18. [Google Scholar] [CrossRef]
  25. Bancilhon, C.; Karge, C.; Norton, T. Win-Win-Win: The Sustainable Supply Chain Finance Opportunity; Report BSR: Paris, France, 2018. [Google Scholar]
  26. Guo, J.; Jia, F.; Yan, F.; Chen, L. E-commerce supply chain finance for SMEs: The role of green innovation. Int. J. Logist. Res. Appl. 2024, 27, 1596–1615. [Google Scholar] [CrossRef]
  27. Lu, Q.; Wang, Y.; Yang, Y. How SMEs’ supply chain specific investment impacts supply chain financing performance: Insights from signaling theory. J. Bus. Ind. Mark. 2025, 40, 495–510. [Google Scholar] [CrossRef]
Figure 1. Block diagram of retail supply chain operation process based on data elements.
Sustainability 17 02207 g001
Figure 2. Impact of fluctuations in delivery levels and bank interest rates on the optimal order quantity.
Sustainability 17 02207 g002
Figure 3. Effect of the bank interest rate on optimal value.
Sustainability 17 02207 g003
Table 1. Notation and variable definitions.
NotationDescription
p Sold price of goods
w Wholesale prices offered by suppliers to purchasers
c Production cost per unit of product
v Residual value per unit of product
Q Quantity purchased
B Purchaser’s initial funding
c u Contractor out-of-stock losses due to material shortages
u Average material demand
s ( q ) Expected material usage by core businesses
θ Product recovery rate
r Bank loan interest rate
r 0 Standard Bank Loan Interest Rate
π Profit
s Composite score of data elements
x The project material demand, whose probability density function satisfies f ( x ) , the probability distribution function satisfies F ( x )
d Supply chain financing risks
k i Risk attitudes of decision-makers in the supply chain ( i = r   o r   s )
φ t Current workload and progress
U Utility function
eSupplier delivery level
hSupplier effort cost factor
tDecision phase
Disclaimer/Publisher’s Note: The statements, opinions and data contained in all publications are solely those of the individual author(s) and contributor(s) and not of MDPI and/or the editor(s). MDPI and/or the editor(s) disclaim responsibility for any injury to people or property resulting from any ideas, methods, instructions or products referred to in the content.

