Article

KOH-Assisted Chemical Activation of Camelina Meal (Wild Flax) to Treat PFOA-Contaminated Wastewater

1
School of Environment and Sustainability, University of Saskatchewan, Saskatoon, SK S7N 5C8, Canada
2
Department of Chemical and Biological Engineering, University of Saskatchewan, Saskatoon, SK S7N 5A9, Canada
*
Author to whom correspondence should be addressed.
Sustainability 2025, 17(5), 2170; https://doi.org/10.3390/su17052170
Submission received: 29 January 2025 / Revised: 24 February 2025 / Accepted: 27 February 2025 / Published: 3 March 2025
(This article belongs to the Section Sustainable Chemical Engineering and Technology)

Abstract

:
This study is constituted of the chemical activation of camelina meal (CM) biochar and the utilization of these activated carbon for the adsorption of perfluorooctanoic acid (PFOA) from water. Camelina meal, a sustainable agro-based byproduct, underwent slow pyrolysis and subsequent chemical activation with potassium carbonate (K2CO3), potassium hydroxide (KOH), and sodium hydroxide (NaOH). Among these chemical activating agents, KOH emerged as the one of most efficient activating agents, yielding activated carbon with superior surface properties and significantly higher carbon content. After the screening of the activating agents, a central composite design (CCD) was employed to optimize the critical constraints like temperature (600–900 °C), activation time (60–120 min), and KOH-to-feed ratio (0.5–1.5), with the objective of maximizing the surface area and adsorption capacities of the activated carbon samples. The activated carbon exhibited a substantial enhancement in surface area and PFOA adsorption efficacy. Optimal adsorption of PFOA was achieved using activated carbon produced at 800 °C with an activation time of 60 min and a KOH-to-feed ratio of 1.5. This material exhibited a surface area of 1558.4 m2/g and demonstrated a PFOA removal efficiency of 92.3%. The findings underscore the efficacy of chemically activated camelina meal biochar as an ecological adsorbent for the remediation of PFOA-polluted water.

1. Introduction

In recent years, the imperative to balance economic development with environmental sustainability has garnered increasing attention. As societies become more aware of environmental challenges and modern industrial structures evolve rapidly across sectors, the need for sustainable growth has emerged as a critical priority [1]. Among various approaches, renewable and sustainable energy sources that promote higher energy utilization efficiency have attracted significant interest.
Biochar, a carbon-rich material derived from the pyrolysis of biomass or biogenic wastes, has gained prominence as a promising tool for reducing carbon emissions and achieving carbon neutrality [2]. The physicochemical properties of biochar, which vary significantly depending on feedstock sources (e.g., forestry and agricultural residues and animal waste) and pyrolysis conditions (e.g., heating rate, residence time, temperature, and dry vs. wet pyrolysis), make it a versatile material [3]. One notable application of biochar lies in the production of activated carbon, which has historically been employed for pollutant adsorption and wastewater treatment [4]. In recent years, activated carbon has also found utility in green energy applications, such as the manufacture of battery electrodes and supercapacitors [5]. Furthermore, it has demonstrated potential in hydrogen and carbon dioxide capture and storage [6] and in enhancing soil nutrient content [7].
The activation method employed significantly influences the properties of biochar. Physical activation comprises the carbonization of feedstock and, subsequently, gas/steam activation. On the contrary, chemical activation involves the use of chemical reagents, for instance phosphoric acid (H3PO4), zinc chloride (ZnCl2), potassium hydroxide (KOH), etc., under controlled heating in an inert atmosphere [8,9]. Compared to physical activation, chemical activation generally requires lower temperatures and shorter processing times, yielding a more advantageous porous structure [10].
A significant environmental challenge is the contamination from perfluorooctanoic acid (PFOA), a synthetic chemical classified under the PFAS (per- and polyfluoroalkyl substances) and commonly found in products such as non-stick cookware, paint additives, and firefighting foams. PFOA’s carbon–fluorine bonds are among the strongest in nature, lending the compound exceptional stability but also posing risks to human health, including adverse effects on fertility, fetal development, learning, hormonal balance, and liver function [11].
The three key mechanisms for PFOA adsorption on the surface of biochar involve electrostatic interaction, hydrogen bonding, and hydrophobic interaction [12]. The electrostatic interaction occurs between the oppositely charged molecules, and, in this case, negatively charged PFAS molecules interact with the positively charged surface sites on the biochar. Hydrogen bonding is a type of dipole–dipole interaction where the hydrogen bonds are formed between PFOA anionic species and the functional groups present on the biochar (such as hydroxyl –OH and carboxylate –COO–). Furthermore, the long hydrophobic perfluorinated carbon chains of PFAS repel water molecules and tend to interact with the hydrophobic surface of the biochar contributing to its adsorption [13].
This study seeks to address the gap in knowledge regarding the effects of chemical activation on the structural and adsorption properties of camelina meal biochar. Employing a central composite design (CCD) approach, this research aims to optimize key parameters, such as activation temperature, activation time, and chemical-to-feed ratio, to maximize surface area and PFOA removal efficiency. By comparing the performance of chemically activated camelina meal biochar with its un-activated precursor, this study identifies optimal activation conditions for enhanced adsorption properties. The research findings lay a foundation for the broader understanding of biochar-based PFOA removal and demonstrate the feasibility of camelina meal as a sustainable, cost-effective feedstock for high-performance adsorbents [14,15]. The optimized biochar developed herein holds promise for addressing PFAS contamination in water, paving the way for future research and broader applications in environmental remediation [16].

2. Materials and Methods

2.1. Feed Stock and Chemicals Employed

For this study, camelina meal was used as the feedstock which was procured from Smart Earth Camelina Corp., a company situated in Saskatoon, Saskatchewan, Canada. The chemicals, such as potassium carbonate (K2CO3), sodium hydroxide (NaOH), and potassium hydroxide (KOH), were purchased from Fischer Scientific (Toronto, ON, Canada) with a purity of ≥98%. The perfluorooctanoic acid (≥98% purity) was acquired from Millipore Sigma Canada Ltd. (Toronto, ON, Canada). The nitrogen gas cylinder used for the activation experiments was acquired from Praxair Canada Inc. (Saskatoon, SK, Canada).

2.2. Chemical Activation of Camelina Meal Biochar

Prior to the chemical activation, camelina meal biochar was produced from the feedstock by implementing the optimized process conditions (temperature: 450 °C, 5 °C/min of heating rate, and 30 min of holding duration), as mentioned in our previous work [3]. The biochar obtained in these optimized conditions was impregnated with three different chemical agents, e.g., potassium carbonate (K2CO3), sodium hydroxide (NaOH), and potassium hydroxide (KOH) in a 1:1 ratio. After evaluating the results obtained from the above screening of the activating agents, it was determined that KOH was the most effective chemical agent for the activation of the camelina meal biochar. Subsequently, the biochar was thoroughly impregnated with KOH using chemical-to-biochar ratios of 0.5:1, 1:1, and 1.5:1. A mixture of 100 mL deionized water and the impregnated biochar was stirred for 10 h at 30 °C. This process improves the absorption of chemical agents in the pores structure of the biochar. Subsequently, the mixture was further dried in the oven for 12 h at 105 °C. The dried impregnated biochar was activated in an Inconel fixed bed reactor (length 850 mm, internal and external diameter of 20 and 26 mm kept inside an electrical furnace ATS-3210 (Applied Test Systems, Butler, PA, USA), to maintain the desired operating yielding conditions.
To activate the camelina meal biochar, it was heated in the presence of nitrogen gas. The activation process involved varying two key parameters: (i) temperature ranging from 600 to 900 °C for (ii) 60 to 120 min in an inert atmosphere sustained using a consistent flow (120 mL/min) of nitrogen. Following activation, the resultants were cooled to room temperature in inert conditions and washed with deionized water after being recovered from the fluidized tubular reactor to remove the unreacted excess KOH. In addition, to achieve a pH of 6–7, the samples were cleansed with 0.1 M HCl solution. Finally, the neutralized activated carbon was dried for 12 h in an oven at 105 °C. The resulting product, derived from the optimized KOH activation of camelina meal biochar, was designated as CM-AC-KOH.

2.3. Design of Experiments for Optimization of Chemical Activation

The experimental batches were designed using the Central Composite Design (CCD) methodology to optimize the various process parameters, like reaction time, temperature, and KOH-to-feed ratio. The Design-Expert (Version 11.0) program (StatEase®, Minneapolis, MN, USA) was used to perform the experiment optimization and statistical analysis of the results. By considering the temperature (600–900 °C), reaction duration (60–120 min), and KOH-to-feed ratio (0.5–1.5), a total of 20 experimental batches were generated with 6 center points at temperature: 750 °C, reaction duration: 90 min, and KOH-to-feed ratio: 1. After the execution of these experimental batches and generating the responses, optimization of the experimental conditions and statistical analysis of the results were performed by evaluating the effects of process parameters and regression elements, like R2, p- and F-values.

2.4. Analysis of Activated Carbon Derived from Biochar

2.4.1. Proximate Analysis

The volatile, ash, and moisture contents in the activated carbon samples generated from the above experimental batches were obtained using suitable ASTM guidelines [17,18,19]. After estimating the volatile, ash, and moisture contents, the fixed carbon of these activated carbon samples was calculated by difference. An amount of 1 g of a test sample was heated at 105 °C for 2 h in a pre-weighed crucible in a hot-air oven to determine moisture content through observed weight change. Correspondingly, the ash and volatile content were determined from weight loss after heating at 575 °C for 4 h and 950 °C for 7 min, respectively.

2.4.2. Ultimate Analysis

The Vario EL III elemental analyzer (Elementar, Ronkonkoma, NY, USA) was employed to estimate the elemental composition of sulfur, carbon, nitrogen, and hydrogen contents in the activated carbon samples. The oxygen content of the activated carbon samples was calculated by difference (considering the CHNS and the ash content). Moreover, the higher heating values (HHV) of activated carbon samples were calculated using Equation (1) [20]:
HHV   MJ kg = 3.55 C 2 232 × C 2230 × H + 51.2 × C × H + 131 × N + 20,600 × 0.001
where C: Carbon, H: Hydrogen, and N: Nitrogen in wt.%.

2.4.3. Activated Surface Area and Porosity

The surface area and the porosity of the activated carbon play a vital role in adsorbing different molecules. Measurements were conducted using a Micromeritics ASAP 2020 BET analyzer (Micromeritics Instrument Corporation, Norcross, GA, USA). Moreover, the pore volume and pore size were determined following the Barrett–Joyner–Halenda (BJH) method. The analysis was conducted through the N2 adsorption–desorption methodology performed at a temperature of −196 °C. The activated carbon samples underwent a degassing process at 250 °C under a vacuum pressure of 500 mmHg to remove the moisture and adsorb the gases present in the samples following activation [21].

2.4.4. Structural Analysis

FT-infrared and solid 13C solid-state NMR spectroscopy was employed to assess the molecular structure and functional groups present in the carbon samples. FTIR spectra of the biochar sample and the activated carbon generated from the optimized conditions were acquired using a Bruker VERTEX 70v FTIR mass spectrometer (Brucker, Toronto, ON, Canada) in the attenuated total reflectance (ATR) mode. All FTIR spectra were measured at a resolution of 4 cm−1 in the range from 4000 to 400 cm−1.
Similarly, NMR spectroscopy was carried out on a Bruker AVANCE III HD spectrometer (Bruker, Massachusetts, MA, USA) with a 4 mm DOTY CP-MAS probe (Bruker, Massachusetts, MA, USA). Nearly 640–1280 scans per sample were acquired followed by a 3.5 μs 1H 90° ramp pulse at 6 kHz speed, and 2.0 ms contact time with a 5 s recycle delay.
During acquisition, 71 kHz SPINAL-64 decoupling was used to capture every experiment. The chemical changes were measured at a relatively low field signal of 38.48 ppm.

2.4.5. Morphological Analysis by Scanning Electron Microscopy (SEM)

The morphological pictograms of the activated carbon samples were taken using a Hitachi SU8010 scanning electron microscope (Hitachi Global, Tokyo, Japan) at a voltage of 3 kV. A layer of 10 nm gold was applied to the solid carbon samples using a sputter coater to enhance the quality of the SEM images.

2.5. Adsorption of PFOA Using Activated Carbon

The adsorption of PFOA using activated carbon derived from the camelina meal biochar was performed in a 250 mL conical flask, and prior to all the batches of experiments, the biochar samples were thoroughly dried at 105 °C for 12 h to remove any moisture content. The adsorption experiment was performed in a shaking incubator at 100 rpm. In the preliminary screening of all the activated carbon samples generated from the different experimental batches, 100 mL of 5 ppm PFOA solution was taken as the starting solution with a biochar or activated carbon loading of 150 mg and an adsorption time of 8 h with an operational temperature of 30 °C. After obtaining the optimized adsorbent material from the above screening process, adsorbent loading was optimized by performing the adsorbent experiments using the above operational conditions with different adsorbent loadings (50, 100, and 150 g/L). After obtaining the suitable loading, the effects of time were studied by conducting an experiment using the above optimized conditions and collecting samples at regular intervals of 1 h. The samples collected from the adsorbent experiments were analyzed using an HPLC-ELSD chromatographic system equipped with a Waters C-18 column. The method implemented in this analysis was developed in our laboratory, which consisted of a mobile phase of 1:1 ratio of methanol, water at a flow rate of 0.3 mL/min, column temperature of 35 °C, nebulizer temperature, evaporator temperature of 40 °C, and a run time of 20 min.

3. Results

3.1. Screening of Chemical Activation

The chemical activation of camelina meal biochar is profoundly influenced by the choice of activating agent, as this significantly determines the final properties of the resulting activated carbon. Table 1 presents the activation results of camelina meal biochar using chosen chemical agents. Among these, KOH-activated carbon yielded the highest carbon content, measuring 87.4%, and the largest surface area (1493 m2/g). This suggests a more thorough carbonization process, potentially yielding a material with superior adsorptive properties due to an increased surface area. In comparison, NaOH activation resulted in a carbon content of 82.6% and a surface area of 956 m2/g, which was lower than that achieved with KOH. Conversely, K2CO3 activation produced a substantially lower carbon content of 69.9% and a surface area of 511 m2/g, indicating a less efficient activation process and potentially inferior adsorptive capacity. The oxygen content of the KOH-activated sample was the lowest among the three, at 14.2%. Reduced oxygen content is generally associated with a decrease in surface oxygen functional groups, which confer several advantages, including enhanced structural stability, improved adsorption selectivity, reduced reactivity, and optimized pore structure. Furthermore, lower oxygen content contributes to increased hydrophobicity and electrical conductivity. The KOH-activated carbon also exhibited the highest higher heating value (HHV) of 28.4 MJ/kg, indicating the greatest energy content per unit mass. This characteristic is particularly beneficial for applications requiring energy storage. In conclusion, the findings suggest that KOH is the most effective chemical agent for activating camelina meal biochar, yielding superior physicochemical properties and energy content compared to NaOH and K2CO3 [20]. Therefore, further optimization of the chemical activation of the camelina meal biochar was performed using KOH as the activating agent.

3.2. Overview of Chemical Activation

Twenty sets of experiment runs were conducted as per defined descriptors, and the response was confirmed concerning the regression model’s acceptance in terms of various coefficients. The reaction model produced by the Design-Expert program was used to optimize the process variables.
Table 2 illustrates that the surface area of the biochar is significantly influenced by controls such as reaction temperature, holding duration, and the ratio of the chemical activating agent to biochar. Higher reaction temperatures and extended holding times were found to reduce the yield of the activated carbon. Increasing the KOH-to-feed ratio enhances the activation process by introducing additional functional groups to the biochar’s surface, thereby improving its surface area and pore volume. Consequently, larger quantities of activated biochar with enhanced properties can be obtained.
The chemically activated biochar exhibited surface areas ranging from 601.1 m2/g to 1680 m2/g, with yields varying between 44% and 69.1%. The maximum surface area (1680 m2/g) was achieved at a reaction temperature of 800 °C, a holding duration of 120 min, and a KOH-to-feed ratio of 1.5. In contrast, the highest yield (69.1%) was obtained at 600 °C, with a holding time of 90 min and a KOH-to-feed ratio of 1. Elevated temperatures facilitate more effective interactions between the activating agent and the biochar, promoting rapid pore development but also accelerating decomposition, which results in a marked reduction in yield at higher temperatures. The lowest surface area (601 m2/g) was observed at 600 °C with a holding time of 60 min and a KOH-to-feed ratio of 0.5. Similarly, the lowest yield (44%) occurred at 800 °C, with a residence time of 120 min and a chemical-to-feed ratio of 0.5.
The decomposition rate of camelina meal biochar by KOH was observed to be slower at lower temperatures. This allows the activation process to focus on pore formation while minimizing the excessive charring or combustion of the carbonaceous material, thereby resulting in higher yields. The use of KOH as an activating agent facilitated the production of activated carbon with a significantly enhanced surface area. During the activation process, heated KOH undergoes dehydration and transforms into K2O, which subsequently reduces to elemental potassium. The activation process also generates various potassium-based compounds, including K, K2O, and K2CO3, through a series of reactions. The penetration of free potassium into graphene carbon layers leads to the expansion of the structural graphene layers. At elevated temperatures, the free potassium is removed, resulting in the formation of a porous structure in the activated carbon. In this study, the activated carbon was subjected to acid washing with 0.1 M HCl to remove residual potassium and potassium-based compounds (K, K2O, and K2CO3) entirely. This post-treatment step enhanced the accessibility of the pore and its structure which assisted in the increment of overall total surface area of the activated carbon.
Table 2 presents the physicochemical properties and yields of activated carbon produced under varying activation conditions. The carbon content achieves its peak value of 85.9% at an activation of 800 °C for 60 min, with a chemical-to-feed ratio of 1.5. In general, elevated temperatures and extended activation durations promote an increment in carbon content due to enhanced pyrolysis and the removal of volatile constituents. Conversely, samples activated at 600 °C, such as those with a chemical-to-feed ratio of 0.5 and a 60-min activation period, exhibit a lower carbon content of 63.9%. The hydrogen content of the activated carbon ranges from 0.4% to 3.1%, while sulfur content remains consistently low across all samples, varying between 0.04% and 0.42%. Oxygen content ranges from 6.1% to 11.6%, with higher values generally observed at lower temperatures and shorter reaction times. The oxygenation level of biochar is quantified by the O/C ratio, with lower values indicating increased carbonization. Notably, the O/C ratio approaches negligible levels at higher activation temperatures, such as 0.14 in Run 11 (800 °C), signifying a high degree of stability and carbonization. Similarly, the H/C ratio serves as an indicator of aromaticity, with lower values reflecting an increased degree of aromaticity and structural stability. Highly carbonized biochar is characterized by well-developed aromatic structures, as demonstrated by the consistently low H/C ratio, particularly at elevated temperatures (e.g., 0.01 in Run 11). Furthermore, the surface area of the biochar shows a significant enhancement at higher temperatures, with a maximum surface area of 1680 m2/g observed at 800 °C.

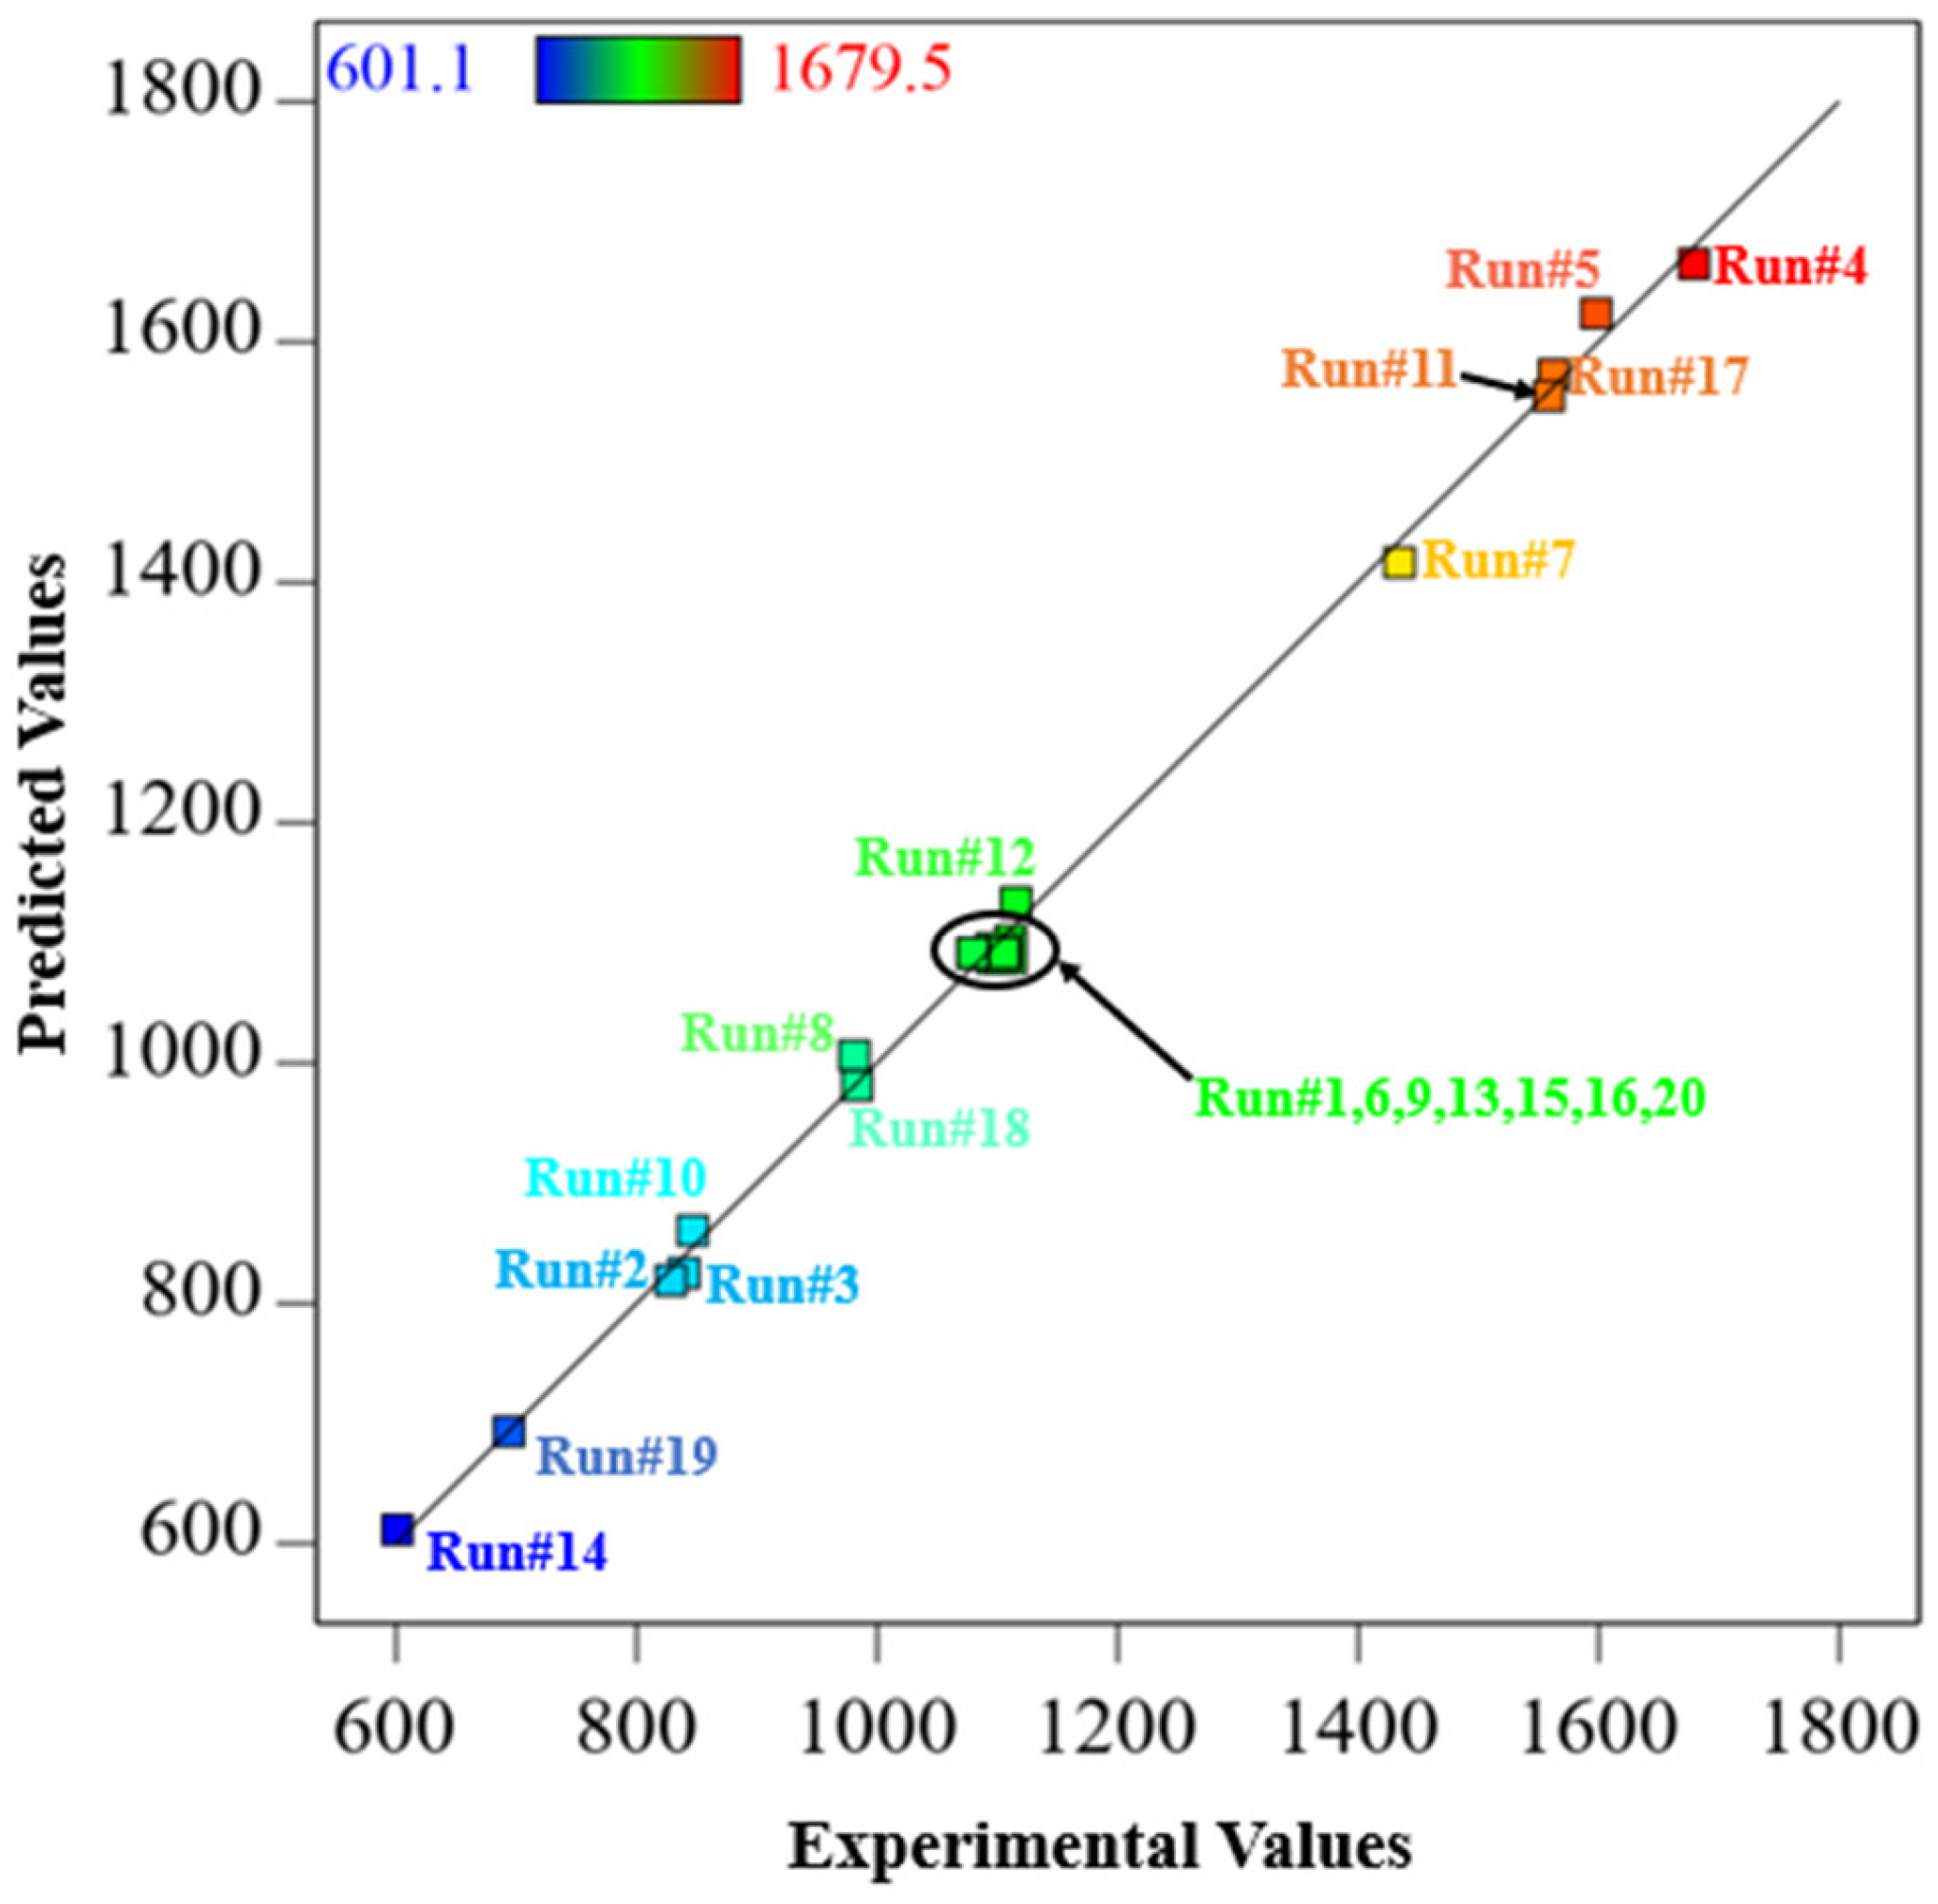
3.3. Statistical Analysis of Chemical Activation Process

A total of twenty experiments were performed, and the results were assessed to determine the acceptance of the regression model based on various coefficients. To determine the regression equation, the data from the experimental runs were fitted into a variety of models to establish a relationship between the experimental parameters or components (temperature, holding time, and KOH-to-biochar feed concentration) and the yield and surface area of chemically activated biochar. The rationality of the model was established using mathematical characteristics, such as the model summary and the sequential model sum of squares shown in Table 3, and the model’s sufficiency was confirmed. A standard deviation of 20.2 indicates minimal variability around the fitted regression line, while a mean value of 1121, combined with a coefficient of variation (C.V.) of 1.80%, reflect tightly clustered data and excellent reproducibility. A coefficient of determination (R2) of 0.997 suggests that 99.7% of the variability in the dependent variable is explained by the independent variables, highlighting the model’s near-perfect fit. The adjusted R2 of 0.995 confirms this explanatory power while accounting for model complexity, suggesting minimal risk of overfitting. Additionally, the predicted R2 of 0.98 underlines the model’s ability to simplify effectively to new data, demonstrating strong predictive performance. Moreover, a satisfactory level of concurrence was observed for the adjusted R2 (0.995) and the anticipated R2 value (0.979) for the surface area, with a difference of less than 0.2 between the two values. The Adequate Precision value of 73.9, significantly exceeding the limit of 4, indicates a high signal-to-noise ratio, affirming the model’s robustness. Collectively, these metrics confirm that the regression model is highly precise, reliable, and capable of producing meaningful and generalizable predictions.
The analysis of variance (ANOVA) results in Table 4 provide critical insights into the significance of various factors and their interactions within the regression model. The overall model is highly significant, as indicated by the extremely low p-value (<0.0001) and a large F-value of 480.09. This confirms that the model effectively captures the variability in the response variable. Among the main effects, temperature (A) emerges as the most dominant factor, with the largest sum of squares (1,619,000) and the highest F-value (3983.34). This underscores its crucial role in influencing the response. Time (B) and chemical-to-feed ratio (C) also demonstrate substantial impacts, supported by their significant F-values of 56.58 and 143.63, respectively, and p-values well below 0.0001. The interaction effects reveal important secondary relationships. The interaction between temperature and time (AB) showed a p-value of 0.0257 and a F-value of 6.85, indicating that their combined influence on the response is meaningful. Similarly, the interaction between temperature and chemical-to-feed ratio (AC) is also significant (p-value = 0.0248; F-value = 6.96). However, the interaction between time and chemical-to-feed ratio (BC) is not significant (p-value = 0.1354; F-value = 2.64), suggesting that the relationship between these two factors has a less pronounced effect on the response variable. The analysis of quadratic effects further highlights the non-linear nature of the response. All quadratic terms (A2, B2, and C2) are significant, with p-values below 0.05, indicating that curvature effects are present in the parameter space. Among these, the quadratic effect of temperature (A2) stands out with the highest F-value of 114.12, reinforcing the dominant role of temperature in shaping the response behavior.
The residual analysis provides additional validation of the model. The residual sum of squares is relatively small (4063.86), and the lack-of-fit test is not significant (p-value = 0.1070). This indicates that the model adequately describes the data without systematic errors. Furthermore, the low pure error sum of squares (940.82) derived from replicated runs underscores the reliability and precision of the experimental data. Overall, the corrected total sum of squares (1,760,000) and the significant contributions of both the main and interaction effects highlight the robustness of the regression model. The high proportion of explained variability relative to residuals confirms that the model is well suited for understanding the underlying system dynamics. The findings emphasize the critical roles of temperature, time, and chemical-to-feed ratio, along with their interactions and quadratic effects. The non-significant lack-of-fit test further validates the model’s adequacy, making it a valuable tool for predicting system behavior and guiding future experimental and optimization efforts. The outcomes of our experiments have confirmed this. A regression equation was derived, as indicated in Equation (2), following the determination of the regression model’s significance.
S u r f a c e   a r e a m 2 g = 3929.1 14.3 × A + 5.5 × B + 757.7 × C + 0.006 × A B 0.4 × A C 0.8 × B C + 0.01 × A 2 0.04 × B 2 136.1 × C 2
where A represents temperature, B represents time, and C represents chemical-to-feed ratio. AB signifies the interaction between temperature and time, AC refers to the interaction between temperature and chemical-to-feed ratio, and BC signifies the interaction between time and chemical-to-feed ratio. Furthermore, A2, B2, and C2 stand for the square terms of the variables, which are temperature, reaction time, and feed concentration, respectively.
Now, in order to assess the validity of the equation, two experiments were conducted utilizing arbitrary values for feed concentration, temperature, and reaction time. In addition, the experimentally determined yield and surface area value were observed to be reasonably consistent with the predicted value, which can be observed in Figure 1.
The parity diagram presented in Figure 1 highlights the relationship between the predicted and experimental surface areas of activated biochar, demonstrating a notable degree of alignment. The overall trend, depicted by a straight line in the graph, signifies a strong correlation between the predicted and observed data. However, a few deviations were observed, specifically in runs #12, #15, #16, and #20, where the experimental values diverged from the predicted trend. These anomalies may be attributed to the presence of residual potassium salts or organic intermediates on the activated carbon, which can influence the surface area by either blocking pores or contributing to the formation of irregular surface structures. Despite these exceptions, the majority of the experimental results closely followed the expected trend line, validating the predictive model’s robustness and accuracy in estimating the surface area of activated biochar. This indicates the potential reliability of the method for practical applications; although, further investigation into the factors contributing to deviations could enhance model precision.

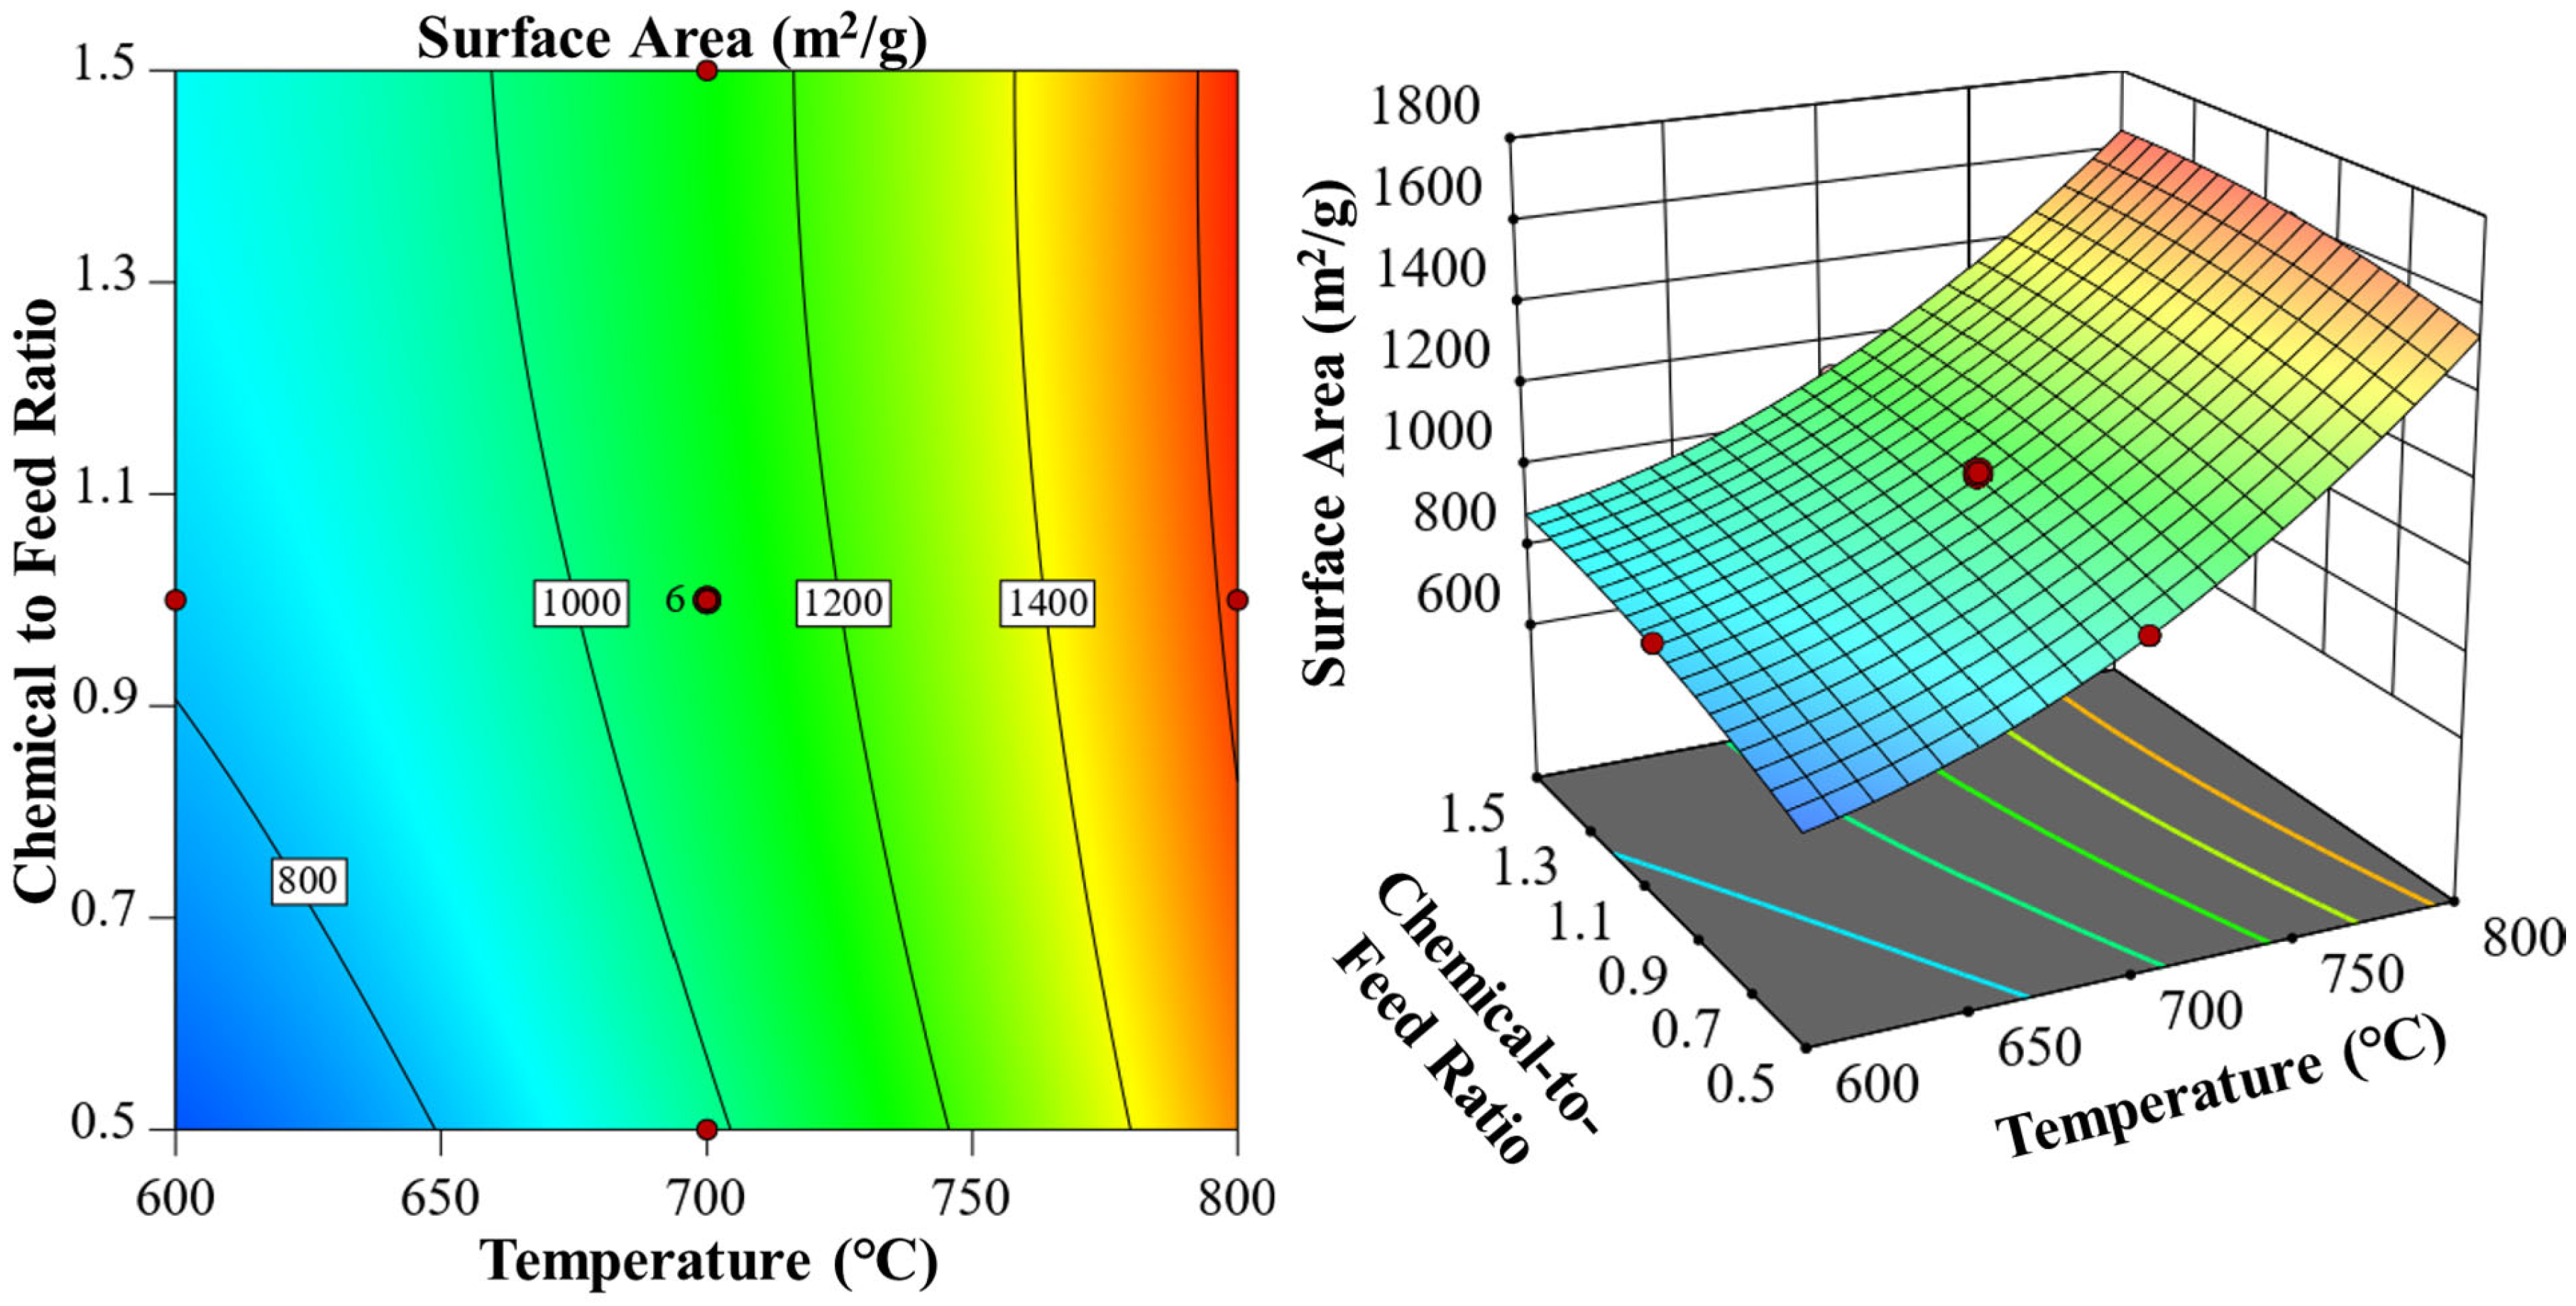
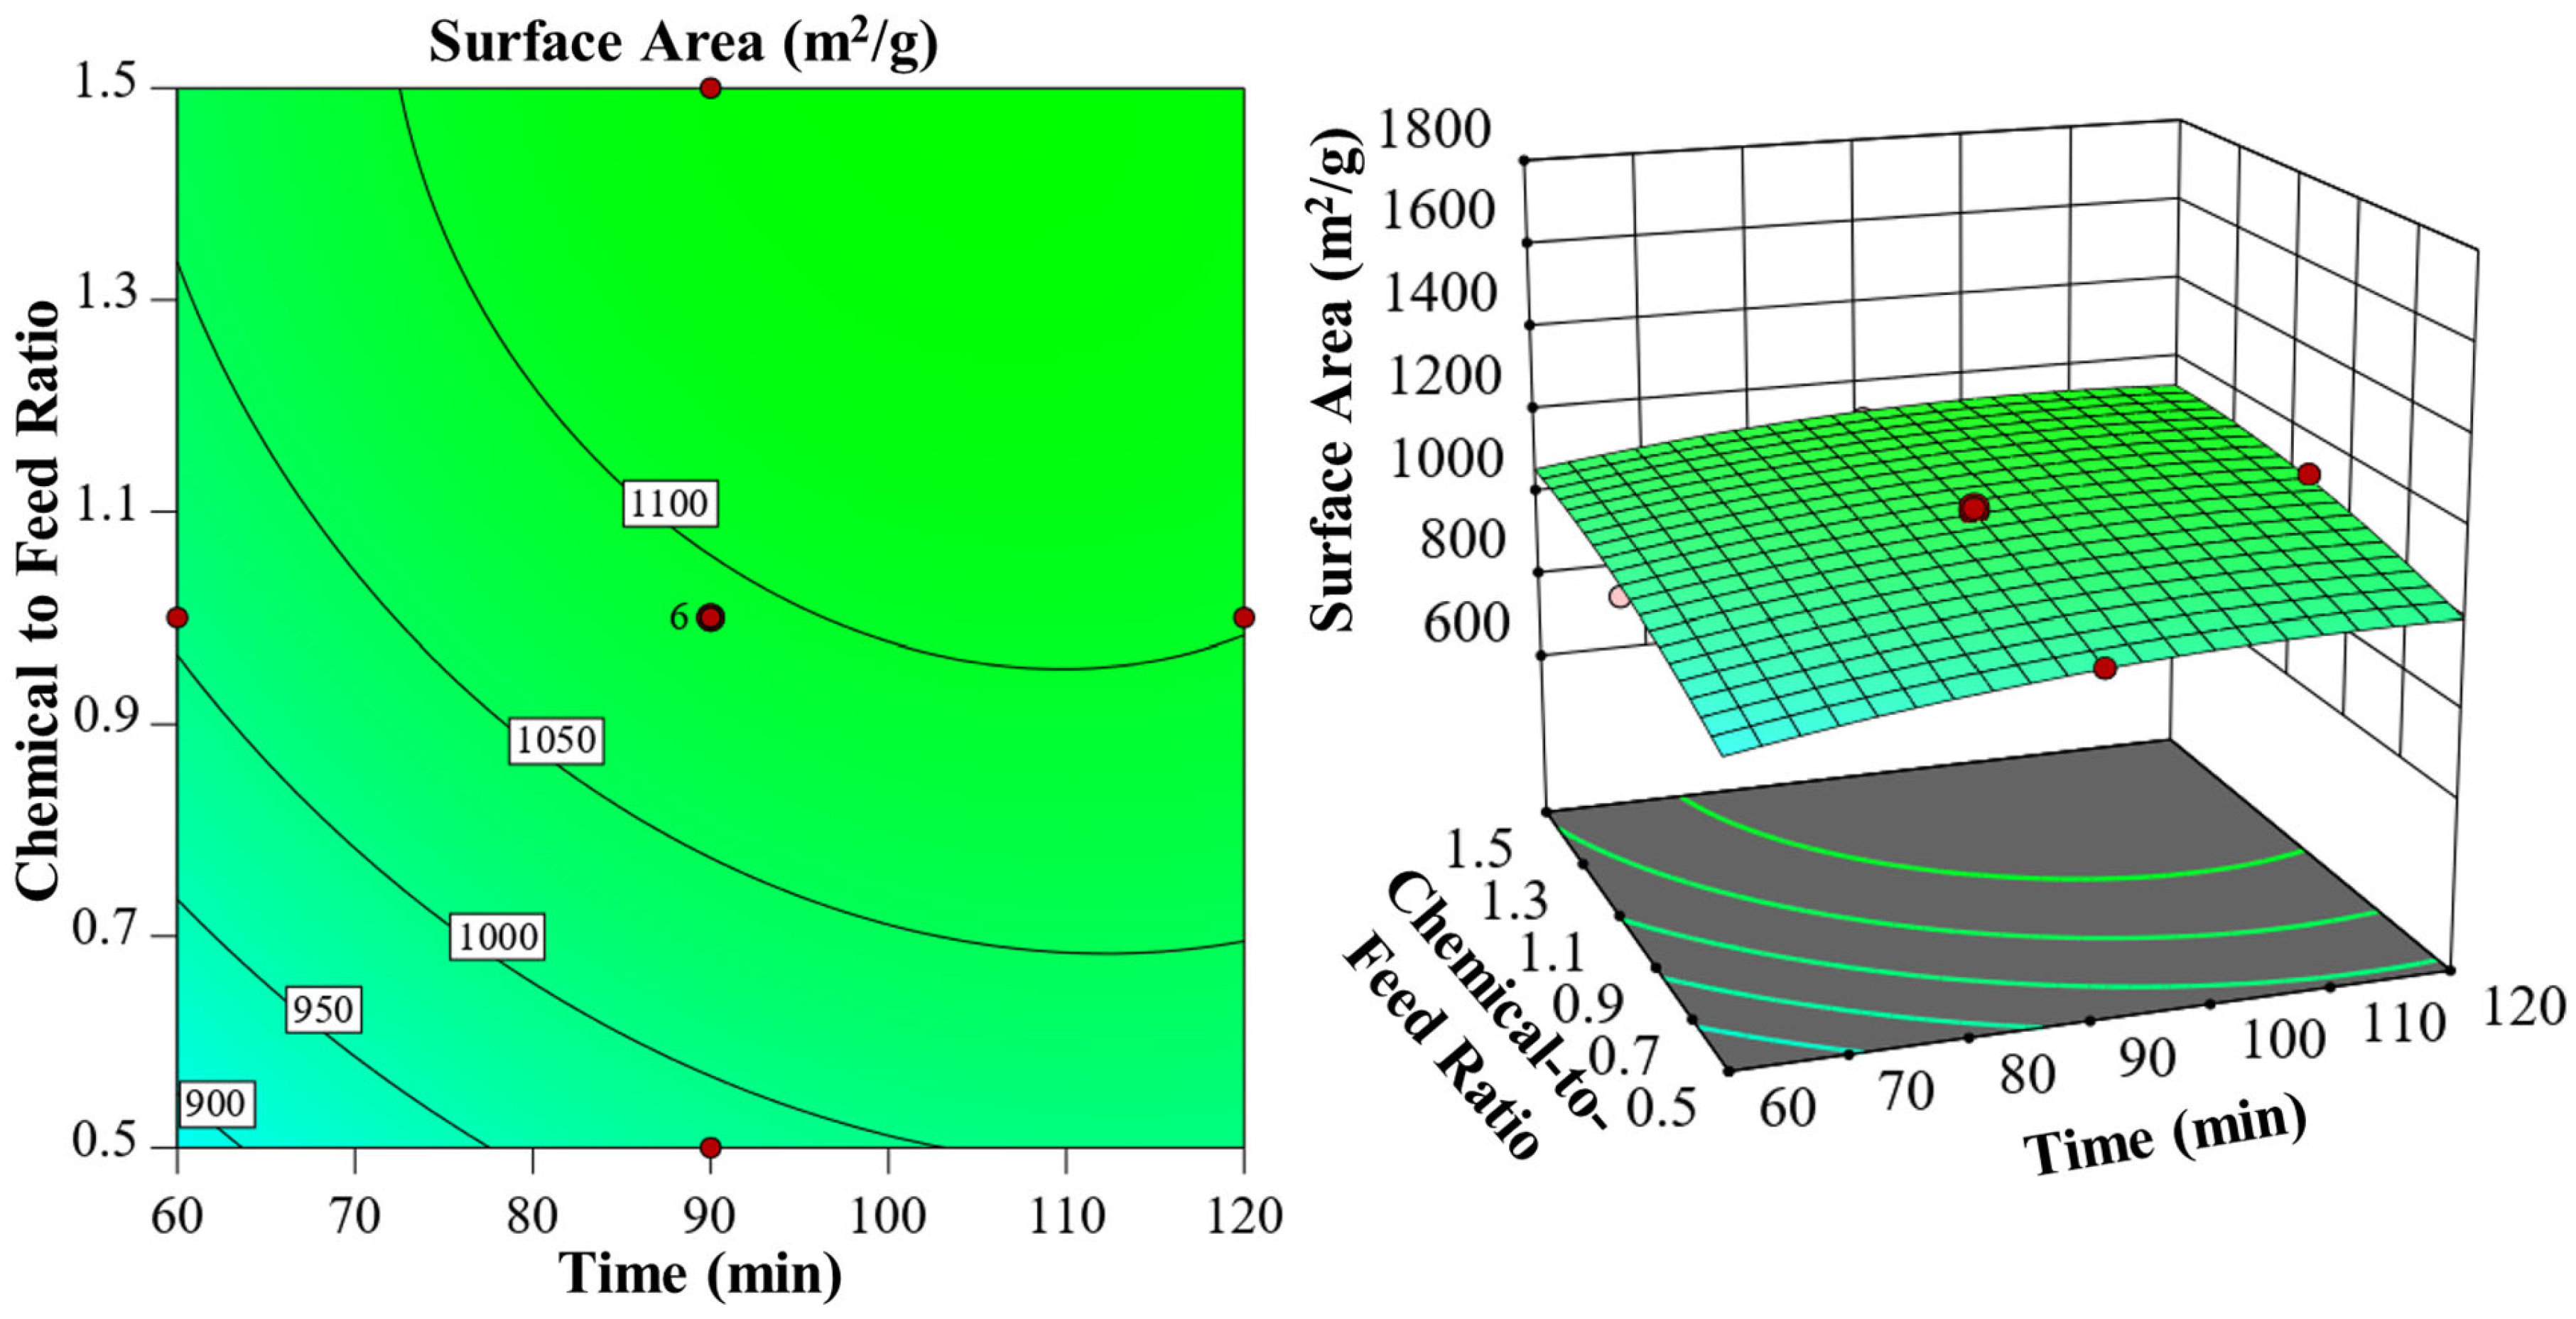
3.4. Influence of Process Variables on Porous Structure and Yield

The relationship between temperature and time and their combined effect on the surface area of activated carbon is a fundamental aspect of optimizing the material’s properties for specific applications. Figure 2 vividly demonstrates this interplay through a three-dimensional surface plot, highlighting the dependence of surface area (m2/g) on these critical process variables. As the plot indicates, temperature and time serve as independent variables, with the surface area being the dependent outcome. An analysis of the diagram reveals a clear and positive correlation between these variables: both an increase in temperature and an extension of processing time contribute to an enhanced surface area. The gradient of the 3D surface, shifting from cooler blue tones to warmer red hues, underscores this enhancement and aligns with the thermally driven mechanisms of pore development and structural modification in activated carbon. At specific temperature–time combinations, the surface area exhibits remarkable changes. For instance, at a moderate temperature of 600 °C and a processing time of 30 min, the surface area reaches approximately 750 m2/g. As the temperature increases to 800 °C, the surface area is further enhanced, reaching values near 950 m2/g for the same processing time. This improvement is indicative of the enhanced thermal decomposition and activation occurring at higher temperatures. Similarly, increasing the processing time to 60 min at a constant temperature of 800 °C pushes the surface area beyond 1000 m2/g, demonstrating the significant impact of extended thermal treatment on the material’s porosity and structure. The curvature of the 3D plot also conveys the rate of change in surface area relative to the input variables. The steeper gradients observed at lower processing times and temperatures (e.g., 400 °C to 600 °C and 10 to 30 min) suggest that minor adjustments in these parameters within this range can yield substantial changes in surface area, such as an increase from 500 m2/g to 750 m2/g. This characteristic is particularly valuable for fine-tuning production processes to achieve desired material properties while maintaining efficiency and resource utilization. With high-temperature, long-duration combinations (e.g., 900 °C and 90 min), the surface area approaches its maximum potential, surpassing 1200 m2/g. This range represents an optimal operational window for maximizing the material’s adsorption capacity and reactivity. However, it is important to note that excessively high temperatures or prolonged times may lead to structural collapse or excessive material loss, thereby necessitating a balance between enhancement and material stability.
Figure 3 illustrates the relationship between temperature and the chemical-to-feed ratio, and their combined effects on the surface area of activated carbon. These two independent variables significantly influence the surface area (m2/g). The diagram shows a positive correlation between the chemical-to-feed ratio and the surface area. Increasing the chemical-to-feed ratio enhances activation, leading to a more developed pore structure and higher surface areas. At 600 °C, a ratio of 0.5 yields a surface area of around 800 m2/g, which increases to about 1000 m2/g at a ratio of 0.9. This highlights the chemical agent’s role in optimizing porosity. Temperature also significantly affects the surface area. Higher temperatures provide the energy needed to form micropores and mesopores. For instance, at 800 °C and a ratio of 0.9, the surface area reaches 1200 m2/g, increasing to about 1400 m2/g at a ratio of 1.5. This demonstrates the synergistic effect of higher temperatures and chemical-to-feed ratios. The interaction of these variables is crucial, as neither achieves optimal results alone. At lower temperatures, even high chemical-to-feed ratios yield modest surface areas due to insufficient thermal energy. Conversely, high temperatures with low ratios limit pore formation. Optimizing both variables simultaneously is necessary for superior activation outcomes. A combination of 800 °C and a ratio of 1.5 produces the highest surface area of approximately 1400 m2/g, compared to less than 1000 m2/g under lower conditions.
Similarly, Figure 4 illustrates the synergistic interaction between the chemical-to-feed ratio and reaction time on the surface area of activated carbon, offering insights into process optimization. At a chemical-to-feed ratio of 0.5, the surface area reaches approximately 900 m2/g, highlighting a modest activation level. Increasing the ratio to 0.9 results in a surface area of about 950 m2/g, reflecting enhanced chemical interactions. A further increment to a ratio of 1.5 maximizes the surface area to an impressive 1100 m2/g, demonstrating the significance of higher chemical loading. Time also plays a crucial role in the activation process, with extended durations amplifying the surface area. At 120 min with a chemical-to-feed ratio of 1.5, the surface area peaks at 1100 m2/g, representing the optimal combination for maximizing porosity. The interplay between these variables indicates that both higher chemical ratios and prolonged activation times synergistically contribute to developing a more porous carbon structure, enhancing its surface area. This relationship underscores the importance of balancing these parameters for achieving desired material characteristics in industrial applications. The findings validate the strong dependence of surface area enhancement on these process variables, serving as a foundational guide for fine-tuning activation processes. Such enhancements are critical for applications requiring high-performance activated carbons, including adsorption and catalysis.
It can be inferred that the surface area of a material is significantly influenced by temperature, time, and chemical-to-feed ratio. Optimal surface areas are achieved by maximizing these variables within practical limits. Understanding and controlling these parameters is essential for tailoring material properties for specific industrial applications.

3.5. Optimization of the Chemical Activation of Camelina Meal Biochar

Figure 5 illustrates the optimized process conditions for the chemical activation of camelina meal biochar, focusing on temperature, time, and chemical-to-feed ratio to achieve a high surface area. The optimized process involves precise control over activation temperature, duration, and the chemical-to-feed ratio. A temperature of 800 °C has been identified as optimal, ensuring the development of porosity without compromising the structural integrity of the biochar. The activation duration is set at 113.5 min, striking a balance between sufficient pore development and energy efficiency. Furthermore, the chemical-to-feed ratio of 1.4 effectively facilitates pore formation while minimizing reagent waste. This meticulous optimization results in a biochar with an impressive surface area of 1670.3 m2/g, underscoring its suitability for high-performance adsorption applications. The process parameters reflect a nuanced approach to achieving high porosity and adsorption capacity, which is essential for applications such as water purification, gas adsorption, and catalysis. This optimization demonstrates the potential of camelina meal biochar as a sustainable and efficient material in surface-dependent applications, aligning with both performance and environmental objectives.

3.6. Fourier Transform Infrared Spectral Analysis (FTIR)

The FTIR spectral analysis of activated carbon, as illustrated in Figure 6, provides critical insights into its surface functional groups, which significantly influence its adsorption capabilities. The FTIR spectrum reveals key functional groups through specific wavenumbers, correlating with diverse molecular vibrations. The wavenumber at 611 cm−1 indicates the presence of CH functional groups, crucial for hydrophobic interactions. A peak at 898 cm−1 suggests C–H bending, enhancing surface heterogeneity. Peaks at 1045 and 1122 cm−1 correspond to C–O stretching in cellulose/hemicellulose and C–O–C stretching, respectively, denoting the biochar’s cellulosic origin. The peak at 1535 cm−1 represents NH bonding (amide groups), which contributes to hydrogen bonding potential. Notably, wavenumbers at 1670 cm⁻1 and 1731 cm−1 correspond to carbonyl stretching (C=O), indicating significant hydrophilic interaction sites. Vibrational modes at 2345 or 2673, and 2927 cm−1 represent C=C vibration, and –CH stretching, respectively, highlighting hydrophobic regions. Additionally, peaks at 3087, 3728, and 3843 cm−1 indicate alkane C–H stretches and –OH stretching vibrations, showcasing strong hydrogen bonding sites. The multifunctional adsorption mechanism leverages both hydrophobic (C–H and C=C) and hydrophilic (C=O, –NH, and –OH) groups for removing persistent organic pollutants such as perfluorooctanoic acid (PFOA). The surface of activated carbon and biochar interacts with PFOA through hydrophobic interactions between the fluorinated tails and the biochar’s non-polar regions, while hydrogen bonding and dipole–dipole interactions facilitate the adsorption of polar head groups. This dual interaction mechanism underscores the high efficiency of biochar and activated biochar in PFOA remediation, as evidenced by significant adsorption efficacy in experimental trials. The integration of chemically activated biochar in water treatment demonstrates its potential for scalable application in mitigating contamination. By offering a diverse adsorption surface chemistry, biochar not only enhances removal efficiency but also broadens its application scope for environmental remediation. This analysis affirms the biochar’s functional adaptability and underscores its pivotal role in sustainable water treatment solutions.

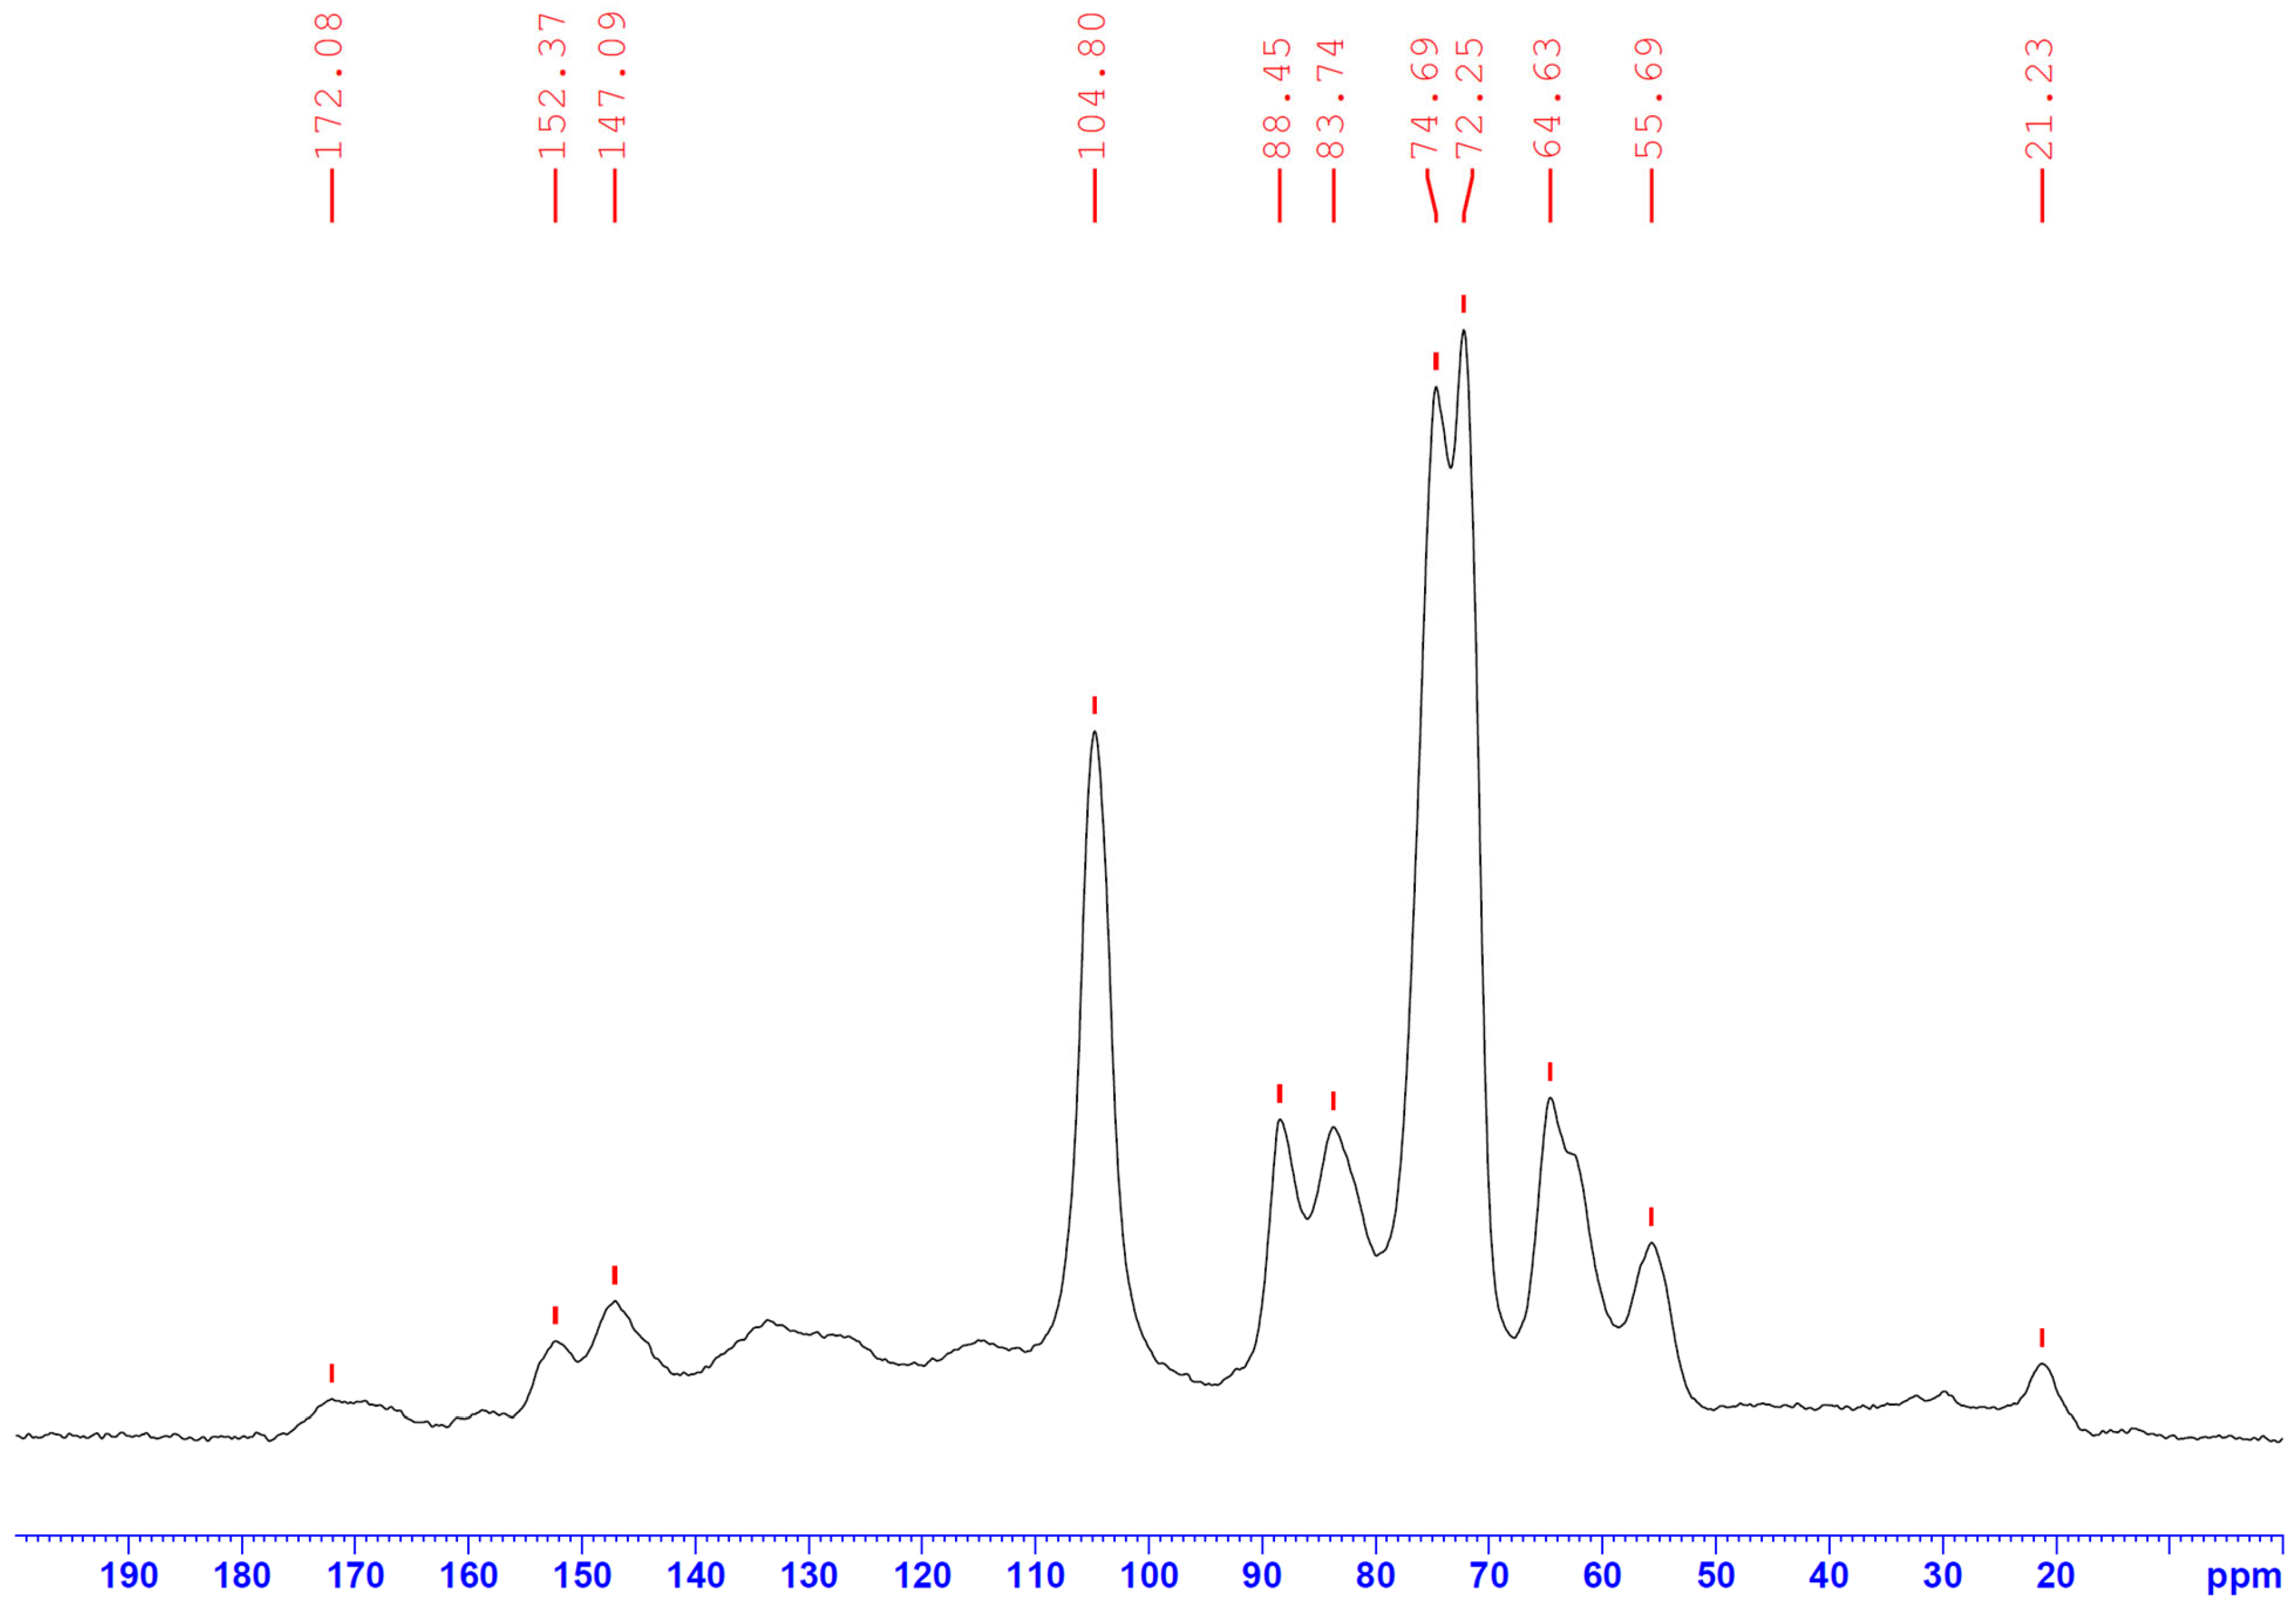
3.7. Molecular Analysis by 13C Solid-State NMR

The 13C NMR spectrum of the KOH-activated biochar (Figure 7) provides detailed insights into its chemical composition, highlighting various functional groups critical for adsorption applications, particularly for polar contaminants such as PFAS chemicals such as PFOA [19,22]. A prominent peak at 21.2 ppm, attributed to aliphatic (C–C) carbons, suggests the retention of structural residues from cellulose and lignin, which typically fall within the 10–75 ppm range [23]. These aliphatic carbons are crucial for non-polar interactions and contribute to the porosity of the biochar, potentially resulting from the intercalation of potassium ions into the carbon matrix during activation [24]. Peaks at 55.7 ppm and 64.6 ppm correspond to methoxy and oxygenated carbons (C–O), respectively, and are indicative of partially decomposed lignocellulose [25]. These functionalities significantly enhance the hydrophilicity of the biochar, facilitating hydrogen bonding and dipole–dipole interactions with polar contaminants like PFOA [26]. Within the region of 72.2–74.7 ppm, peaks reveal hydroxyl-bearing carbons, often associated with cellulose and hemicellulose residues, which are preserved through KOH activation [27]. These groups enhance adsorption by forming hydrogen bonds with PFOA molecules, further increasing the interaction capacity [28]. An anomeric carbon peak at 104.8 ppm points to the partial preservation of sugar-like structures, suggesting incomplete thermal degradation that retains oxygenated sites [29]. This characteristic enables electrostatic interactions with negatively charged PFOA molecules.
In the aromatic region, peaks at 147.1 ppm and 152.4 ppm are attributed to oxygenated aromatic carbons, typically originating from lignin-derived structures, which contribute to the biochar’s stability and structural integrity [30]. These aromatic groups, stabilized during activation, also play a significant role in enhancing adsorption mechanisms. The peak at 172.1 ppm is particularly noteworthy, corresponding to carboxylic acid or ester groups formed during oxidative degradation [31]. These groups are highly relevant to adsorption processes due to their ability to engage in ion exchange and electrostatic interactions with PFOA, further boosting the material’s performance. The abundance of oxygenated groups aligns with published findings, such as [32], that emphasize the critical role of oxygen-containing functionalities in binding polar contaminants. The increased surface polarity and functionality achieved through KOH activation underscore the enhanced performance of the carbonaceous materials. Thus, the NMR analysis demonstrates the improved structural and functional properties of KOH-activated biochar, establishing its efficacy for advanced environmental remediation applications. The precise interplay of these functional groups underscores the material’s tailored performance in adsorption, making it a promising candidate for addressing persistent environmental pollutants.

3.8. Morphological Analysis

The SEM images presented in Figure 8 provide a comprehensive understanding of the morphological evolution of camelina biomass as it undergoes pyrolysis and chemical activation, ultimately leading to its application in pollutant adsorption. Initially, the raw camelina biomass (Figure 8a) demonstrates a dense, compact structure with minimal porosity. At 500× magnification, the surface appears smooth and is dominated by an intact lignocellulosic matrix, characterized by tightly packed cellulose and hemicellulose fibers, as corroborated by the literature [33]. The structural uniformity observed at higher magnifications (5000×) reflects the inherent rigidity and low porosity of untreated lignocellulosic biomass. However, upon pyrolysis at 450 °C, the camelina meal undergoes significant morphological changes, as depicted in Figure 8b. The disruption of the lignocellulosic matrix during slow pyrolysis results in irregular surfaces and small voids, indicative of nascent porosity. This phenomenon is attributed to the thermal degradation of organic polymers, accompanied by the release of volatile compounds, which form primary pores. This transformation is a crucial step toward enhancing the material’s functionality as a biochar-based adsorbent [34]. Chemical activation with KOH further amplifies these structural changes, as evidenced in Figure 8c. The activation process etches the biochar surface extensively, creating an interconnected network of micropores. Such structural modifications are pivotal for adsorption applications, as they enhance the material’s specific surface area and pore volume, as confirmed by BET analysis and supported by studies such as [32]. The increased microporosity facilitates the adsorption of organic contaminants like PFOA, leveraging both hydrophobic interactions between the fluorinated PFOA tail and the biochar surface and hydrogen bonding with oxygenated functional groups. The post-adsorption micrographs (Figure 8d) reveal the complete filling of micropores with PFOA molecules, affirming the activated biochar’s efficacy as an adsorbent. The visible deposits on the biochar surface and the roughened morphology align with previous findings [35,36], further substantiating the role of microporous structures and surface chemistry in adsorption mechanisms. This study underscores the transformative impact of pyrolysis and chemical activation on camelina biomass, highlighting the critical interplay between morphological changes and adsorption performance.

3.9. Adsorption of PFOA

Among the various methods explored for the removal of PFAS chemicals from wastewater, adsorption has been the most extensively studied at the laboratory scale. In this study, all chemically activated samples were subjected to adsorption experiments. Adsorption was carried out by stirring 100 mL of a PFOA solution in deionized water (5 mg L−1) with 150 mg of activated biochar prepared under different activation conditions. The removal efficiency was calculated, and the results are presented in Table 5.
The adsorption behavior of PFOA using chemically activated biochar was investigated extensively. Among the samples studied, Sample 4, which was prepared by activating CM biochar at 800 °C for 120 min with a chemical-to-feed ratio of 1.5, exhibited the highest surface area of 1679.5 m2/g and a removal efficiency of 86.1%. In comparison, Sample 11, activated under similar conditions but for a shorter duration of 60 min, displayed a slightly lower surface area of 1558.4 m2/g but achieved a higher removal efficiency of 92.3%. Although surface area is a critical factor influencing adsorption, the efficiency of adsorption also depends on the pore size distribution and structural characteristics of the material. The superior efficiency observed in Sample 11 may be attributed to its pore structure, which appears to be better suited to the molecular dimensions of PFOA. Additionally, the shorter activation time in Sample 11 might have helped preserve mesopores by minimizing structural degradation, thereby enhancing its adsorption performance. The pore size varies from 2.1 to 3.6 nm. Lower adsorption efficiencies were observed for samples with smaller pores (<3 nm). A pore volume of biochar in the range of 1.2-1.5 cm3/g is the optimal range for adsorbing PFOA molecules. Similarly, samples with pore sizes in the range of 3.2–3.4 nm (Run #4, #5, #6, #7, #11, #12, and #17) showed high removal efficiencies confirming that this range is optimal for the adsorption of PFOA (Table 5).
The impact of the adsorbent dosage on removal efficiency and adsorption capacity was analyzed by varying the dosage between 50 mg L−1 and 150 mg L−1 (Table 6). Adsorption experiments were conducted at ambient temperature with a stirring rate of 100 rpm for 8 h. For CM biochar, the removal efficiency ranged from 64.0% to 68.6%, while for activated CM biochar, it increased significantly, ranging from 93.1% to 96.1%. It was observed that a lower adsorbent dosage resulted in higher adsorption capacities. At a dosage of 50 mg L−1, the adsorption capacity was highest, reaching 64 mg L−1 for CM biochar and 93.1 mg L−1 for activated CM biochar. At higher dosages, while removal efficiency improved slightly, the adsorption capacity declined due to a dilution effect on the available adsorption sites. These findings suggest that lower adsorbent dosages are more efficient for the removal of PFOA from the solutions prepared with deionized water.
The time-dependent adsorption performance of CM biochar and activated biochar was also evaluated at an initial PFOA concentration of 5 mg L−1. The results revealed a substantial reduction in PFOA concentration within the first four hours, with the biochar removing the majority of PFOA during this period. For CM biochar, removal efficiency reached approximately 85–90% within four hours, after which it plateaued, indicating equilibrium had been achieved. A similar trend was observed for activated biochar, where PFOA concentration decreased to near-zero levels within five hours, and removal efficiency stabilized at approximately 90%. These results highlight the rapid adsorption kinetics of activated biochar and confirm that adsorption equilibrium is achieved within 4–5 h, beyond which further removal is negligible. Moreover, Figure 9 presents the PFOA (Perfluorooctanoic acid) removal efficiency as a function of adsorbent dosage for CM Biochar and KOH-activated carbon. The results indicate that KOH-activated carbon exhibits significantly higher removal efficiency, reaching nearly 90% at the highest dosage, compared to CM Biochar, which shows a maximum efficiency of around 40%. Additionally, both adsorbents display an increasing trend in removal efficiency with increasing adsorbent dosage, suggesting improved adsorption capacity at higher dosages.
The initial concentration of PFOA in the studied solution was approximately 5 mg/L. Over the course of 8 h, a significant reduction in PFOA concentration was observed, particularly within the initial 4 h (Figure 10a) for KOH-activated biochar. Here, the PFOA concentration decreased sharply in the initial hours, dropping from approximately 5 mg/L to about 0.5 mg/L by the 5 h mark. This rapid decline underscores the high adsorption capacity of the activated biochar. Following this phase, the concentration remained consistently low, indicating that equilibrium had been reached. Similarly, for inactivated CM biochar, the concentration decreased from 5 mg/L to 1.72 mg/L and started stabilizing after the 6 h period.
The removal efficiency of the KOH-activated carbon (Figure 10b) exhibited a gradual increase over time, achieving approximately 78% within the initial 4 h. Beyond this point, the removal efficacy plateaued, signifying equilibrium and minimal further adsorption. Whereas, the removal efficiency of the inactivated CM biochar increased, reaching around 62% within 7 h and maintaining this efficiency thereafter. These findings highlight the activated biochar’s ability to rapidly and effectively adsorb PFOA, achieving near-complete removal during the initial hours and maintaining adsorption equilibrium after approximately 5 h.
The comparative analysis of biochar and activated biochar shows that activation enhances adsorption performance, possibly due to the increased surface area and optimized pore structure. This enables higher adsorption efficiency within a shorter timeframe [34]. These results are consistent with prior studies that emphasize the critical role of activation in improving the adsorption properties of biochar, particularly for persistent organic pollutants such as PFOA. The following Table 7 compares similar studies with our work.
The capacities of biochar, which are derived from a variety of feedstocks and activated through chemical, metal oxide, or steam methods, are capable of effectively adsorbing PFAS. The capacities of biochar vary depending on the feedstock and treatment [38,39]. Hydrophobic interactions, electrostatic forces, and functional group contributions are the primary factors driving adsorption, particularly in acidic environments [40,41]. This research on biochar made from KOH-activated camelina meal indicates that it has the potential to be a sustainable and effective method of PFOA remediation.

4. Discussion and Future Outlook

The increasing concern regarding perfluorooctanoic acid (PFOA) contamination in water systems has prompted extensive studies into adsorption-based remediation techniques. Conventional activated carbon adsorbents, sourced from lignocellulosic biomass, exhibit significant efficacy in eliminating organic contaminants, such as PFAS chemicals [42]. Recent developments have concentrated on refining biochar activation methods to improve adsorption capacities while ensuring cost effectiveness and sustainability.

Past and Present Research Trends

Conventional activated carbons and metal-based adsorbents were the primary focus of early research on PFOA adsorption [43]. Although these methods were effective, they were frequently expensive and presented difficulties with respect to regeneration and secondary pollution. Researchers subsequently shifted their focus to biochar-based materials as a result of their environmental sustainability and simplicity of modification [14]. Porous structures that are suitable for PFOA adsorption have been developed through the use of chemical activation methods, including KOH, H3PO4, and ZnCl2 [33]. Nevertheless, the pore size distribution, surface chemistry, and activation conditions of biochar-based adsorbents have significantly impacted their efficiency.
The current study expands upon these developments by examining biochar made from camelina meal (CM) as a sustainable feedstock for the remediation of PFOA. The surface area (1558 m2/g) and adsorption efficiency (92.3%) were significantly enhanced by the chemical activation method employing KOH; thereby, highly comparable results are found in the literature for high-performance activated carbons. These results confirm that maximum adsorption effectiveness requires activation at 800 °C for 60 min with a KOH-to-feed ratio of 1.5. While this study employed batch adsorption, the biochar’s high surface area (1558 m2/g) and optimized porosity make it suitable for integration into packed-bed or fluidized-bed systems. Compared to commercial activated carbon, this biochar offers a cost-effective and sustainable alternative, utilizing an agricultural byproduct with lower energy input during activation.
Despite these promising results, there are several challenges in optimizing biochar activation for large-scale applications. The capacity of activated biochar to be regenerated for several adsorption cycles determines its long-term viability. Investigating thermal and chemical regeneration methods would help to evaluate adsorption stability across several usages [44]. Moving laboratory-scale results into industrial environments calls for optimizing continuous adsorption and regeneration techniques. Large-scale feasibility should be assessed by fixed-bed column studies, techno-economic analysis, and life cycle assessments [42].

5. Conclusions

This study effectively demonstrates the potential of chemically activated camelina meal (CM) biochar for the adsorption of perfluorooctanoic acid (PFOA) from contaminated water, achieving a removal efficiency of 92.3%.
The camelina meal biochar was activated using potassium hydroxide (KOH) as the activating agent under the parameters as determined by the CC-RSM model using Design-Expert software (Version 11). The optimal conditions of 800 °C for 60 min with a KOH-to-feed ratio of 1.5, resulted in a high surface area of 1558 m2/g, an average pore size of 3.6 nm, and a yield of 51%. The activation process enhanced the physicochemical properties of the biochar, including an increased carbon content of 86%, a low oxygen content of 6.9%, and improved structural stability, as validated through BET surface analysis, FTIR spectroscopy, and scanning electron microscopy. During the adsorption of PFOA by the optimized camelina meal biochar, the biochar exhibited rapid adsorption kinetics, achieving equilibrium within 4–5 h, and demonstrated superior adsorption capacity due to its microporous structure and diverse functional groups such as C=O, –OH, and aromatic carbons. Compared to inactivated biochar, the activated biochar showed a significantly enhanced adsorption capacity during the adsorption, removing over 90% of PFOA at an adsorbent dosage of 150 mg in 100 mL of 5 ppm PFOA solution, with further optimization achieving adsorption capacities of up to 93.1 mg/g. Camelina meal, an agro-industrial byproduct, provides a renewable and cost-effective feedstock, underscoring the sustainability of this approach for addressing persistent organic pollutants. This study establishes chemically activated CM biochar as a viable alternative to conventional adsorbents, offering practical solutions for water remediation, and highlights the need for further research on scalability, long-term stability, and regeneration to enhance its applicability for diverse environmental challenges. Compared to commercial activated carbon, this biochar offers a sustainable alternative, utilizing an agricultural byproduct. Future research should focus on pilot-scale implementation to optimize continuous adsorption systems, assess long-term performance and optimum generation processes, and evaluate the cost benefits for large-scale applications.

Author Contributions

Conceptualization, S.J. and A.K.D.; methodology, S.J. and F.P.; software, S.J., F.P., O.Z., B.A. and A.K.D.; validation, S.J. and F.P.; formal analysis, S.J. and F.P.; investigation, S.J. and F.P.; resources, O.Z., B.A. and A.K.D.; data curation, S.J. and F.P.; writing—original draft preparation, S.J.; writing—review and editing, S.J., F.P., B.A., O.Z. and A.K.D.; visualization, S.J. and F.P.; supervision, O.Z., B.A. and, A.K.D.; project administration, A.K.D.; funding acquisition, A.K.D. All authors have read and agreed to the published version of the manuscript.

Funding

The authors would like to thank the Natural Sciences and Engineering Research Council of Canada (NSERC), the Canada Research Chairs (CRC) program, Agriculture and Agri-Food Canada (AAFC), and BioFuelNet Canada for funding this bioenergy research.

Institutional Review Board Statement

Not applicable.

Informed Consent Statement

Not applicable.

Data Availability Statement

Data are contained within the article.

Conflicts of Interest

The authors declare no conflicts of interest.

References

  1. Hsiao, C.H.; Gupta, S.; Lee, C.Y.; Tai, N.H. Effects of physical and chemical activations on the performance of biochar applied in supercapacitors. Appl. Surf. Sci. 2023, 610, 155560. [Google Scholar] [CrossRef]
  2. Han, L.; Sun, K.; Yang, Y.; Xia, X.; Li, F.; Yang, Z.; Xing, B. Biochar’s stability and effect on the content, composition and turnover of soil organic carbon. Geoderma 2020, 364, 114184. [Google Scholar] [CrossRef]
  3. Jha, S.; Pattnaik, F.; Nanda, S.; Zapata, O.; Acharya, B.; Dalai, A.K. Investigations of thermal effects during pyrolysis of agro-forestry biomass and physicochemical characterizations of biofuel products. Biocatal. Agric. Biotechnol. 2024, 61, 103379. [Google Scholar] [CrossRef]
  4. Bedia, J.; Peñas-Garzón, M.; Gómez-Avilés, A.; Rodriguez, J.J.; Belver, C. Review on activated carbons by chemical activation with FeCl3. C 2020, 6, 21. [Google Scholar] [CrossRef]
  5. Abioye, A.M.; Ani, F.N. Recent development in the production of activated carbon electrodes from agricultural waste biomass for supercapacitors: A review. Renew. Sustain. Energy Rev. 2015, 52, 1282–1293. [Google Scholar] [CrossRef]
  6. Serafin, J.; Dziejarski, B.; Junior, O.F.C.; Sreńscek-Nazzal, J. Design of highly microporous activated carbons based on walnut shell biomass for H2 and CO2 storage. Carbon 2023, 201, 633–647. [Google Scholar] [CrossRef]
  7. Trakal, L.; Šigut, R.; Šillerová, H.; Faturíková, D.; Komárek, M. Copper removal from aqueous solution using biochar: Effect of chemical activation. Arab. J. Chem. 2014, 7, 43–52. [Google Scholar] [CrossRef]
  8. Angın, D.; Altintig, E.; Köse, T.E. Influence of process parameters on the surface and chemical properties of activated carbon obtained from biochar by chemical activation. Bioresour. Technol. 2013, 148, 542–549. [Google Scholar] [CrossRef]
  9. Liu, H.; Xu, G.; Li, G. Preparation of porous biochar based on pharmaceutical sludge activated by NaOH and its application in the adsorption of tetracycline. J. Colloid Interface Sci. 2021, 587, 271–278. [Google Scholar] [CrossRef]
  10. Yorgun, S.; Vural, N.; Demiral, H. Preparation of high-surface area activated carbons from Paulownia wood by ZnCl2 activation. Microporous Mesoporous Mater. 2009, 122, 189–194. [Google Scholar] [CrossRef]
  11. Bell, E.M.; De Guise, S.; McCutcheon, J.R.; Lei, Y.; Levin, M.; Li, B.; Rusling, J.F.; Lawrence, D.A.; Cavallari, J.M.; O’Connell, C.; et al. Exposure, health effects, sensing, and remediation of the emerging PFAS contaminants–Scientific challenges and potential research directions. Sci. Total Environ. 2021, 780, 146399. [Google Scholar] [CrossRef]
  12. Choudhary, A.; Dong, D.; Tsianou, M.; Alexandridis, P.; Bedrov, D. Adsorption mechanism of perfluorooctanoate on cyclodextrin-based polymers: Probing the synergy of electrostatic and hydrophobic interactions with molecular dynamics simulations. ACS Mater. Lett. 2022, 4, 853–859. [Google Scholar] [CrossRef]
  13. Liu, Z.; Yang, F.; Zhai, T.; Yu, J.; Wang, C.; Liu, Z.; Liu, Z.; Gao, Y.; Yang, M. Removal of PFOA from water by activated carbon adsorption: Influence of pore structure. J. Environ. Chem. Eng. 2024, 12, 113923. [Google Scholar] [CrossRef]
  14. Sajjadi, B.; Chen, W.Y.; Egiebor, N.O. A comprehensive review on physical activation of biochar for energy and environmental applications. Rev. Chem. Eng. 2019, 35, 735–776. [Google Scholar] [CrossRef]
  15. Jha, S.; Nanda, S.; Acharya, B.; Dalai, A.K. Introduction to sustainability science in addressing energy security and achieving sustainable development goals. In Biomass to Bioenergy; Woodhead Publishing: Sawston, UK, 2024; pp. 1–14. [Google Scholar]
  16. Arora, A.; Jha, S.; Saini, V. Aspects of green-sustainable tribology and its impacts on future product development: A review. Ecol. Environ. Conserv. 2019, 25, S146–S157. [Google Scholar]
  17. ASTM D3175-11; Test Method for Volatile Matter in the Analysis Sample of Coal and Coke. ASTM International: West Conshohocken, PA, USA, 2011.
  18. ASTM E1755-01; Standard Test Method for Ash in Biomass. ASTM International: West Conshohocken, PA, USA, 2007.
  19. ASTM E871-82; Standard Test Method for Moisture Analysis of Particulate Wood Fuels. ASTM International: West Conshohocken, PA, USA, 2006.
  20. Patra, B.R.; Nanda, S.; Dalai, A.K.; Meda, V. Taguchi-based process optimization for activation of agro-food waste biochar and performance test for dye adsorption. Chemosphere 2021, 285, 131531. [Google Scholar] [CrossRef]
  21. Okolie, J.A.; Mukherjee, A.; Nanda, S.; Dalai, A.K.; Kozinski, J.A. Catalytic supercritical water gasification of soybean straw: Effects of catalyst supports and promoters. Ind. Eng. Chem. Res. 2021, 60, 5770–5782. [Google Scholar] [CrossRef]
  22. Behnami, A.; Pourakbar, M.; Ayyar AS, R.; Lee, J.W.; Gagnon, G.; Benis, K.Z. Treatment of Aqueous Per-and Poly-Fluoroalkyl Substances: A Review of Biochar Adsorbent Preparation Methods. Chemosphere 2024, 357, 142088. [Google Scholar] [CrossRef]
  23. Mafu, L.D. Chemical and Structural Changes of Biomass During Pyrolysis and the Influence on Gasification Reactivity in Coal-Biomass Blends. Ph.D. Dissertation, North-West University, Potchefstroom, South Africa, 2018. [Google Scholar]
  24. Jha, A.; Amar, V.; Tukkaraja, P. Investigation on fire potential of ventilation ducts. J. Sustain. Min. 2019, 18, 270–276. [Google Scholar] [CrossRef]
  25. Margellou, A.G.; Pappa, C.P.; Psochia, E.A.; Petala, M.D.; Triantafyllidis, K.S. Mild isolation and characterization of surface lignin from hydrothermally pretreated lignocellulosic forestry and agro-industrial waste biomass. Sustain. Chem. Pharm. 2023, 33, 101056. [Google Scholar] [CrossRef]
  26. Fu, K.; Huang, J.; Luo, F.; Fang, Z.; Yu, D.; Zhang, X.; Wang, D.; Xing, M.; Luo, J. Understanding the Selective Removal of Perfluoroalkyl and Polyfluoroalkyl Substances via Fluorine–Fluorine Interactions: A Critical Review. Environ. Sci. Technol. 2024, 58, 16669–16689. [Google Scholar] [CrossRef] [PubMed]
  27. Kumar, M.; Mishra, P.K.; Upadhyay, S.N. Pyrolysis of Saccharum munja: Optimization of process parameters using response surface methodology (RSM) and evaluation of kinetic parameters. Bioresour. Technol. Rep. 2019, 8, 100332. [Google Scholar] [CrossRef]
  28. Liu, L.; Liu, Y.; Gao, B.; Ji, R.; Li, C.; Wang, S. Removal of perfluorooctanoic acid (PFOA) and perfluorooctane sulfonate (PFOS) from water by carbonaceous nanomaterials: A review. Crit. Rev. Environ. Sci. Technol. 2020, 50, 2379–2414. [Google Scholar] [CrossRef]
  29. Schneider, E.; Czech, H.; Popovicheva, O.; Chichaeva, M.; Kobelev, V.; Kasimov, N.; Minkina, T.; Rüger, C.P.; Zimmermann, R. Mass spectrometric analysis of unprecedented high levels of carbonaceous aerosol particles long-range transported from wildfires in the Siberian Arctic. Atmos. Chem. Phys. 2024, 24, 553–576. [Google Scholar] [CrossRef]
  30. He, Z.; Guo, M.; Fortier, C.; Cao, X.; Schmidt-Rohr, K. Fourier Transform Infrared and Solid State 13C Nuclear Magnetic Resonance Spectroscopic Characterization of Defatted Cottonseed Meal-Based Biochars. 2020. Available online: https://papers.ssrn.com/sol3/papers.cfm?abstract_id=3598083 (accessed on 28 January 2025).
  31. Romero, C.M.; Redman, A.A.P.H.; Terry, S.A.; Hazendonk, P.; Hao, X.; McAllister, T.A.; Okine, E. Molecular speciation and aromaticity of biochar-manure: Insights from elemental, stable isotope and solid-state DPMAS 13C NMR analyses. J. Environ. Manag. 2021, 280, 111705. [Google Scholar] [CrossRef]
  32. Xiao, F. A review of biochar functionalized by thermal air oxidation. Environ. Funct. Mater. 2022, 1, 187–195. [Google Scholar] [CrossRef]
  33. Zhao, C.; Ge, L.; Wang, R.; Chu, H.; Mai, L.; Zha, W.; Wang, Y.; Xu, C. Effects of cellulose addition on the physicochemical properties, pore structure and iodine adsorption of lignin-based biochar. Fuel 2023, 352, 129061. [Google Scholar] [CrossRef]
  34. Sakhiya, A.K.; Aier, I.; Pathak, S.; Anand, A.; Jha, S.; Vijay, V.K.; Kaushal, P. Copper (II) removal from aqua solution using rice straw derived biochar. Mater. Today Proc. 2021, 43, 740–745. [Google Scholar] [CrossRef]
  35. Wang, L.; Ok, Y.S.; Tsang, D.C.; Alessi, D.S.; Rinklebe, J.; Mašek, O.; Bolan, N.S.; Hou, D. Biochar composites: Emerging trends, field successes and sustainability implications. Soil Use Manag. 2022, 38, 14–38. [Google Scholar] [CrossRef]
  36. Gao, R.; Ding, S.; Liu, Z.; Jiang, H.; Liu, G.; Fang, J. Recent advances and perspectives of biochar for livestock wastewater: Modification methods, applications, and resource recovery. J. Environ. Chem. Eng. 2024, 12, 113678. [Google Scholar] [CrossRef]
  37. Leung SC, E.; Shukla, P.; Chen, D.; Eftekhari, E.; An, H.; Zare, F.; Ghasemi, N.; Zhang, D.; Nguyen, N.; Li, Q. Emerging technologies for PFOS/PFOA degradation and removal: A review. Sci. Total Environ. 2022, 827, 153669. [Google Scholar] [CrossRef]
  38. Wu, Y.; Qi, L.; Chen, G. A mechanical investigation of perfluorooctane acid adsorption by engineered biochar. J. Clean. Prod. 2022, 340, 130742. [Google Scholar] [CrossRef]
  39. Hassan, M.; Liu, Y.; Naidu, R.; Du, J.; Qi, F. Adsorption of Perfluorooctane sulfonate (PFOS) onto metal oxides modified biochar. Environ. Technol. Innov. 2020, 19, 100816. [Google Scholar] [CrossRef]
  40. Mulabagal, V.; Baah, D.A.; Egiebor, N.O.; Sajjadi, B.; Chen, W.Y.; Viticoski, R.L.; Hayworth, J.S. Biochar from biomass: A strategy for carbon dioxide sequestration, soil amendment, power generation, CO2 utilization, and removal of perfluoroalkyl and polyfluoroalkyl substances (PFAS) in the environment. In Handbook of Climate Change Mitigation and Adaptation; Springer International Publishing: Cham, Switzerland, 2022; pp. 1023–1085.4. [Google Scholar]
  41. Lin, S.; Kedzior, S.A.; Zhang, J.; Yu, M.; Saini, V.; Huynh, R.P.; Shimizu GK, H.; Trifkovic, M. A superprotonic membrane derived from proton-conducting metal-organic frameworks and cellulose nanocrystals. Chem 2023, 9, 2547–2560. [Google Scholar] [CrossRef]
  42. Zhang, Y.; Tan, X.; Lu, R.; Tang, Y.; Qie, H.; Huang, Z.; Zhao, J.; Cui, J.; Yang, W.; Lin, A. Enhanced removal of polyfluoroalkyl substances by simple modified biochar: Adsorption performance and theoretical calculation. ACS ES&T Water 2023, 3, 817–826. [Google Scholar]
  43. Deng, S.; Zhang, Q.; Nie, Y.; Wei, H.; Wang, B.; Huang, J.; Yu, G.; Xing, B. Sorption mechanisms of perfluorinated compounds on carbon nanotubes. Environ. Pollut. 2012, 168, 138–144. [Google Scholar] [CrossRef]
  44. Trivedi, Y.; Sharma, M.; Mishra, R.K.; Sharma, A.; Joshi, J.; Gupta, A.B.; Achintya, B.; Shah, K.; Vuppaladadiyamd, A.K. Biochar potential for pollutant removal during wastewater treatment: A comprehensive review of separation mechanisms, technological integration, and process analysis. Desalination 2025, 600, 118509. [Google Scholar] [CrossRef]
Figure 1. Graphical comparison between experimental and predicted values of surface area (m2/g) for activated KOH biochar.
Sustainability 17 02170 g001
Figure 2. The interaction between temperature and time and their effects on the surface area of the activated carbon (The red dots are the data points above the plot whereas the pink dots are the data points below the plot).
Sustainability 17 02170 g002
Figure 3. The interaction between temperature and chemical-to-feed ratio and their effects on the surface area of the activated carbon (The red dots are the data points above the plot whereas the pink dots are the data points below the plot).
Sustainability 17 02170 g003
Figure 4. The interaction between time and chemical-to-feed ratio and their effects on the surface area of the activated carbon (The red dots are the data points above the plot whereas the pink dots are the data points below the plot).
Sustainability 17 02170 g004
Figure 5. The optimized conditions and predicted response for the chemical activation of the camelina meal biochar.
Sustainability 17 02170 g005
Figure 6. FTIR spectra of the activated carbon showing significantly substantial results in the adsorption experiments.
Sustainability 17 02170 g006
Figure 7. NMR spectra of the activated carbon showing significantly substantial results in the adsorption experiments.
Sustainability 17 02170 g007
Figure 8. SEM micrographs revealing the morphology of (a) camelina meal biomass, (b) camelina meal biochar prepared at 450 °C, (c) KOH-activated camelina meal biochar, and (d) KOH-activated camelina meal biochar after PFOA adsorption.
Sustainability 17 02170 g008
Figure 9. Effect of adsorbent dosage on PFOA removal efficiency of KOH-activated carbon and CM biochar.
Sustainability 17 02170 g009
Figure 10. Effect of time on (a) PFOA concentration and (b) removal efficiency of KOH-activated carbon and CM Biochar.
Sustainability 17 02170 g010aSustainability 17 02170 g010b
Table 1. Screening of different chemical agents for activation of camelina meal biochar.
Chemical AgentsTemperature (°C)Time (min)RatioC (wt.%)H (wt.%)N (wt.%)S (wt.%)O (wt.%)Specific Surface Area (m2/g)HHV
K2CO380060169.91.75.10.313.0351124.7
KOH80060187.40.40.80.114.2149328.4
NaOH80060182.60.40.80.0316.295626.6
Table 2. CCD model for chemical activation of biochar with surface area as the response, yield, ultimate analysis (C,H,N,S,O), and mass ratios (O/C, H/C).
RunSample NameCCD ParametersYield
(wt. %)
C (wt.%)H (wt.%)N (wt.%)S (wt.%)O (wt.%)O/CH/C
Factor 1:
Temperature
(°C)
Factor 2:
Time
(min)
Factor 3:
Chemical-to-Feed Ratio
Response:
Specific Surface Area
(m2/g)
14CM-KOH-600-60-0.5600600.560164.5643.18.10.210.40.160.05
3CM-KOH-600-60-1.5600601.583966.367.41.66.80.410.70.160.02
2CM-KOH-600-90-1 60090182965.168.31.94.30.711.60.170.03
19CM-KOH-600-120-0.56001200.569460.067.91.47.50.48.60.130.02
10CM-KOH-600-120-1.56001201.584764.069.81.65.40.69.00.130.02
8CM-KOH-700-60-170060198159.076.71.010.80.0510.20.130.01
18CM-KOH-700-90-0.5700900.598355.370.90.82.70.410.50.150.01
1CM-KOH-700-90-1700901110657.7750.93.80.19.00.120.01
9CM-KOH-700-90-1700901110058.175.51.23.90.27.50.100.02
15CM-KOH-700-90-1700901108057.274.71.51.00.19.50.130.02
16CM-KOH-700-90-1700901108157.575.21.50.90.110.60.140.02
20CM-KOH-700-90-1700901110956.476.31.41.30.058.20.110.02
13CM-KOH-700-90-1700901110758.972.61.12.80.210.20.140.01
12CM-KOH-700-90-1.5700901.5111657.574.41.033.40.19.00.120.01
6CM-KOH-700-120-17001201111156.482.80.73.30.29.20.040.01
7CM-KOH-800-60-0.5800600.5143549.0790.63.80.410.40.070.01
11CM-KOH-800-60-1.5800601.5155851.0860.51.00.16.90.030.01
5CM-KOH-800-90-1800901159848.672.81.23.60.19.50.130.02
17CM-KOH-800-120-0.58001200.5156344.076.90.85.60.48.90.050.01
4CM-KOH-800-120-1.58001201.5168048.773.91.46.010.26.10.080.02
Table 3. Statistical parameters for the proposed regression model.
Std. Dev.20.16R20.997
Mean1120.76Adjusted R20.995
C.V. %1.80Predicted R20.979
Adequate Precision73.9
Table 4. Analysis of variance (ANOVA) of various statistical parameters of the regression model.
SourceSum of SquaresdfMean SquareF-Valuep-ValueRemark
Model1,756,0009195,100480.09<0.0001Significant
A: Temperature1,619,00011,619,0003983.34<0.0001
B: Time22,992.02122,992.0256.58<0.0001
C: Chemical-to-Feed58,369.60158,369.60143.63<0.0001
AB2782.5812782.586.850.0257
AC2827.5212827.526.960.0248
BC1071.8411071.842.640.1354
A246,377.55146,377.55114.12<0.0001
B23823.2513823.259.410.0119
C23185.8013185.807.840.0188
Residual4063.8610406.39
Lack of Fit3123.045624.613.320.1070Not significant
Pure Error940.825188.16
Corrected Total1,760,00019
Table 5. The screening of the PFOA adsorption by utilizing different activated carbon samples generated from the different activation batches.
RunSample NameSpecific Surface Area (m2/g)Pore Volume
(cm3/g)
Average Pore Size
(nm)
Removal Efficiency
(%)
14CM-KOH-600-60-0.56010.32.162.2
3CM-KOH-600-60-1.58390.52.563.3
2CM-KOH-600-90-18290.52.665.8
19CM-KOH-600-120-0.56940.42.261.0
10CM-KOH-600-120-1.58470.62.868.7
8CM-KOH-700-60-19810.72.765.8
18CM-KOH- 700-90-0.59830.72.869.7
1CM-KOH- 700-90-111060.93.379.7
9CM-KOH-700-90-111000.8372.7
15CM-KOH-700-90-110800.83.175.7
16CM-KOH-700-90-110810.83.174.1
20CM-KOH-700-90-111090.72.765.1
13CM-KOH-700-90-1.511070.82.970.8
12CM-KOH-700-90-1.511160.93.277.8
6CM-KOH-700-120-111110.93.278.6
7CM-KOH-800-60-0.514351.23.484.3
11CM-KOH-800-60-1.515581.43.692.3
5CM-KOH-800-90-115981.33.485.3
17CM-KOH-800-120-0.515631.33.382.7
4CM-KOH-800-120-1.516801.43.486.1
Table 6. Effect of change in adsorbent dosage on removal efficiency of CM biochar and KOH-activated carbon.
Adsorbent Dosage
(mgL−1)
Removal Efficiency: CM Biochar
(%)
Removal Efficiency: KOH-Activated Carbon
(%)
506493.1
10067.695
15068.696.1
Table 7. Comparative study of PFAS adsorption research with our work.
Feedstock/Biochar TypeActivation/EngineeringMax Adsorption CapacityOther FindingsReference
Switchgrass, Water Oak, BiosolidFeCl3 impregnation, carbon nanotubes52.1 µmol/g (biochar)Fe-engineered biochar improves the porosity and surface area; carbon nanotubes increase surface functionality.[35]
Sludge 45.88 mg/gFunctional group optimization plays a critical role under acidic conditions.[36]
Red Mud and SawdustMetal oxide modification, pyrolysis at 600 °C194.6 mg/g (metal-modified biochar)Enhanced graphitic structure and protonated metal-based functional groups boost adsorption at pH 3.1.[37]
Camelina MealChemical activation using KOH93.1 mg/gAimed to maximize surface area via steam flow optimization; focused on PFAS adsorption metrics.This study
Disclaimer/Publisher’s Note: The statements, opinions and data contained in all publications are solely those of the individual author(s) and contributor(s) and not of MDPI and/or the editor(s). MDPI and/or the editor(s) disclaim responsibility for any injury to people or property resulting from any ideas, methods, instructions or products referred to in the content.

