Abstract
As a significant source of greenhouse gas emissions, objectively understanding the quantity of emissions from the livestock industry and their spatiotemporal evolution is crucial for advancing low-carbon and green development in regional livestock industries. Therefore, based on the Life Cycle Assessment (LCA) method, this study estimated greenhouse gas emissions from the livestock industry across 11 municipal regions in Jiangxi Province from 2002 to 2022, revealing the spatiotemporal characteristics of these emissions. The study also employed the Logarithmic Mean Divisia Index (LMDI) model to analyze the influencing factors. The results showed that (1) between 2002 and 2022, total greenhouse gas emissions from Jiangxi Province’s livestock industry exhibited an upward trend, increasing from 13.52 million tons to 21.27 million tons, with an average annual growth rate of 2.36%. (2) During the study period, the spatial patterns of super-high-emission and light-emission zones remained relatively stable, while medium and heavy emission zones showed dynamic evolution. (3) Intensity effects, agricultural structural effects, and rural population size played a suppressive role in livestock greenhouse gas emissions, while regional development levels and urbanization levels were key drivers of increased emissions. Therefore, governments should accelerate the implementation of clean production models, enhance technological innovation, promote pollution reduction at the source, and develop differentiated livestock development strategies based on regional resource endowments and demographic–economic characteristics.
1. Introduction
Global warming is one of the most severe challenges currently facing humanity [1]. To address climate change, China proposed at the 75th session of the United Nations General Assembly the strategic goals of achieving carbon peaking by 2030 and carbon neutrality by 2060 [2]. However, nearly one-quarter of greenhouse gas emissions originate from agricultural production systems [3], with emissions from enteric fermentation and manure management in livestock and poultry farming accounting for approximately 40% of total agricultural greenhouse gas emissions [4]. This makes livestock farming a significant source of greenhouse gas emissions, with substantial implications for climate change. In 2022, the Ministry of Agriculture and Rural Affairs and the National Development and Reform Commission jointly released the “Implementation Plan for Agricultural and Rural Carbon Reduction and Sequestration” [5]. In the same year, Jiangxi Province issued its own implementation plan, which explicitly outlined 10 initiatives, including low-carbon emission reduction in livestock and the enhancement of farmland carbon sinks [6]. Centered on “carbon reduction and emission mitigation”, these policies aim to establish an eco-development system integrating the livestock industry with a low-carbon environment. At present, many scholars have conducted research on carbon emissions generated by the livestock industry, focusing primarily on the following aspects: (1) constructing accounting systems for livestock carbon emissions and estimating their quantities. Domestic and international scholars widely adopt methods such as the IPCC (Intergovernmental Panel on Climate Change) emission factor approach, Input–Output Analysis (IOA), and Life Cycle Assessment (LCA) to estimate livestock greenhouse gas emissions from various regional perspectives. For instance, Meng et al. [7], Yao et al. [8], and Li et al. [9] used the LCA method to estimate greenhouse gas emissions from livestock in different regions and periods in China. Gu et al. [10] used the emission factor method to estimate carbon emissions from China’s livestock industry between 2001 and 2017. (2) Analyzing the spatiotemporal patterns of livestock carbon emissions. Methods such as standard deviation ellipse analysis [11], spatial autocorrelation analysis, and kernel density analysis [12] are commonly used to examine these patterns. For example, Xu et al. [13] used change indices, gravity center models, and standard deviation ellipse analysis to study the spatiotemporal patterns of livestock carbon emissions in China, revealing significant inter-provincial differences. (3) Examining the driving mechanisms of livestock carbon emissions. Zhou et al. [14] developed a spatial panel regression model to analyze the factors influencing the spatiotemporal evolution of agricultural carbon emissions in Hebei Province, identifying agricultural economic development as the primary driving factor. Li et al. [15] employed a geographically weighted regression model to investigate the factors influencing carbon emissions.
In summary, researchers have utilized various estimation methods and explored influencing factors from multiple perspectives to enhance the adaptability of China’s agricultural production to climate change and achieve low-carbon agriculture. Existing research on livestock carbon emissions has yielded numerous findings and provided valuable insights and methodologies for subsequent studies. However, most of these studies focus on macro-scale analyses, with limited attention to regional differences in resource endowments and their impact on agricultural carbon emissions. Furthermore, current regional studies typically focus on grassland-based livestock systems in areas such as Xinjiang and Heilongjiang, with limited research on intensive livestock systems in agricultural regions of central and eastern China. As a representative agricultural province in central and eastern China, Jiangxi Province holds significant importance for livestock research. This study, adopting a life cycle perspective, establishes and defines the system boundary for livestock greenhouse gas emissions. Building on previous research findings, it extends the study period to comprehensively analyze the spatial characteristics and dynamic trends of total livestock greenhouse gas emissions in Jiangxi Province, employing the Logarithmic Mean Divisia Index (LMDI) model to explore influencing factors. The findings aim to provide a theoretical foundation and practical support for advancing low-carbon emission reductions in the livestock industry and achieving green circular development.
2. Materials and Methods
2.1. Study Area Overview
Jiangxi Province (24°29′–30°04′ N, 113°34′–118°28′ E) is located on the southern bank of the junction of the middle and lower reaches of the Yangtze River, with a total area of 16.69 × 10⁴ km2 (Figure 1). The topography is predominantly mountainous and hilly, with mountains surrounding the southeast, south, and west, while the northern part consists of the Poyang Lake Plain. The central region is characterized by hills and river valley plains. This region enjoys ample sunlight and abundant rainfall, featuring a typical subtropical monsoon humid climate. The average annual temperature is 19.0 °C, with an average annual precipitation of 1896.8 mm and an average annual sunshine duration of 1478.6 h. In 2022, the total output value of agriculture, forestry, animal husbandry, and fishery in Jiangxi Province was 422.38 × 10⁹ yuan, of which the value of animal husbandry was 109.44 × 10⁹ yuan, accounting for 25.91%. The total livestock inventory was 631.46 million head, with 265.05 million head slaughtered, and the production of livestock and poultry products reached 43.77 million tons.
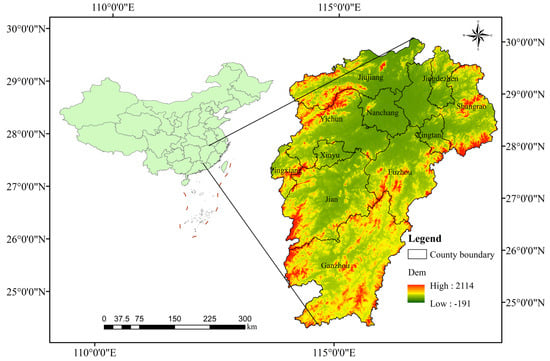
Figure 1.
Overview of the study area.
2.2. Estimation of Greenhouse Gas Emissions from Livestock
The Life Cycle Assessment (LCA) method, based on the “cradle-to-grave” principle, quantitatively evaluates the environmental impact of raw material acquisition, livestock product production, and post use of livestock products, providing a scientific basis for assessing carbon emissions from the livestock industry. As an effective environmental management tool, the Life Cycle Assessment method has been widely applied in carbon emission studies [16,17,18]. To comprehensively estimate greenhouse gas emissions from Jiangxi Province’s livestock industry, this study references the research findings of Meng et al. [7], Yao et al. [8], and Li et al. [9], while taking into account the current state of intensive livestock development in Jiangxi Province. Livestock carbon emissions are divided into six stages: feed grain cultivation, feed grain transportation and processing, livestock enteric fermentation, manure management systems, livestock and poultry rearing, and livestock product processing (Figure 2). Using relevant emission factors, the total greenhouse gas emissions from Jiangxi Province’s livestock industry were calculated.
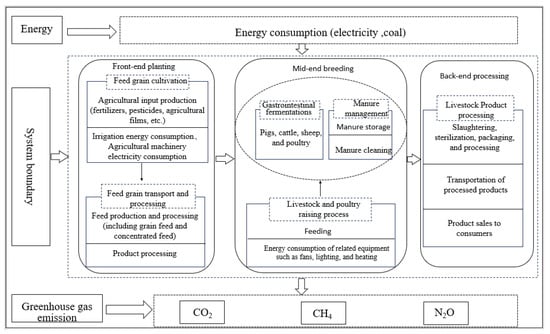
Figure 2.
System boundary.
2.2.1. Life Cycle-Based Greenhouse Gas Estimation for Livestock
Estimation of Greenhouse Gas Emissions from Upstream Livestock Feed Cultivation
- (1)
- Feed Grain Cultivation.
Livestock feed generally includes two types: roughage and concentrate. Roughage, being a by-product of primary processing, has negligible greenhouse gas emissions, so this study focuses only on concentrate feed. Concentrate feed mainly includes wheat, corn, and soybean meal. Due to the significant greenhouse gas emissions from activities such as fertilizer, pesticide, and plastic film usage during feed grain cultivation, these activities are included within the system boundary.
is the CO2 emission generated during the cultivation of feed grains (ten thousand tons); denotes the annual production of livestock and poultry products (ten thousand tons). Due to the different types of livestock products, annual output varies with inter-annual changes, so the value of is not a fixed unique value. Therefore, the values for different years are sourced from the “Jiangxi Province Statistical Yearbook 2003–2023”; represents the feed consumption coefficient per unit of livestock product, referring to the amount of feed required for unit weight gain or unit product output. The value of fluctuates over time due to inter-annual variations. To ensure research rigor, values for different years are determined based on official data in combination with the actual conditions of the study area. Specifically, is calculated as the total feed intake of animals during a given period divided by the total output of animal products (e.g., meat, eggs, and milk) during the same period. The total feed consumption data are sourced from the ”Compilation of National Agricultural Product Cost and Income Data (2003–2023)”, while the livestock product output data are obtained from the “Jiangxi Province Statistical Yearbook 2003–2023”; is the proportion of different grains in feed (Table 1); is the CO2 equivalent coefficient of grain cultivation (Table 2).

Table 1.
Percentage of corn, soybean cake, and wheat in livestock concentrate feeds (%).
Table 2.
Diverse factors and coefficients to determine GHG emissions.
- (2)
- Transportation and Processing of Feed Grains.
Feed ingredients typically undergo a series of processes, including drying, screening, transportation, crushing, blending, and mixing, to produce the necessary feed for livestock. Therefore, the GHG emissions resulting from energy consumption during these production processes must also be included within the system boundaries.
is the CO2 emissions generated during the transportation and processing of feed grains (ten thousand tons); denotes the annual production of livestock and poultry products (ten thousand tons). Due to the different types of livestock products, the annual output varies with inter-annual changes, so the value of is not a fixed unique value. Therefore, the values for different years are sourced from the “Jiangxi Province Statistical Yearbook 2003–2023”; represents the feed consumption coefficient per unit of livestock product, referring to the amount of feed required for unit weight gain or unit product output. The value of fluctuates over time due to inter-annual variations. To ensure research rigor, values for different years are determined based on official data in combination with the actual conditions of the study area. Specifically, is calculated as the total feed intake of animals during a given period divided by the total output of animal products (e.g., meat, eggs, and milk) during the same period. The total feed consumption data are sourced from the” Compilation of National Agricultural Product Cost and Income Data (2003–2023)”, while the livestock product output data are obtained from the “Jiangxi Province Statistical Yearbook 2003–2023”; is the proportion of different grains in feed (Table 1); and is the carbon emission coefficient per unit of feed crops (Table 2).
Measurement of Greenhouse Gas Emissions from Mid-Range Farming in the Livestock Sector
- (1)
- Livestock gastrointestinal fermentation.
The rumen of ruminants (cattle and sheep) produces large amounts of CH4 and other greenhouse gases, while methane emissions from non-ruminants and monogastric livestock (pigs) are very low, in addition to the negligible amount of CH4 in the stomach and intestines of poultry.
is the emission of from gastrointestinal fermentation of livestock and poultry (ten thousand tons); represents the annual average livestock feeding quantity (ten thousand head). For livestock with an average feeding cycle of less than one year, the annual average feeding quantity is calculated as the livestock’s feeding cycle × annual slaughter quantity/365. For livestock with a feeding cycle greater than one year, the livestock inventory at the end of the year is used as the annual average feeding quantity [23]. The average feeding cycles for pigs, sheep, and poultry are 200, 210, and 55 days, respectively [24]; is the emission coefficient of the fermentation of gastrointestinal tract for the generation of (Table 3); is the global warming potential of (Table 2).
Table 3.
GHG emission factors for gastrointestinal fermentation and manure management systems for livestock and poultry.
- (2)
- Manure management systems.
During manure management and storage, degradation of manure occurs in anaerobic environments to produce CH4, while in aerobic environments N2O is mainly produced, so GHG emissions from manure management systems mainly include CH4 and N2O.
is the emission of from the manure management system (ten thousand tons); represents the annual average livestock feeding quantity (ten thousand head). is the emission factor of from the manure management system (Table 3); and is the global warming potential (Table 2).
is the emission of N2O from the manure management system (ten thousand tons); is the average annual stocking size of livestock (ten thousand head); is the emission factor of N2O produced from the manure management system (Table 3); and GWPN2O is the global warming potential of N2O (Table 2).
is the GHG emissions generated in the manure management system.
- (3)
- Livestock and poultry rearing.
Livestock and poultry farming consumes a large amount of energy; for example, energy consumption for ventilation and heat dissipation in pens, cold-proof heating, lighting, etc. will directly or indirectly lead to greenhouse gas emissions.
is the CO2 emission generated from livestock and poultry rearing (ten thousand tons); , are the expenditure on electricity and coal per head of livestock in the unit rearing cycle (yuan). and fluctuate over time due to inter-annual variations. To ensure research rigor, data for different years are obtained from the ”Compilation of National Agricultural Product Cost and Income Data (2003–2023)”, considering the actual conditions of Jiangxi Province; is the average annual stocking size of livestock (ten thousand head); , are the unit price of electricity and coal for livestock and poultry rearing (yuan) (Table 2); , are the GHG emission coefficients of electricity and coal consumption, respectively (Table 2).
Measurement of Greenhouse Gas Emissions from Back-End Processing in the Livestock Industry
- (1)
- Greenhouse gas emissions from livestock product processing.
In the process of transporting and processing livestock and poultry into livestock products, a large amount of energy consumption will be generated, so it will also lead to the generation of greenhouse gases.
is the total amount of CO2 in the processing of livestock products (ten thousand tons); denotes the annual production of livestock and poultry products (ten thousand tons). Due to the different types of livestock products, the annual output varies with inter-annual changes, so the value of is not a fixed unique value. Therefore, the values for different years are sourced from the “Jiangxi Province Statistical Yearbook 2003–2023”; is the coefficient of energy consumption in processing (Table 2); is the calorific value of consuming one degree of electricity (Table 2); and is the GHG emission coefficient of electric energy consumption (Table 2).
Total GHG Emissions from the Livestock Sector
2.3. Decomposition of Driving Factors for Livestock Greenhouse Gas Emissions
The Kaya identity [25] is currently widely used in environmental research, and its specific expression is as follows:
In the equation, represents carbon emissions; represents energy consumption; represents gross domestic product; represents total population. According to the formula, carbon emissions are decomposed into factors such as emission intensity effect, energy intensity effect, per capita GDP, and population size. This study, based on the factors affecting greenhouse gas emissions in animal husbandry, modifies the Kaya identity following the principles of systematization, scientific validity, and operability to analyze the factors influencing greenhouse gas emissions from animal husbandry in Jiangxi Province. The specific expression is as follows:
In the equation: represents the greenhouse gas emissions from livestock (ten thousand tons); represents the livestock sector output (ten thousand yuan); represents the total agricultural, forestry, animal husbandry, and fishery output (ten thousand yuan); represents the regional GDP (ten thousand yuan); represents the total population of the region (ten thousand people); represents the rural population of the region (ten thousand people).
The Logarithmic Mean Divisia Index (LMDI) model is used to decompose the transformed Kaya identity. Taking the logarithm of both sides of Formula (11), the expression is as follows:
If the initial year’s is set as , then = + ; In the t-th year, is set as ; then = + ; Let = − , then:
where
In the equation, represent the changes in livestock greenhouse gas emissions in the t-th year compared to the initial year, due to the intensity effect, agricultural structure effect, industrial structure effect, regional development level, urbanization level, and rural population size, respectively.
2.4. Data Sources and Processing
Using data from 11 cities in Jiangxi Province from 2002 to 2022 as the study sample, the raw data used in this research were sourced from official statistical publications, namely the “Jiangxi Province Statistical Yearbook 2003–2023” [26] and the “Compilation of National Agricultural Product Cost and Return Data” [27]. The annual production of major livestock and poultry products (such as pork, beef, milk, mutton, poultry meat, and eggs) for each year in each city is sourced from the “Jiangxi Province Statistical Yearbook” (2003–2023). The year-end inventory and slaughter quantity of major livestock (such as pigs, cattle, sheep, and poultry) for each year in each city are also from the “Jiangxi Province Statistical Yearbook” (2003–2023). Data on the grain consumption coefficient per unit of livestock product, electricity expenses per unit of livestock, coal expenses, and other related information are sourced from the “Compilation of National Agricultural Product Cost and Return Data” (2003–2023). Data on the annual livestock output value, agricultural, forestry, animal husbandry, and fishery output value, regional GDP, total population, and rural population for each region are obtained from the “Jiangxi Province Statistical Yearbook” (2003–2023). A Life Cycle Assessment (LCA) method is employed, selecting six key stages: feed crop cultivation, feed crop transportation and processing, gastrointestinal fermentation of livestock and poultry, manure management systems, livestock rearing processes, and livestock product processing. Using relevant data, the total greenhouse gas emissions from animal husbandry in Jiangxi Province over the 21 years from 2002 to 2022 are calculated. Further, the temporal and spatial patterns of greenhouse gas emissions from animal husbandry in Jiangxi Province are analyzed, and the LMDI model is used to identify the factors influencing these emissions.
3. Results and Analysis
3.1. Temporal Variation Characteristics of Livestock Greenhouse Gas Emissions in Jiangxi Province
3.1.1. Temporal Variation Characteristics of Total Livestock Greenhouse Gas Emissions
Based on the calculations from Equations (1)–(9), the total greenhouse gas emissions from the livestock sector in Jiangxi Province exhibited an overall increasing trend from 2002 to 2022. Over this 21-year period, total emissions rose from 13.52 million tons to 21.27 million tons, with an average annual growth rate of 2.36%. This trend can be broadly divided into several phases (Table 4), as follows:
Table 4.
GHG emissions from animal husbandry in Jiangxi Province, 2002–2022 (unit: tons).
- (1)
- Rapid Growth Phase (2002–2004): During this phase, greenhouse gas emissions from animal husbandry in Jiangxi Province increased from 13.52 million tons to 14.69 million tons, with an average annual growth rate of 4.25%. Over these three years, emissions increased by 1.17 million tons. During this period, the Chinese government proposed accelerating agricultural structural adjustments, vigorously developing animal husbandry, and actively promoting the processes of scaling, standardization, and industrialization. Additionally, taxes related to animal husbandry, such as livestock taxes and slaughter taxes, also showed a downward trend, thereby promoting the rapid development of animal husbandry. However, this also led to a significant increase in greenhouse gas emissions from the sector.
- (2)
- Temporary Decline Phase (2005–2006): During this period, greenhouse gas emissions from animal husbandry decreased from 15.47 million tons to 14.81 million tons, representing a decline of 4.26%. From 2004, China experienced a tightening grain supply and a significant rise in grain prices. In response, the government imposed restrictions on grain-intensive animal husbandry, leading to a substantial reduction in the annual feeding quantity of pigs, beef cattle, and sheep nationwide. Consequently, greenhouse gas emissions from animal husbandry experienced a temporary decline.
- (3)
- Slow Growth Phase (2007–2015): During this period, greenhouse gas emissions from animal husbandry in Jiangxi Province increased from 15.39 million tons in 2007 to 20.68 million tons in 2015, with an average annual growth rate of 3.79%. Notably, between 2011 and 2012, the growth rate peaked at 6.99%. During this period, driven by China’s rapid economic growth, urbanization accelerated significantly, leading to a continuous increase in consumer demand for livestock products. Additionally, household consumption patterns gradually shifted toward healthier and more environmentally friendly choices. As a result, the rapid expansion of market demand further accelerated the growth of animal husbandry, ultimately contributing to an increase in greenhouse gas emissions from the sector.
- (4)
- Slow Decline and Rebound Stage (2016–2022): In this stage, greenhouse gas emissions decreased from 20.45 million tons in 2016 to 18.54 million tons in 2019, with an average annual decline rate of 2.67%. From 2020 to 2022, greenhouse gas emissions rebounded from 18.71 million tons to 21.27 million tons, with an average annual growth rate of 4.77%. The reasons behind this may include the effects of breeding efficiency, animal diseases, and the COVID-19 pandemic. Additionally, some positive factors also played an important role in reducing livestock greenhouse gas emissions, such as Jiangxi Province’s vigorous promotion of a green circular agricultural economic model, advocacy for the construction of green standardized breeding bases, and the promotion of rural centralized manure treatment centers, which significantly increased the recycling rate of livestock manure (Table 4).
3.1.2. Temporal Variation Characteristics of Livestock Greenhouse Gas Emission Structure
The greenhouse gas emissions from five stages—feed crop planting, feed crop transportation, manure management system, livestock farming, and livestock product processing—showed an overall increasing trend, with average annual growth rates of 3.64%, 3.70%, 1.66%, 9.25%, and 3.16%, respectively. In contrast, greenhouse gas emissions from livestock gastrointestinal fermentation showed a declining trend, with an average annual decrease rate of 0.84%. Among all the stages, feed crop planting and manure management systems were the primary sources of greenhouse gas emissions, accounting for 34.23% and 30.82% of total livestock greenhouse gas emissions, respectively. Greenhouse gas emissions from gastrointestinal fermentation accounted for 24.69% of total emissions. Between 2002 and 2022, the year-on-year variation in greenhouse gas emissions from feed crop transportation and livestock product processing was minimal, and their respective shares in total emissions were small, accounting for 0.64% and 0.02%. In terms of average total greenhouse gas emissions from each stage, the emissions ranked from smallest to largest were as follows: livestock product processing (four thousand tons), feed crop transportation (115 thousand tons), livestock farming (1787 thousand tons), livestock gastrointestinal fermentation (4269 thousand tons), manure management systems (5445 thousand tons), and feed crop planting (6131 thousand tons) (Figure 3). From the perspective of different livestock categories, the proportion of greenhouse gas emissions from pigs increased annually from 2002 to 2014, then fluctuated and decreased from 2015 to 2022. The proportion of greenhouse gas emissions from cattle decreased annually over the 21 years, from 41.96% in 2002 to 21.82% in 2022. The greenhouse gas emissions from sheep remained relatively stable over the 21 years, while poultry emissions showed an overall increasing trend. In summary, pigs accounted for the largest proportion of greenhouse gas emissions, while sheep accounted for a small proportion. Over the 21 years, the greenhouse gas emissions from pigs, cattle, sheep, and poultry accounted for 48.15%, 29.03%, 1.81%, and 21.01% of total emissions, respectively (Figure 4).
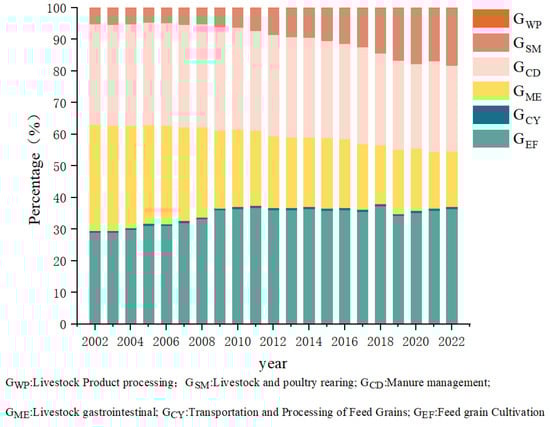
Figure 3.
Proportion of GHG emissions from each segment.
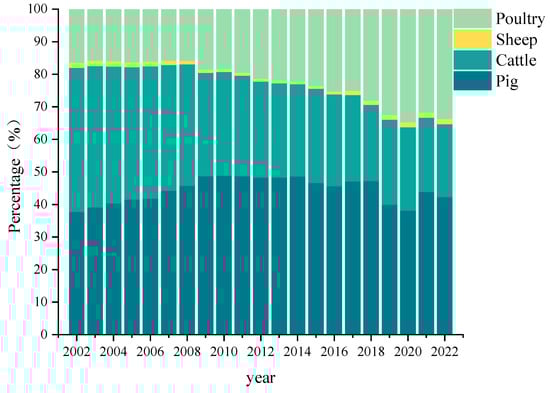
Figure 4.
Proportion of total emissions from different livestock.
3.2. Spatial Variation Characteristics of Livestock Greenhouse Gas Emissions in Jiangxi Province
3.2.1. Evolutionary Pattern of Spatial Distribution of Livestock Greenhouse Gas
Emissions
From 2002 to 2022, a spatial visualization analysis of greenhouse gas emissions from animal husbandry was conducted every four years to examine the temporal and spatial distribution patterns of emissions in Jiangxi Province. To ensure the accuracy and comparability of livestock greenhouse gas emission data across different time scales and city-level jurisdictions, a classification system based on the natural breaks method (using a clustering approach) was applied. The emissions were categorized into four types: light emission zones, medium emission zones, heavy emission zones, and super-heavy emission zones.
- (1)
- The spatial pattern of super-heavy and light emission zones remained relatively stable. The super-heavy emission zone mainly included Yichun, Ji’an, and Ganzhou, with Ganzhou consistently classified as an super-heavy emission zone over the 21-year period. The five cities of Jiujiang, Jingdezhen, Yingtan, Xinyu, and Pingxiang remained classified as light emission zones throughout the period. In the super-heavy emission zones, Ji’an and Ganzhou serve as major livestock production bases in Jiangxi Province, particularly for pig and poultry farming. Over time, these areas have developed large-scale breeding industry chains. Furthermore, with the advancement of agricultural modernization, animal husbandry in these regions has shifted towards intensification and large-scale operations. The increased concentration of livestock farms has led to a higher stocking density per unit area, thereby increasing greenhouse gas emissions. In the light emission zones, traditional agricultural practices dominate, and the scale of animal husbandry remains relatively small. For instance, Jingdezhen is primarily known for its ceramics industry, Pingxiang specializes in coal and related industries, while Yingtan and Xinyu have strong industrial backgrounds. Additionally, compared to the warm and humid climate of southern Jiangxi, the climatic conditions in cities such as Jiujiang, Jingdezhen, and Yingtan are less suitable for large-scale livestock and poultry farming. These climatic constraints result in less reliance on high-yield breeding models during winter and early spring, leading to relatively lower stocking numbers of pigs and other livestock in these areas.
- (2)
- The medium and heavy emission zones exhibited a dynamic evolutionary trend. In 2002, the medium emission zone included only Nanchang and Fuzhou. Between 2006 and 2014, the zone expanded to include Nanchang, Fuzhou, and Shangrao. In 2018, Fuzhou transitioned from a medium to a heavy emission zone, while in 2022, Shangrao shifted from a medium to a light emission zone. In 2002, Ji’an was the only city classified as a heavy emission zone. By 2006, the heavy emission zone expanded to include both Ji’an and Yichun. In 2018, only Fuzhou remained in the heavy emission zone, and by 2022, Yichun had transitioned from a super-heavy emission zone to a heavy emission zone.
- (3)
- From a spatial distribution perspective, the total greenhouse gas emissions from animal husbandry in Jiangxi Province were relatively low in 2002. In Jingdezhen, Pingxiang, Xinyu, and Yingtan, the total emissions were all below 0.62 million tons, with Jingdezhen at just 0.35 million tons. Emissions in Jiujiang, Shangrao, Nanchang, and Fuzhou ranged from 1.07 million tons to 1.87 million tons. By 2006, with the development of the socio-economy and animal husbandry, greenhouse gas emissions from animal husbandry in Jiangxi Province showed a slight overall increase, although emissions in Jiujiang, Xinyu, and Fuzhou slightly decreased. In 2010, emissions in most cities showed an upward trend, although emissions in Ganzhou decreased from 4.47 million tons in 2006 to 4.17 million tons in 2010. In 2014, greenhouse gas emissions in most cities showed a growth trend compared to 2010. Emissions in Yichun, Ji’an, and Ganzhou reached 4.39–4.80 million tons. However, emissions in Jingdezhen, Pingxiang, Yingtan, and Xinyu remained relatively low at below 1 million tons. In 2018, with economic development and agricultural policy adjustments, greenhouse gas emissions from animal husbandry in various cities showed a decline compared to 2014. Nanchang had the largest decline at 38.33%, while emissions in other cities decreased slightly, remaining within the previous emission ranges. By 2022, greenhouse gas emissions in various cities showed an upward trend compared to 2016. In Jingdezhen, Pingxiang, Xinyu, and Yingtan, emissions ranged from 0.36 million tons to 1.11 million tons. In Jiujiang, Shangrao, Nanchang, and Fuzhou, emissions ranged from 1.23 million to 2.64 million tons. Emissions in Ganzhou, Ji’an, and Yichun rose to higher ranges, from 4.13 million to 5.93 million tons. This highlights significant regional differences in greenhouse gas emissions (Figure 5).
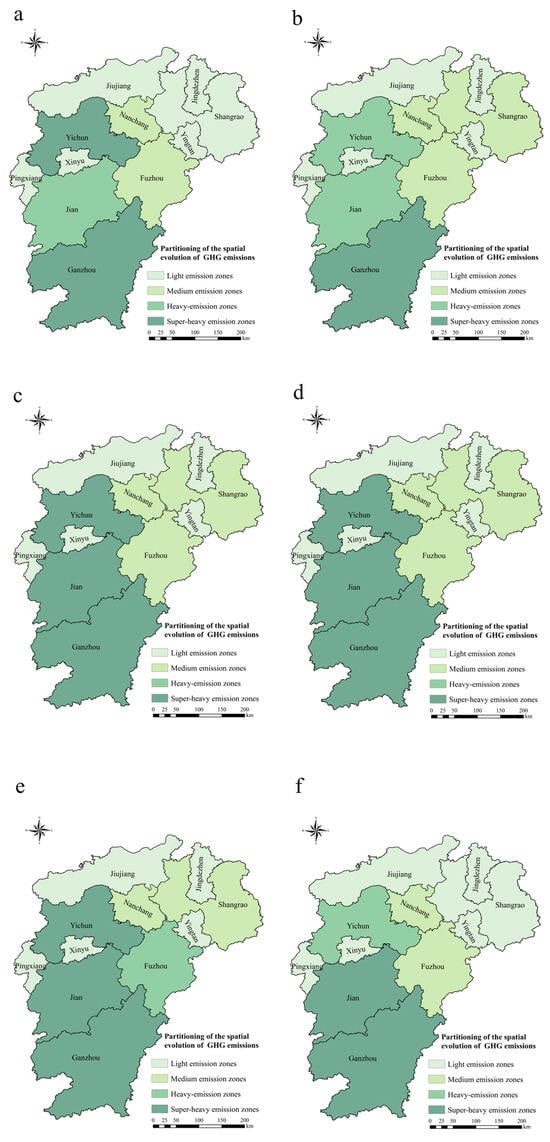 Figure 5. Spatial distribution of greenhouse gas emissions from animal husbandry in Jiangxi Province. (a) 2002; (b) 2006; (c) 2010; (d) 2014; (e) 2018; (f) 2022.
This map was produced based on the standard map with review number GS(2019)3333 downloaded from the standard map service website of the official website of the Ministry of Natural Resources of China, with no modification of the base map. The same applies below.
3.2.2. Structural Characteristics of Regional Livestock Greenhouse Gas Emissions
In terms of total emissions, the livestock greenhouse gas emissions in each city in 2022, from highest to lowest, were: Ganzhou, Ji’an, Yichun, Fuzhou, Nanchang, Shangrao, Jiujiang, Pingxiang, Yingtan, Xinyu, and Jingdezhen. In terms of emissions at different stages, except for Pingxiang and Xinyu, all the other cities had the highest proportion of emissions from the feed crop cultivation stage, while Pingxiang and Xinyu had the highest proportion of emissions from the manure management system (Figure 6). In terms of livestock species, the highest proportion of emissions in Jingdezhen, Pingxiang, Jiujiang, Xinyu, Yingtan, Ganzhou, Yichun, and Shangrao came from pigs. For Nanchang, Ji’an, and Fuzhou, the highest proportion came from poultry, with ratios of 59.12%, 34.88%, and 44.07%, respectively (Figure 7).
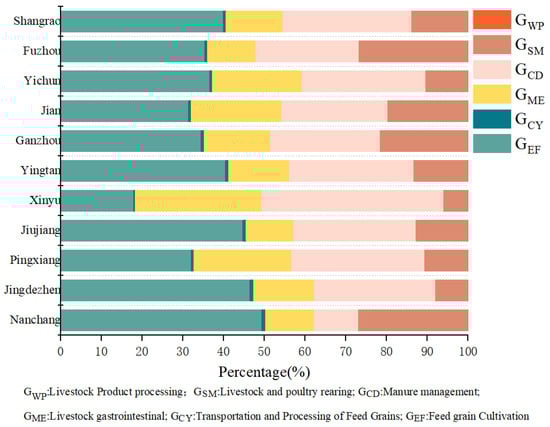
Figure 6.
Proportion of GHG emissions from each segment in Jiangxi Province of emissions from each city in 2022.
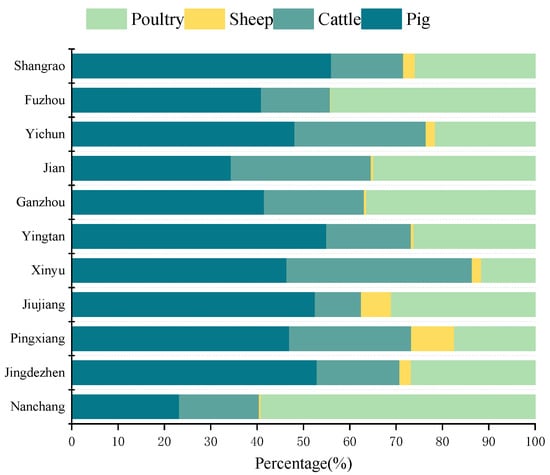
Figure 7.
Proportion of emissions from different livestock and poultry in Jiangxi Province in 2022 as a percentage of emissions in each municipality.
3.3. Decomposition of Driving Factors for Livestock Greenhouse Gas Emissions in Jiangxi Province
Using the LMDI model, the driving factors for livestock greenhouse gas emissions were decomposed into intensity effect, agricultural structure effect, industrial structure effect, regional development level, urbanization level, and rural population size. The impact of each factor on livestock in Jiangxi Province from 2002 to 2022 was measured according to Formulas (10)–(14) (Table 5). The results show that over the past 21 years, livestock greenhouse gas emissions in Jiangxi Province have increased by 7.7509 million tons, with intensity effect, agricultural structure effect, and rural population size playing a suppressive role. Regional development level and urbanization level are important driving factors that promote livestock greenhouse gas emissions.
Table 5.
Decomposition results of factors affecting GHG emissions from livestock farming in Jiangxi Province, 2002–2022 (unit: tons).
The intensity effect has the most significant suppressive effect on livestock greenhouse gas emissions. From 2002 to 2022, the intensity effect cumulatively reduced livestock greenhouse gas emissions by 17.94 million tons, significantly higher than other factors. Since the Ministry of Agriculture issued the “Guiding Opinions on Promoting Modernized Livestock and Poultry Farming” in 2004 [28], the intensity effect reduced emissions by 11.7 million tons from 2004 to 2011. From 2012 to 2018, the contribution of the intensity effect to livestock greenhouse gas emissions alternated between suppression and promotion. Since 2019, the intensity effect has primarily suppressed livestock greenhouse gas emissions. Overall, the intensity effect refers to the ratio of greenhouse gas emissions to the total value of livestock production. While livestock greenhouse gas emissions and the total value of livestock production in Jiangxi Province both show an upward trend, the intensity effect is declining, indicating that the increase in livestock greenhouse gas emissions is lagging behind the growth of the livestock economy. Therefore, Jiangxi Province should focus on the coordinated development between livestock economic growth and livestock productivity to reduce greenhouse gas emissions from the livestock sector.
Agricultural structure effect mainly plays a suppressive role in livestock greenhouse gas emissions in Jiangxi Province, but its suppressive capacity is weak. From 2002 to 2022, the agricultural industry structure cumulatively suppressed 2.58 million tons of livestock greenhouse gas emissions. Over the 21 years, the contribution of the agricultural structure effect to livestock greenhouse gas emissions fluctuated between suppression and promotion, indicating Jiangxi Province’s ongoing optimization and adjustment of the agricultural, forestry, livestock, and fishery industry structure to promote carbon reduction.
The industrial structure effect also plays a suppressive role in livestock greenhouse gas emissions in Jiangxi Province, second only to the intensity effect. From 2002 to 2022, the industrial structure effect suppressed 17.66 million tons of greenhouse gas emissions. During the study period, Jiangxi Province continued to emphasize industrial structure adjustments, focusing on both agricultural development and economic growth. As a result, the industrial structure effect has a significant suppressive impact on livestock greenhouse gas emissions.
The regional development level and urbanization level promote livestock greenhouse gas emissions. From 2002 to 2022, the regional development level contributed to an increase of 45.27 million tons of livestock greenhouse gas emissions, making it the main factor responsible for the increase in livestock greenhouse gas emissions. The urbanization level has a weaker promoting effect on greenhouse gas emissions, with a cumulative increase of 10.8 million tons over 21 years. This indicates that livestock greenhouse gas emissions in Jiangxi Province are not fully decoupled from economic development, and economic growth in the future will still largely promote the increase of livestock greenhouse gas emissions.
Rural population size is also an important factor in suppressing livestock greenhouse gas emissions in Jiangxi Province. From 2002 to 2022, the rural population size suppressed 10.14 million tons of livestock greenhouse gas emissions. The change in rural population size has affected livestock greenhouse gas emissions. From 2002 to 2022, the rural population in Jiangxi Province declined annually, from 28.63 million in 2002 to 16.65 million. As urbanization in Jiangxi continues to accelerate, rural population size is expected to continue to suppress livestock greenhouse gas emissions in the future.
4. Discussion and Recommendations
As greenhouse gas emissions increase, more and more scholars worldwide are beginning to explore and study the issue. However, agricultural production generates a large amount of greenhouse gases and significantly contributes to their emissions. As an important component of agriculture, animal husbandry not only meets human demand for animal products but has also become a significant source of greenhouse gas emissions [29,30]. In human-caused greenhouse gas emissions, emissions from livestock farming account for about 14.5% of global anthropogenic greenhouse gas emissions. With the development of animal husbandry, it is expected that by 2050, emissions from global livestock farming will increase by 39% compared to 2010 [31], but the mitigation potential for livestock-related greenhouse gas emissions is as high as 30% [32]. Therefore, understanding the current status and characteristics of greenhouse gas emissions in China’s animal husbandry is of crucial practical significance for promoting the sustainable development of the industry under the “dual carbon” strategy. Life Cycle Assessment (LCA), a tool that can accurately assess the greenhouse gas emissions produced by products and services, has been increasingly applied in animal husbandry [33]. Therefore, the LCA method was chosen to study the characteristics of greenhouse gas emissions in Jiangxi Province’s animal husbandry. Over 21 years, the total greenhouse gas emissions from animal husbandry in Jiangxi Province increased from 13.52 million to 21.27 million tons, with an annual average growth rate of 2.26%. The annual average growth rates for the various sectors were as follows: feed grain cultivation (3.64%), feed grain transportation and processing (3.70%), livestock gastrointestinal fermentation (−0.84%), manure management system (1.66%), energy consumption in livestock farming (9.25%), and animal product processing (3.16%). Li et al. [34]. used Life Cycle Assessment to study the greenhouse gas emission characteristics of animal husbandry in Shandong Province from 2002 to 2021. The results showed that the annual average growth rates for various sectors in Shandong were as follows: feed grain cultivation (3.01%), feed grain transportation and processing (3.01%), livestock gastrointestinal fermentation (−0.71%), manure management (1.20%), livestock energy consumption (2.45%), and animal product processing (1.79%). Except for the gastrointestinal fermentation sector, which had a slightly higher growth rate than in this study, the growth rates of the other sectors were lower than those in Jiangxi Province. This indicates that Jiangxi Province has adopted proactive policies in recent years in areas such as low-carbon farming, resource utilization, and industrial restructuring, promoting rapid development in these fields. In contrast, Shandong Province’s greenhouse gas emission growth has been relatively moderate due to industrial stability and environmental protection policies. It is noteworthy that Wu et al. [35] used the IPCC coefficient method to estimate carbon emissions from animal husbandry in various provinces of China from 2001 to 2020. Their results indicated that Jiangxi Province’s emissions in 2020 were only 8.10 million tons, significantly lower than the 18.71 million tons estimated in this study. The reason for this difference is that Wu et al. [35] only included livestock gastrointestinal fermentation and manure management in their carbon emission calculation, while this study, based on life cycle theory, comprehensively considered greenhouse gas emissions across the entire livestock production process, including feed grain cultivation, feed grain transportation and processing, livestock gastrointestinal fermentation, manure management, energy consumption in livestock farming, and animal product processing. This approach provided a more comprehensive and systematic calculation and assessment of Jiangxi Province’s animal husbandry greenhouse gas emissions.
The results of this study show that the greenhouse gas emissions from different sectors, ranked from highest to lowest, are as follows: feed grain cultivation > manure management systems > livestock gastrointestinal fermentation > livestock farming > feed grain transportation > animal product processing. Feed grain cultivation, manure management systems, and livestock gastrointestinal fermentation are the primary sources of greenhouse gas emissions, accounting for 34.23%, 30.82%, and 24.69% of the total emissions, respectively. Yao et al. used Life Cycle Assessment (LCA) to measure livestock carbon emissions across 31 provinces in mainland China. The results indicated that emissions from livestock gastrointestinal fermentation and manure management systems are significant sources of greenhouse gas emissions, which is consistent with the findings of this study [8]. Other scholars, such as Li et al. [9], Li et al. [34], and Huang et al. [36], applied Life Cycle Assessment (LCA) to measure livestock greenhouse gas emissions in regions that included the Gannan Yellow River water supply area, Shandong Province, and 31 provinces in China. Their studies consistently found that livestock gastrointestinal fermentation and manure management systems are important sources of greenhouse gas emissions in animal husbandry. A spatial visualization analysis of livestock-related greenhouse gas emissions in Jiangxi Province revealed that the spatial patterns of super-high- and low-emission zones have remained relatively stable, while medium- and high-emission zones have shown dynamic evolution. This trend is similar to the regional characteristics of livestock carbon emissions observed in Yao et al.’s study [8] on China’s livestock sector.
The LMDI model decomposition results indicate that the intensity effect has the most significant suppressive impact on livestock greenhouse gas emissions, followed by the effects of industrial structure and rural population size. Although the agricultural structure effect also exerts a suppressive influence, its impact is weaker. The level of regional development and urbanization, on the other hand, promote livestock greenhouse gas emissions. Wang et al. [37]. used the spatial Durbin model to analyze the factors affecting the net agricultural carbon sink in the Hexi region of Gansu Province. The results showed that urbanization has a significant passive spatial spillover effect on agricultural net carbon sinks, while per capita agricultural GDP, agricultural industrial structure, and agricultural financial support have a significant active spatial spillover effect. Furthermore, the analysis results of the factors influencing livestock greenhouse gas emissions in this study are similar to the conclusions drawn by Dong [38], Ren [39], Li [40], and others regarding the factors affecting agricultural greenhouse gas emissions in different regions. Based on this, the following recommendations are proposed to address the livestock greenhouse gas emissions in Jiangxi Province:
- (1)
- Adapt to local conditions and optimize the spatial layout of livestock farming
Develop differentiated livestock development strategies based on regional resource endowments and demographic–economic characteristics. For example, in super-heavy-emission zones, strengthen livestock scale regulation and promote the resource utilization of manure and the development of large-scale environmentally friendly farming. In heavy-emission zones, optimize livestock farming structures and encourage the development of low-carbon farming models. In medium- and light-emission zones, encourage ecological farming and integrated crop–livestock systems to increase the adoption of low-carbon farming models. In areas with fewer conflicts between human and land resources, actively encourage livestock development while strengthening ecological protection measures. For instance, the Ganznan region, with its vast land and rich forest resources, can fully leverage its natural advantages to promote a green livestock farming model. In economically developed and densely populated regions, such as the Poyang Lake urban agglomeration and the Nanchang metropolitan area, the scale of livestock farming should be scientifically controlled to ensure a coordinated balance between livestock development, the regional economy, and the ecological environment.
- (2)
- Establish a regional collaborative governance mechanism to enhance the development of low-carbon livestock farming across the province.
Establish a regional coordination mechanism within Jiangxi Province, such as implementing carbon emission quota trading in super-heavy-emission areas and encouraging low-emission regions to transfer low-carbon farming technologies and models to high-emission areas. Promote cross-regional manure resource utilization in adjacent medium- and heavy-emission areas to reduce the environmental burden of manure treatment. Establish an inter-provincial cooperation mechanism with neighboring provinces such as Hunan, Fujian, and Anhui for manure treatment and organic agriculture, thereby reducing the impact of livestock waste on the local ecological environment.
- (3)
- Strengthen technological innovation and promote low-carbon livestock farming techniques.
Promote energy-saving livestock farming models or anaerobic digestion technology for manure treatment in large-scale farms and high-emission areas, such as intelligent temperature control systems and precision feeding systems, to reduce energy consumption and greenhouse gas emissions. Optimize feed formulations by increasing research and development investment in leading livestock enterprises, such as the Twins Group, to improve livestock breeds and enhance feed efficiency. Encourage enterprises to innovate in clean production technologies, reducing livestock manure emissions at the source. Develop digital low-carbon management systems and establish a livestock greenhouse gas emissions monitoring platform. Utilize IoT technology for real-time monitoring of greenhouse gas emissions in livestock farms, enhancing regulatory efficiency. The government should support the establishment of an organized pig farming model, encourage the practical application of technological research and development outcomes, and promote the widespread adoption of clean technologies among farmers through vertical collaboration mechanisms, ultimately achieving a fully clean transformation of the livestock industry chain.
- (4)
- Strengthen policy guidance and optimize the agricultural structure effect.
Increase financial support to encourage the transition to low-carbon livestock farming, such as establishing low-carbon farming subsidies and incentivizing farmers to adopt clean energy. Strengthen the demonstration and promotion of ecological livestock farming in rural areas. In line with the rural revitalization strategy, encourage rural cooperatives to establish regional low-carbon livestock farming organizations, share manure treatment facilities, and enhance the efficiency of manure resource utilization. The government should scientifically assess manure carrying capacity based on regional land carrying capacity. While reasonably controlling regional livestock farming capacity, it should also enhance environmental awareness among livestock farmers and improve the level of manure resource utilization. Special emphasis should be placed on promoting moderately scaled “integrated crop–livestock” family farms. Further policy support and financial subsidies should be provided for manure treatment facility construction to facilitate the livestock industry’s transformation towards reduction, circularity, and resource efficiency.
5. Conclusions and Outlook
5.1. Conclusions
This study used data from 2002 to 2022 on livestock production in Jiangxi Province and employed a Life Cycle Assessment (LCA) method to calculate the greenhouse gas emissions from the province’s livestock sector. The study analyzed the overall changes in and spatiotemporal patterns of Jiangxi’s livestock greenhouse gas emissions. The key conclusions drawn from the comprehensive analysis are as follows:
- (1)
- In terms of time, between 2002 and 2022, the total livestock greenhouse gas emissions in Jiangxi showed an overall increasing trend. Over the 21 years, total emissions increased from 13.52 million tons to 21.27 million tons, with an average annual growth rate of 2.36%. As for emission intensity, the intensity of livestock greenhouse gas emissions in Jiangxi showed a fluctuating downward trend, with an average annual reduction rate of 4.54% over the 21 years.
- (2)
- In terms of space, due to the differences in livestock farming across Jiangxi’s cities, there were significant variations in livestock greenhouse gas emissions by region. During the study period, the spatial patterns of the super-heavy- and light-emission zones remained relatively stable, while the medium- and heavy-emission zones showed dynamic changes. In terms of total emissions, the cities with the highest to lowest emissions were as follows: Ganzhou, Ji’an, Yichun, Fuzhou, Nanchang, Shangrao, Jiujiang, Pingxiang, Yingtan, Xinyu, and Jingdezhen. In terms of emission intensity, the emission intensity in each city showed a declining trend over time.
- (3)
- In terms of driving factors, intensity effects, industrial structure effects, rural population scale, and agricultural structure effects played important roles in mitigating livestock greenhouse gas emissions. Meanwhile, regional development level and urbanization level promoted emissions. Among these, intensity effects and regional development level had the most significant impact on livestock greenhouse gas emissions in Jiangxi.
5.2. Outlook
Through a case study of Jiangxi Province, this research not only provides scientific evidence for local governments and relevant industries but also offers insights for the low-carbon transition of livestock farming in other regions. However, effectively promoting the findings of this study to other regions still faces a series of challenges and opportunities. Future research should further expand the applicability of this method and explore how to promote and implement corresponding low-carbon livestock development strategies in different regions. The following are the prospects for the future development of this research:
- (1)
- Data Adaptability and Standardization
Although the Life Cycle Assessment (LCA) method provides a comprehensive evaluation framework for livestock greenhouse gas emissions, variations in climate conditions, agricultural structures, and livestock development models across regions may lead to significant differences in emission characteristics. Therefore, future research should focus on developing LCA models that are regionally adaptive. Specifically, the Jiangxi Province model should be localized based on regional resource endowments and industrial characteristics, and LCA calculation methods should be developed for different regions, such as the northern herbivorous livestock areas and the southwestern mountainous farming zones. Furthermore, efforts should be made to optimize emission factor databases and data collection standards, establish a national LCA database for livestock farming, integrate regional data into a shared platform, and develop a nationwide livestock carbon emission factor database.
- (2)
- Policy Support and Cross-Regional Collaborative Governance
While promoting the findings of this study in different regions, it is necessary to fully consider the differences in policy support, breeding structures, market demands, and other factors across regions. Therefore, future research could focus on how to establish cross-regional carbon emission collaborative governance mechanisms at the national or provincial level. This can be achieved by guiding local governments to formulate livestock low-carbon policies tailored to regional realities and optimizing resource allocation through information sharing, technological cooperation, and other means. Local governments can rely on existing research outcomes to develop low-carbon livestock development policies suited to local characteristics, such as low-carbon farming subsidies, green livestock certification, carbon emission trading, and other policies, while encouraging enterprises to participate in greenhouse gas emission accounting. By establishing inter-provincial collaboration mechanisms, the promotion of low-carbon livestock farming can be advanced. For example, Jiangxi Province can share its research results with other provinces, promoting inter-provincial sharing of technology, data, and experience, as well as the transformation and upgrading of green low-carbon technologies.
- (3)
- International Cooperation and Global Promotion
With the increasing severity of global climate change, the need for global reductions in livestock carbon emissions has become more urgent. The research findings based on the Life Cycle Assessment (LCA) method in Jiangxi Province not only have the potential for domestic promotion but also serve as a reference for low-carbon livestock development worldwide. Therefore, future research should consider aligning China’s livestock carbon emission assessment experience with international standards and promoting collaboration with other countries, particularly developing nations, in carbon emission accounting, technology transfer, and policy formulation. This will enhance China’s role and contribution to global greenhouse gas reduction efforts. For example, China can share its expertise with agricultural sectors in other countries, particularly developing nations, by leveraging the Belt and Road Initiative (BRI) as a platform to export low-carbon livestock management experience. Additionally, China should participate in global livestock carbon footprint research and collaborate with developed countries in Europe and North America to share low-carbon farming technologies and carbon reduction experiences. This would help align China’s livestock carbon emission accounting system with international standards and provide scientific support for the internationalization of the livestock industry.
Author Contributions
X.C., responsible for the overall design of the research, data analysis, and writing the initial draft of the paper; Q.C., G.C., T.H. and J.Z., involved in data collection and analysis and assisted in writing the literature review section; Q.T., provided guidance on the research methodology, performed revisions, and conducted the final review of the paper. All authors have read and agreed to the published version of the manuscript.
Funding
This research was funded by the Jiangxi “Double Thousand Plan” Long-term Innovation and Leading Talents Fund Project in Natural Sciences, grant numbers 900/2120800004.
Institutional Review Board Statement
Not applicable.
Informed Consent Statement
Not applicable.
Data Availability Statement
The data supporting the results of this study are available from the corresponding author upon reasonable request. Additionally, the data used in this study are derived from official government reports and statistical sources, which can be accessed through the relevant government websites.
Conflicts of Interest
The authors declare no conflicts of interest.
References
- Wu, P.; Zhao, X. Impact of climate change on agricultural water use and grain production in China. Trans. Chin. Soc. Agric. Eng. 2010, 26, 1–6. [Google Scholar]
- Zhang, Y.; Dai, Y.; Chen, Y. Spatial-temporal evolution and driving factors of low-carbon use efficiency of cultivated land in China. Trans. CSAE 2022, 38, 234–243. [Google Scholar]
- Frank, S.; Havlík, P.; Stehfest, E.; van Meijl, H.; Witzke, P.; Pérez-Domínguez, I.; Valin, H. Agricultural non-CO2 emission reduction potential in the context of the 1.5 C target. Nat. Clim. Change 2019, 9, 66–72. [Google Scholar] [CrossRef]
- Tian, C.; Chen, Y. China’s provincial agricultural carbon emissions measurement and low carbonization level evaluation: Based on the application of derivative indicators and TOPSIS. J. Nat. Resour. 2021, 36, 395–410. [Google Scholar] [CrossRef]
- Ministry of Agriculture and Rural Affairs. National Development and Reform Commission. Agricultural and Rural Emission Reduction and Carbon Sequestration Implementation Plan. 7 May 2022. Available online: http://www.moa.gov.cn/ (accessed on 5 October 2024).
- Department of Agriculture and Rural Development of Jiangxi Province. Agricultural and Rural Emission Reduction and Carbon Sequestration Implementation Plan of Jiangxi Province. 4 July 2022. Available online: https://www.jxepi.com.cn/xwxq/11672197.html (accessed on 5 October 2024).
- Meng, X.; Cheng, G.; Zhang, J.; Wang, Y.; Zhou, H. Analyze on the spatialtemporal characteristics of GHG estimation of livestock’s by life cycle assessment in China. China Environ. Sci. 2014, 34, 2167–2176. [Google Scholar]
- Yao, C.; Qing, S.; Li, Z. Provincial animal husbandry carbon emissions in China and temporal-spatial evolution mechanism. Resour. Sci. 2017, 39, 698–712. [Google Scholar]
- Li, X.; Chen, Q. A full life cycle carbon footprint calculation and analysis of spatial-temporal pattern for livestock industries in the Yellow River water supply area of Gannan. Acta Prataculturae Sin. 2024, 33, 227–241. [Google Scholar]
- Gu, S.; Qiu, Z.; Zhan, Y.; Qian, K.; Xiong, R.; Dai, H.; Shen, W. Spatial-temporal characteristics and trend prediction of carbon emissions from animal husbandry in China. J. Agro-Environ. Sci. 2023, 42, 705–714. [Google Scholar]
- Zhang, Z.; Sun, H.; Su, Y. The spatial distribution and evolution trends of agricultural and animal husbandry carbon emissions in the northwest arid region of China. Acta Ecol. Sin. 2017, 37, 5263–5272. [Google Scholar]
- Zhang, J.; Wang, H. Regional difference, dynamic evolutionary and convergence analysis on the Chinese animal husbandry based on the animal husbandry data in 31 Provinces from 1997 to 2007. Jianghan Trib. 2020, 9, 41–48. [Google Scholar]
- Xu, L.; Qu, J.; Wu, J.; Wei, Q.; Bai, J.; Li, H. Spatial-temporal dynamics and prediction of carbon emission from agriculture and animal husbandry in China. J. Ecol. Rural Environ. 2019, 35, 1232–1241. [Google Scholar]
- Zhou, Y.; Li, B.; Zhang, R. Spatiotemporal evolution and influencing factors of agricultural carbon emissions in Hebei Province at the county scale. Chin. J. Eco-Agric. 2022, 30, 570–581. [Google Scholar]
- Li, W.; Yao, X. Study on spatial and temporal variation of impacting factors of agricultural carbon emissions based on the GWR model. Sci. Technol. Manag. Res. 2019, 39, 238–245. [Google Scholar]
- Sun, Y.; Liu, J.; Ma, Z. Evaluation of greenhouse gas emissions from scale dairy farm. Trans. Chin. Soc. Agric. Eng. 2010, 26, 296–301. [Google Scholar]
- Cao, L.; Qi, Z.; Luo, L. Research on temporal and spatial characteristics of carbon emissions and influencing factors decomposition in pig industry in China. Sci. Technol. Manag. Res. 2015, 35, 224–228. [Google Scholar]
- Lin, Y.; Zhang, W.; Huang, Y. Estimating Spatiotemporal Dynamics of Methane Emissions from Livestock in China. Environ. Sci. 2011, 32, 2212–2220. [Google Scholar]
- Xie, H.; Chen, X.; Yang, M.; Zhao, H.; Zhao, M. The ecological footprint analysis of 1 kg livestock product of China. Acta Ecol. Sin. 2009, 29, 3264–3270. [Google Scholar]
- Tan, Q. Greenhouse gas emission in China’s agriculture: Situation and challenge. China Popul. Resour. Environ. 2011, 21, 69–75. [Google Scholar]
- Steinfeld, H.; Wassenaar, T.; Jutzi, S. Livestock production systems in developing countries: Status, drivers, trends. Rev. Sci. Tech. 2006, 25, 505–516. [Google Scholar] [CrossRef]
- Wang, X.; Liang, D.; Wang, X.; Peng, S.; Zheng, J. Estimation of greenhouse gas emissions from dairy farming systems based on LCA. Trans. Chin. Soc. Agric. Eng. 2012, 28, 179–184. [Google Scholar]
- Eggleston, H.; Buendia, L.; Miwa, K.; Ngara, T.; Tanabe, K. IPCC Guidelines for National Greenhouse Gas Inventories; IPCC: Geneva, Switzerland, 2006. [Google Scholar]
- Hu, X.; Wang, J. Estimation of livestock greenhouse gases discharge in China. Trans. Chin. Soc. Agric. Eng. 2010, 26, 247–252. [Google Scholar]
- Kaya, Y. Impact of Carbon Dioxide Emission on GNP Growth: Interpretation of Proposed Scenarios; Response Strategies Working Group, IPCC: Geneva, Switzerland, 1989. [Google Scholar]
- Jiangxi Bureau of Statistics. Jiangxi Statistical Yearbook (2003–2023); China Statistical Publishing House: Beijing, China, 2023.
- National Development and Reform Commission Price Department. National Agricultural Product Cost and Income Data Compilation (2003–2023); China Statistics Press: Beijing, China, 2023.
- Ministry of Agriculture and Rural Development of the People’s Republic of China. Circular on the Issuance of Guiding Opinions on Promoting Modernization of Livestock and Poultry Breeding Methods. 20 May 2004. Available online: https://www.moa.gov.cn/nybgb/2004/dwuq/201806/t20180623_6152972.htm (accessed on 5 October 2024).
- Oenema, O.; Wrage, N.; Velthof, G.L.; van Groenigen, J.; Dolfing, J.; Kuikman, P. Trends in global nitrous oxide emissions from animal production systems. Nutr. Cycl. Agroecosyst. 2005, 72, 51–65. [Google Scholar] [CrossRef]
- Grossi, G.; Goglio, P.; Vitali, A.; Williams, A. Livestock and climate change: Impact of livestock on climate and mitigation strategies. Anim. Front. 2019, 9, 69–76. [Google Scholar] [CrossRef] [PubMed]
- Zubir, M.A.; Bong, C.P.; Ishak, S.A.; Ho, W.S.; Hashim, H. The trends and projections of greenhouse gas emission by the livestock sector in Malaysia. Clean Technol. Environ. Policy 2022, 24, 363–377. [Google Scholar] [CrossRef]
- Gerber, P.J.; Steinfeld, H.; Henderson, B.; Mottet, A.; Opio, C.; Dijkman, J.; Tempio, G. Tackling Climate Change Through Livestock: A Global Assessment of Emissions and Mitigation Opportunities; Food and Agriculture Organization of the United Nations (FAO): Rome, Italy, 2013. [Google Scholar]
- Xi, Y.; Ye, X.; Du, J.; Kong, X.; Wang, L.; Zhu, F.; Han, T. Research progress on carbon emission accounting methods for livestock and poultry breeding industry. Jiangsu Agric. Sci. 2022, 50, 1–8. [Google Scholar]
- Li, Z.; Wei, Q.; Liu, X.; Zhu, R.; Li, C.; Li, Z. The Emission Characteristics of Greenhouse Gases from Animal Husbandry in Shandong Province Based on Life Cycle Assessment. Sustainability 2024, 16, 1375. [Google Scholar] [CrossRef]
- Wu, Q.; Zhang, Y.; Zhang, M. Quantitative assessment, temporal and spatial characteristics and dynamic evolution of China’s animal husbandry carbon emissions. J. Arid Land Resour. Environ. 2022, 36, 65–71. [Google Scholar]
- Huang, Y.; Liang, H.; Wu, Z.; Xie, Z.; Liu, Z.; Zhu, J.; Wan, W. Comprehensive assessment of refined greenhouse gas emissions from China’s livestock sector. Sci. Total Environ. 2024, 946, 174301. [Google Scholar] [CrossRef]
- Wang, L.; Shi, P.; Luo, J.; Yin, J.; Cheng, F.; Shi, J.; Wang, Z. Region-county characteristics of spatiotemporal dynamic evolution and influencing factors on agricultural net carbon sink in Hexi region of Gansu Province. Ecol. Indic. 2024, 169, 112817. [Google Scholar] [CrossRef]
- Dong, X.; Zheng, L.; Lian, H.; Tian, B.; Chen, Z. Temporal and spatial dynamics and drivers of China’s agriculture net carbon sink. J. Soil Water Conserv. 2024, 38, 198–208. [Google Scholar]
- Ren, H.; Li, H.; Feng, Y. Dynamic evolution characteristics and development trend of agricultural carbon emissions in Guangdong Province based on spatial and temporal perspective. Chin. J. Eco-Agric. 2023, 31, 1287–1300. [Google Scholar]
- Miande, L.; Zhou, D.; Zhu, X.; Haiqiang, Q.; Ma, J.; Zhang, J. Spatial-temporal characteristics of agricultural carbon emissions and influencing factors in the Hexi Corridor from 2000 to 2020. J. Agric. Resour. Environ. 2023, 40, 940–952. [Google Scholar]
Disclaimer/Publisher’s Note: The statements, opinions and data contained in all publications are solely those of the individual author(s) and contributor(s) and not of MDPI and/or the editor(s). MDPI and/or the editor(s) disclaim responsibility for any injury to people or property resulting from any ideas, methods, instructions or products referred to in the content. |
© 2025 by the authors. Licensee MDPI, Basel, Switzerland. This article is an open access article distributed under the terms and conditions of the Creative Commons Attribution (CC BY) license (https://creativecommons.org/licenses/by/4.0/).