Article

Optimizing UAV Spraying for Sustainability: Different System Spray Drift Control and Adjuvant Performance

by
Michail Semenišin
*,
Dainius Steponavičius
,
Aurelija Kemzūraitė
and
Dainius Savickas
Department of Agricultural Engineering and Safety, Vytautas Magnus University Agriculture Academy, Studentų St. 15A, Kaunas District, LT-53362 Akademija, Lithuania
*
Author to whom correspondence should be addressed.
Sustainability 2025, 17(5), 2083; https://doi.org/10.3390/su17052083
Submission received: 8 January 2025 / Revised: 13 February 2025 / Accepted: 25 February 2025 / Published: 27 February 2025
(This article belongs to the Section Sustainable Agriculture)

Abstract

:
Agricultural spraying, despite modern technological advances, still poses the problem of downwind spray drift, which contributes to environmental contamination and ecological imbalance, which are critical sustainability concerns. This study investigated the effect of lateral wind on different unmanned aerial vehicle (UAV) spraying systems under semi-controlled conditions, additionally evaluating the impact of four tank-mix adjuvants (drift reduction agents (DRAs)) at varying concentrations on spray effectiveness, droplet size, and deposition compared to water as a control. By examining UAV-specific spray dynamics, this research provides insights into sustainable drift reduction strategies that minimize environmental impacts. For the UAV spraying performance trials, three UAVs with different spraying configurations were tested, TTA M6E, XAG XP2020, and DJI T30, to identify the most effective system for minimizing downwind spray drift. For the DRA effectiveness trials, four commercially available adjuvants were evaluated at different concentrations utilizing the T30 UAV, which was chosen because it produces the highest proportion of fine droplets. The DRA products included an ionic/non-ionic surfactant (DRA No. 1), silicone-based wetting agents (DRA Nos. 2 and 3), and a silicone-based spreader-adhesive (DRA No. 4). This study showed that, among the tested UAV spray systems, M6E and XP2020 performed better in low-wind conditions, while T30 was more suitable for stable target area deposition in windy conditions but produced higher quantities of fine droplets prone to drifting further. Lateral wind contributes significantly to spray drift, as shown by the results, with increased wind speed causing an additional drift of up to 2 m downwind for all systems. The study also showed that all the tested DRAs exhibit the potential to mitigate drift and improve crop coverage, contributing to more efficient resource use and reduced environmental impacts. All the DRA products either reduce the drift distance by up to 3 m or decrease the deposition by up to 67% compared to water. However, DRA No. 1 showed the best results out of all the tested products in terms of drift control, while DRA No. 4 showed the best target area coverage and adequate drift control capabilities. More field research is required to validate the effectiveness in real-life application scenarios. In summary, the following management measures can be used to control droplet drift using UAV spraying systems, in order of importance: selecting a UAV and nozzles that are optimal for the specific requirements of the spraying task, planning applications in correlation with lateral wind speed, and the use of DRAs.

1. Introduction

Mechanized agricultural spraying methods are acknowledged to have a considerable negative influence on the environment internationally, not least because of the carbon dioxide emissions involved [1,2]. Downwind drift is a common consequence of all types of spraying equipment. Both conventional [3,4] and precision [5] spraying equipment can lead to the leaking of potentially hazardous chemicals into soil and water systems, endangering freshwater and marine ecosystems and impacting biodiversity [1]. Furthermore, these approaches can potentially cause long-term ecological imbalances, disrupt natural pest control mechanisms, and damage soil health [6]. As worries about these effects increase, it is critical to reconsider the present methods and create more ecologically friendly strategies to lessen the adverse effects of agricultural spraying [7].
Recent developments in precision agriculture intended to combat the negative environmental consequences of agricultural practices include the use of unmanned aerial vehicles (UAVs) in spraying activities [8]. This approach allows for more directed spraying, thus ensuring precise chemical application [9] and, consequently, lower CO2 emissions and lower chemical quantities involved in spraying operations [2]. Because UAVs optimize chemical usage and reduce the reliance on heavy agricultural equipment, they also help decrease soil compaction, thus further contributing to environmental sustainability [10]. While, in theory, these technologies allow for precision treatments that could significantly reduce the application of pesticides and the overall ecological footprint of agricultural spraying [11], agricultural UAVs pose a unique set of challenges [2,5,12].
The main difficulty with using agricultural UAVs is the spray solutions’ downwind drift, which is detectable even when the ambient wind speed is insignificant [11]. Some researchers have found the associated environmental and health impacts [13] to be more significant than when operating ground-based spraying equipment [14]. The altitude and speed at which UAVs operate [15] and the impact of stronger and more unpredictable wind currents at greater altitudes are the main external causes of this increased drift [16]. Unlike ground-based sprayers, which can apply chemicals closer to the crop surface, UAVs are more prone to dispersing fine droplets over unintended areas, especially under windy conditions [17]. Using a computational fluid dynamic (CFD) simulation, a research group [18] has determined that various wind vortices—including wake vortices, ground diffusion airflow, and vortex rings—form in the UAV rotor downwash field under the UAV. A negative velocity channel also forms directly beneath the rotors. As the distance from the rotors increases, the wake vortex airflow expands over a larger area. As a result, initially independent vortices gradually begin to interact, causing turbulence [18]. Another group, using the CFD method, has determined that the downwash field forms in a spiral motion, as expected from the motion generated by the rotors [19]. Other researchers determined, using trials, that typical operational adjustments (mainly altitude and weight) impact the airflow pattern in multiple directions, primarily vertically, which in turn influences how the spray is dispersed below the UAV [20]. Furthermore, an upwash phenomenon was detected in CFD simulations when the operating altitude is too close to the ground [19]. Another group stated that the velocity of the rotors determines the strength of the downwash force and is mainly affected by the weight and forward motion of the UAV [21]. Results also demonstrated a strong positive relationship between downwash intensity and both spray deposition and penetration, while a negative correlation was observed with droplet distribution uniformity and drift control [20]. However, in this context, there are more spray characteristics that should be considered when defining drift, such as the droplet velocity, density and viscosity of the solution, and angle and shape of the spray pattern, which can also play a crucial role in combating drift. Additionally, external conditions such as air temperature and relative air humidity also play a critical role [22]. In this regard, there have been many studies [12,23,24,25,26,27,28] performed to determine the best method of combating spray drift for UAV sprayers.
The most common spray solution downwind drift control methods suggested by various authors are as follows:
  • Adjusting the positioning, quantity, and type of nozzles;
  • Operational settings (flight speed, altitude);
  • Tank-mix adjuvants.
Firstly, considering the design of commercially available UAV spraying systems, the positioning and number of nozzles relative to the UAV rotors can significantly influence the distribution and size of the spray droplets, impacting how susceptible they are to downwind drift [23,24,29]. When the nozzles are positioned beneath the rotors, droplet deposition demonstrates greater penetration compared to when the nozzle is installed along the central axis. This suggests that placing the nozzles below rotors helps prevent droplets from entering the turbulent vortex coupling region, thereby minimizing droplet drift [18]. In addition to UAV design considerations, the type of nozzle used is critical [17,27], with certain designs, such as air-induction nozzles, producing larger droplets that are less prone to drift compared to finer misting nozzles [23]. Centrifugal and pressure spraying systems are not interchangeable, which poses additional challenges in the search for a universal solution to drift issues. However, research [17,30] suggests that centrifugal nozzles are a superior option, and so more manufacturers are defaulting to this design in newer models. Pressure swirl atomizers [31] could produce a spray pattern similar to that produced by centrifugal nozzles and so could be a potential aftermarket solution to improve the deposition parameters of pressure spraying systems. Furthermore, operational settings such as flight speed and altitude play a pivotal role in reducing (or causing) drift. Slower flight speeds and lower altitudes can improve targeting accuracy, while higher operational speeds and altitudes tend to cause more drift [26,28,32]. Lastly, the use of tank-mix adjuvants (drift reduction agents (DRAs)), which alter the physical properties of the spray solution, can further reduce downwind drift by enhancing droplet formation and reducing evaporation [25,27,33].
Tank-mix adjuvants have the potential to improve the spray drift control, retention, spread, and adherence of spray droplets [25]. By modifying the physical properties of the spray solution, adjuvants can help create larger, more uniform droplets that are less susceptible to downwind drift, reducing off-target contamination [33]. Additionally, adjuvants can aid in the even spreading of the solution across plant leaves, ensuring more comprehensive coverage and better pest or disease control [33,34]. This can be particularly beneficial for minimizing runoff and ensuring that the chemicals remain on target, ultimately increasing the efficiency of the application while reducing environmental risks. However, the effectiveness of adjuvants depends on their compatibility with the specific chemicals used and environmental conditions, which highlights the need for careful selection and testing in real-world agricultural settings [33,35]. Although the use of adjuvants is widespread in other types of sprayers, outside of Asia, no official recommendation advocating their use in UAV sprayers has yet been provided by manufacturers, and no concentration recommendations for this type of sprayer are listed. Studies have collectively demonstrated that adjuvant formulations containing silicone-based compounds or vegetable oils not only increase droplet sizes but also significantly mitigate spray drift. This reduction in drift distance and volume potential enhances on-target deposition and minimizes pesticide wastage.
For instance, silicone derivatives such as alkoxy-modified polytrisiloxane have shown superior spreading performance, even at low concentrations (e.g., 0.3% for wheat applications [25]). Similarly, vegetable oil-based adjuvants, such as methylated oils, achieve optimal droplet formation and deposition at concentrations ranging from 6% to 16%, depending on the specific formulation [25,36]. Furthermore, some adjuvants, such as those composed of alkyl polyoxyethylene esters and alkyl polyglycosides, have been reported to improve droplet deposition, increase pest control efficiency, and reduce pesticide usage by as much as 30%, a particularly valuable feature in UAV applications [37]. Additional studies corroborate these findings, noting that optimized adjuvant formulations can reduce pesticide application rates by up to 20% [38] while simultaneously enhancing coverage and uniformity [33,39,40]. These advancements underscore the pivotal role of adjuvants in achieving sustainable and efficient UAV-based agricultural spraying. Moreover, while adjuvants are commonly used to modify spray characteristics in traditional ground-based sprayers, their specific interactions with UAV spray dynamics, such as droplet size, drift, and deposition, remain underexplored due to most research focusing on one or two variables.
To summarize, although the effects of adjuvants on UAV spraying applications are under investigation, there remains limited insight into the optimal concentrations and product choices for achieving effective drift control for UAV applications under different meteorological conditions. Considering that different dosages may interact with UAV-specific spray patterns differently than they do with other types of sprayers, more insight is needed into the formulation of drone-specific DRAs.
The main objectives of this study are as follows:
(i)
To determine the effect of lateral wind on the spray drift of droplets generated by different UAV-based spray systems at different lateral wind velocities;
(ii)
To assess the impact of four different tank-mix adjuvants on UAV spraying effectiveness and optimize their concentrations for UAV application under semi-controlled conditions.

2. Materials and Methods

2.1. Meteorological Conditions and Location

The trials of UAV spraying performance comparison and DRA effectiveness were carried out in October 2023. The days for the trials were chosen to be as similar in terms of ambient weather conditions as possible. The air temperature during the trials was 8 ± 4 °C, and the relative air humidity was 72 ± 5%. These environmental conditions were considered favorable for reducing fine droplet evaporation, and the variation in values had a negligible effect on the results. The naturally occurring wind speed during the trials was found to be less than 0.2 m s−1, and it was, therefore, assumed that the influence of ambient wind was not significant. The trials were performed on the premises of Vytautas Magnus University Agriculture Academy, Lithuania.

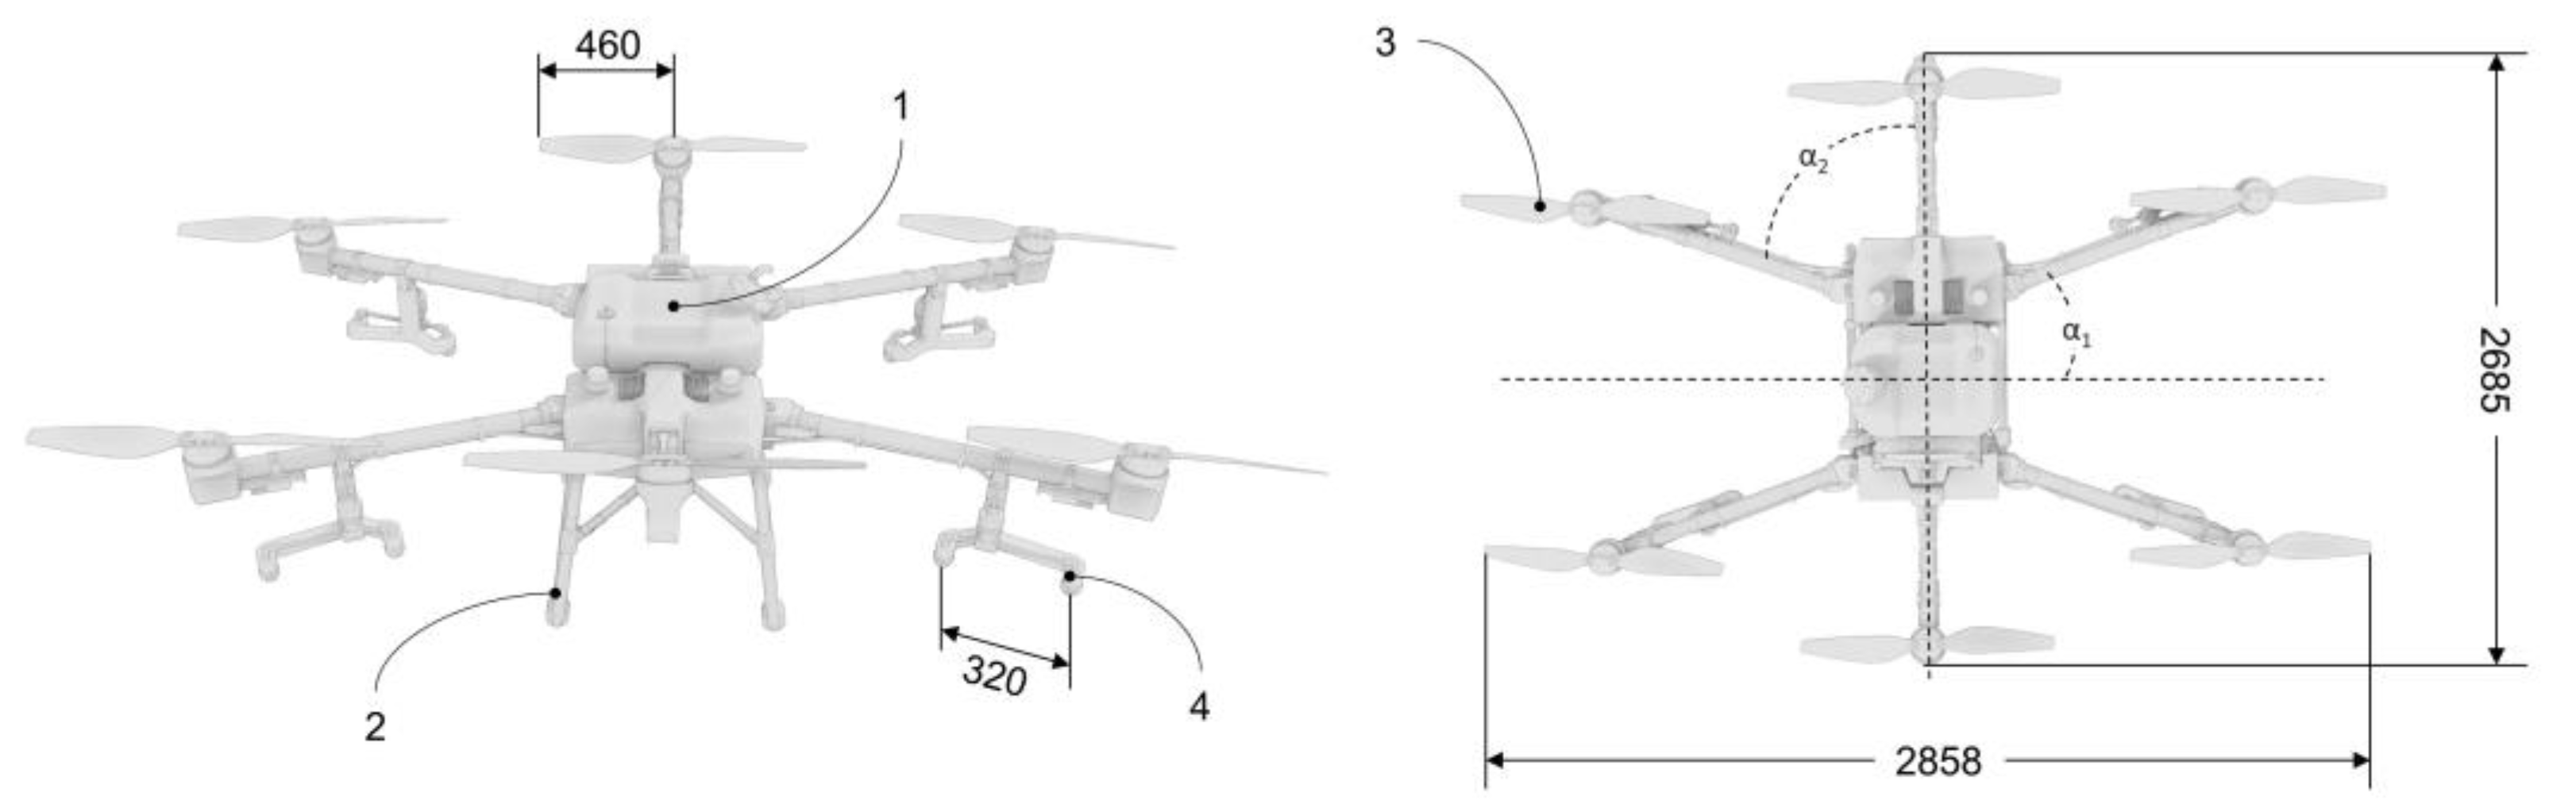
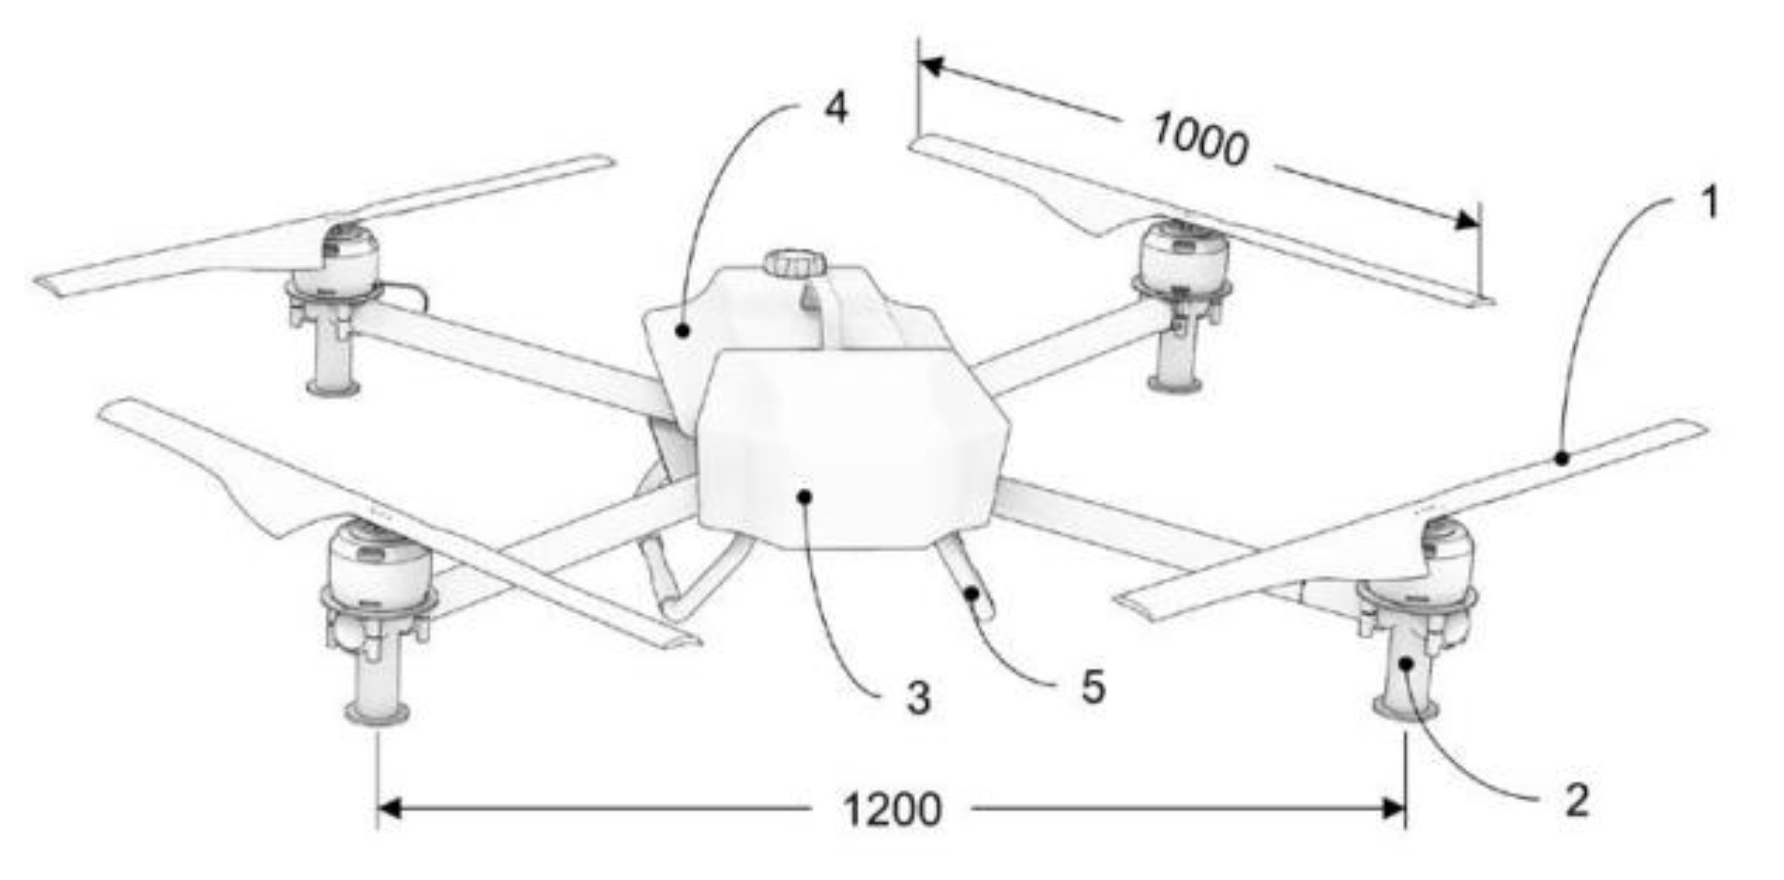
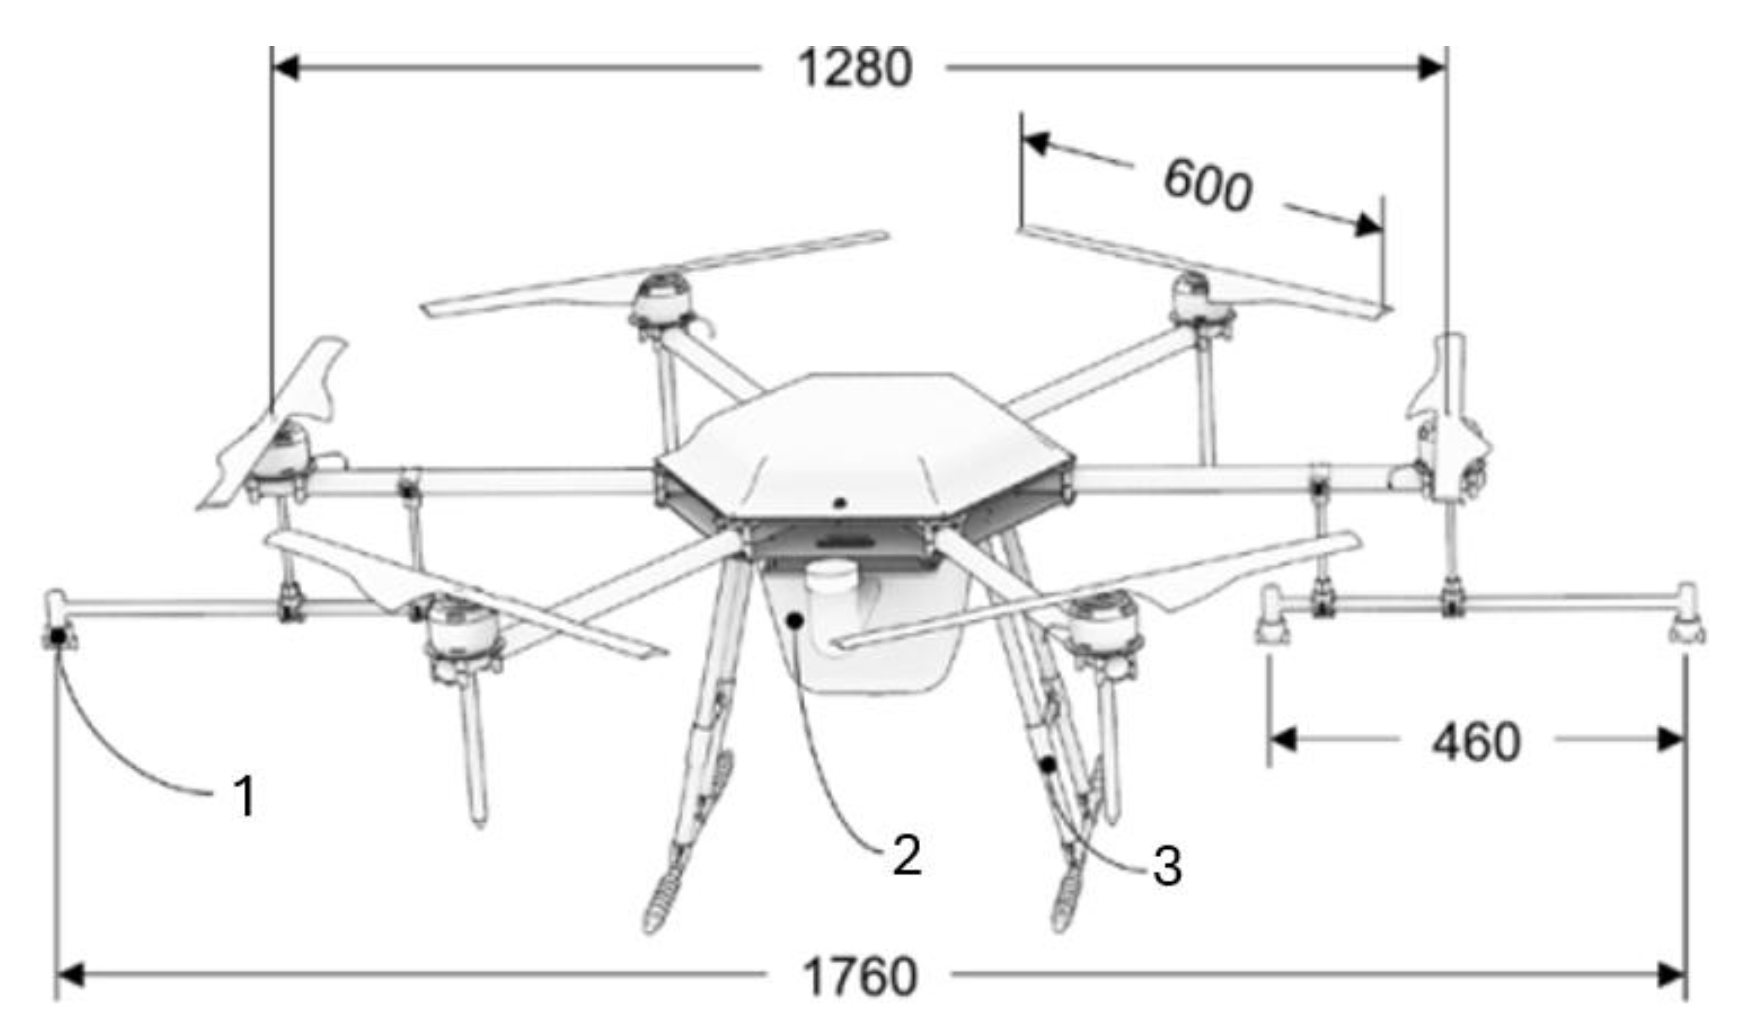
2.2. UAVs Used for Spraying Performance Trials

For the UAV spraying performance comparison trials, three UAVs—T30 (DJI, Shenzhen, China), XP2020 (XAG, Guangzhou, China), and M6E (TTA, Beijing, China)—with different propulsion and spraying configurations were selected. Confirmation of other authors’ findings and identification of the most efficient system and configuration for downwind drift control were achieved by comparing the UAV target zone spray deposition coverage and the spray solution’s downwind drift distance and coverage.
A T30 (Figure 1) six-rotor, 16 flat fan Teejet XR11001 (Glendale Heights, IL, USA) nozzle configuration UAV (nozzles located directly under propellers), an XP2020 (Figure 2) four-rotor UAV with centrifugal nozzles under the propellers, and an M6E (Figure 3) six-rotor boom-sprayer UAV with four flat fan Lechler ST110-015 (Metzingen, Germany) nozzles were compared under the same trial conditions to determine which can deliver the best target area spraying quality and minimal drift risk.
It is worth noting that even though M6E and T30 have the same number of propellers, the turbulence fields and downwash forces created by them are different, and hence, the deposition quality is different due to the motor rotation direction and other structural differences. The propellers on the M6E go in a sequence of clockwise (CW) and counterclockwise (CCW), while on the T30 UAV, the sequence is not CW–CCW–CW–CCW–CW–CCW but rather CW–CCW–CCW–CW–CW–CCW. This, in comparison, lowers the intensity of the two turbulence zones [25] and provides more stable handling of the UAV and a more even distribution of sprayed droplets. The difference in propeller sizes and total weight is the main cause for the difference in generated downwash intensity, with T30 providing a more powerful downforce.
The XP2020 UAV only has four rotors, which reduces the turbulence created by the UAV (compared to six-rotor UAVs) and, in doing so, provides a more uniform spray distribution. Due to the propellers being larger and spinning faster to account for their quantity, the spray deposition is also improved because of the propeller downwash exerted by the propellers on the droplets.
These models with different spraying systems were chosen because we noticed a lack of studies comparing the different UAV spraying systems’ efficiencies in terms of drift control. Furthermore, centrifugal spraying systems are considered superior by some research teams [17,30] and manufacturers, e.g., DJI switching to these systems in newer-model UAVs. This led to an investigation of the significance of performance differences.

2.3. DRAs Used for Spraying Trials

For the DRA effectiveness studies, four different commercially available DRA products were sprayed using the T30 UAV spraying system. This system was selected due to its tendency to produce the largest proportion of fine droplets compared to the other tested systems. The recommended dosages provided below were intended for ground-based spraying equipment. These may differ for UAV applications. Therefore, manufacturers of all products selected for testing have been consulted to identify the concentrations they expect to perform optimally under the conditions of this trial. The DRA compositions are as follows:
DRA No. 1 includes ionic and non-ionic surfactants. It contains ~50% calcium dodecylbenzene sulfonate (an anionic surfactant) and ~18% butanol. Butanol (C4H9OH) is a simple alcohol that, despite having both hydrophilic (-OH) and hydrophobic properties, is not traditionally classified as a non-ionic surfactant. According to the label, the optimal quantity of the product in the tank-mix is 0.1% of the total volume for ground-based spraying equipment. Concentrations of 0.1%, 0.2%, 0.3%, 0.4%, 0.5%, 0.75%, and 1.0% were used for the effectiveness trials. Due to the surfactant in the formulation, this DRA can increase the retention of droplets and provide a more uniform coverage of the plant surface by reducing the surface tension and increasing the spread of droplets on leaf surfaces [41]. The anionic surfactant in the composition of this DRA was shown to reduce the surface tension and change the viscoelastic modulus of the foam in the solution [42].
DRA No. 2 is a silicone-based drift reduction agent. It contains 5–10% polyalkyleneoxide-modified heptamethyltrisiloxane (a silicone-based surfactant) and polyalkylene glycol (synthetic polymer). According to the label, the optimal quantity of the product is 0.1–1.0% of the total tank-mix volume for ground-based spraying equipment. Concentrations of 0.35%, 0.50%, 0.75%, and 1.0% were used for the effectiveness trials. A study has found that this DRA reduces the drift potential not by eliminating all small droplets but rather by making the droplet size spectrum wider [43]. Another research group [44] found this DRA to cause lower toxicity of pesticides to some species of aquatic fauna compared to other organosilicons with similar compositions. This, in turn, means the DRA had a lower environmental impact compared to alternatives [44]. The chemicals in this solution were reported to cause reduced surface tension and, subsequently, the better wettability of hydrophobic surfaces [45,46].
DRA No. 3 is an organosilicon drift reduction agent that improves the wetting capabilities of droplets. It comprises 75–90% polyether-modified trisiloxane (silicone-based surfactant). According to the label, the optimal mixing range for the product is 0.1–0.5% of the total volume for ground-based spraying equipment. Concentrations of 0.2%, 0.35%, 0.5%, and 1.0% were used for effectiveness trials. Meng et al. [47] determined that a minimum of 2% organosilicon in the tank-mix is necessary to achieve discernible spreading effects. Results using adjuvants with this chemical composition proved to be superior in terms of reducing the surface tension of solutions [48].
DRA No. 4 is a drift-reducing spreader-adhesive. It comprises 25–35% polyether polymethylsiloxane copolymer (silicone-based surfactant) and 30–40% styrene–acrylate copolymer (synthetic polymer). According to the label, the optimal mixing range for the product is 0.1–0.3% of the total tank-mix volume for ground-based spraying equipment. Concentrations of 0.35%, 0.50%, 0.75%, and 1.0% were used for effectiveness trials. Polymers containing silane groups can form covalent C–O bonds with surfaces containing hydroxy groups, increasing the solution’s adhesion to plant surfaces [49]. By altering the surface tension of the solution at the solution/surface interface, this DRA should cause increased wettability capabilities [50]. This can increase the retention of droplets and provide a more uniform coverage of the plant surface by reducing the surface tension and increasing the spreading of droplets due to the surfactants in the formulation [41].
Before the UAV spraying performance comparison trials, static and dynamic surface tension and droplet spreading tests were performed for all concentrations of DRA to be used in the UAV drift trials. The static (equilibrium) surface tension of each solution was measured with a BP50 tensiometer (Krüss, Hamburg, Germany) using the Wilhelmy plate technique [40]. Three measurements were performed to obtain an averaged value; if a deviation greater than 1% was recorded, the trial was repeated until all three results were in a 1% deviation range. The obtained static surface tension data can be seen in Table 1.
Dynamic surface tension assessments for all concentrations of DRA solutions were conducted by using the same bubble pressure tensiometer BP50 as in the static surface tension trials. Bubbles were generated at a varying rate during the measurement to ensure a low enough rate to achieve equilibrium. The maximum values of bubble pressure versus time were used to calculate the dynamic surface tension at a surface age of 50 ms. The obtained dynamic surface tension data can be seen in Table 2.
The spreading properties for droplets of all concentrations were measured by placing a 50 μL droplet on a hydrophobic polyester Petri dish, imitating the surface of a plant leaf. The data obtained for the spreading properties of all DRA concentrations to be used in the UAV studies can be seen in Table 3.

2.4. UAV Spraying Performance Comparison Trial and DRA Effectiveness Trial Setup

During the trials, a Delta OHM DO 9847 multimeter (Senseca srl, Selvazzano Dentro, Italy) was used to measure environmental factors (temperature, wind speed, and humidity). The instrument was used with two different attachments. The first was an HP472AC transducer (Senseca srl, Selvazzano Dentro, Italy) for air temperature and relative air humidity measurements, and the second was an AP471 S1 transducer (Senseca srl, Selvazzano Dentro, Italy) for air speed measurements.
A wind generator (Figure 4) used in ground sprayer performance studies [51] was used to conduct the UAV spray drift trials (Figure 5). It consisted of two identical axial fans ML 1004 DT (Electrovent, Soiano del lago, Italy) with an impeller diameter of 1000 mm, 10 plastic material airfoil blades, an electric motor 7SM3 160L4 (power, 15 kW, and rotation, 1465 min−1) (Smem, Monza, Italy), deflectors, and an airflow straightener attached to the front to ensure laminar airflow. Fans were controlled by two Delta VFD-C2000 (Delta Electronics, Taipei, China) variable frequency converters. The study used water-sensitive paper (WSP) from the Swiss manufacturer Syngenta (Basel, Switzerland). The setup of the WSP mounting plates may vary depending on the planned trials and model of the UAV. The WSP method was chosen due to other research groups determining this method to be very effective at measuring drift deposition at various distances from the UAV [36,52,53]. For drift evaluation, the target area is only registered on the opposite side of the wind generator from the center of the UAV.
During these trials, the UAV spraying performance and DRA effectiveness were studied at three different wind levels. Frequency converters were used to change the air flow (wind) speed from 0 m s−1 (off) to 8 m s−1, every 4 m s−1. The results for 0 m s−1 can be viewed as perfect operating condition data. However, in real field applications, this kind of weather can rarely be observed. The results for 4 m s−1, the average wind speed throughout the growing season, can be interpreted as the typical operational conditions for UAV spray application. The results for 8 m s−1, the critical maximum wind speed at which UAV systems can be operated safely, reflect the most significant weather extreme at which UAV spraying operations can be performed.
Prior to trials in this setup, the UAVs were tested at a height of 3 m in a windless environment (a greenhouse) to determine the effective spray swath for all model UAVs. This test was performed while operating the UAVs in hover mode. T30 and XP2020 exhibited similar spray widths of 8 m at 3 m height, while the M6E UAV had a 7.2 m spray width at a height of 3 m.
In UAV spraying performance comparison trials, the drones were lifted from the ground to an altitude of 3 m, which is within the typical range of operation altitudes of all UAVs used, as specified in their respective operators’ manuals. All model UAV flight speeds during the trial were 4 m s−1. For all three drones, the standard spray rate was different due to the different spraying system constructions and capabilities. The constant parameter in the comparison of UAV spraying performance was a uniform desired output droplet size of 150 μm. XP2020 allows control of droplet size by changing the settings of the rotary nozzles in the control app. It was set to perform at 30 l ha−1, while the other two UAVs equipped with pressure nozzles had to be set to a certain output of water per hectare to achieve the desired droplet size comparable to the XP2020 UAV. T30 had Teejet XR11001 flat fan nozzles installed. These are very fine droplet-generating 110-degree orifice nozzles, expected to produce the desired droplet size at an internal system pressure of 0.35 MPa, whereas M6E was equipped with Lechler ST110015 nozzles with a 110-degree orifice. These were expected to produce the desired droplet size at 0.3 MPa. The system pressures were measured using a manometer inline of the sprayer system hoses, and approximate values of 40 L ha−1 and 36 L ha−1 were achieved for the models, respectively. During the UAV spraying performance comparison trials, tap water was used.
For the DRA effectiveness trials, only one of the drones was used, T30 (Figure 1). During these trials, the UAV was operated at two different altitudes: 1.5 m (the minimal operation altitude allowed by the operating systems, which coincided with the height of the wind generator setup used in the trial) and 3 m.
For both studies, mounting plates were driven into the ground on the surface of the field (Figure 4 and Figure 5), which were under the center of the UAV, 2.0, 3.0, 4.0, 5.0, 6.0, 7.0, 8.0, 9.0, 10.0, 11.0, 12.0, 14.5, and 17.0 m away from the center of the UAV. The mounting plates were fixed in such a way that the height of their upper part, where the WSP was placed, was 0.2 m from the ground surface. During the spraying performance comparison trials, all target area and drift measurement plate locations had to be adjusted for the M6E UAV due to it having a narrower deposition width (3.6 m from the center of the UAV).
WSPs were used to assess the quality of the target area and drift deposition. Sheets measuring 26 × 25 mm were prepared and attached to the mounting plates (Figure 4). After each test, the liquid droplet-coated papers were collected, scanned, and analyzed using DepositScan software (version ImageJ 1.38x). To analyze the WSP, original images were converted to grayscale using tools available in the DepositScan software [54].

2.5. Methodology for Results Analysis

Three replicate measurements were carried out for each DRA spray solution and water in all spraying scenarios (three different wind speed levels and two UAV operation altitudes). If one of the replications deviated by more than 2 m from the rest, the trials were repeated until three replicate measurements within the distance of 2 m were obtained for that scenario.
The numerical values for the droplet diameter distribution, DV10, DV50 (or VMD—Volume Median Diameter), and DV90; area of WSP covered by droplets (%); and number of droplets in the same area (units per cm2) were determined using DepositScan software. The calculated numerical value of DV90 represents 90% of the sprayed droplets having a diameter equal to or less than the DV90 value. The VMD is the droplet diameter of the liquid, indicating that 50% of the sprayed droplet stream is composed of droplets smaller than the set DV50. As with DV10, the numerical value means that 10% of the sprayed volume consists of droplets with diameters smaller than these values.
To compare the effectiveness of the concentration of DRA in the spray mix, a binary decision-making method was used. If the results at the provided test conditions surpassed the results displayed by spraying water (control), that concentration was considered a positive test result. The concentration with the most positive test results after evaluating all the tested scenarios was deemed the optimal concentration for all scenarios in the final product effectiveness comparison graphs.
As the verification for the binary method in DRA trials, drift potential value (DPV), cumulative drift percentage (CDP), and drift reduction percentage (DRP) were calculated to confirm the findings in accordance with the equations provided below:
D P V = D d T d × P p m n
where
  • ΣDd—drift deposition gathered from all drift WSP in a single trial;
  • ΣTd—all deposition gathered from all WSP in a single trial;
  • Pp—drift-prone droplet percentage from all WSP, considering droplets of finer diameter than 150 μm are prone to drift;
  • m—total number of WSP that gathered any deposition during trial;
  • n—total number of trials performed with a concentration of DRA.
C D P = D d T d × 100 % n
D R P = D d   w a t e r T d   w a t e r D d   D R A T d   D R A D d   w a t e r T d   w a t e r × 100 % n
where
  • ΣDd water—drift deposition gathered from all drift WSP in control trials;
  • ΣDd DRA—drift deposition gathered from all drift WSP in respective DRA modified solution trials;
  • ΣTd water—all deposition gathered from all WSP in control trials;
  • ΣTd DRA—all deposition gathered from all WSP in respective DRA modified solution trials.
For the statistical evaluation of the research results, an ANOVA module with the statistical software Statistica 10.0 was used. Arithmetic averages, standard deviations, and confidence intervals were determined at the p < 0.05 probability level.

3. Results

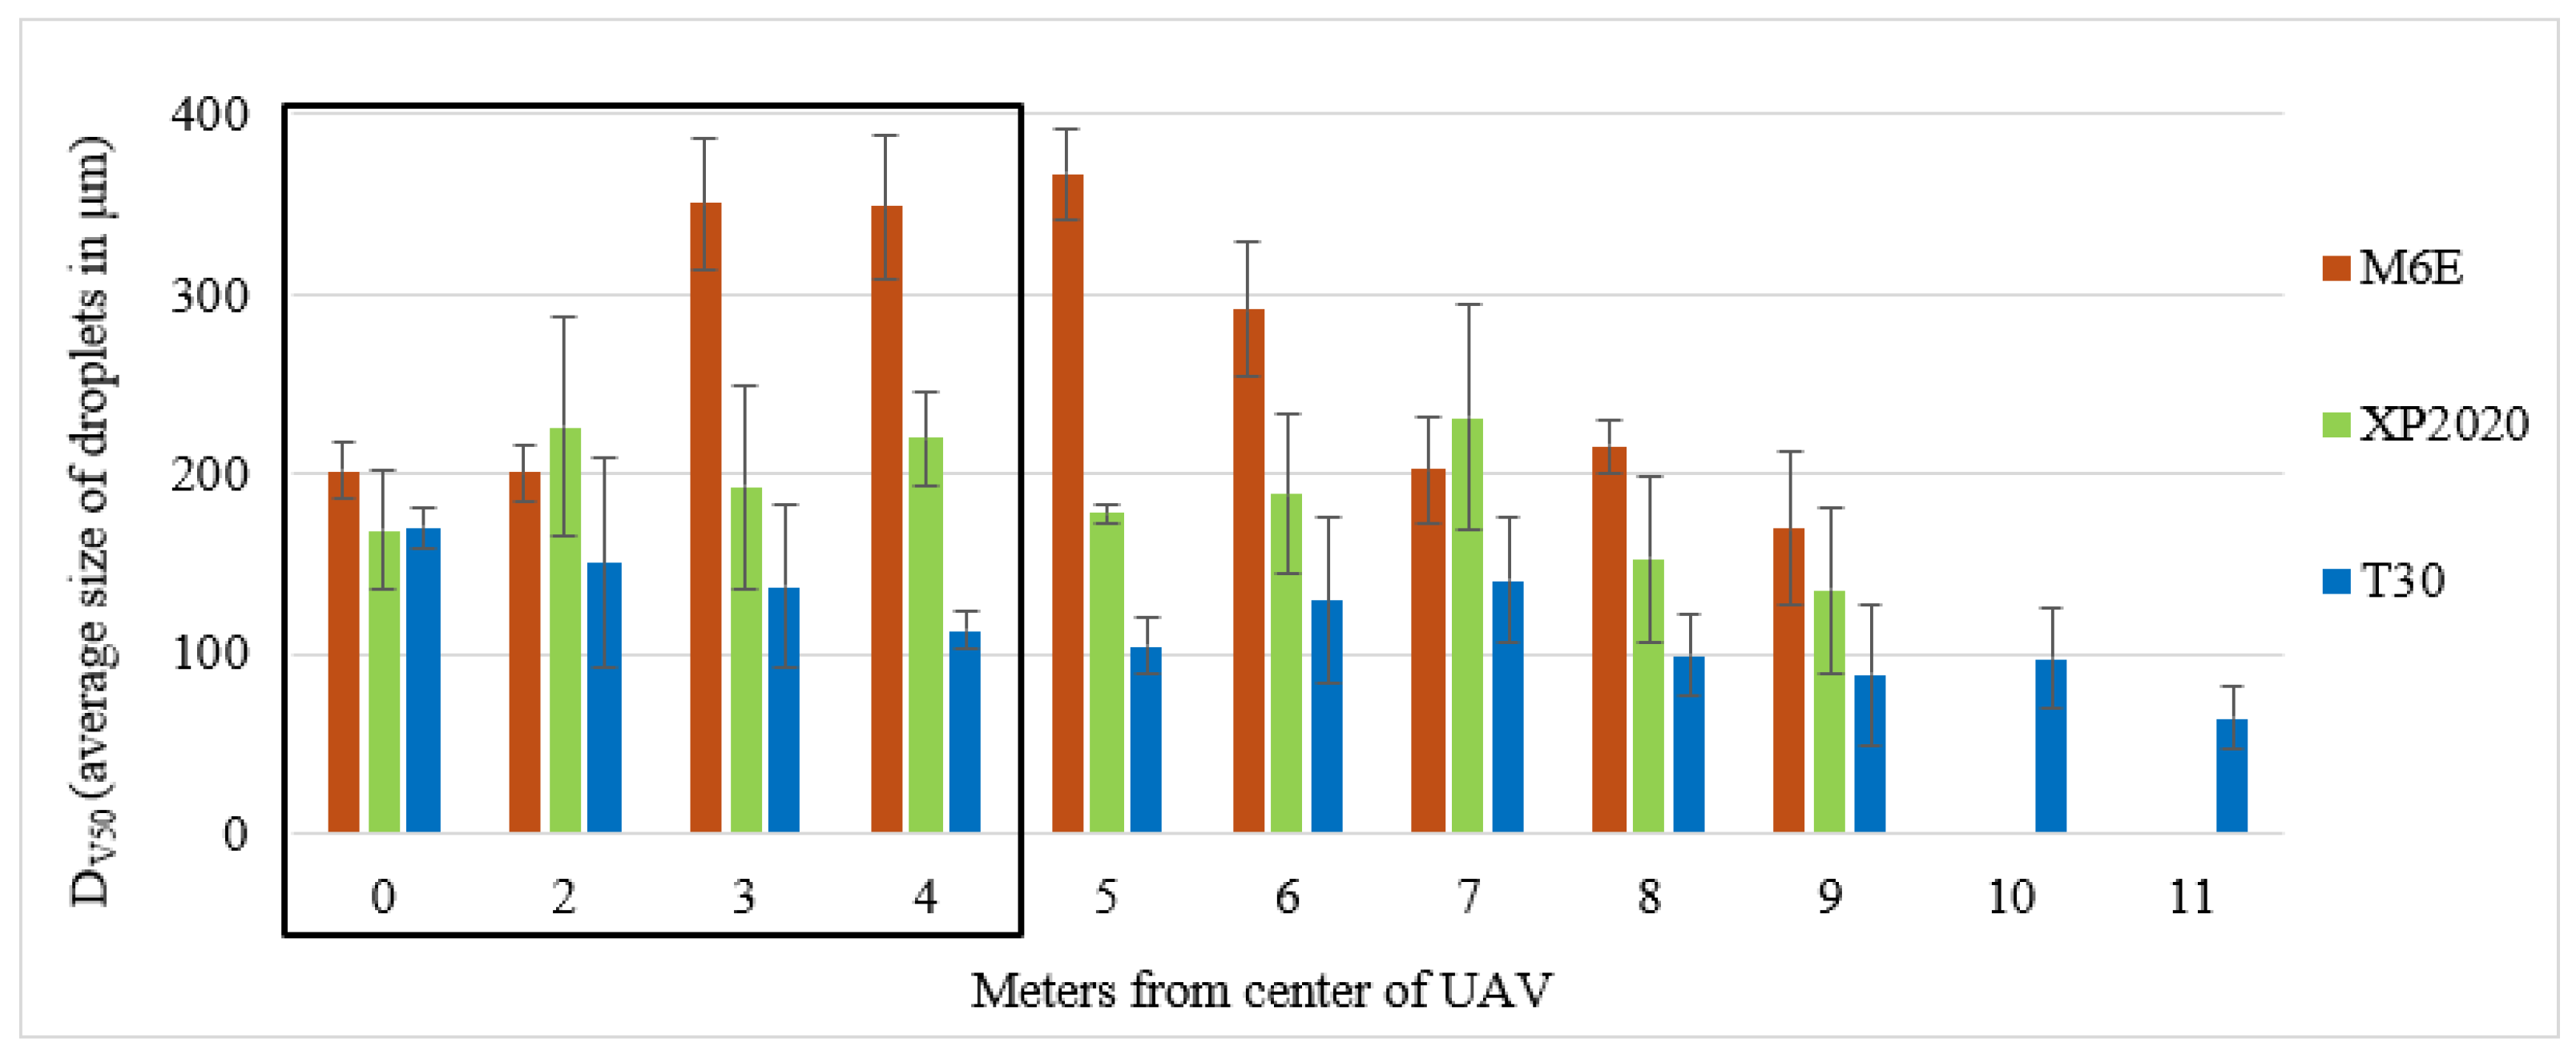
3.1. UAV Spraying Performance Comparison Trials

UAV-based spraying technology remains in the early stages of development. Although research has yielded promising results, many challenges remain unresolved. One major issue is the diversity of UAV models; some are custom-made, while others are commercially produced. The range of shapes, sizes, and propulsion methods makes it difficult to analyze how flight parameters affect spraying quality. Standardizing UAV types or designing adaptable research methods could help refine spraying practices across different UAV models. For this study, three commercially available UAV models were selected and compared in terms of deposition quality and downwind drift of sprayed water.
In Figure 6 and Figure 7, a comparison of these systems is provided at ideal operating conditions (0 m s−1) and critical operating conditions (8 m s−1, the maximum allowable wind speed for stable UAV operation), respectively. Data for typical operating conditions were also gathered during the study.
During these trials, regular tap water was used. The wind generator was not running, and the ambient wind speed as registered by the Delta OHM DO 9847 multimeter during these trials ranged from 0.1 to 0.2 m s−1. All UAVs were set to perform automatic spraying operations with their flight path crossing above the 1st WSP mounting plate, hence making it the center of UAV droplet deposition.
From Figure 6, it can be noted that, at ambient wind conditions, the deposition of spray solution in the target area of both six-rotor UAVs is considerably worse than that of the four-rotor UAV. Comparing M6E and T30, their droplet distributions differ significantly. M6E achieved greater coverage in the target area, likely due to better nozzle performance or placement, while T30 demonstrated consistently lower coverage of the target area, likely due to fine droplet evaporation. However, in these conditions, T30 showed better drift control capabilities. In contrast, the XP2020 system achieved the highest coverage within the target area, indicating a more effective spray pattern, assisted by the superior downwash provided by the four-propeller configuration. M6E (orange) showed the highest initial coverage (~8%), followed closely by XP2020 (green) at around 6%; T30 (blue) was much lower (~3%). At 2 m, XP2020 surpassed M6E in coverage (~6% for XP2020 vs. ~4.5% for M6E). By 3 m, XP2020 continued to have strong coverage (~5%) while M6E decreased; T30 remained consistently low in comparison but uniform within the whole target area. Considering that the spray width of these models at an altitude of 3 m is 8 m (7.2 m for M6E), the target area extends up to 4 m (3.6 m for M6E) on either side of the UAV center line; all data beyond this distance were considered to represent drift of the spray solution. While the wind generator was offline, the drift was a result of only downwash wind vortices generated by the propellers of corresponding UAVs.
In this regard, M6E had the highest spray solution drift potential, as could be expected due to the UAV having six turbulence zones that occur where the airflows generated by individual propellers meet. The XP2020 UAV showed the highest average coverage across the target area, suggesting better performance. However, downwind drift was still present and will pose an environmental risk when considering spraying along the edges of bodies of water, ecologically certified crop fields, or residential areas. T30 consistently exhibited lower coverage despite spraying the highest volume of water among all the tested UAVs. This suggests that the nozzles on T30 produced a more diffuse spray pattern, even when operating at higher spray system pressure settings, or the spray wake was prone to more intense evaporation due to a higher quantity of fine droplets. Alternatively, a greater number of droplets could have settled on the underside of the WSP mounting plates, which was not considered part of the testing surface in these trials due to ground-induced vortices.
The error bars seen in Figure 6 are significant in several cases, especially for M6E and XP2020 in the target area, suggesting high variability in coverage. This could stem from droplet dispersion inconsistencies caused by the fluctuating downwash airstream. Even though T30 exhibited lower dispersion close to the center of the target area, the edges still show high variability in coverage, as in the case of other UAVs used in the trial. This could be explained by the increased number of nozzles at the front and back of the UAV (side arms only have two nozzles each, while the centerline arms have four nozzles each), which enabled it to provide more precise deposition in the target area.
At minimal environmental wind speeds and an operating altitude of 3 m, XP2020 achieved the most consistent target area coverage, while M6E started strong but dropped off quickly. T30 performed less effectively in terms of target area coverage, potentially indicating a need for closer proximity or different operational settings for optimal results. Furthermore, T30 exhibited the best drift control capabilities in these operating conditions.
Figure 7 shows that, except for T30, the densest droplet deposition shifted by up to 5 m from the UAV’s flight path. This suggests that T30 had the strongest propeller downwash, keeping more of the sprayed solution within the target area under higher lateral wind conditions. The smallest droplets from T30 drifted further downwind compared to those from M6E and XP2020, even though the target area shifted by up to 5 m, indicating that T30 produced a greater proportion of fine droplets compared to the other systems. However, the data in this graph also indicate that both M6E and XP2020 had a weaker downwash force that was unable to mitigate the drift induced by high-speed lateral winds.
M6E consistently achieved the highest coverage at most distances, particularly 3–5 m from the centerline, where it outperformed the other two models. This suggests that M6E generated a denser spray pattern. Despite the highest deposition area shifting 5 m from the centerline, the formation of fine droplets was better controlled compared to T30. However, XP2020 outperformed M6E in its ability to reduce the volume of drifted spray. XP2020 demonstrated moderate coverage in the target area, similar to M6E, with less variation in coverage as the distance increased. It generally performed better than T30 closer to the centerline. Despite using the highest water volume per hectare, T30 showed the lowest coverage at most distances, with minimal values near the UAV center, most likely due to the ground-induced vortices and the liquid sticking to the underside of the mounting plates.
A wind speed of 8 m s−1 contributed to greater spray drift distance and volume, which was evident when comparing Figure 6 and Figure 7. M6E and XP2020 could be preferable choices under high-wind conditions if only drift distance was considered. However, when looking at the volume of drifted solution, T30 showed significantly better results in higher wind conditions. This analysis highlighted the importance of matching the UAV model and spray settings to the environmental conditions, especially wind speed, to achieve optimal coverage. The findings implied that each UAV model might require optimization or specific operational adjustments to improve performance under windy conditions. T30 consistently showed the lowest coverage among the three models at all analyzed wind speeds with limited target area deposition. This suggested that T30 produced a greater proportion of fine droplets, which were more susceptible to evaporation. However, the drifted solution volume was the lowest out of all models under the tested conditions. Furthermore, its performance did not decline as sharply in the presence of wind, likely because it started with a more confined spray pattern, and the downwash force generated by the propellers was significantly higher.
As can be seen in Figure 8, the average droplet size of T30-generated droplets was smaller and, therefore, made the sprayed solution more prone to drift under windy conditions. Under 0 m s−1 conditions (Figure 6), all models had relatively higher and more consistent coverage with smaller error bars in the target area. This consistency decreased as the wind speed increased (Figure 7), especially for the M6E and XP2020 models, which showed larger variability (larger error bars) under windy conditions. T30’s coverage was generally more consistent across all wind conditions, as seen by the smaller error bars. However, this consistency came at the cost of reduced overall coverage, indicating that T30 may be better suited to low-wind environments, where it can provide stable and consistent localized coverage. It also shows promise in high-wind environments, with the smallest volume of drifted solution suggesting that aftermarket nozzles or adjuvants that can produce larger droplets could be a solution to the drift challenges it faced during the study. This suggested that, in high-wind environments, applications might benefit from using M6E or XP2020. However, the operator should adjust the field boundaries in such a way that the operating trajectory would be offset by a certain distance in the upwind direction to ensure efficient coverage of the whole field to be treated, with minimized effects on the surrounding areas.
The significant shift in coverage at 8 m s−1 compared to 0 m s−1 highlighted that wind was a major factor influencing spray drift and coverage effectiveness. However, propeller downwash-induced vortices were among the critical causes for drift to occur. For applications in open areas where wind is common, UAV spraying requires wind-induced drift control strategies, such as lowering spraying altitude, adjusting droplet size, adjusting application rates, or modifying the final solution with DRA to reduce the overall droplet drift potential.

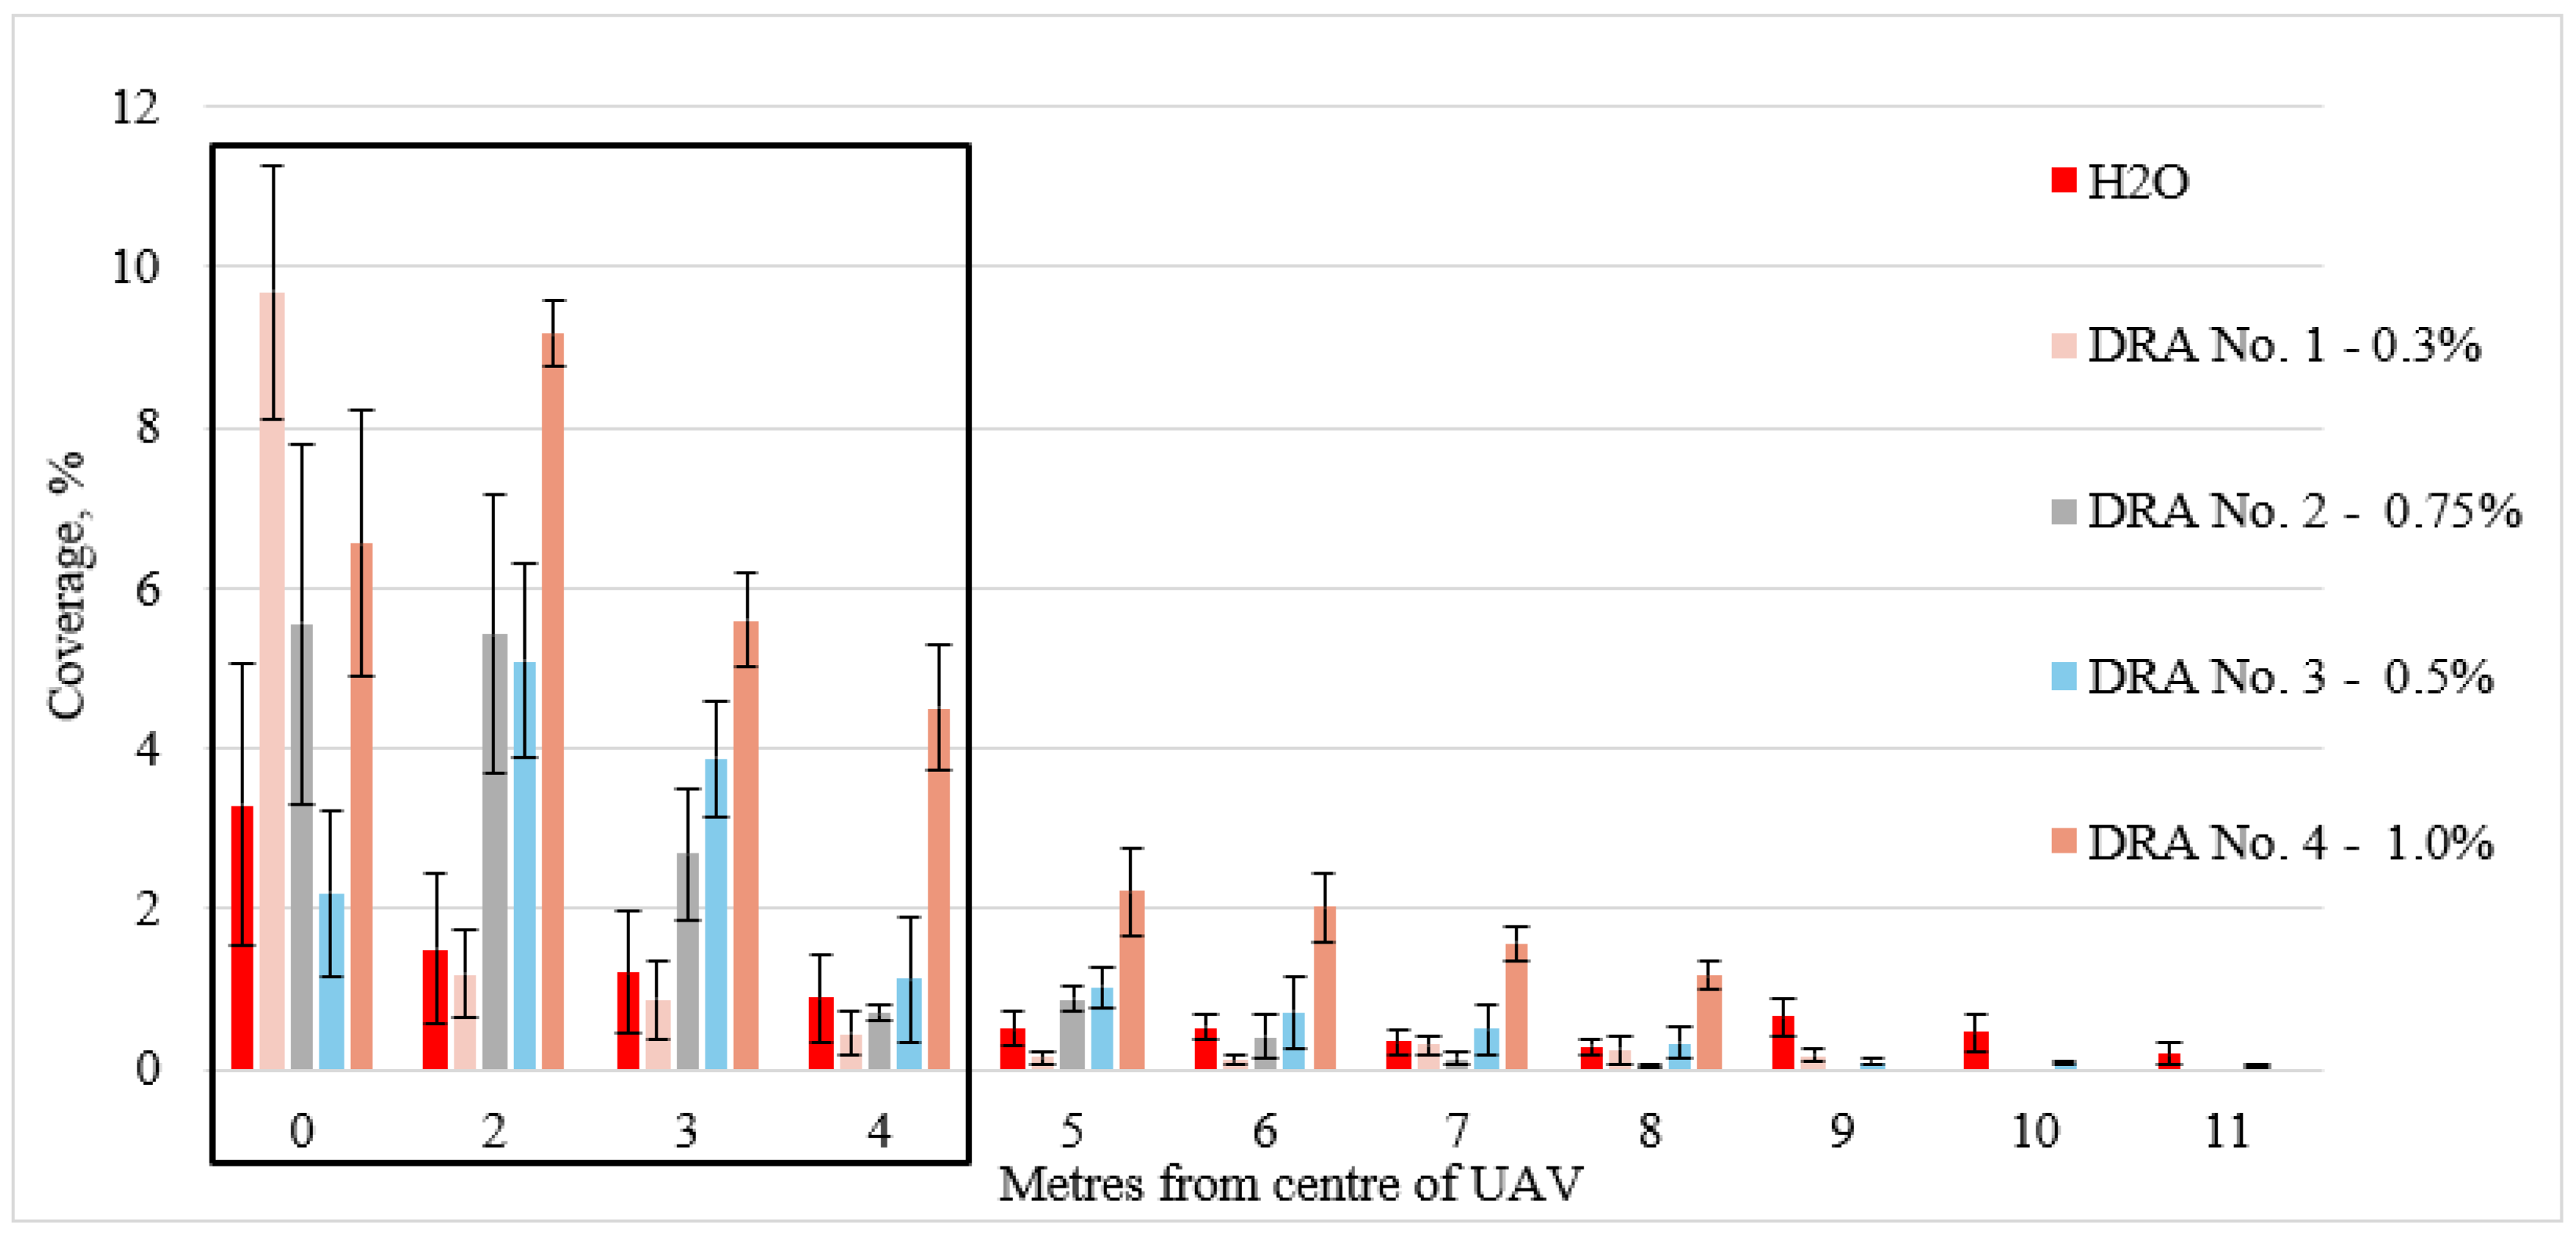
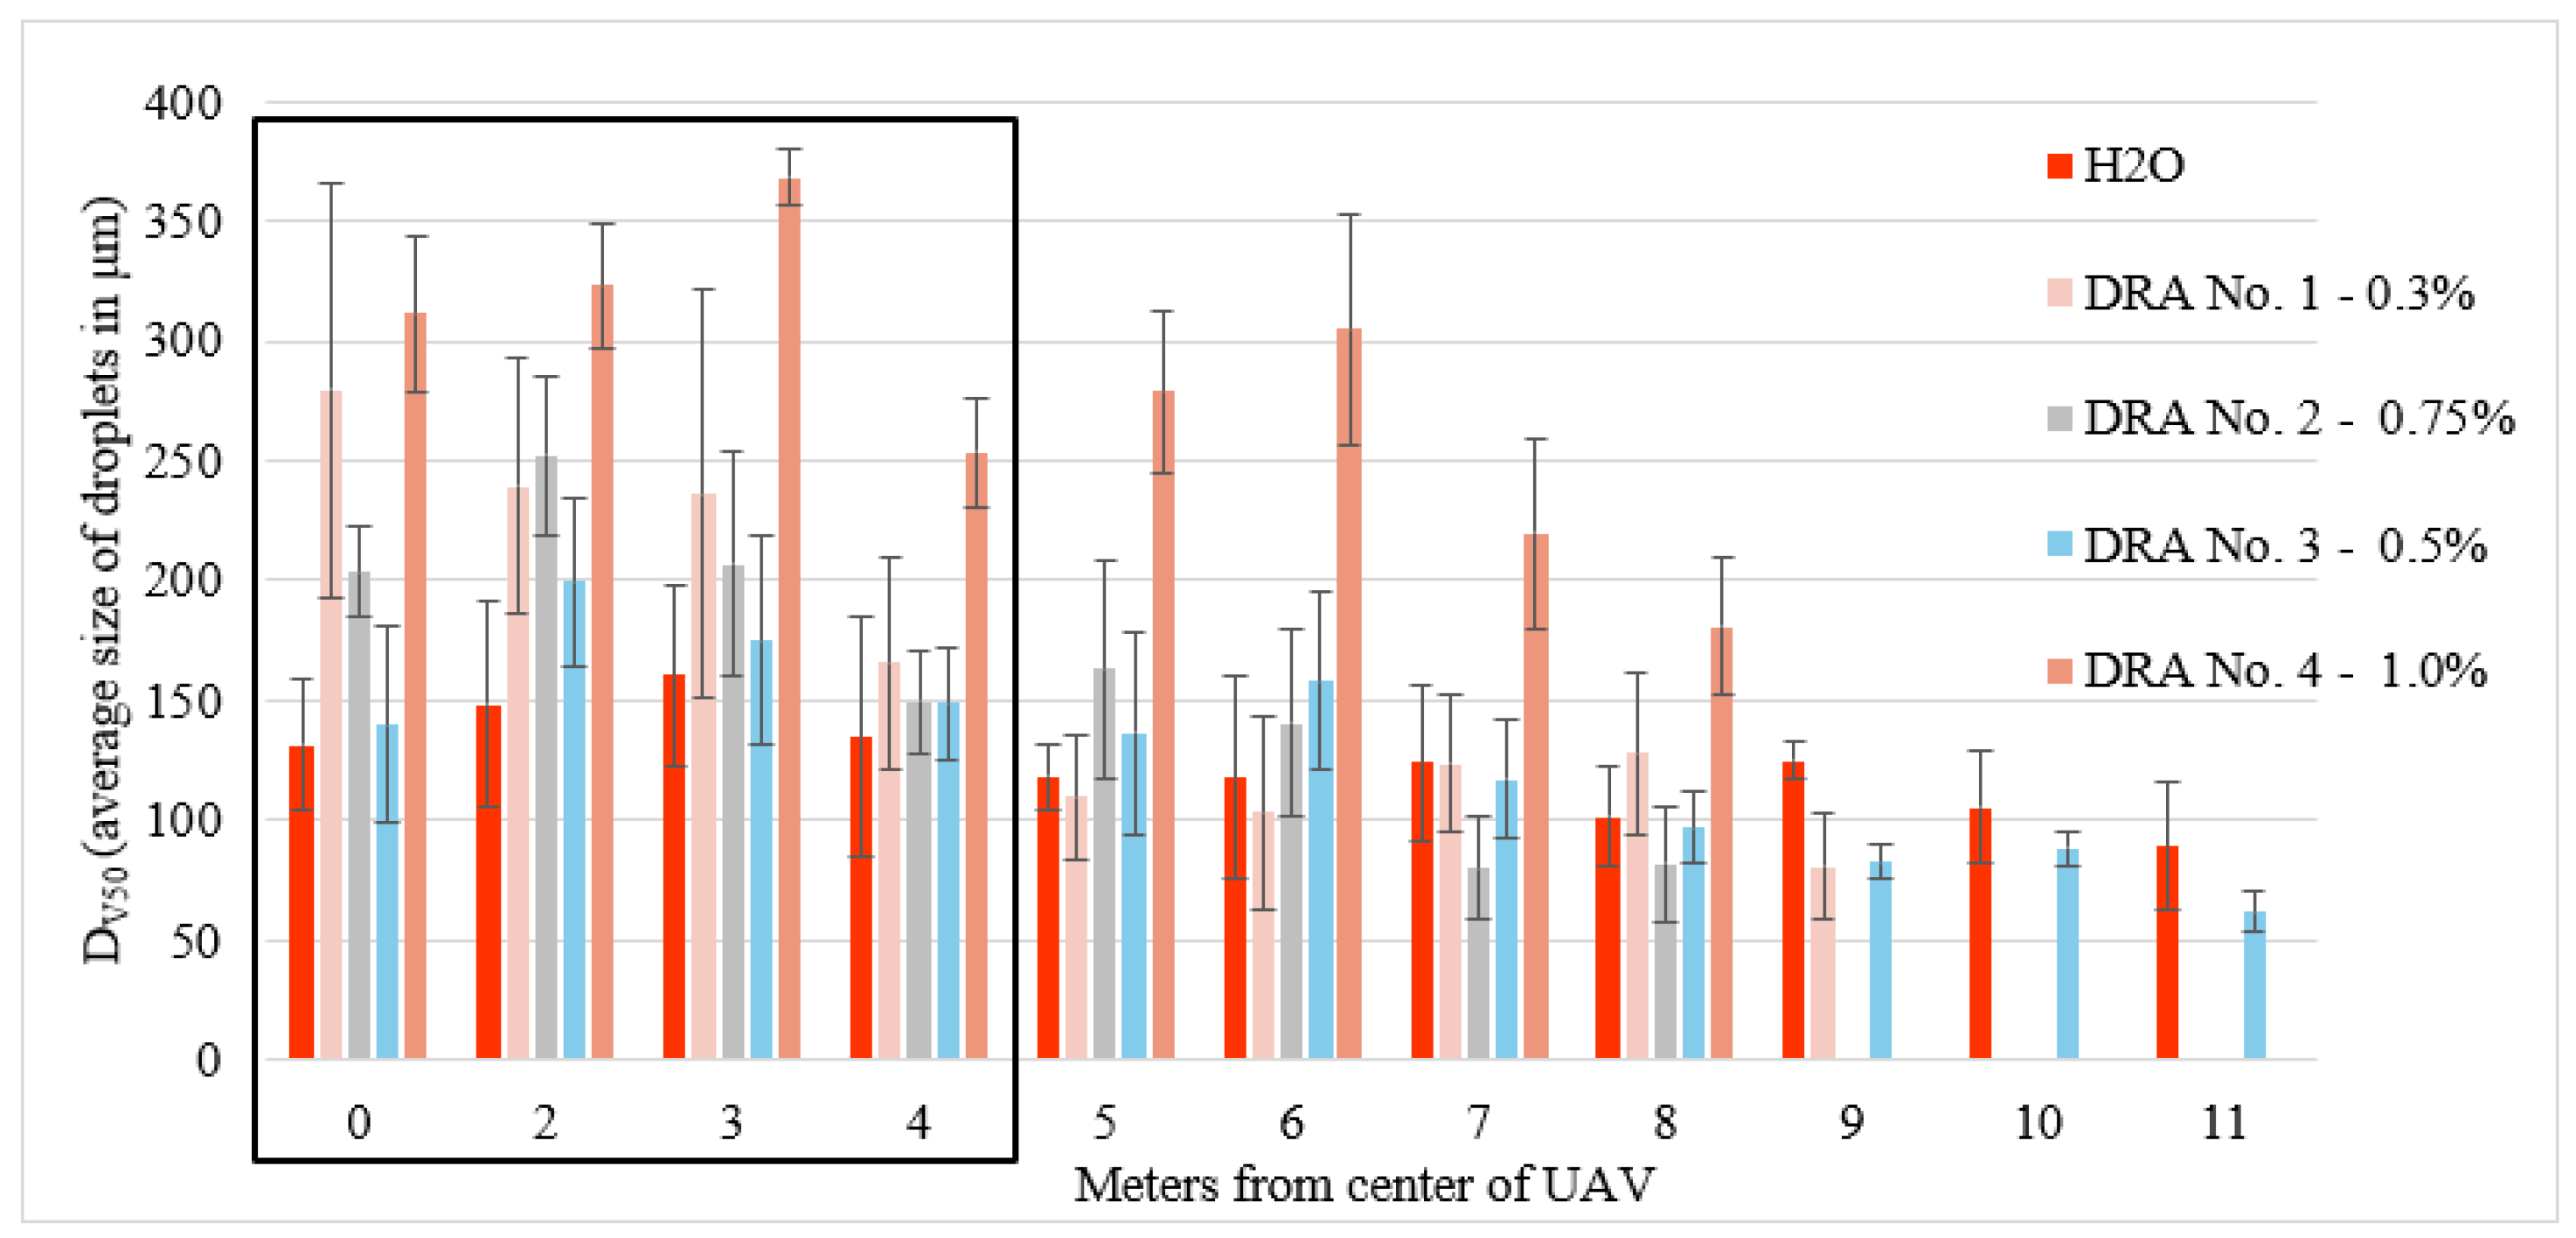
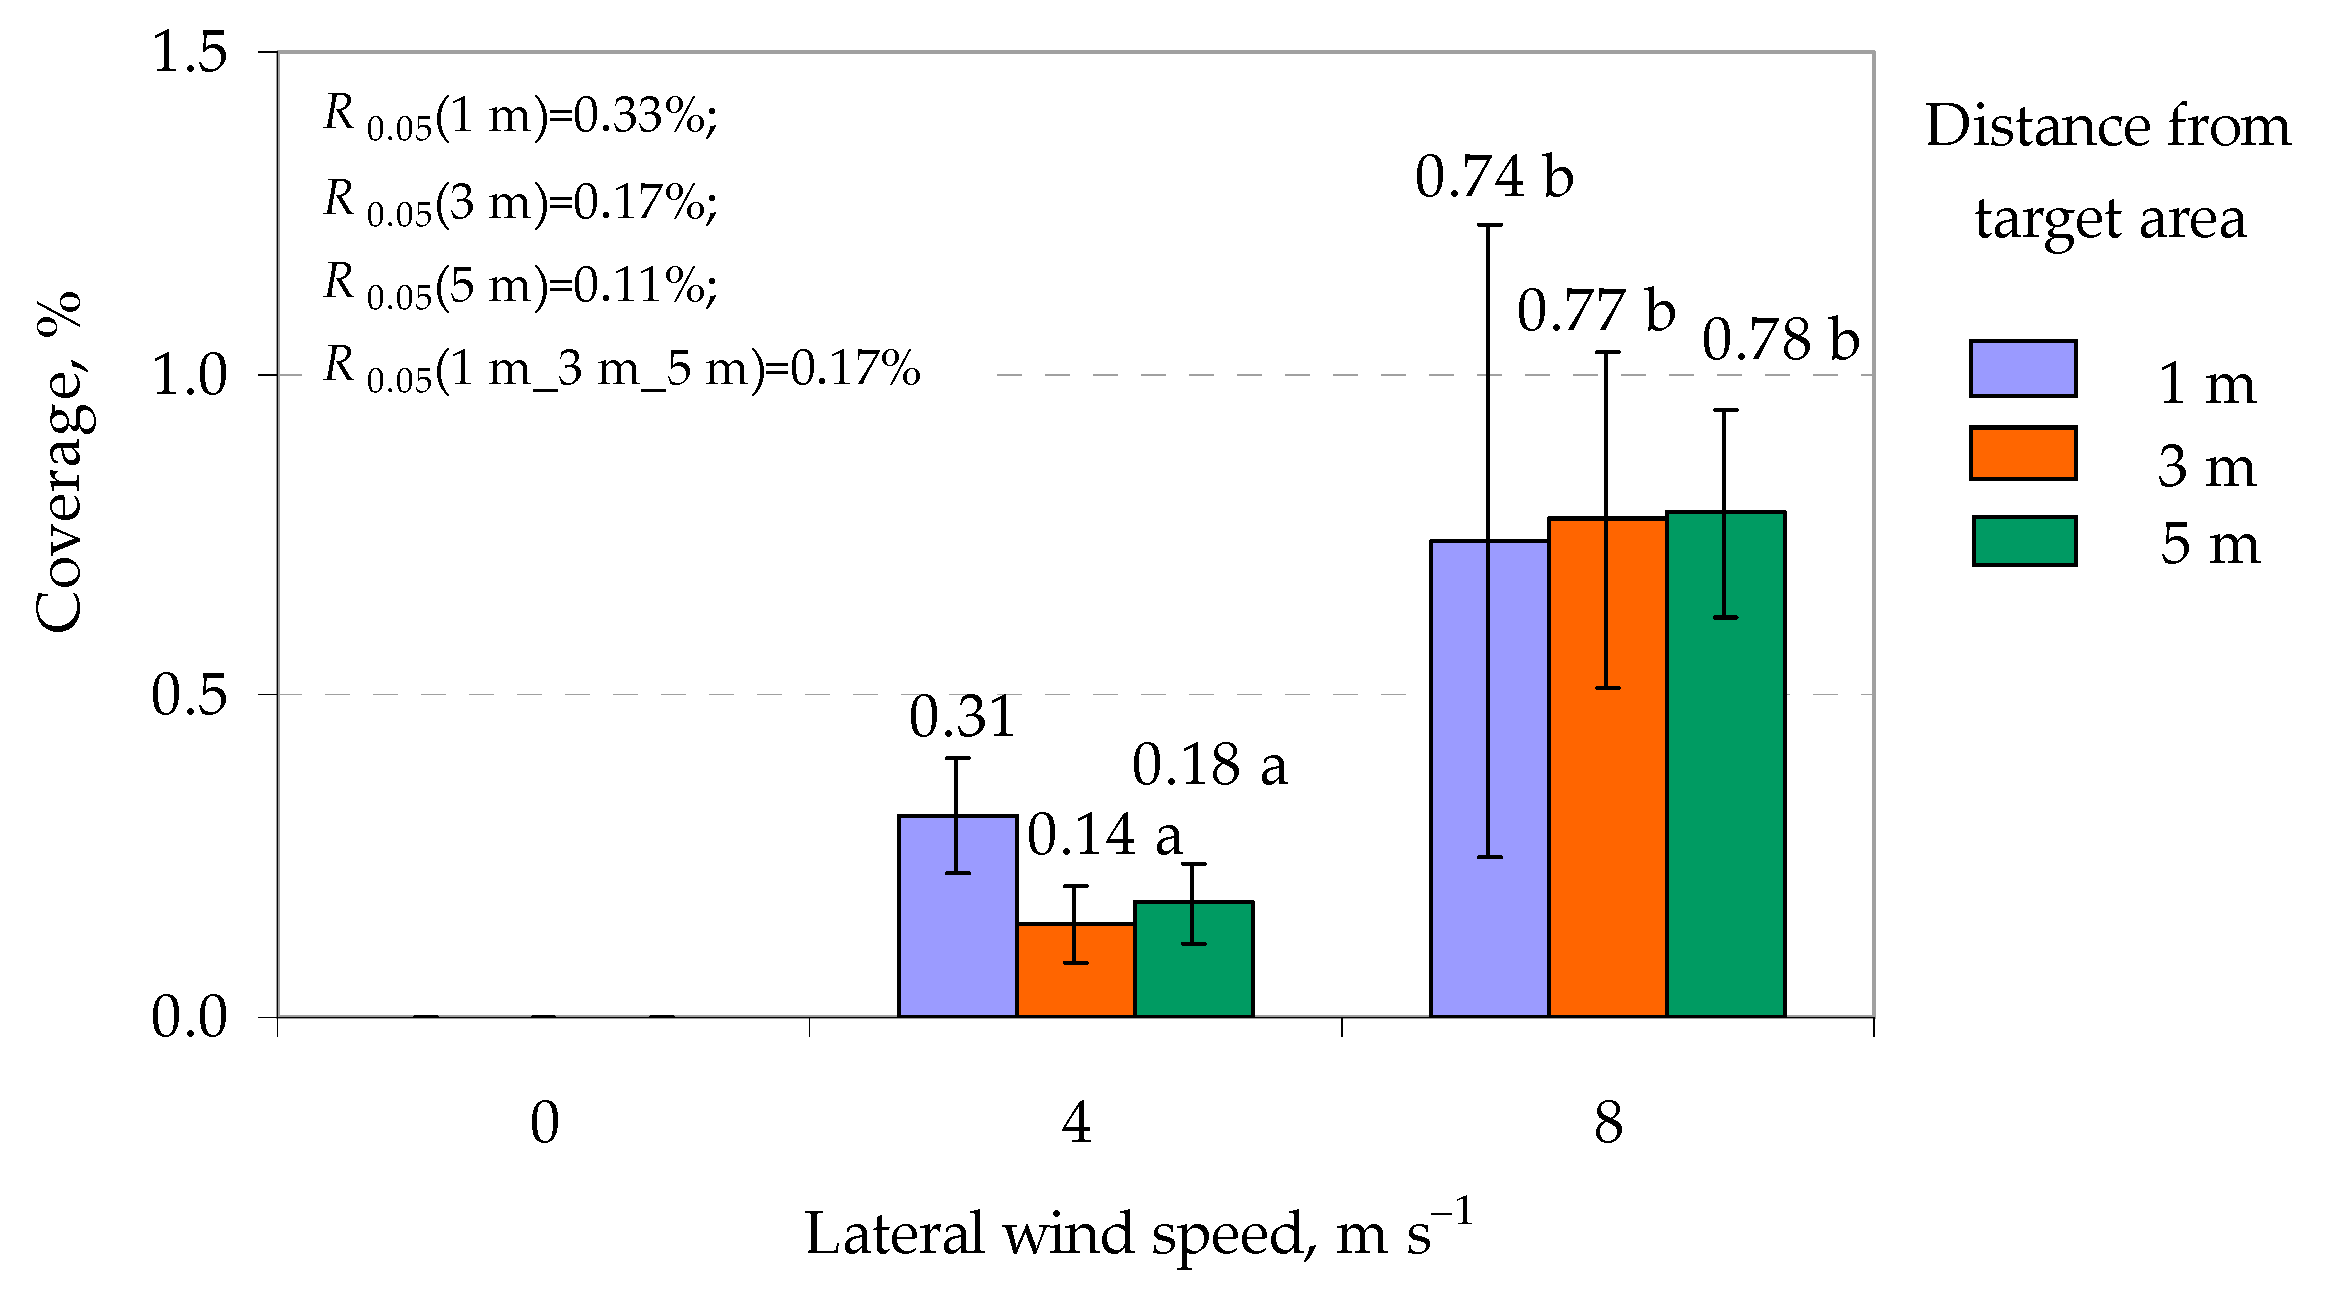
3.2. DRA Effectiveness Trials

Before performing DRA effectiveness trials, static and dynamic surface tension tests and a spreading test were performed for the range of concentrations from 0.1% to 1.0% of the total volume of the tank-mix solution. The results obtained are listed in Table 1, Table 2 and Table 3.
The static surface tension tests in Table 1 revealed that the highest static surface tension obtained was with DRA No. 1, indicating its spreading to be the poorest. All other DRA products showed the lowest static surface tension values within the range of 0.5% and 1.0% concentration of total spray volume, indicating that these concentrations are optimal for better overall coverage in the deposition phase. DRA Nos. 2 and 4 exhibited the best static surface tension results, meaning their spreading on the WSP should be the best and, therefore, the coverage should increase. From the dynamic surface tension tests performed on various concentrations of DRA products (Table 2), we noted that the highest dynamic surface tension was exhibited by DRA No. 4, while the other DRA products (Nos. 1–3) showed similar dynamic surface tension properties at equal concentration values, but the values are significantly lower than those of DRA No. 4. Table 2 shows that DRA No. 4 would perform best as a drift reduction agent due to providing the best protection against wind-induced droplet breakup into finer droplets thanks to the higher dynamic surface tension. It is also worth noting from Table 3 that DRA No. 1 had the poorest spreading capability out of all the tested products, as also indicated by the data in Table 1. Both DRA No. 4 (all concentrations) and DRA No. 2 (0.6–1.0% concentrations) showed significantly better results, whereas DRA No. 3 exhibited average spreading capabilities. Based on the test data, DRA No. 4 was anticipated to exhibit the best performance. DRA No. 2 was expected to produce moderate results. In contrast, DRA Nos. 1 and 3 were predicted to show the least favorable drift control improvement.
The effectiveness of different DRA concentrations was evaluated under lateral wind speeds of 0, 4, and 8 m s¹. Tests were conducted using the T30 UAV in automated operation mode, with its flight path crossing above the 1st WSP mounting plate. The UAV was assessed at two altitude settings, 1.5 m and 3 m above ground level. WSP for water and DRA No. 4 at a 1% concentration at various distances from the UAV can be seen in Figure 9.
One of the numerical datasets used for optimal concentration determination in graph form is provided in Figure 10. The coverage of the WSP (%) was used to determine the total distance of downwind spray solution drift, and the drift volume was obtained from the DepositScan analysis software. For each data bar, three WSPs obtained in the same spraying operation conditions were analyzed.
During water deposition trials (control), it was determined that the average DPV from all trials was 0.125 (12.5% of total sprayed volume). The average CDP was determined to be 15.3%, meaning some of the droplets larger than 150 μm also experienced drift.
The optimal concentration of DRA No. 1 for UAV applications was determined to be 0.3%. DRA No. 2 showed the most promising results at a concentration of 0.75%. DRA No. 3 showed the best results at a concentration of 0.5% but only at a UAV operating altitude of 3 m, whereas at the height of 1.5 m, it showed worse results than the control. DRA No. 4 exhibited the best drift control capabilities at a concentration of 1.0% when operating at an altitude of 3 m. Other authors [11] have pointed out that even small variations in wind speed and direction can have a significant effect on the deposition of a sprayed solution under a UAV. This was evident during the 1.5 m altitude trials as not all optimal concentrations performed better than the control at this altitude. In all experimental trials conducted in this study, the wind speed was relatively stable, ranging from 0.1 to 0.2 m·s¹. However, wind direction showed some minor variations and changed from west to northwest, which was parallel (or at a 45° angle) to the UAV flight path. Such a change in wind direction may have had an effect on the results, mainly for tests without lateral wind generated by the testing setup. During the trial, the wind generator was positioned north of the flight path and perpendicular to the spray path. For trials where lateral wind at speeds of 4 and 8 ms−1 was introduced, it was the main external source of spray drift.
As can be seen from the DRA concentration effectiveness comparison graph (Figure 10), DRA No. 3 exhibited significantly better coverage results in the target area compared to water. However, it still showed significantly higher drift distance potential, which raised concerns as to the effectiveness of DRA use under these operating conditions. Other DRA product concentrations are depicted in separate graphs so as not to overload the graphs with data. For the final product comparison graphs (Figure 11) at various operating conditions, only the best-performing concentrations of DRA products are selected to determine the effectiveness of each DRA compared to the control and each other. All optimal concentrations of the tested DRA showed results similar to the control, while the UAV operating altitude was 1.5 m above ground level. However, at this altitude, some of the other tested concentrations showed a slight improvement, meaning that the ground-induced vortices of the UAV propeller downwash cause higher aerodynamic stresses on the sprayed droplets. The final tank-mix needs to be adjusted accordingly if this elevation is to be used for spraying emerging crops.
Figure 11 shows that most DRAs exhibited a higher coverage rate in the target zone than the control. Figure 12 represents the average droplet size distribution in the same test conditions as Figure 11 along the perpendicular trajectory of the UAV flight path. The performance of the tested DRAs in the target area (0–4 m) varied significantly.
DRA No. 1 exhibited the highest initial deposition rate, achieving coverage between 17% and 294% relative to H2O in the target area. The high initial level of deposition, indicating its superior ability to retain droplets within the desired spray zone, dropped off quickly. This indicates that the DRA-modified solution has good adherence, and most of the solution stays within the wake of the UAV downwash stream. In the drift area (5–11 m), DRA No. 1 exhibited adequate drift control capabilities by reducing the overall spray drift by 2 m and the capability to lower deposition by 73–80% compared to H2O, indicating substantial control of fine droplet formation. It can also be seen from Figure 12 that DRA No. 1 improved the droplet size significantly, but there were still some fine droplets that were picked up by the lateral wind. DRA No. 2 achieved moderate deposition rates within the target area, ranging from 78% to 360% relative to H2O, showing improvement over water. However, it was less effective than DRA Nos. 1 and 4 in the target area. In the drift area, DRA No. 2 exhibited one of the most substantial long-distance drift control measures by reducing the drift distance by 3 m and lowering the deposition at other distances, achieving the lowest deposition values in the drift zone (ranging from 40% to 67% of H2O in trials from 3 m altitude), making it ideal for minimizing drift. DRA No. 3 showed the lowest coverage under the UAV, even lower than that of H2O by 33%, suggesting its limited ability to mitigate drift. This was further consolidated by the off-target spray data collected. This DRA did not reduce the drift distance and, up until 4 m beyond the target area (8 m from the center of the UAV), the deposition was greater than that of water. Only at distances of 9 to 11 m away from the UAV did it display lower coverage. The effectiveness of this DRA was limited in both the target and drift areas. It can also be seen in Figure 12 that DRA Nos. 2 and 3 did not have any significant effect on the size of droplets. DRA No. 4 demonstrated high coverage values in the target area—two to five times better than H2O—offering the best target area coverage out of all tested DRA. Furthermore, it performed similarly to DRA No. 1 in terms of drift control: it reduced the drift distance by 3 m, but the added spreading capabilities of the product increased the coverage of other off-target WSPs by around four times compared to water, providing a mixed result in terms of drift control. It can also be seen from Figure 11 that the size of the droplets was the largest for this DRA out of all the tested products, indicating that it had the best spreading capabilities.
Calculations for the DPV of all DRA showed that the solution with 0.3% DRA No. 1 was prone to experience 4.3% drift, the solution with 0.5% DRA No. 2 was prone to experience 6.8% drift, the solution with 0.75% DRA No. 3 was prone to experience 10% drift, and the solution with 1% DRA No. 4 was prone to experience the smallest drift of all, 4%. Data collected to obtain average values of cumulative drift percentage from all trial scenarios showed that the DRAs were subject to 6.97%, 11.6%, 15.13%, and 10.99% drift of sprayed solution, respectively. Keeping these values in mind, it can be said that the DRA products achieved a 54.39%, 24.16%, 1.09%, and 28.13% drift reduction percentage, respectively, compared to the control.
Upon further comparing DRA No. 1’s effectiveness under all tested wind conditions, as represented in Figure 13, it can be noted that under low to medium wind conditions, the product showed good drift control properties. However, when the wind speed reached the critical operational threshold, both the drift distance and the dispersion of data became significantly higher, indicating that the product was unable to modify droplets in such a way that they could withstand higher external aerodynamic pressures. Furthermore, at a distance of 1 m away from the target area, the dispersion of data at all wind speeds was higher, meaning that the effects of the downwash force field were noticeable at this distance, and their interaction with lateral wind speed had no discernible effect on its control.
DRA No. 3, while exhibiting the same drift distance as the control, reduced the volume of deposition of drifted spray solution. The lower dynamic surface tension exhibited by the selected optimal concentration would typically imply a lower speed, reducing the relative speed difference between the droplet and the surrounding air. This could reduce droplet fragmentation, as lower speed reduces the aerodynamic drag and shear forces acting on the droplet surface. However, when both static and dynamic surface tensions were low, as in this case, the outcome depended on the dominant factor. If aerodynamic forces (like wind shear) were high relative to the droplet resistance, breakup was more likely, as could be seen in the case of the application at 8 m s−1 lateral wind speed. Reduced dynamic surface tension minimized speed gradients, which stabilized the droplet against breakup.
However, when comparing all operating scenarios side by side, as seen in Figure 14 with the data collected for DRA No. 1, it is apparent that, even though the drifted amount of DRA No. 3 was significantly higher than that of DRA No. 1, it still showed better drift control during extreme wind conditions. This means that the droplets were more stable, did not tend to break up into smaller fractions, and were deposited closer to the intended target area. The coverage area was also larger due to the added spreading effect provided by DRA No. 3. Furthermore, it can be noticed that, with the increase in lateral wind speed, the drifted part of the solution increased linearly. In other words, the lateral wind was directly responsible for this increase in drift, and the downwash force did not have any significant influence on the drift of this mixture.
Comparing DRA No. 2 (Figure 15) and DRA No. 4 (Figure 16), it can be seen that the static surface tension was similar and the lowest out of all the tested products. However, the dynamic surface tension varied slightly, with DRA No. 4 exhibiting the highest dynamic surface tension and DRA No. 2 exhibiting one of the lowest dynamic surface tensions out of the optimal concentrations of tested products, and both showing the highest spreading potential of droplets. Due to the added spreading effect, DRA No. 4 showed the highest coverage potential for plant surfaces and exhibited good drift control properties due to having the highest dynamic surface tension out of the optimal product concentration range. DRA No. 2, however, having the highest spreading potential, did not show the same quality of coverage as DRA No. 4. This indicates that the chemistry behind this spray solution, even though it was better at controlling drift, did not benefit as much from the added spreading capabilities.
However, when comparing the drift data in Figure 15 and Figure 16, it is evident that, for DRA No. 2, not having additional spreading capabilities worked in its favor—minimizing the drift coverage and making it the lowest out of all tested products. It can also be seen from Figure 11 and Figure 12 that this DRA still had better coverage compared to water, meaning that it helped with reducing evaporation or stabilizing the droplets in the downwash-induced vortices by providing stronger protection against outside aerodynamic forces. Furthermore, analyzing the distance of 1 m beyond the target area, it can be seen that at a wind speed of 4 m s−1, the deposition was denser than that experienced in 8 m s−1 conditions. This could be due to the more prevalent expression of airflows from the downwash forces acting upon the droplets. However, this was no longer the case at higher distances from the UAV.
Even at critical wind speed conditions, there was minimal solution drift up to 5 m away from the target area, meaning there was still a higher risk of contaminating off-target areas when using spray solutions with DRA No. 2. However, DRA No. 4, even with the added spreading capabilities, exhibited a more stable drift control mechanism and, in all cases (even in high lateral wind speed conditions), the off-target drift did not reach a 5 m distance away from the target area. Furthermore, the drift coverage 3 m beyond the target area decreased with increasing lateral wind speed. This could suggest that the interaction between the modified droplets in the wake of turbulent downwash and lateral wind flows was subject to more turbulent airflows cancelling each other out and achieving a better overall result.

4. Discussion

Studies have shown that the downwash effect from UAV rotors significantly alters droplet behavior, particularly at low spraying altitudes, by creating complex air patterns. These include vortices and turbulence that could lift sprayed droplets to cause an upwash phenomenon [19], dispersing them unpredictably and reducing deposition efficiency [18,55]. Issues related to this phenomenon were noticed by our research group while performing the trials at 1.5 m elevations, when upwash vortices were visible to the naked eye. Simulations and experiments also confirmed that these effects became more pronounced with increased rotor speed (which is tied to UAV weight and speed of forward motion) and closer proximity to the ground [16,18,19,21,29]. The downwash force tends to form in a spiral pattern [19], meaning it has an eccentric force that can catch and propel droplets further from the intended target area. Furthermore, if the altitude is high enough, the individual vortices merge to create turbulent zones [18] in the coupling region, which act unpredictably upon droplets. Maintaining an appropriate spraying altitude and other drift-inducing UAV-specific operating parameters [11,13,17,32] is essential to minimize this effect [55]. During this study, ground vortices were visible to the naked eye while observing the UAV operation at 1.5 m altitude in comparison to operations from a height of 3 m. Performing spraying operations on emerging crops at this elevation is, therefore, not recommended. However, in denser and more developed canopies, the proximity of the UAV to the canopy could aid in covering both sides of the crop leaves by causing them to flutter, which could ensure more efficient coverage [56].
The effect of lateral wind on UAV-sprayed droplets has been discussed by many authors [16,27,57] and found to be one of the most significant factors in increased drift volumes and distances. However, some authors noted that, without the downwash force exerted by the rotors, the effects of lateral wind would be even more significant [57]. There have been mathematical models created based on the principles of Gaussian dispersion to evaluate UAV spray drift. Accounting for the effects of turbulence between aircraft downwash and ambient sources and utilizing Lagrangian techniques to create accurate aerial spray dispersion prediction models [58] could aid in determining the drift of unmodified spray solutions prior to application.
The nozzle type plays a critical role in UAV spraying because it serves as the primary atomizing element in plant protection equipment. Droplet size has been shown to have a direct impact on adhesion and drift [59]. The lower deposition experienced during T30 operation could be influenced by the higher proportion of fine droplets, which could suffer from faster droplet evaporation [60]. The deposition could be improved by using nozzles that can generate courser droplets [61,62], which would also assist with drift control. However, another research group found no significant difference in deposition when using different nozzle types [59]. Furthermore, another research group did not notice any significant improvements from using air induction nozzles compared to conventional nozzles during their trials [56]. Whereas some studies recommend the installation of nozzles directly under the propellers [18], as with the T30 and XP2020 model UAVs, to avoid droplets entering the turbulent zones of the propeller downwash, during this study, M6E—a boom sprayer UAV—performed similarly to XP2020 at an altitude of 3 m, suggesting that at this altitude the design difference is not a critical factor. Similar findings have been published by another research group [63] comparing a boom-type sprayer UAV and a UAV with nozzles under the propellers; these authors determined that there was no significant difference in performance when comparing all of the available data for the two UAVs.
Most of the drift that could be seen beyond 6 m from the center of the UAV (2 m beyond the target area) was caused by fine droplets, proving other research groups’ [11,17,43] findings from UAV spray studies and various other authors’ [51,64] findings on the drift of spray solutions using other machinery. The improvement in target area deposition exhibited by adding DRA is due to the products providing a higher spreading potential and increased droplet size retention [43,51]. DRA No. 2, which showed some of the best results in the current study, has also been tested by another research group [43] and was proven to reduce drift by 3.5 m at a concentration of 0.6%. Our group achieved a similar result of 3 m drift reduction at a concentration of 0.75% while also reducing the volume of deposition in the off-target area by up to 85% in some of the trial scenarios. This was similar to the 65% reduction achieved by the other research group [43]. On average, though, it achieved only a 24.13% DRP. In comparison, DRA No. 1, which exhibited the highest static surface tension of all, as well as the highest dynamic surface tension among the chosen optimally performing concentrations, had the lowest spreading potential in relation to other tested DRAs. However, it had excellent anti-drift properties at a concentration of 0.3% since the droplets retained their shape and did not break up into smaller droplets when exposed to lateral winds and the downwash force created by the propellers.

5. Conclusions

During UAV spraying operations, the M6E and XP2020 models performed better in low-wind conditions. XP2020 had, on average, a 25% higher deposition compared to M6E and around 50% higher than that of T30 in the target area. However, in high-wind conditions, M6E outperformed the other models in terms of target area coverage, while XP2020 showed the best drift control capabilities. However, T30 could prove more effective in windy environments, as its concentrated downwash helps to confine droplets within the target area. The higher proportion of fine droplets generated suggests that T30 would benefit from aftermarket nozzles capable of generating coarser droplets or the addition of tank-mix adjuvants into the sprayed solution.
All tested DRAs demonstrated the potential to reduce spray drift to non-target areas and improve crop coverage through increased spreading capabilities. DRA Nos. 1, 2, and 4 showed the potential to reduce the distance of drift experienced during UAV operations by 2–3 m and 58.4%, 24.16%, and 28.17% (average drift reduction percentage), respectively, while also showing a reduction in off-target coverage of up to 67% in some cases. However, considering the target area coverage, DRA Nos. 1 and 4 consistently showed the best results across all tested scenarios, increasing the coverage in the target area by 3–4 and 2–8 times, respectively, compared to water.
At an operational altitude of 1.5 m, DRA provided minimal improvements, indicating that this altitude was highly prone to ground-induced vortex-aided droplet dispersion. For emerging crops, these data suggest that maintaining proximity to the ground is not recommended. However, for operations at higher altitudes, DRA additives exhibited significantly positive effects, enhancing droplet resistance to aerodynamic forces. The best results were obtained by incorporating DRA No. 1 or 4 into the spray solution.
To summarize the results of this study, the M6E and XP2020 models performed best in low-wind conditions, with XP2020 showing 25% higher deposition than M6E and 50% higher than T30. In high-wind conditions, M6E excelled in terms of target area coverage, while XP2020 provided better drift control. T30 was effective in windy environments due to its concentrated downwash but generated more fine droplets, which could be rectified by aftermarket nozzles or the addition of DRA. Data showed that adding DRAs could significantly reduce drift and improve coverage, with DRA No. 1 being the best for minimizing drift (54.39% drift reduction percentage) and DRA No. 4 offering the best potential for target area coverage and substantial drift control capabilities (28.13% drift reduction percentage).
Further research with active substances like fertilizers and pesticides in field trials will be necessary to determine whether their inclusion alters spray distribution patterns at varying altitudes and wind speeds. Furthermore, the findings must be tested in denser canopies to determine the potential of droplet absorption in the canopies. Additionally, exploring combinations of two or more DRAs could further enhance their anti-drift properties while ensuring precise application. Future studies could also include investigations into the residue of adjuvants in the soil after singular and multiple sprayings, the long-term impacts on the soil ecological environment, and the cumulative effects on crop growth and development. This would further increase the scientific community’s understanding of the benefits and drawbacks of using adjuvants in spray applications.

Author Contributions

Conceptualization, M.S. and D.S. (Dainius Steponavičius); methodology, M.S. and A.K.; formal analysis, M.S. and D.S. (Dainius Savickas); investigation, A.K. and D.S. (Dainius Savickas); data curation, M.S.; writing—original draft preparation, M.S.; writing—review and editing, M.S., D.S. (Dainius Steponavičius), A.K. and D.S. (Dainius Savickas); visualization, M.S. and D.S. (Dainius Steponavičius); supervision, D.S. (Dainius Steponavičius) and A.K. All authors have read and agreed to the published version of the manuscript.

Funding

The trial setup is funded by Vytautas Magnus University Agriculture Academy.

Institutional Review Board Statement

Not applicable.

Informed Consent Statement

Not applicable.

Data Availability Statement

All the data presented in this study are available in the article.

Acknowledgments

The authors thank Vytautas Magnus University Agriculture Academy (Department of Agricultural Engineering and Safety) for granting funding for the trial setup.

Conflicts of Interest

The authors declare no conflicts of interest.

References

  1. Maggi, F.; Tang, F.H.M.; Tubiello, F.N. Agricultural pesticide land budget and river discharge to oceans. Nature 2023, 620, 1013–1017. [Google Scholar] [CrossRef]
  2. Seo, Y.; Umeda, S.; Yoshikawa, N. Environmental impact of agricultural sprayers used in Japanese rice farming. Int. J. Agric. Sustain. 2023, 21, 2247803. [Google Scholar] [CrossRef]
  3. Kannan, N.; Huggins, C. Opportunities to mitigate particle drift from ground-based preemergent herbicide applications. Appl. Eng. Agric. 2023, 39, 33–42. [Google Scholar] [CrossRef]
  4. Esayas, T.; Mekbib, F.; Shimelis, H.; Mwadzingeni, L. Assessing off-target drift and on-target deposition uniformity of a backpack magnetic sprayer in a sugarcane plantation. Am. J. Agric. Biomed. Eng. 2023, 5, 1–4. [Google Scholar]
  5. Lochan, K.; Khan, A.; Elsayed, I.; Suthar, B.; Seneviratne, L.; Hussain, I. Advancements in Precision Spraying of Agricultural Robots: A Comprehensive Review. IEEE Access 2024, 12, 129447–129483. [Google Scholar] [CrossRef]
  6. Cech, R.; Zaller, J.G.; Lyssimachou, A.; Clausing, P.; Hertoge, K.; Linhart, C. Pesticide drift mitigation measures appear to reduce contamination of non-agricultural areas, but hazards to humans and the environment remain. Sci. Total Environ. 2023, 854, 158814. [Google Scholar] [CrossRef] [PubMed]
  7. Boonupara, T.; Udomkun, P.; Khan, E.; Kajitvichyanukul, P. Airborne pesticides from agricultural practices: A critical review of pathways, influencing factors, and human health implications. Toxics 2023, 11, 858. [Google Scholar] [CrossRef]
  8. Ahmad, F.; Khaliq, A.; Qiu, B.; Sultan, M.; Ma, J. Advancements of Spraying Technology in Agriculture; IntechOpen: London, UK, 2021. [Google Scholar] [CrossRef]
  9. Hafeez, A.; Husain, M.A.; Singh, S.P.; Chauhan, A.; Khan, M.T.; Kumar, N.; Chauhan, A.; Soni, S.K. Implementation of drone technology for farm monitoring and pesticide spraying: A review. Inf. Process. Agric. 2023, 10, 192–203. [Google Scholar] [CrossRef]
  10. Ozkan, E. Drones for Spraying Pesticides—Opportunities and Challenges; The Ohio State University: Columbus, OH, USA, 2024; pp. 1–16. [Google Scholar]
  11. Richardson, B.; Rolando, C.A.; Kimberley, M.O. Quantifying spray deposition from a UAV configured for spot spray applications to individual plants. Trans. ASABE 2020, 63, 1049–1058. [Google Scholar] [CrossRef]
  12. Zhang, R.; Hewitt, A.J.; Chen, L.; Li, L.; Tang, Q. Challenges and opportunities of unmanned aerial vehicles as a new tool for crop pest control. Pest Manag. Sci. 2023, 79, 4123–4131. [Google Scholar] [CrossRef] [PubMed]
  13. Kim, C.J.; Yuan, X.; Kim, M.; Kyung, K.S.; Noh, H.H. Monitoring and risk analysis of residual pesticides drifted by unmanned aerial spraying. Sci. Rep. 2023, 13, 10834. [Google Scholar] [CrossRef] [PubMed]
  14. Martin, D.E.; Tang, Z.; Yang, Y.; Latheef, M.A.; Fritz, B.K.; Kruger, G.R.; Houston, T.W. Spray Drift Characterization of a Remotely Piloted Aerial Application System. Appl. Eng. Agric. 2024, 40, 385–399. [Google Scholar] [CrossRef]
  15. Qin, W.; Chen, P. Current Research on Deposition and Drift of Droplets Sprayed by Plant Protection UAV. Res. Sq. 2023. [Google Scholar]
  16. Wang, J.; Lv, X.; Wang, B.; Lan, X.; Yan, Y.; Chen, S.; Lan, Y. Numerical simulation and analysis of droplet drift motion under different wind speed environments of single-rotor plant protection UAVs. Drones 2023, 7, 128. [Google Scholar] [CrossRef]
  17. Chen, S.; Lan, Y.; Zhou, Z.; Ouyang, F.; Wang, G.; Huang, X.; Deng, X.; Cheng, S. Effect of droplet size parameters on droplet deposition and drift of aerial spraying by using plant protection UAV. Agronomy 2020, 10, 195. [Google Scholar] [CrossRef]
  18. Tang, Y.; Fu, Y.; Guo, Q.; Huang, H.; Tan, Z.; Luo, S. Numerical simulation of the spatial and temporal distributions of the downwash airflow and spray field of a co-axial eight-rotor plant protection UAV in hover. Comput. Electron. Agric. 2023, 206, 107634. [Google Scholar] [CrossRef]
  19. Guo, Q.; Zhu, Y.; Tang, Y.; Hou, C.; He, Y.; Zhuang, J.; Zheng, Y.; Luo, S. CFD simulation and experimental verification of the spatial and temporal distributions of the downwash airflow of a quad-rotor agricultural UAV in hover. Comput. Electron. Agric. 2020, 172, 105343. [Google Scholar] [CrossRef]
  20. Zhan, Y.; Chen, P.; Xu, W.; Chen, S.; Han, Y.; Lan, Y.; Wang, G. Influence of the downwash airflow distribution characteristics of a plant protection UAV on spray deposit distribution. Biosyst. Eng. 2022, 216, 32–45. [Google Scholar] [CrossRef]
  21. Li, J.; Zhou, Z.; Hu, L.; Zang, Y.; Xu, S.; Liu, A.; Luo, X.; Zhang, T. Optimization of operation parameters for supplementary pollination in hybrid rice breeding using round multi-axis multi-rotor electric unmanned helicopter. Trans. Chin. Soc. Agric. Eng. 2014, 30, 1–9. [Google Scholar]
  22. Al Heidary, M.; Douzals, J.P.; Sinfort, C.; Vallet, A. Influence of spray characteristics on potential spray drift of field crop sprayers: A literature review. Crop Prot. 2014, 63, 120–130. [Google Scholar] [CrossRef]
  23. Dafsari, R.A.; Yu, S.; Yu, S.; Choi, Y.; Lee, J. Drift potential and coverage ratio analysis of an air induction nozzle under an agricultural drone with various operating conditions; an indoor test. Comput. Electron. Agric. 2024, 224, 109171. [Google Scholar] [CrossRef]
  24. Liu, Z.; Li, J. Application of unmanned aerial vehicles in precision agriculture. Agriculture 2023, 13, 1375. [Google Scholar] [CrossRef]
  25. Meng, Y.; Wu, Q.; Zhou, H.; Hu, H. How tank-mix adjuvant type and concentration influence the contact angle on wheat leaf surface. PeerJ 2023, 11, e16464. [Google Scholar] [CrossRef] [PubMed]
  26. Song, J.L.; He, X.K.; Yang, X.L. Influence of nozzle orientation on spray deposits. Trans. CSAE 2006, 22, 96–99. [Google Scholar]
  27. Wongsuk, S.; Zhu, Z.; Zheng, A.; Qi, P.; Li, Y.; Huang, Z.; He, X. Assessing the potential spray drift of a six-rotor unmanned aerial vehicle sprayer using a test bench and airborne drift collectors under low wind velocities: Impact of atomization characteristics and application parameters. Pest Manag. Sci. 2024, 80, 6053–6067. [Google Scholar] [CrossRef]
  28. Weicai, Q.; Panyang, C. Analysis of the research progress on the deposition and drift of spray droplets by plant protection UAVs. Sci. Rep. 2023, 13, 14935. [Google Scholar] [CrossRef] [PubMed]
  29. Qing, T.; Ruirui, Z.; Liping, C.; Min, X.; Tongchuan, Y.; Bin, Z. Droplets movement and deposition of an eight-rotor agricultural UAV in downwash flow field. Int. J. Agric. Biol. Eng. 2017, 10, 47–56. [Google Scholar]
  30. Gong, J.; Fan, W.; Peng, J. Application analysis of hydraulic nozzle and rotary atomization sprayer on plant protection UAV. Int. J. Precis. Agric. Aviat. 2019, 2, 26–30. [Google Scholar] [CrossRef]
  31. Aminjan, K.K.; Sedaghat, M.; Heidari, M.; Khashehchi, M.; Mohammadzadeh, K.; Salahinezhad, M.; Bina, R. Numerical investigation of the impact of fuel temperature on spray characteristics in a pressure-swirl atomizer with spiral path. Exp. Comput. Multiph. Flow 2024, 6, 428–445. [Google Scholar] [CrossRef]
  32. Zhang, H.; Wen, S.; Chen, C.; Liu, Q.; Xu, T.; Chen, S.; Lan, Y. Downwash airflow field distribution characteristics and their effect on the spray field distribution of the DJI T30 six-rotor plant protection UAV. Int. J. Agric. Biol. Eng. 2023, 16, 10–22. [Google Scholar] [CrossRef]
  33. Zeeshan, M.; Li, H.; Yousaf, G.; Ren, H.; Liu, Y.; Arshad, M.; Han, X. Effect of formulations and adjuvants on the properties of acetamiprid solution and droplet deposition characteristics sprayed by UAV. Front. Plant Sci. 2024, 15, 1441193. [Google Scholar] [CrossRef] [PubMed]
  34. Idziak, R.; Sobczak, A.; Waligora, H.; Szulc, P. Impact of multifunctional adjuvants on efficacy of sulfonylurea herbicide applied in maize (Zea mays L.). Plants 2023, 12, 1118. [Google Scholar] [CrossRef] [PubMed]
  35. Hewitt, A.J. Adjuvant use for the management of pesticide drift, leaching and runoff. Pest Manag. Sci. 2024, 80, 4819–4827. [Google Scholar] [CrossRef]
  36. Meng, Y.; Zhong, W.; Liu, C.; Su, J.; Su, J.; Lan, Y.; Wang, M. UAV spraying on citrus crop: Impact of tank-mix adjuvant on the contact angle and droplet distribution. PeerJ 2022, 10, e13064. [Google Scholar] [CrossRef]
  37. Zhang, S.; Huang, M.; Zhou, Q.; Jiao, Y.; Sun, H.; Cheng, X.; Xue, X. Study on Effects of Different Concentration Adjuvants on the Properties of Prochloraz Emulsion in Water Solution Droplets and Deposition. Agronomy 2023, 13, 2635. [Google Scholar] [CrossRef]
  38. Meng, Y.; Lan, Y.; Mei, G.; Guo, Y.; Song, J.; Wang, Z. Effect of aerial spray adjuvant applying on the efficiency of small unmanned aerial vehicle for wheat aphids control. Int. J. Agric. Biol. Eng. 2018, 11, 46–53. [Google Scholar] [CrossRef]
  39. Liu, Q.; Shan, C.; Zhang, H.; Song, C.; Lan, Y. Evaluation of liquid atomization and spray drift reduction of hydraulic nozzles with four spray Adjuvant Solutions. Agriculture 2023, 13, 236. [Google Scholar] [CrossRef]
  40. Bauša, L.; Steponavičius, D.; Jotautienė, E.; Kemzūraitė, A.; Zaleckas, E. Application of rape pod sealants to reduce adverse environmental impacts. J. Sci. Food Agric. 2018, 98, 2428–2436. [Google Scholar] [CrossRef] [PubMed]
  41. Sobiech, Ł.; Grzanka, M.; Skrzypczak, G.; Idziak, R.; Włodarczak, S.; Ochowiak, M. Effect of adjuvants and pH adjuster on the efficacy of sulcotrione herbicide. Agronomy 2020, 10, 530. [Google Scholar] [CrossRef]
  42. Wu, X.; Zhai, C.; Zheng, Y.; Chen, A.; Yu, X.; Xu, J.; Sun, Y.; Cong, Y.; Tang, W.; Liu, X. Effect of different salt ions with different concentrations on the stability of carbon dioxide-in-water foam fracturing fluids. J. Mol. Liq. 2023, 373, 121215. [Google Scholar] [CrossRef]
  43. Butts, T.R.; Fritz, B.K.; Davis, J.A.; Spurlock, T.N. Spray coverage and deposits from a remotely piloted aerial application system using various nozzle types. Front. Agron. 2024, 6, 1493799. [Google Scholar] [CrossRef]
  44. Li, B.X.; Liu, Y.; Zhang, P.; Li, X.X.; Pang, X.Y.; Zhao, Y.H.; Li, H.; Liu, F.; Lin, J.; Mu, W. Selection of organosilicone surfactants for tank-mixed pesticides considering the balance between synergistic effects on pests and environmental risks. Chemosphere 2019, 217, 591–598. [Google Scholar] [CrossRef]
  45. Lu, Z.; Gao, Y.; Zhang, C.; Bao, Z.; Wang, W.; Lin, J.; Du, F. Surface properties of Tetranychus urticae Koch (Acari: Tetranychidae) and the effect of their infestation on the surface properties of kidney bean (Phaseolus vulgaris L.) hosts. Pest Manag. Sci. 2021, 77, 5120–5128. [Google Scholar] [CrossRef]
  46. Liu, Z.; Xue, W.; Shi, J.; Han, S.; Yan, J. Recent advances in polyalkylene glycol base oil. Res. Chem. Intermed. 2024, 50, 1515–1539. [Google Scholar] [CrossRef]
  47. Meng, Y.; Wang, M.; Wang, Z.; Hu, H.; Ma, Y. Surface tension and spreading coefficient of single-and mix-pesticide solutions with aerial spraying organosilicone adjuvant. Int. J. Precis. Agric. Aviat. 2021, 4, 6–13. [Google Scholar] [CrossRef]
  48. Ge, G.; Liu, J.; Liao, Y.; Zeng, D.; Mou, H.; Fan, H. Effects of surfactants on the wettability of sodium propionate aqueous deacidification agent. Nord. Pulp Pap. Res. J. 2024, 39, 645–654. [Google Scholar] [CrossRef]
  49. Langlet, R.; Valentin, R.; Morard, M.; Raynaud, C.D. Transitioning to Microplastic-Free Seed Coatings: Challenges and Solutions. Polymers 2024, 16, 1969. [Google Scholar] [CrossRef]
  50. Soriano-Jerez, Y.; Gourlaouen, E.; Zeriouh, O.; del Carmen Cerón-García, M.; Arrabal-Campos, F.M.; Ruiz-Martínez, C.; Fernández, I.; Gallardo-Rodríguez, J.J.; García-Camacho, F.; Molina-Grima, E.; et al. Role of dynamic surface tension of silicone polyether surfactant-based silicone coatings on protein adsorption: An insight on the ‘ambiguous’ interfacial properties of Fouling Release Coatings. Prog. Org. Coat. 2024, 186, 108079. [Google Scholar] [CrossRef]
  51. Jomantas, T.; Lekavičienė, K.; Steponavičius, D.; Andriušis, A.; Zaleckas, E.; Zinkevičius, R.; Popescu, C.V.; Salceanu, C.; Ignatavičius, J.; Kemzūraitė, A. The influence of newly developed spray drift reduction agents on drift mitigation by means of wind tunnel and field evaluation methods. Agriculture 2023, 13, 349. [Google Scholar] [CrossRef]
  52. Ahmad, F.; Zhang, S.; Qiu, B.; Ma, J.; Xin, H.; Qiu, W.; Ahmed, S.; Chandio, F.A.; Khaliq, A. Comparison of water sensitive paper and glass strip sampling approaches to access spray deposit by UAV sprayers. Agronomy 2022, 12, 1302. [Google Scholar] [CrossRef]
  53. Gogolák, L.; Simon, J.; Pletikosity, Á.; Fürstner, I. Quantitative Assessment of UAV Assisted Particle Spraying Distribution in Agriculture: An Image Analysis Approach Using Water-Sensitive Papers. Int. J. Electr. Comput. Eng. Syst. 2024, 15, 553–562. [Google Scholar] [CrossRef]
  54. Zhu, H.; Salyani, M.; Fox, R.D. A portable scanning system for evaluation of spray deposit distribution. Comput. Electron. Agric. 2011, 76, 38–43. [Google Scholar] [CrossRef]
  55. Li, H.; Zhu, H.; Jiang, Z.; Lan, Y. Performance characterization on downwash flow and spray drift of multirotor unmanned agricultural aircraft system based on CFD. Int. J. Agric. Biol. Eng. 2022, 15, 1–8. [Google Scholar] [CrossRef]
  56. Biglia, A.; Grella, M.; Bloise, N.; Comba, L.; Mozzanini, E.; Sopegno, A.; Pittarello, M.; Dicembrini, E.; Alcatrão, L.E.; Guglieri, G.; et al. UAV-spray application in vineyards: Flight modes and spray system adjustment effects on canopy deposit, coverage, and off-target losses. Sci. Total Environ. 2022, 845, 157292. [Google Scholar] [CrossRef]
  57. Liu, Q.; Chen, S.; Wang, G.; Lan, Y. Drift evaluation of a quadrotor unmanned aerial vehicle (UAV) sprayer: Effect of liquid pressure and wind speed on drift potential based on wind tunnel test. Appl. Sci. 2021, 11, 7258. [Google Scholar] [CrossRef]
  58. Wang, G.; Han, Y.; Li, X.; Andaloro, J.; Chen, P.; Hoffmann, W.C.; Han, X.; Chen, S.; Lan, Y. Field evaluation of spray drift and environmental impact using an agricultural unmanned aerial vehicle (UAV) sprayer. Sci. Total Environ. 2020, 737, 139793. [Google Scholar] [CrossRef] [PubMed]
  59. Liu, H.; Dou, Z.; Ma, Y.; Pan, L.; Ren, H.; Wang, X.; Ma, C.; Han, X. Effects of Nozzle Types and Spraying Volume on the Control of Hypera postica Gyllenhal by Using an Unmanned Aerial Vehicle. Agronomy 2023, 13, 2287. [Google Scholar] [CrossRef]
  60. Koo, D.; Gonҫalves, C.G.; Askew, S.D. Agricultural spray drone deposition, Part 2: Operational height and nozzle influence pattern uniformity, drift, and weed control. Weed Sci. 2024, 72, 824–832. [Google Scholar] [CrossRef]
  61. Guo, S.; Yao, W.; Xu, T.; Ma, H.; Sun, M.; Chen, C.; Lan, Y. Assessing the application of spot spray in Nanguo pear orchards: Effect of nozzle type, spray volume rate and adjuvant. Pest Manag. Sci. 2022, 78, 3564–3575. [Google Scholar] [CrossRef] [PubMed]
  62. Hanif, A.S.; Han, X.; Yu, S.H. Independent control spraying system for UAV-based precise variable sprayer: A review. Drones 2022, 6, 383. [Google Scholar] [CrossRef]
  63. Wang, X.; He, X.; Song, J.; Wang, Z.; Wang, C.; Wang, S.; Wang, S.; Wu, R.; Meng, Y. Drift potential of UAV with adjuvants in aerial applications. Int. J. Agric. Biol. Eng. 2018, 11, 54–58. [Google Scholar] [CrossRef]
  64. Makhnenko, I.; Alonzi, E.R.; Fredericks, S.A.; Colby, C.M.; Dutcher, C.S. A review of liquid sheet breakup: Perspectives from agricultural sprays. J. Aerosol Sci. 2021, 157, 105805. [Google Scholar] [CrossRef]
Figure 1. T30 spraying UAV with overall dimensions: 1—spray tank; 2—landing skids (altitude detection radar protective frame); 3—propeller; 4—spray nozzles.
Sustainability 17 02083 g001
Figure 2. XP2020 spraying UAV with propeller dimension and distance between nozzles: 1—propeller; 2—rotary spray nozzles; 3—UAV front (heading); 4—spray tank; 5—landing skids.
Sustainability 17 02083 g002
Figure 3. M6E spraying UAV with propeller and sprayer boom dimensions and overall width of the sprayer boom: 1—flat fan pressure nozzles; 2—spray tank; 3—landing skids.
Sustainability 17 02083 g003
Figure 4. Trial setup: 1—wind generator; 2—UAV; 3—spray tank; 4—spray nozzle; 5—frequency converters; 6—horizontal deposition WSP mounting plates.
Sustainability 17 02083 g004
Figure 5. Picture of M6E flying within the trial setup.
Sustainability 17 02083 g005
Figure 6. UAV spraying performance comparison trial results obtained while spraying from 3 m above ground level (2.8 m above WSP mounting plates). The wind generator was disconnected (lateral wind speed: 0 m s−1) during this part of the trial, so the natural atmospheric wind was the only outside force acting upon the UAV systems. The frame represents the target area coverage.
Sustainability 17 02083 g006
Figure 7. UAV spraying performance comparison trial results obtained while spraying from 3 m above ground level (2.8 m above WSP mounting plates). The wind generator was generating wind at the speed of 8 m s−1. The frame represents the target area coverage.
Sustainability 17 02083 g007
Figure 8. UAV-sprayed droplet size average in the target area and drift potential comparison. Lateral wind speed: 8 m s−1; UAV operating altitude: 3 m. The frame represents the target area coverage.
Sustainability 17 02083 g008
Figure 9. WSP spraying results at a lateral wind speed of 8 m s−1, with an operational height of 3 m above the ground. The top row represents results obtained from spraying water, and the bottom row represents results obtained from DRA No. 4 at a concentration of 1%. (a) Under the center of the UAV, (b) 4 m from the center of the UAV (edge of target area), (c) 7 m from the center of the UAV, and (d) 10 m from the center of the UAV.
Sustainability 17 02083 g009
Figure 10. Comparison of different concentrations of DRA No. 3 and their coverage effectiveness compared to water. Lateral wind speed: 4 m s−1; UAV operating altitude: 1.5 m. The frame represents the target area coverage.
Sustainability 17 02083 g010
Figure 11. Comparison of drift control and target area deposition effectiveness of all tested DRA products. Lateral wind speed: 4 m s−1; operating altitude: 3 m. The frame represents the target area coverage.
Sustainability 17 02083 g011
Figure 12. Comparison of average droplet sizes at different distances from the UAV flight trajectory. Lateral wind speed: 4 m s−1; operating altitude: 3 m. The frame represents the target area coverage.
Sustainability 17 02083 g012
Figure 13. DRA No. 1 with a final spray concentration of 0.3%; coverage results under different wind speed conditions. Letters a and b represent data columns which have no significant statistical differences between them.
Sustainability 17 02083 g013
Figure 14. DRA No. 3 with a final spray concentration of 0.5%; coverage results under different wind speed conditions.
Sustainability 17 02083 g014
Figure 15. DRA No. 2 with a final spray concentration of 0.75%; coverage results under different wind speed conditions. Letter a represents data columns which have no significant statistical differences between them.
Sustainability 17 02083 g015
Figure 16. DRA No. 4 with a final spray concentration of 1.0%; coverage results under different wind speed conditions. Letter a represents data columns which have no significant statistical differences between them.
Sustainability 17 02083 g016
Table 1. Static surface tension (mN m−1) for various concentrations of DRA products. Values for achieving optimal deposition are highlighted in bold.
% in
H2O
0.10.20.30.350.40.50.60.70.750.80.91.0
DRA
No. 134.132.031.631.531.431.130.730.430.230.129.829.6
No. 223.121.821.721.421.221.221.121.021.020.520.320.2
No. 324.023.323.223.123.023.022.922.822.722.722.522.4
No. 426.422.922.722.521.321.221.221.020.720.520.420.3
Table 2. Dynamic surface tension (mN m−1) for various concentrations of DRA products. Values providing the best protection against wind-induced droplet breakup (and, therefore, the best drift control) are highlighted in bold.
% in
H2O
0.10.20.30.350.40.50.60.70.750.80.91.0
DRA
No. 164.864.263.658.352.852.251.050.549.748.247.646.1
No. 265.261.459.157.957.256.753.651.050.849.348.346.0
No. 375.466.763.959.259.056.956.154.353.550.844.944.0
No. 480.779.078.578.175.875.675.575.273.765.458.252.1
Table 3. Droplet spreading diameter (mm) of various concentrations of DRA products. Values achieving the best spreading result are highlighted in bold.
% in
H2O
0.10.20.30.350.40.500.60.70.750.80.91.0
DRA
No. 113.314.114.514.715.115.415.615.916.216.617.017.1
No. 228.330.832.638.140.541.743.654.255.365.667.181.4
No. 338.639.240.140.341.242.142.643.445.751.154.559.3
No. 445.346.547.247.648.452.354.357.860.161.672.374.9
Disclaimer/Publisher’s Note: The statements, opinions and data contained in all publications are solely those of the individual author(s) and contributor(s) and not of MDPI and/or the editor(s). MDPI and/or the editor(s) disclaim responsibility for any injury to people or property resulting from any ideas, methods, instructions or products referred to in the content.

