

Automating KPI Measurement: A Sustainable Solution for Educational Accreditation


Abstract
1. Introduction
2. Planning and Creation of Google Sheets
- Academic accreditation: Academic accreditation is a process where educational institutions are evaluated based on predefined standards. It ensures the quality and effectiveness of the institution’s educational programs.
- Key performance indicators (KPIs): These are quantifiable metrics that help assess the performance of the institution or specific programs, ensuring compliance with accreditation standards. There are several significant benefits of measuring KPIs; some examples are as follows:
- –
- Continuous improvement of academic quality.
- –
- Alignment with national or international standards.
- –
- Ensuring accountability and transparency in educational outcomes.
- –
- Enhancing the program’s and institution’s reputation and student success.
- Identifying Key Performance Indicators for Academic Accreditation: Before creating a Google Sheet, it is crucial to identify the relevant KPIs that align with accreditation requirements. Depending on the accreditation body in the national or international framework, any programs or institutions have a set of predefined general key performance indicators. Any degree program or institution aiming for academic accreditation should comply with the minimum number of KPIs prescribed by the accreditation body. However, the program needs to introduce a further set of their own in association with the nature of the program and distinguish practices aligned with the requirements of the program. In a similar pattern, each institute has to define several sets of KPIs depending on several different parameters. For the purpose of the reader’s full understanding, we have listed a few common KPIs below:
- –
- Student Learning Outcomes: metrics to assess students’ mastery of course objectives.
- –
- Graduation Rates: the percentage of students who complete their programs on time.
- –
- Retention Rates: the percentage of students who return after their first year.
- –
- Faculty Qualifications: the number of faculty members with terminal degrees or relevant qualifications.
- –
- Student Satisfaction: results from surveys assessing students’ experience and satisfaction.
- –
- Employment Rates: percentage of graduates who secure employment in their field of study.
- –
- Professional development plan and activities
- *
- Research publications;
- *
- Presentations: scientific seminars and conferences;
- *
- Funded research projects;
- *
- Training programs: attended, organized, or trainer;
- *
- Post-graduate thesis guidance;
- *
- Undergraduate research project guidance;
- *
- Citation of research;
- *
- Academic guidance;
- *
- Rewards and patents.
2.1. Creation of Individual Faculty Members’ Portfolios
2.1.1. Cover Page
2.1.2. Research Publications
- Published year and months: Inclusion of both the publication year and month as separate columns in data collection sheets allows flexibility for both annual and academic year analyses. Data can be easily grouped or filtered by either, depending on the requirement.
- Number of authors: Classifying author data into three categories—departmental, university, and outside university—provides valuable insights into the level of research collaboration across different scopes. Here, we describe how this classification can be leveraged effectively:
- –
- Departmental Collaboration: These data are helpful to identify intra-departmental collaboration patterns. High numbers of departmental authors may indicate strong team-based research within the department but limited exposure beyond that scope. This is useful for evaluating internal capacity-building and the strength of specialized areas.
- –
- University Collaboration (Inter-Departmental or Colleges): This set of data provides insight on interdisciplinary collaboration within the university. High levels of inter-departmental co-authorship suggest that the university promotes cross-functional research, potentially leading to innovative solutions in emerging fields.
- –
- Outside University Collaboration (National and International): These data offer insights into the reach and influence of the institution’s research network at the national and global levels. Collaboration with external institutions reflects the visibility and influence of the university’s research and contributes to raising the institution’s reputation internationally.
- Article details: Complete details about the published article are required here. The possible information that are useful are as follows:
- –
- Author(s) name;
- –
- Publication title;
- –
- Journal’s abbreviated name;
- –
- Volume, numbers, year, and page number.
- DOI: Inclusion of the Digital Object Identifier (DOI) ensures direct access to the article’s webpage for verification purposes, facilitating easy retrieval of accurate information. Since the data collection mechanism accounts for individual faculty members, collaborative publications may appear multiple times across different faculty profiles. By leveraging the DOI, duplication in publication counts can be avoided, as the unique DOI allows for efficient filtering of repeated entries, ensuring an accurate tally of unique research outputs.
- Journal Rank: Journal rank is a key element in KPI measurement as it reflects research quality, influences institutional reputation, supports faculty evaluations, and plays a role in meeting accreditation standards. Incorporating it into automated systems like dynamic Google Sheets can help streamline tracking and reporting for accreditation purposes. In addition to the journal rank, journal impact factors can also be added in a separate column if required.
- Funding associated with the publications: Publications linked to funded research often have a higher chance of being published in high-impact journals. These publications not only elevate the reputation of individual researchers but also the institution, which is crucial during accreditation reviews. Detailed information about funding can be added to the same tab of the sheet. However, we present that information separately in this experiment.
- Aligned with University Identity/Strategic plan/Research plan: Universities often have distinct identities based on their founding principles, such as community engagement, innovation, sustainability, or global impact. Aligning the KPI of funding associated with publications with these values ensures that the research output and funding sources reflect the university’s unique position. For example, if the university prioritizes sustainability, tracking publications and funding in areas like climate research or renewable energy would align with its core identity. By emphasizing research funding in fields that enhance the university’s identity, such as the health sector, social impact, agriculture or technology, the KPI supports building a reputation around the institution’s strengths, which is crucial for accreditation and attracting top faculty, students, and collaborators. Creating categories in dynamic Google Sheets that align with strategic research priorities (e.g., sustainability, digital transformation, and health innovation). When funding or publications are added, they are automatically sorted and tracked within these strategic areas.
- Collaborating university name (if any): Collaboration with other universities, whether at a national or international level, strengthens academic networks and enhances the institution’s reach. This information helps to track which universities the institution/department is working with and assess the value of these partnerships. Publications produced in collaboration with other universities often reflect higher quality due to the pooling of expertise, diverse perspectives, and shared resources. Tracking the universities involved in collaborations allows the institution to monitor the quality of its research partnerships. Collaborating with prestigious or well-ranked institutions can elevate the visibility and impact of research, leading to higher citation rates and broader recognition.In the dynamic Google Sheets, creating a specific column or field for Collaborating University next to each publication entry will allow easy tracking of which universities are contributing to each publication. Additional features can also be added as per requirement to generate periodic reports showing the number of collaborative publications with each university, sorted by year, department, or research area. This provides a clear picture of the department’s or college’s collaborative efforts to fulfill the university’s strategic goals.
2.1.3. Training Workshops
- Tracking faculty members’ roles in professional development activities: Faculty members can participate in professional development activities in multiple capacities—such as participant, trainer/speaker, or organizer. It is crucial to track these roles individually to provide a comprehensive view of their engagement. By distinguishing these roles in the tracking system, one can achieve the following:
- Gain insights into leadership roles: track how often faculty members are leading as trainers or organizers, not just as participants.
- Measure diverse engagement: understanding whether a faculty member is more active as a participant or an organizer helps to assess both learning opportunities and contributions to peer development.
Implementation in Google Sheets: add a column titled Role with a drop-down menu that allows faculty to select their role: (i) Participant, (ii) Trainer/Speaker, (iii) Organizer. - Categorizing Training and Workshops: Different types of training and workshops may or may not be relevant to specific academic programs or departments. To ensure that faculty development activities align with departmental needs, it is important to categorize training by its focus. This helps program-level committees and faculty members plan activities that directly benefit their program’s goals. Implementation:
- Create a column titled Category with a drop-down menu of relevant categories, as follows:
- –
- Teaching and Learning;
- –
- Curriculum Development;
- –
- Career Guidance;
- –
- Science and Technology;
- –
- Data Science;
- –
- Software;
- –
- Machine Learning;
- –
- Artificial Intelligence;
- –
- Other (with an option to specify).
- This will allow quick filtering and analysis of training relevance to the program or department, making it easier to track targeted professional development.
- Providing Feedback on Training Programs: Constructive feedback is essential for improving the quality of training programs. Organizers can create feedback surveys, using tools like Google Forms, to gather input from participants on the effectiveness of the training. While a full analysis of survey results could be a separate task, a general sense of satisfaction can be captured in the tracking sheet to provide an immediate overview of training effectiveness. Implementation:
- Add a column titled Satisfaction Rating where faculty can input the average satisfaction rating collected from attendees or their own rating on a 5-point scale. This gives an easy-to-track measure of overall success.
- Tracking Training Program Organizers It is valuable to distinguish between internal training activities conducted by the university and external programs hosted by other institutions or organizations. Tracking the name of the organizer provides insight into how faculty members are engaging with both internal and external professional development opportunities. Implementation:
- Add a column titled Organizer name to capture the name of the organizing body (e.g., internal university departments, external professional organizations). This helps in evaluating the diversity and source of professional development activities.
2.1.4. Research Funding
2.1.5. Scientific Seminars
2.1.6. Thesis Guidance
2.1.7. Conferences
2.1.8. Undergraduate Project Guidance
2.1.9. Citation
2.1.10. Review Activities
2.1.11. Rewards and Patents
2.1.12. Academic Advisory
2.2. Combination of Individual Data for Further Utilization
Importing Data of Tab 2—Research Publications
- 1.
- Create a new Google Sheet with the name Combined record of research publications and add a tab name Publication_records.
- 2.
- Set the header of the tab Publication_records as shown in Table 2 from column C to N, and set Column A and B by faculty name and gender, respectively.
- 3.
- Import the required range from Faculty_1’s portfolio by using the following code,
in the cell . Please note, we fixed one hundred rows for each faculty member. The monitoring authority can be informed if any faculty has published more than one hundred articles to extend the number of rows for the concerned faculty.=IMPORTRANGE("link of faculty1 profile","2-Research publications!A3:
N102") - 4.
- After completion of the above three steps, the sheet will look as shown in Figure 3.
- 5.
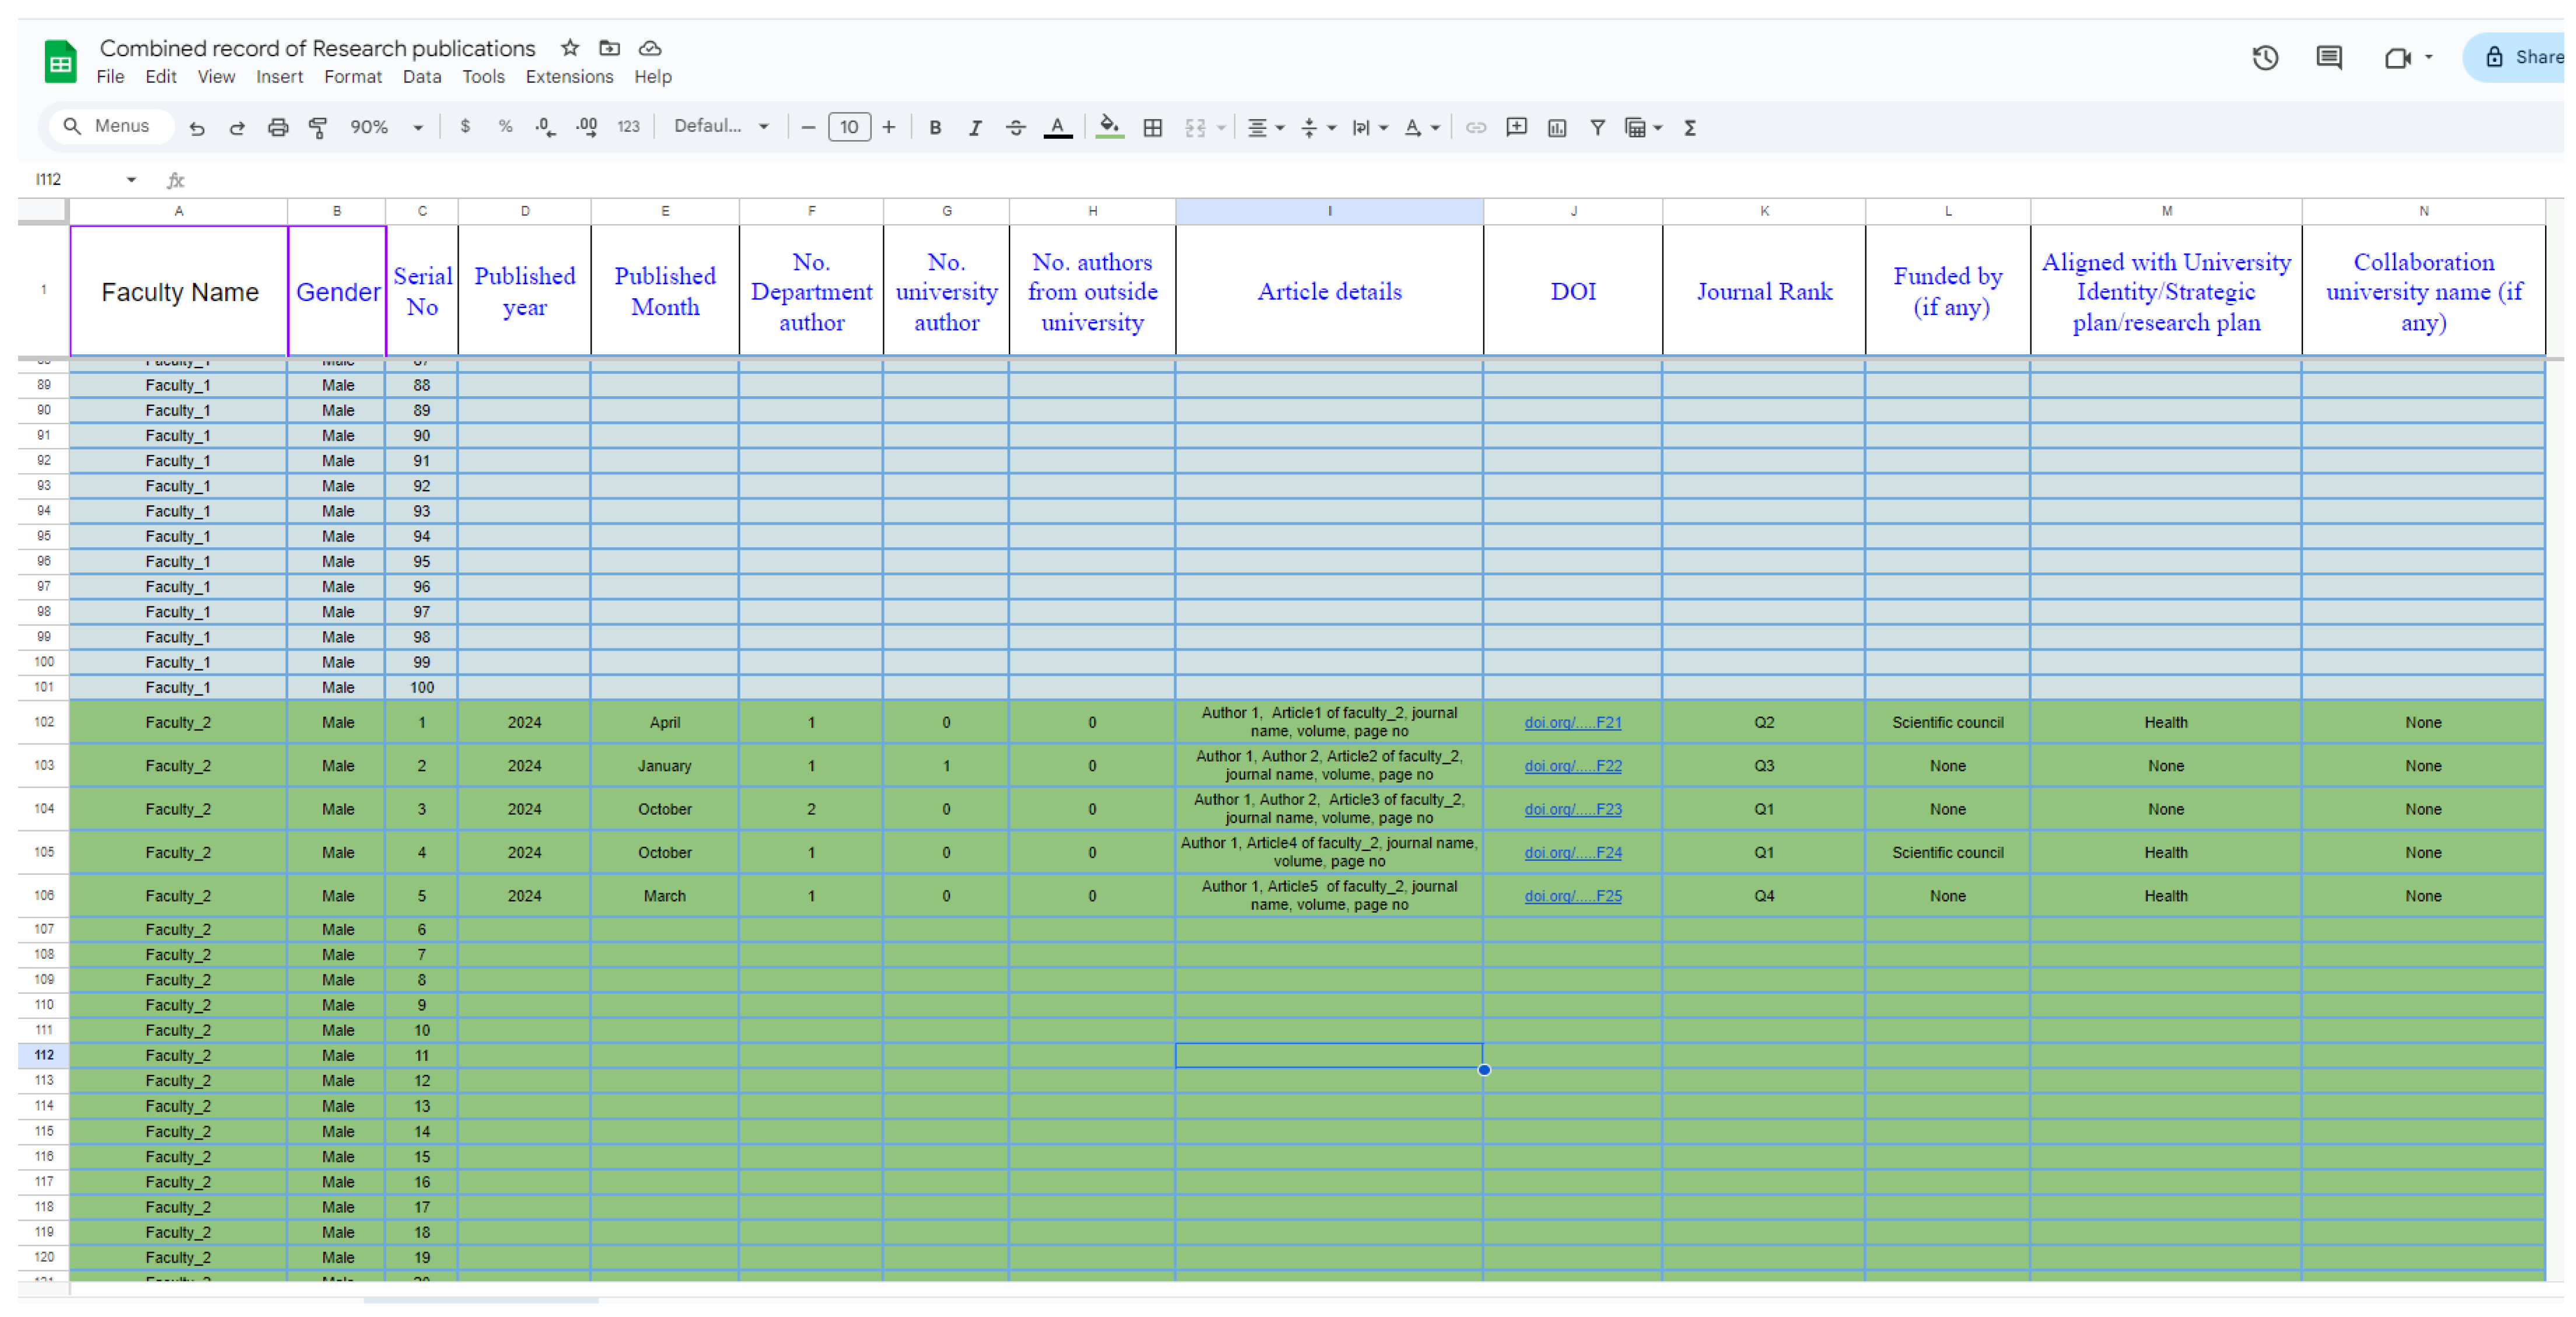
- By clicking on Allow Access, the data of faculty_1’s research publication will be imported. This is an automated system, and whenever faculty_1 updates any record, this sheet will be updated in real time, as shown in Figure 4.
- 6.
- Repeat step 4 and step 5 for faculty_2 on row 102. Then, the sheet will be structured as in Figure 5. Continue the process until it is linked with all 30 male and 25 female faculty members. We would like to remark here that there will be lots of empty rows between the records of the two faculties.
- 7.
- After importing all data in a single sheet, name it as Publication_records; we can formulate mechanisms to utilize the data for different purposes, including KPI calculation. We elaborate on this in the next step.
2.3. Filtering Research Publication Information Based on Required Criteria
| =FILTER(range, condition1, [condition2,...]) |
- Detailed list of all publications in a year: Assume that the list of publications in the calendar year 2024 needs to be filtered. This can be obtained in the sheet Filtered_information using the following formula:
=Filter(Publication_records!A2:N21500, Publication_records!D2:D21500
=2024)The range can be modified such that it encompasses all of the information in the sheet Publication_records. The year of publication is indicated in the range . The publishing information for the calendar year 2025 can be filtered by substituting for . - A comprehensive list of all publications across a number of years: In the case where data are required for three years—namely, 2023, 2024, and 2025—we can use the following filtered formula:
=Filter(Publication_records!A2:N21500, (Publication_records!D2:D21500
=2023)+(Publication_records!D2:D21500=2024)+(Publication_records!
D2:D21500=2025)) - List of all publications in ranked journal in a year: List of publications in ranked journal for the year can be filtered by
=Filter(Publication_records!A2:N21500, Publication_records!D2:D21500
=2024, Publication_records!K2:K21500=Q1)In case the requirement is for years 2023, 2024, and 2025, the code can be=Filter(Publication_records!A2:N21500, (Publication_records!D2:D21500
=2023)+(Publication_records!D2:D21500=2024)+(Publication_records!
D2:D21500=2025), Publication_records!K2:K21500=Q1) - List of all single-author publications in a year: We must select department author as one and other authors will be zero in the header filter in order to monitor just single-author articles. Therefore, the appropriate filtering code is
=Filter(Publication_records!A2:N21500, Publication_records!D2:D21500
=2024, Publication_records!F2:F21500=1,Publication_records!G2:
G21500=0, Publication_records!H2:H21501=0) - Group research publication within department: To know the group activities among faculty members within the department, we have to filter the publication record by
=Filter(Publication_records!A2:N21500, Publication_records!D2:D21500
=2024, Publication_records!F2:F21500>=1,Publication_records!G2:
G21500=0, Publication_records!H2:H21501=0) - Interdisciplinary research publication within university: By interdisciplinary research, we mean a department member or a research group collaborating with a member or a group from another department within the college or from other colleges. The outcome of such a collaboration can be accessed through the code
=Filter(Publication_records!A2:N21500, Publication_records!D2:D21500
=2024, Publication_records!F2:F21500>=1,Publication_records!G2:
G21500>=1, Publication_records!H2:H21501=0) - Collaboration with national and international researchers: This collaboration may be undertaken through individual efforts by academic members or by a formal memorandum of understanding (MoU) between colleges, universities, or programs. The outcomes can be filtered through
=Filter(Publication_records!A2:N21500, Publication_records!D2:D21500
=2024, Publication_records!F2:F21500>=1,Publication_records!G2:
G21500>=1, Publication_records!H2:H21501>=1) - Publication in ranked journal: To monitor a specific rank, say , of journals where faculty members are publishing in a year can be filtered through
Filter(Publication_records!A2:N21501, Publication_records!D2:D21501
=2024, Publication_records!K2:K21501="Q1")We will have two choices based on the drop-down menu if the query is for any ranking journal. In our instance, selections are available in the corresponding drop-down menu.In this case, the running code isFilter(Publication_records!A2:N21501, Publication_records!D2:D21501
=2024, Publication_records!K2:K21501<>"Conf-Procd-SCI/Scopus")In other cases, the filtering process can also be carried out using=Filter(Publication_records!A2:N21501, Publication_records!D2:D21501
=2024, (Publication_records!
K2:K21501="Q1")+(Publication_records!K2:K21501="Q2")+(
Publication_records!K2:K21501="Q3")+(Publication_records!K2:K21501="Q4")) - Publications that are aligned with any funding: Funded publication by any funding agency can be tracked through
Filter(Publication_records!A2:N21501, Publication_records!D2:D21501
=2024, Publication_records!L2:L21501<>"None")To obtain details about the support of a particular funding agency, then use=Filter(Publication_records!A2:N21501, Publication_records!D2:D21501
=2024, Publication_records!L2:L21501="name of funding agency")In order to prevent errors caused by different faculty members entering different abbreviations, it is preferable to build a drop-down menu. - Publications that are aligned with university identity or strategic plan activities: Generally, the statement of university identity or the required category of strategic plan activities are well known in advance. Hence, a drop-down menu can be created easily. If we need to know about publications that align with any of the identities, then use
=Filter(Publication_records!A2:N21501, Publication_records!D2:D21501
=2024, Publication_records!M2:M21501<>"None")Finally, if we need data for a specific identity, such as Health, then use=Filter(Publication_records!A2:N21500, Publication_records!D2:D21500
=2024, Publication_records!M2:M21500="Health")
2.4. Filtering Training and Workshop Events According to Their Type
- Detailed list of all training programs attended or organized by department members
=Filter(Training_records!A2:N21500, Training_records!D2:D21500
=2024) - Detailed list of all training programs attended by department members
=Filter(Trainig_Record!A2:N21501, Trainig_Record!D2:D21500=2024,
Trainig_Record!F2:F21500="Participant") - Detailed list of all training programs organized or trained by department members In this case, we have to filter based on the category of options: Your role. In our system, we provide options to choose from (i) trainer/speaker; (ii) self-organized; and (iii) organizer as a committee task. Members have the option to choose more than one option if applicable. Hence, we have the following options to filter:
=Filter(Trainig_Record!A2:N21501, Trainig_Record!D2:D21501=2024, (
Trainig_Record!F2:F21501="Trainer/speaker, Organizer as a
committee task")+(Trainig_Record!F2:F21501="Organizer as a
committee task")+(Trainig_Record!F2:F21501="Trainer/speaker")+(
Trainig_Record!F2:F21501="Self Organized") +(Trainig_Record!F2:
F21501="Trainer/speaker, Self Organized")) - Engagement in a particular kind of training: Suppose that we would like to filter details of a certain kind of training activity, for example, software and programming. Then, we can use the following code:
=Filter(Trainig_Record!A2:N21501, Trainig_Record!D2:D21501=2024,
Trainig_Record!H2:H21501="Software and programming")If we want to limit our search about the training programs organized by department members as a trainer/speaker or organized as a committee task, we have to use=Filter(Trainig_Record!A2:N21501, Trainig_Record!D2:D21501=2024,
Trainig_Record!H2:H21501="Software and programming",(
Trainig_Record!F2:F21501="Trainer/speaker")+(Trainig_Record!F2:
F21501="Trainer/speaker, Organizer as a committee task")+(
Trainig_Record!F2:F21501="Organizer as a committee task")+(
Trainig_Record!F2:F21501="Self Organized") )
2.5. Filtering Information Related to Research Funding
- Information about internal funding
=Filter(Research_Funding!A2:N21501, Research_Funding!D2:D21501=2024,
Research_Funding!L2:L21501="Internal") - Information about external funding
=Filter(Research_Funding!A2:N21501, Research_Funding!D2:D21501=2024, (
Research_Funding!L2:L21501="External- National University")+(
Research_Funding!L2:L21501="External- Ministry or Goverment body")+(
Research_Funding!L2:L21501="External -International University")+(
Research_Funding!L2:L21501="External- Private organization"))If there is a requirement about funding information for any single external category, then the last entry can be relaxed accordingly. - Information about funding with students
=Filter(Research_Funding!A2:O21501, Research_Funding!D2:D21501=2024, (
Research_Funding!O2:O21501="Master")+(Research_Funding!O2:O21501="
Bachelor")+(Research_Funding!O2:O21501="Doctoral"))If there is a requirement for student in any specific program like a Bachelor, the filtering process can be simplified as follows:=Filter(Research_Funding!A2:O21501, Research_Funding!D2:D21501=2024,
Research_Funding!O2:O21501="Master")
2.6. Filtering Information Related to Scientific Seminar
| =Filter(Scientific_Seminer!A2:N21501, Scientific_Seminer!D2:D21501=2024, Scientific_Seminer!F2:F21501="Master student") |
| =Unique(FILTER(Scientific_Seminer!G2:G21500, (Scientific_Seminer!G2:G21500 <>"")*(Scientific_Seminer!D2:D21500=2024)*(Scientific_Seminer!F2:F21501="Master student"))) |
3. Direct Calculation of Key Performance Indicators
3.1. Domain: Research Publications
- IF: Internal faculty, i.e., a faculty member from the department or program under study.
- UF: University faculty, i.e., a faculty member from the same university but in another department or college other than the department or program under study.
- OF: Outside faculty, i.e., a faculty member from another national or international university.
- 1.
- KPI Statement: Total number of research article publications by departments’ faculty members. This KPI is intended to measure overall publication records by the department faculty. The total number of publications can be counted by the following code:
=COUNTA(UNIQUE(FILTER(Publication_records!J2:J2100,(
Publication_records!J2:J2100<>"")*(Publication_records!D2:D2100=2024))))It can be observed that faculty members have some group publications with department members. This code counts those articles one time only and gives an exact physical count of published articles.Let us validate this code using data from Table 13. There are a total of twenty-eight (28) publications by ten faculty members. We are searching for records of the year 2024 only; we have 21 publications. Further, collaborative research among faculty members within the department results in duplication of DOIs as follows: ; ; ; . Thus, the total number of unique publications in the department by the ten faculty members in the year 2024 is seventeen. This validation through the code is presented in Figure 6. - 2.
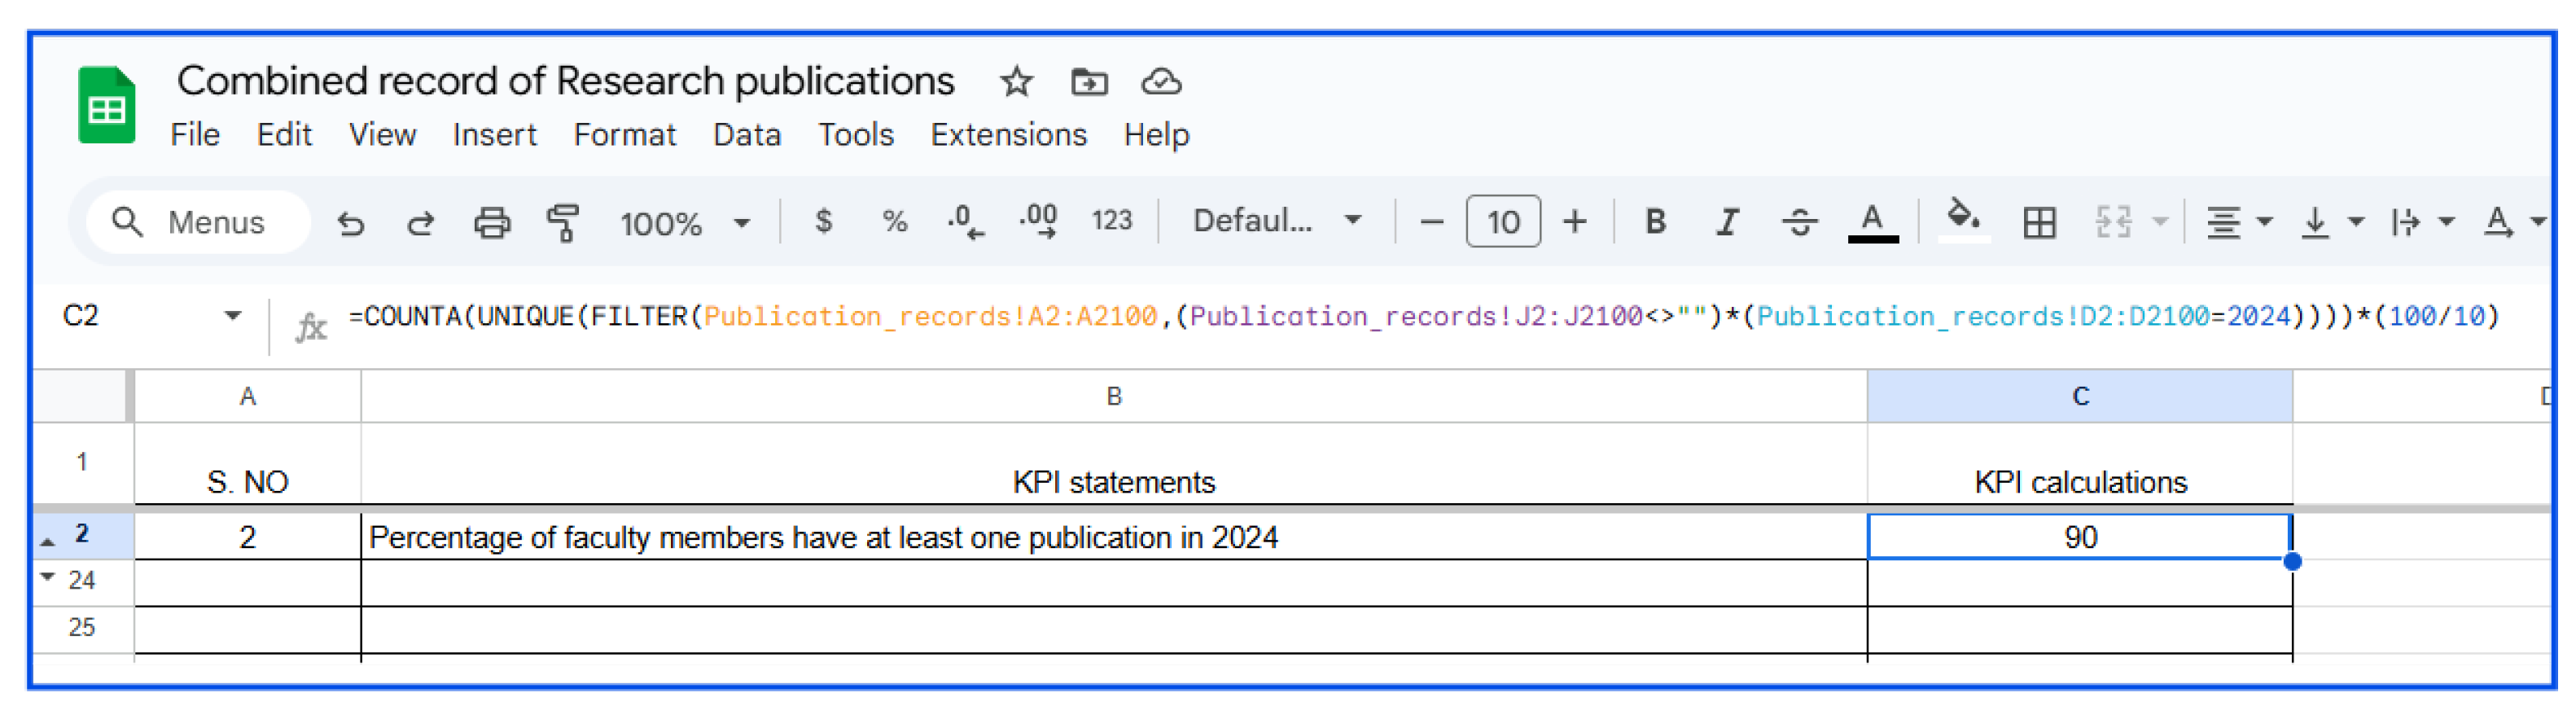
- KPI Statement: Percentage of faculty members with at least one publication in a year. This KPI provides the percentage of faculty members with at least one publication in the year 2024. It is evident from Table 13 that Faculty-4 does not have any publication in 2024. Thus, out of ten faculty members, nine have at least one publication in 2024. This calculation is validated in Figure 7 and directly calculated from Google Sheets as follows:
=COUNTA(UNIQUE(FILTER(Publication_records!A2:A2100,(
Publication_records!J2:J2100<>"")*(Publication_records!D2:D2100
=2024))))*(100/(Number of faculty members of rank Assistant professor and above)) - 3.
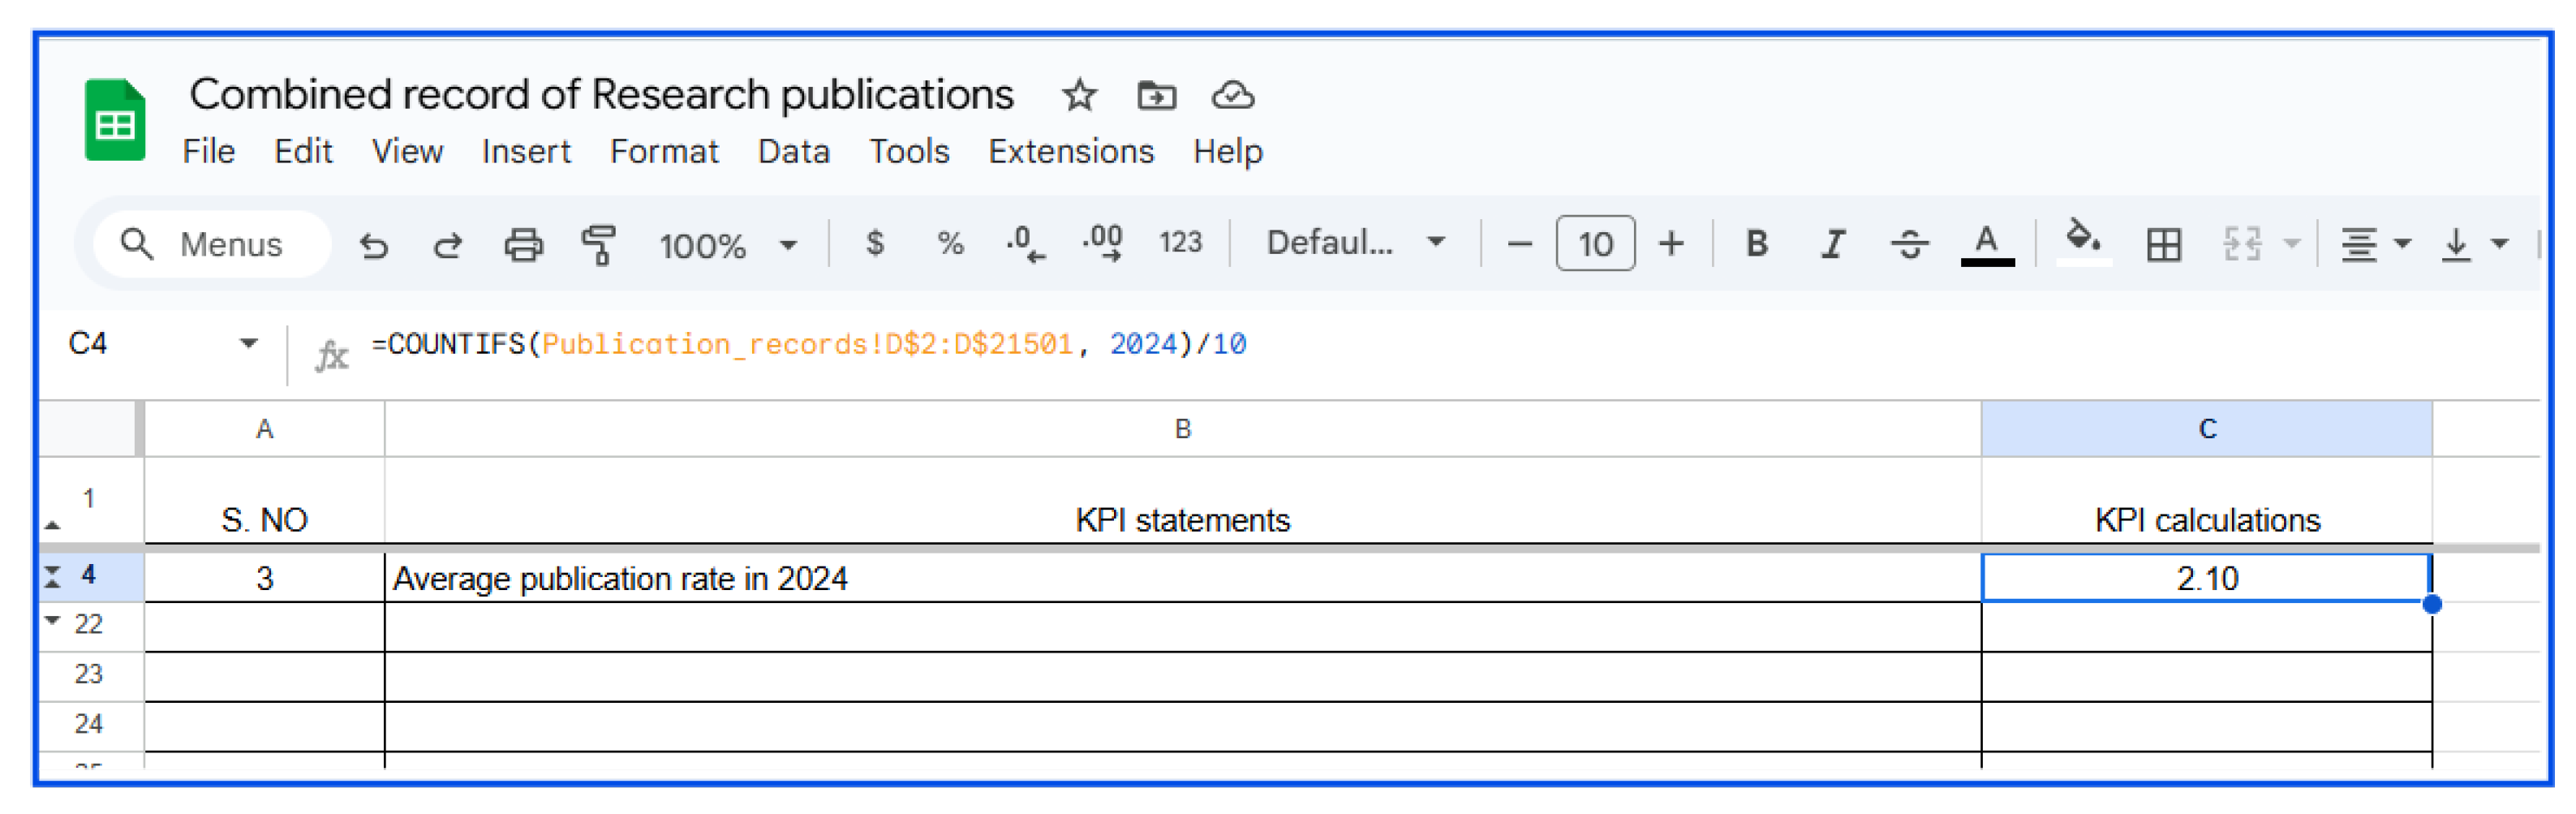
- KPI Statement: Average publication rate in a year. We aim here to calculate the average rate of publications in the year 2024. We calculate this by adding all publications by each faculty members divided by the number of faculty in the department.
=COUNTA(Publication_records!D2:D2100=2024)/(Number of faculty members
of rank Assistant professor and above)This is the easiest one among all KPIs calculations. In 2024, there are a total of 21 publications and 10 faculty members. Thus, the average is equal to , which is validated in Figure 8 by using code. - 4.
- KPI Statement: Number of funded research publications. This KPI will provide the impact of funding in scientific publications. From column L of Table 13, one can observe that there are twelve articles in 2024 that are funded by different sources. One article is funded by the Ministry, while eleven articles are funded by the Scientific Council. The following code gives the total number of publications:
=COUNTIFS(Publication_records!D2:D21501,2024, Publication_records!L$2:
L$21501, "<>") - COUNTIFS(Publication_records!D2:D21501,2024,
Publication_records!L$2:L$21501, "None")In case the requirement is to know the number of publications funded by a particular agency, namely, scientific council, it is derived by=COUNTIFS(Publication_records!D2:D21501,2024, Publication_records!L$2:
L$21501, "scientific council")Both codes are presented in Figure 9.We remark here that to have accurate data, all the publications should be associated with the name of a funding resource or need to be filled as “None” in column L. - 5.
- KPI Statement: Total number of publications aligned with university identity. This KPI will provide the impact of funding in scientific publications.
=COUNTIFS(Publication_records!D2:D21501, 2024, Publication_records!M$2
:M$21501, "<>") - COUNTIFS(Publication_records!D2:D21501, 2024,
Publication_records!M$2:M$21501, "None")A drop-down menu with the list of identities and the option for choosing “None” will be helpful to have the correct set of data. The drop-down menu is also helpful for calculating the number of publications in a specific identity, namely, “Health”. This can be calculated by using=COUNTIFS(Publication_records!D2:D21501,2024, Publication_records!M$2:
M$21501, "Health")The validation of this KPI is similar to the above KPI about the funding; hence, we do not include it here as a Google Sheet image. - 6.
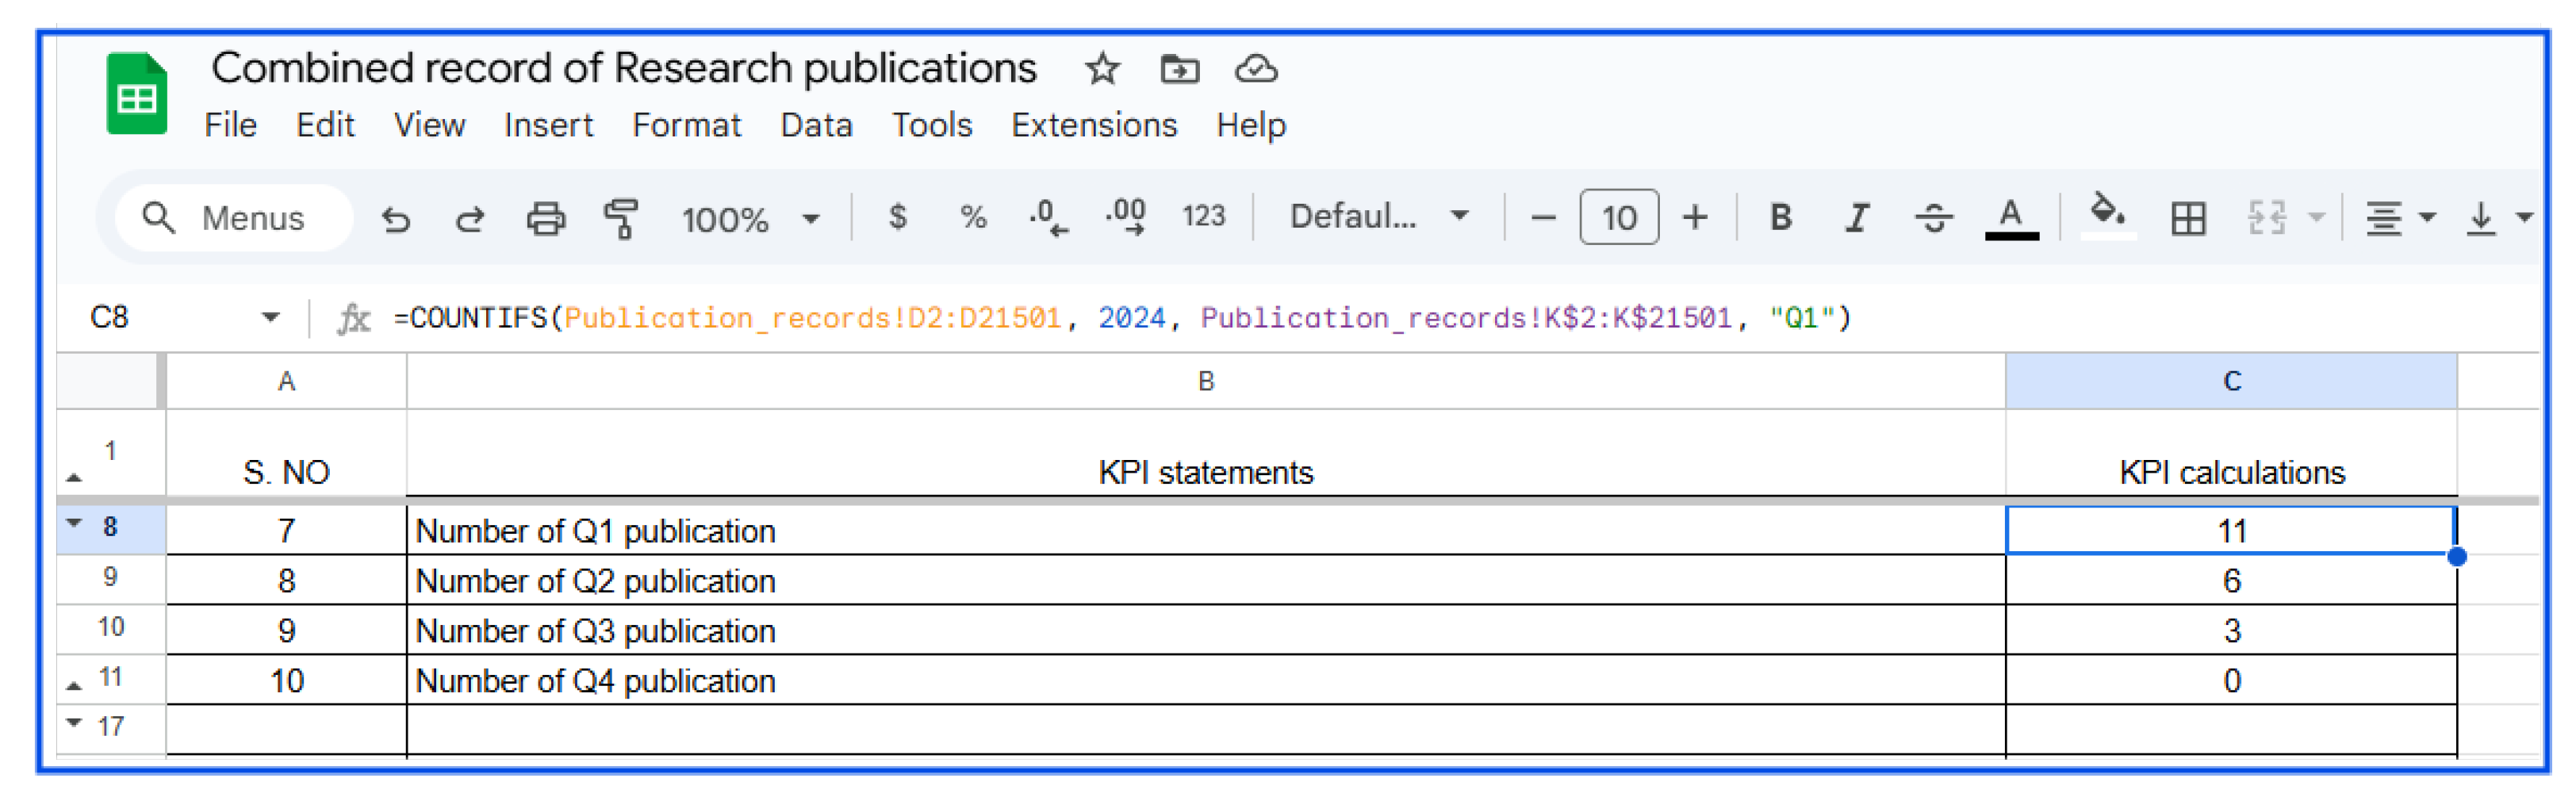
- KPI Statement: Number of publications in Journal. The Kth column of Table 13 indicates that there are , as follows: , , , and . To automate this calculation, one can use
which is validated in Figure 10.=COUNTIFS(Publication_records!D2:D21501, 2024, Publication_records!K$2
:K$21501, "Q1")Similarly, the number of publications in , , and can be counted by
by replacing in , respectively.=COUNTIFS(Publication_records!D2:D21501, 2024, Publication_records!K$2
:K$21501, "Qi")
3.2. Domain: Training and Workshops
- KPI Statement: Number of faculty members actively participating in professional development activities. We will measure this KPI in the sense of faculty members’ involvement in at least one activity during a time frame in the capacity of (i) participation, (ii) trainer/speaker, (iii) organizer as committee task, and (iv) self-organized.
=Counta(Unique(FILTER(Trainig_Record!A2:A21500, (Trainig_Record!F2:
F21500<>"")*(Trainig_Record!D2:D21500=2024)))) - KPI Statement: Number of activities related to software and programming.
=Counta(Unique(FILTER(Trainig_Record!G2:G21500, (Trainig_Record!G2:
G21500<>"")*(Trainig_Record!D2:D21500=2024)*(Trainig_Record!H2:
H21500="Software and programming"))) - KPI Statement: Number of activities related to Teaching and Learning.
=Counta(Unique(FILTER(Trainig_Record!G2:G21500, (Trainig_Record!G2:
G21500<>"")*(Trainig_Record!D2:D21500=2024)*(Trainig_Record!H2:
H21500="Teaching and Learning")))
| =Unique(FILTER(Trainig_Record!G2:G21500, (Trainig_Record!G2:G21500<>"")*(Trainig_Record!D2:D21500=2024)*( Trainig_Record!H2:H21500="Teaching and Learning"))) |
3.3. Domain: Research Funding
- KPI Statement: Number of internal funds.
=Countifs(Research_Funding!D2:D21501, 2024, Research_Funding!L2:L21501
, "internal") - KPI Statement: Number of external funds.
=Countifs(Research_Funding!D2:D21501, 2024, Research_Funding!L2:L21501
, "*External*")This will provide all external funds’ information. If details of any specific external funding are needed, replace "*External*" by "*Name of external funding from drop-down*". - KPI Statement: Number of faculty members with at least one fund.
=Counta(Unique(Filter(Research_Funding!A2:A21500,(Research_Funding!D2:
D21500=2024)*(Research_Funding!L2
:L21500<>"") )))If the KPI is used to calculate a percentage rather than a number, it can be divided by the total number of faculty members. - KPI Statement: Number of female faculty members with at least one fund.
=Counta(Unique(Filter(Research_Funding!A2:A21500,(Research_Funding!D2:
D21500=2024)*(Research_Funding!L2:L21500<>"")*(Research_Funding!L2
:L21500="Female") )))If the KPI is used to calculate a percentage rather than a number, it can be divided by the total number of female faculty members. - KPI Statement: Number of male faculty members with at least one fund.
=Counta(Unique(Filter(Research_Funding!A2:A21500,(Research_Funding!D2:
D21500=2024)*(Research_Funding!L2:L21500<>"")*(Research_Funding!L2
:L21500="male") )))If the KPI is used to calculate a percentage rather than a number, it can be divided by the total number of male faculty members.
3.4. Domain: Scientific Seminar
- KPI Statement: Number of scientific seminars presented by a master’s student.
=COUNTA(Unique(FILTER(Scientific_Seminer!G2:G21500, (
Scientific_Seminer!G2:G21500<>"")*(Scientific_Seminer!D2:D21500
=2024)*(Scientific_Seminer!F2:F21501="Master student")))) - KPI Statement: Number of scientific seminars presented by a doctorate student.
=COUNTA(Unique(FILTER(Scientific_Seminer!G2:G21500, (
Scientific_Seminer!G2:G21500<>"")*(Scientific_Seminer!D2:D21500
=2024)*(Scientific_Seminer!F2:F21501="Doctorate student")))) - KPI Statement: Number of scientific seminars presented by a faculty member.
=COUNTA(Unique(FILTER(Scientific_Seminer!G2:G21500, (
Scientific_Seminer!G2:G21500<>"")*(Scientific_Seminer!D2:D21500
=2024)*(Scientific_Seminer!F2:F21501="Faculty- department")))) - KPI Statement: Number of scientific seminars presented by an external researcher.
=COUNTA(Unique(FILTER(Scientific_Seminer!G2:G21500, (
Scientific_Seminer!G2:G21500<>"")*(Scientific_Seminer!D2:D21500
=2024)*(Scientific_Seminer!F2:F21501="External researcher")))) - KPI Statement: Number of faculty members who attended at least one scientific seminar.
= Counta(Unique(FILTER(Scientific_Seminer!A2:A21500, (Scientific_Seminer!G2:G21500<>"")*(
Scientific_Seminer!D2:D21500=2024))))
3.5. Domain: Thesis Guidance
- KPI Statement: Number of students who enrolled in a master’s thesis in the year.
=Countifs(Thesis_Guidence!D2:D22000, 2024, Thesis_Guidence!H2:H22000,
"Master") - KPI Statement: Number of students who completed a master’s thesis in the year.
=Countifs(Thesis_Guidence!F2:F22000, 2024, Thesis_Guidence!H2:H22000,
"Master") - KPI Statement: Number of students who enrolled in a doctoral thesis in the year.
=Countifs(Thesis_Guidence!D2:D22000, 2024, Thesis_Guidence!H2:H22000,
"Doctoral") - KPI Statement: Number of students who completed a doctoral thesis in the year.
=Countifs(Thesis_Guidence!F2:F22000, 2024, Thesis_Guidence!H2:H22000,
"Doctoral") - KPI Statement: Number of faculties involved in at least one thesis guidance in a master’s program in the year.
=COUNTA(Unique(Filter(Thesis_Guidence!A2:A21501, (Thesis_Guidence!F2:
F21501=2024)*(Thesis_Guidence!H2:H21501="Master")*(Thesis_Guidence
!I2:I21501<>" "))))+COUNTA(Unique(Filter(Thesis_Guidence!A2:A21501
, (Thesis_Guidence!D2:D21501=2024)*(Thesis_Guidence!H2:H21501="Master")*(Thesis_Guidence!I2:I21501<>" ")))) - KPI Statement: Number of faculties involved in at least one thesis guidance in a doctoral program in the year.
=COUNTA(Unique(Filter(Thesis_Guidence!A2:A21501, (Thesis_Guidence!F2:
F21501=2024)*(Thesis_Guidence!H2:H21501="Doctoral")*(
Thesis_Guidence!I2:I21501<>" "))))+COUNTA(Unique(Filter(
Thesis_Guidence!A2:A21501, (Thesis_Guidence!D2:D21501=2024)*(
Thesis_Guidence!H2:H21501="Doctoral")*(Thesis_Guidence!I2:I21501<>" "))))
3.6. Domain: Conference
- KPI Statement: Number of faculty members who attended at least one conference.
=COUNTA(Unique(Filter(Conference!A2:A21501, (Conference!D2:D21501=
2024)*(Conference!G2:G21501<>" ")))) - KPI Statement: Number of faculty members obtained support for attending a conference.
=COUNTA(Unique(Filter(Conference!A2:A21501, (Conference!D2:D21501
=2024)*(Conference!H2:H21501<>"Self Sponsered"))))Here, support refers to the sponsor.
3.7. Domain: Undergraduate Project
- KPI Statement: Number of projects involving original research.
=COUNTA(Unique(Filter(UG_Projet!F2:F21501, (UG_Projet!D2:D21501=2024)
*(UG_Projet!H2:H21501="Original Research")))) - KPI Statement: Number of projects with reviewed research.
=COUNTA(Unique(Filter(UG_Projet!F2:F21501, (UG_Projet!D2:D21501=2024)
*(UG_Projet!H2:H21501="Review Research")))) - KPI Statement: Number of project based on software implementations.
=COUNTA(Unique(Filter(UG_Projet!F2:F21501, (UG_Projet!D2:D21501=2024)
*(UG_Projet!H2:H21501="Software implementation")))) - KPI Statement: Number of students who learned/implemented LaTeX software.
=COUNTA(Filter(UG_Projet!I2:I21501, UG_Projet!D2:D21501=2024, Isnumber
(SEARCH("LaTeX", UG_Projet!I2:I21501)))) - KPI Statement: Number of students who learned/implemented Mathematica software.
=Counta(Filter(UG_Projet!I2:I21501, ISNUMBER(SEARCH("Mathematica",
UG_Projet!I2:I21501)))) - KPI Statement: Number of students who learned/implemented MatLab software.
=Counta(Filter(UG_Projet!I2:I21501, ISNUMBER(SEARCH("MatLab",
UG_Projet!I2:I21501)))) - KPI Statement: Number of students who learned/implement R programming.
=Counta(Filter(UG_Projet!I2:I21501, ISNUMBER(SEARCH("R Program",
UG_Projet!I2:I21501))))
3.8. Domain: Citation
- KPI Statement: Total number of citations.
= Counta(Unique(FILTER(Scientific_Seminer!A2:A21500, (
Scientific_Seminer!G2:G21500<>"")*(Scientific_Seminer!D2:D21500=2024)))) - KPI Statement: Average rate of citation per faculty member.
= Counta(Unique(FILTER(Scientific_Seminer!A2:A21500, (
Scientific_Seminer!G2:G21500<>"")*(Scientific_Seminer!D2:D21500=2024))))
3.9. Domain: Review Activities
- KPI Statement: Percentage of faculty members who participated in at least one review activity. The following formula will give us the number of faculty members who participated in at least one review activity.
=COUNTA(Unique(Filter(Review_Activities!A2:A21501, (Review_Activities!
D2:D21501=2024)*(Review_Activities!F2:F21501<>" "))))The percentage can be calculated by dividing the total number of faculty-ranked associate professors or above. - KPI Statement: Total number of journal articles reviewed by faculty members in the year.
=Countifs(Review_Activities!D2:D22000, 2024, Review_Activities!F2:
F22000, "Journal Article") - KPI Statement: Total number of internal master theses reviewed by faculty members in the year.
=Countifs(Review_Activities!D2:D22000, 2024, Review_Activities!F2:
F22000, "Thesis", Review_Activities!H2:H22000, "Master- Department
") - KPI Statement: Total number of external master theses reviewed by faculty members in the year.
=Countifs(Review_Activities!D3:D22001, 2024, Review_Activities!F3:
F22001, "Thesis", Review_Activities!H3:H22001, "Master-External-
KSA")+ Countifs(Review_Activities!D3:D22001, 2024,
Review_Activities!F3:F22001, "Thesis," Review_Activities!H3:H22001, "Master-External-KFU") - KPI Statement: Total number of internal doctoral theses reviewed by faculty members in the year.
=Countifs(Review_Activities!D2:D22000, 2024, Review_Activities!F2:
F22000, "Thesis", Review_Activities!H2:H22000, "Doctoral-
Department") - KPI Statement: Total number of external doctoral theses reviewed by faculty members in the year.
=Countifs(Review_Activities!D3:D22001, 2024, Review_Activities!F3:
F22001, "Thesis", Review_Activities!H3:H22001, "Master-External-
KSA")+ Countifs(Review_Activities!D3:D22001, 2024,
Review_Activities!F3:F22001, "Thesis," Review_Activities!H3:H22001
, "Master-External-KFU")
3.10. Domain: Rewards
- KPI Statement: Number of faculty members received rewards for the year.
=COUNTA(UNIQUE(FILTER(F2:F21500,(F2:F21500<>"")*(D2:D21500=2024)))) This KPI is computed on the same sheet that contains the combined data. The code must be changed if the computation is to be performed on a different sheet.
3.11. Domain: Assessment of Student’s Progress Through Academic Advisor Records
- KPI Statement: Number of graduated students in the concerned year. Let us obtain the number of total graduated students, irrespective of their enrollment year, at the end of the academic year 2025. This can be measured through
=COUNTIFS(I3:I22000, "Graduated", J3:J22000, "July-August-September",
K3:K22000, "2025")+ COUNTIFS(I3:I22000, "Graduated", J3:J22000, "
January",K3:K22000, "2025") - KPI Statement: Completion rate. The completion rate is calculated based on the minimum program duration for graduation. For a program with a four-year duration, the completion rate represents the percentage of students who graduated within four years or less, relative to the total number of students initially enrolled in that cohort.
- (i)
- TN = Total number of enrollments in the years 2021–2022. This can be determined by using =COUNTIFS(G3:G22000, "2021").
- (ii)
- N = Number of graduated students at the end of the academic year 2024–2025 who enrolled in 2021–2022; this can be filtered by using
=COUNTIFS(G10:G22007, "2021",I10:I22007, "Graduated", J10:J22007,
"July-August-September",K10:K22007, "2025")+ COUNTIFS(G10:
G22007, "2021",I10:I22007, "Graduated", J10:J22007, "January",
K10:K22007, "2025")
Thus, the completion rate is given by the following formula: - KPI Statement: First-year students retention rate. The first year in the program is very crucial for a student. Based on their performance in this initial year, students generally decide to either move to another program or withdraw from the program. We have to check how many students withdrew from the program who enrolled in the academic year of 2024–2025.
=COUNTIFS(G10:G22007, "2024",I10:I22007, "Withdrawn", J10:J22007,
"July-August-September",K10:K22007, "2025")+ COUNTIFS(G10:G22007,
"2024",I10:I22007, "Withdrawn", J10:J22007, "January", K10:K22007,
"2025")
4. Further Discussion and a Comparative Study
4.1. General Comparison with KPI Tracking Software
4.1.1. Efficiency
4.1.2. Security
4.1.3. Scalability
4.2. Integration of Google Sheets Automation with LMSs and ERP Systems
4.2.1. Integration with Learning Management Systems (LMSs)
- Automating KPI Tracking for Student Performance: Google Sheets can retrieve real-time student data—such as attendance, grades, and assessment scores—from the Learning Management System (LMS) using API connectors. By utilizing formulas, pivot tables, and Google Apps Script, it can automatically analyze trends and provide instant insights into key performance indicators (KPIs) without the need for manual data entry. For example, a university can track student retention rates by directly pulling enrollment data from platforms like Moodle or Blackboard [21].
- Auto-Syncing Assessment Data for Accreditation Reports LMS-generated grade books can be linked to Google Sheets, where automated scripts calculate pass rates, mean scores, and progression rates for accreditation compliance. Institutions can set up scheduled scripts to pull weekly reports and send alerts for KPI deviations.
4.2.2. Google Sheets and ERP Integration for Institutional Efficiency
4.2.3. Synchronizing Faculty Workload and Budget Data
4.2.4. Automating Accreditation Compliance Reports
4.3. Challenges of Using Google Sheets for KPI Tracking
4.3.1. Speed
4.3.2. Data Security
4.3.3. Access Control
4.4. Recommendations in the Context of Current Study
- Key Differences in Accreditation: Accreditation typically takes place at both the program level (https://etec.gov.sa/en/service/accreditation/servicedocuments, (accessed on 15 February 2025) and institution level (https://etec.gov.sa/en/service/Institutional-Accreditation/servicedocuments, (accessed on 15 February 2025)), each serving important roles in quality assurance. At the program level, the required documentation can vary significantly based on the specific field of study. For instance, key performance indicators (KPIs) for programs in computer science or engineering are tailored differently compared to those for mathematics or physics. This diversity allows for a more focused evaluation of each program’s effectiveness.On the other hand, institutional accreditation provides a broader framework without such specific restrictions. Consequently, utilizing local data can be highly beneficial for program accreditation, as it often offers insights that institutional databases may not capture. This targeted approach can greatly enhance the preparation of program-level KPI reports, ensuring they accurately reflect the unique strengths and needs of each program.
- Administrative Hassle in Accessing Institutional Data for Accreditation: Obtaining data from an institution’s data management system for program-level accreditation can be a cumbersome process. Institutional databases are often designed for broad administrative and academic purposes, making it difficult to extract specific data relevant to individual programs. The following challenges may follow in data retrieval:
- –
- Bureaucratic Procedures: institutions may have strict policies regarding data access, requiring multiple approvals before any information is shared.
- –
- Data Aggregation Issues: institutional databases often store data in a generalized format, making it less useful for program-specific accreditation needs.
- –
- Confidentiality and Security: data protection policies can restrict access to certain datasets, delaying the accreditation process.
- –
- Inconsistent Data Formats: the format and structure of institutional data may not align with the specific requirements of program-level key performance indicators (KPIs).
- –
- Time-Consuming Process: administrative delays, multiple stakeholders, and a lack of real-time data availability can slow down the preparation of program accreditation reports.
Program-specific data are more accurate and tailored to meet accreditation requirements. They reduce reliance on institution-wide data management, thereby minimizing administrative challenges. By collecting localized data, programs can monitor their progress in real-time and make informed decisions for improvement. Therefore, depending on local data sources instead of institutional databases is often a more efficient method for preparing KPI reports for program accreditation. - Accessibility during urgent needs: Accreditation reviewers may request immediate data verification or additional reports. Local data are significantly more efficient for urgent accreditation needs compared to institutional data. They allow for quick access, customization, and program-specific insights, which ensures a smooth and responsive accreditation process. Institutions should prioritize local data management strategies to improve preparedness and reduce administrative delays.
- Reduced Dependency on IT and Administration: Institutional databases typically require IT support for access, modifications, and report generation. In contrast, local data allow academic departments to manage their own accreditation data. This independence streamlines processes and decreases reliance on IT, leading to a more efficient and proactive approach to data oversight.
- Essential Information Collection: The proposed method in this study carefully refrains from requesting highly confidential information, such as financial transactions and the identities of faculty and students, including their transcripts. Instead, it focuses on gathering information that is generally shareable and essential for the accreditation process. This approach promotes transparency and collaboration within the academic community.
- Reduced security concerns: The data collection process is meticulously designed to ensure security, fostering a direct one-to-one relationship between individual faculty members and the designated sheet owner, typically the head of the accreditation unit or a relevant committee leader. The master collection sheet serves as a comprehensive repository for consolidating information across specific categories and is exclusively managed by the sheet owner, guaranteeing both integrity and confidentiality.Upon collection, the data are seamlessly mapped to automatically calculate key performance indicators (KPIs). This finalized dataset is then promptly shared with the designated departmental committee to prepare a thorough analysis report of the KPIs, which will be used for accreditation purposes.With the robust security measures that Google has implemented, this system effectively safeguards sensitive information from unauthorized access, ensuring the minimum required protection.
- Support to institutional accreditation unit: There are several KPIs for institutional accreditation that closely align with the KPIs or data at the program level. To strengthen the connection between institutional and program-level performance, institutional quality units can effectively use their structured Quality Management System to gather relevant information as needed. This data collection can include raw data or comprehensive analysis reports, offering flexibility based on specific requirements.By implementing effective calculation methods to measure key institutional KPIs, these units can gain valuable insights. This process, which utilizes detailed micro-level information from each program, not only enhances the understanding of performance but also promotes continuous improvement across the institution.
5. Conclusions
Funding
Institutional Review Board Statement
Informed Consent Statement
Data Availability Statement
Conflicts of Interest
References
- Middle States Commission on Higher Education (MSCHE). Standards for Accreditation and Requirements of Affiliation. MSCHE, 2020. Available online: https://www.msche.org/standards/ (accessed on 25 November 2024).
- Accreditation Board for Engineering and Technology (ABET). Criteria for Accrediting Engineering Programs, 2021–2022. ABET Accreditation Criteria, 2021. Available online: https://www.abet.org/accreditation/ (accessed on 25 November 2024).
- Varouchas, E.; Sicilia, M.Á.; Sánchez-Alonso, S. Academics’ Perceptions on Quality in Higher Education Shaping Key Performance Indicators. Sustainability 2018, 10, 4752. [Google Scholar] [CrossRef]
- Association to Advance Collegiate Schools of Business (AACSB). AACSB Standards for Business Accreditation. 2020. Available online: https://www.aacsb.edu/accreditation (accessed on 25 November 2024).
- Badawy, M.; El-Aziz, A.; Hefny, H. Exploring and measuring the key performance indicators in higher education institutions. Int. J. Intell. Comput. Inf. Sci. 2018, 18, 37–47. [Google Scholar] [CrossRef]
- Alomary, F.O. Evaluation of scientific research based on key performance indicators (KPIs): A case study in Al-Imam Mohammad IBN Saud Islamic University. Comput. Inf. Sci. 2020, 13, 34–40. [Google Scholar] [CrossRef]
- Tomić, B.; Milić, T. Automated interpretation of key performance indicator values and its application in education. Knowl.-Based Syst. 2013, 37, 250–260. [Google Scholar] [CrossRef]
- Mohammed, T.A. Challenges for the Use of Key Performance Indicators for Data-Driven Decision-Making in Higher Education Institutions in Saudi Arabia. J. Manag. Inf. Decis. Sci. 2022, 25, 1–14. [Google Scholar]
- Uddin, O.O.; Konyeha, S.; Edegbe, G.N. Enhancing accreditation transparency and accountability through electronic data interchange: A comparative study. Int. J. Sci. Res. Arch. 2024, 12, 2135–2140. [Google Scholar] [CrossRef]
- AL-Dahiyat, M.A. Measuring the Strategic Performance of Higher Education Institutions: A Balanced Scorecard Approach. Acad. Account. Financ. Stud. J. 2020, 24, 1–14. [Google Scholar]
- Noor, A.S.; Younas, M.; Arshad, M. A review on cloud based knowledge management in higher education institutions. Int. J. Electr. Comput. Eng. 2019, 9, 5420–5427. [Google Scholar] [CrossRef]
- Ahmad, E.; Alammary, A. A Cloud-based Framework for Quality Assurance and Enhancement as a Service (QAEaaS) for Universities with Blended Learning Approach. Int. J. Comput. Inf. Technol. 2022, 11, 91–99. [Google Scholar] [CrossRef]
- Massoud, O.S. A Comparative Analysis of Educators’ and Students’ Perceptions on Google Sheet and Document in Academic Settings. Sophia Univ. Jr. Coll. Div. Fac. J. 2024, 69–92. [Google Scholar]
- Nasr, O.A.; Mohiuddin, K.; Mohammed, A. A web-based System Managing Course Files Using Google Platform: An Approach for Improving Academic Quality at a Higher Educational Institution. NeuroQuantology 2022, 20, 9127. [Google Scholar]
- King, M. Examples of University Performance Measures, Envisio Solutions, Published Online in 2023. Available online: https://envisio.com/blog/examples-of-university-performance-measures/ (accessed on 10 February 2025).
- Mati, Y. Input resources indicators in use for accreditation purpose of higher education institutions. Perform. Meas. Metrics 2018, 19, 176–185. [Google Scholar] [CrossRef]
- Elhoseny, M.; Metawa, N.; Hassanien, A.E. An automated information system to ensure quality in higher education institutions. In Proceedings of the 2016 12th International Computer Engineering Conference (ICENCO), Cairo, Egypt, 28–29 December 2016; pp. 196–201. [Google Scholar] [CrossRef]
- Sada, J. Google Sheets for Academic KPI Tracking: A Comprehensive Guide. J. Educ. Technol. 2024, 12, 45–60. [Google Scholar]
- Estuary, E. Innovations in Data Management: A 2023 Perspective. Int. J. Data Sci. 2023, 8, 101–115. [Google Scholar]
- Data Security Tool. Security Features of Educational Data Management Tools. 2023. Available online: https://example.com/data-security-tool (accessed on 10 February 2025).
- Moodle. Moodle API Documentation. 2023. Available online: https://moodle.org (accessed on 10 February 2025).
- SAP. SAP ERP Integration for Universities. 2023. Available online: https://www.sap.com/mena/industries/higher-education-research.html (accessed on 10 February 2025).
- Workday. Workday ERP for Educational Institutions. 2023. Available online: https://www.workday.com/en-us/solutions/industries/education.html (accessed on 10 February 2025).


| Name | write your full name here |
| Current Academic Rank | write your current rank |
| Scopus profile | past Scopus profile link |
| Google Scholar profile | past Google Scholar profile link |
| ORCID | past ORCID link |
| Serial No. | year | Month | No. department authors | No. university authors | No. authors other university | Article details | DOI | Journal Rank | Funded by | Aligned with Univ. Identity | Collaborated university |
| Serial No. | Activity year | Activity Month | Activity title | Most suitable category | Overall Rating in 5-point scale (you received as a trainer from participants or your satisfaction score as participant/organizer) | Organized committee/ Deanship/University/Other non-academic body (write name of them) |
| Serial No. | Contract starting year | Contract starting Month | No. department researcher | No. university researcher | No. researcher outside university | Your Role | Funding track/any details | Funding agency | Current status: |
| Serial No. | Year | Month | Presenter rank | Seminar title/topic | Your role |
| Serial No. | Enrolled year | Enrolled Semester | Completion year | Completion Semester | Supervising role | Student name | Thesis details | Publication details | Funding |
| Serial No. | Year | Month | Conference details | Your role | Support received (give a detailed note) |
| Serial No. | Academic year | Semester | Name of student(s) | Project title | Project type | Software and Technical skill learned/implemented | Remark or any other information |
| Serial No. | Citation year | Google Scholar citation | Scopus |
| Serial No. | Review year | Review Month | Category | Write possible shareable information (like article title, journal name, etc.) | In case of thesis | Mention the name of external department/ college/university |
| Serial No. | Rewards/Patents year | Month | Details about Reward/Patents | Name of Organization/ University with country | Category/Field of rewards/Patents |
| Serial No. | Students Name | Students Id | Gender | Entering year in program | Current Credit earned (please update in each semester) | Current status | Status Month | Status Year |
| A | B | C | D | E | F | J | H | I | J | K | L | M | |
|---|---|---|---|---|---|---|---|---|---|---|---|---|---|
| Faculty Name | Gender | Serial No. | Published Year | Published Month | No. Dept Author | No. Univ Author | No. External Authors | Article Details | DOI | Journal Rank | Funded by | Aligned with Univ Identity | |
| 1 | Faculty_1 | Male | 1 | 2023 | February | 1 | 0 | 1 | IF_1, OF_1, first article of faculty_1, journal name, volume, page no | DOI-IF_1 | Q1 | Scientific council | Energy |
| 2 | Faculty_1 | Male | 2 | 2024 | January | 2 | 0 | 0 | IF_1, IF_3, A joint article of faculty 1 and faculty 3, journal name, volume, page no | DOI-IF_1-IF_3 | Q2 | None | None |
| 3 | Faculty_1 | Male | 3 | 2024 | March | 2 | 0 | 1 | IF_7, IF_1, OF_2, A joint article of faculty_1, journal name, volume, page no | DOI-IF_7-IF_1 | Q1 | Scientific council | Energy |
| 4 | Faculty_1 | Male | 4 | 2024 | October | 1 | 0 | 0 | IF_1, first article of faculty_1, journal name, volume, page no | DOI-IF_1-2 | Q1 | Scientific council | Energy |
| 5 | Faculty_1 | Male | 5 | 2024 | November | 1 | 1 | 1 | IF_1, UF_1, OF_3, A joint article of faculty_1, journal name, volume, page no | DOI-IF_1-3 | Conf-Procd- SCI/Scopus | None | None |
| 6 | Faculty_2 | Male | 1 | 2023 | April | 1 | 0 | 0 | IF_2, first article of faculty_2, journal name, volume, page no | DOI-IF_2 | Q2 | Ministry | Health |
| 7 | Faculty_2 | Male | 2 | 2024 | February | 1 | 0 | 0 | IF_2, second article of faculty_2, journal name, volume, page no | DOI-IF_2-2 | Q3 | None | None |
| 8 | Faculty_2 | Male | 3 | 2024 | October | 1 | 0 | 0 | IF_2, third article of faculty_2, journal name, volume, page no | DOI-IF_2-3 | Q1 | Ministry | None |
| 9 | Faculty_2 | Male | 4 | 2025 | January | 1 | 0 | 0 | IF_2, fourth article of faculty_2, journal name, volume, page no | DOI-IF_2-4 | Q1 | Ministry | Health |
| 10 | Faculty_3 | Male | 1 | 2024 | April | 1 | 1 | 0 | IF_3, first article of faculty_3, journal name, volume, page no | DOI-IF_3 | Q2 | Scientific council | Health |
| 11 | Faculty_3 | Male | 2 | 2024 | January | 2 | 0 | 0 | IF_1, IF_3, A joint article of faculty 1 and faculty 3, journal name, volume, page no | DOI-IF_1-IF_3 | Q2 | None | None |
| 12 | Faculty_3 | Male | 3 | 2024 | October | 2 | 0 | 0 | IF_3, IF_9, OF_2, A joint article of faculty_3 and faculty_9, journal name, volume, page no | DOI-IF_3-IF_9 | Q1 | None | None |
| 13 | Faculty_3 | Male | 4 | 2024 | October | 1 | 0 | 1 | IF_3, OF_3, an article of faculty_3 with outside university faculty, journal name, volume, page no | DOI-IF_3-2 | Q1 | Scientific council | Health |
| 14 | Faculty_4 | Male | 1 | 2025 | January | 1 | 0 | 0 | IF_4, first article of faculty_4, journal name, volume, page no | DOI-IF_4 | Q4 | None | None |
| 15 | Faculty_5 | Male | 1 | 2023 | February | 1 | 0 | 0 | IF_5, first article of faculty_5, journal name, volume, page no | DOI-IF_5 | Q1 | Scientific council | Energy |
| 16 | Faculty_5 | Male | 2 | 2024 | January | 1 | 0 | 0 | IF_5, second article of faculty_5, journal name, volume, page no | DOI-IF_5_2 | Q2 | None | None |
| 17 | Faculty_5 | Male | 3 | 2024 | March | 2 | 0 | 0 | IF_5, third article of faculty_5, journal name, volume, page no | DOI-IF_5_3 | Q1 | Scientific council | Energy |
| 18 | Faculty_5 | Male | 4 | 2024 | October | 1 | 0 | 0 | IF_5, fourth article of faculty_5, journal name, volume, page no | DOI-IF_5_4 | Q1 | Scientific council | Energy |
| 19 | Faculty_6 | Male | 1 | 2024 | January | 2 | 0 | 0 | IF_6 and IF_10 a joint article by faculty_6 and faculty_10, journal name, volume, page no | DOI-IF_6 | Q1 | Scientific council | Health |
| 20 | Faculty_6 | Male | 2 | 2024 | July | 1 | 1 | 0 | IF_5 and UF, an article of faculty_6 jointly with other department faculty, journal name, volume, page no | DOI-IF_6_2 | Q3 | None | None |
| 21 | Faculty_7 | Male | 1 | 2024 | March | 2 | 0 | 1 | IF_7, IF_1, OF_2, A joint article of faculty_1, journal name, volume, page no | DOI-IF_7-IF_1 | Q1 | Scientific council | Energy |
| 22 | Faculty_8 | Female | 1 | 2024 | July | 1 | 0 | 0 | IF_8, an article by faculty_8, journal name, volume, page no | DOI-IF_8 | Q3 | Scientific council | Health |
| 23 | Faculty_9 | Female | 1 | 2024 | October | 2 | 0 | 0 | IF_3, IF_9, OF_2, A joint article of faculty_3 and faculty_9, journal name, volume, page no | DOI-IF_3-IF_9 | Q2 | None | None |
| 24 | Faculty_9 | Female | 2 | 2025 | January | 1 | 0 | 0 | IF_10 and IF_9, a joint article by faculty_10 and faculty_9, journal name, volume, page no | DOI-IF_10_3 | Q1 | Scientific council | Energy |
| 25 | Faculty_10 | Female | 1 | 2024 | January | 2 | 0 | 0 | IF_6 and IF_10, a joint article by faculty_6 and faculty_10, journal name, volume, page no | DOI-IF_6 | Q1 | Scientific council | Health |
| 26 | Faculty_10 | Female | 2 | 2024 | May | 1 | 0 | 1 | OF and IF_10, an article by faculty_10 with outside faculty, journal name, volume, page no | DOI-IF_10_1 | Q2 | None | None |
| 27 | Faculty_10 | Female | 3 | 2024 | December | 1 | 0 | 0 | IF_10, first article by faculty_10, journal name, volume, page no | DOI-IF_10_2 | Q1 | Scientific council | Energy |
Disclaimer/Publisher’s Note: The statements, opinions and data contained in all publications are solely those of the individual author(s) and contributor(s) and not of MDPI and/or the editor(s). MDPI and/or the editor(s) disclaim responsibility for any injury to people or property resulting from any ideas, methods, instructions or products referred to in the content. |
© 2025 by the author. Licensee MDPI, Basel, Switzerland. This article is an open access article distributed under the terms and conditions of the Creative Commons Attribution (CC BY) license (https://creativecommons.org/licenses/by/4.0/).
Share and Cite
Mondal, S.R. Automating KPI Measurement: A Sustainable Solution for Educational Accreditation. Sustainability 2025, 17, 1968. https://doi.org/10.3390/su17051968
Mondal SR. Automating KPI Measurement: A Sustainable Solution for Educational Accreditation. Sustainability. 2025; 17(5):1968. https://doi.org/10.3390/su17051968
Chicago/Turabian StyleMondal, Saiful R. 2025. "Automating KPI Measurement: A Sustainable Solution for Educational Accreditation" Sustainability 17, no. 5: 1968. https://doi.org/10.3390/su17051968
APA StyleMondal, S. R. (2025). Automating KPI Measurement: A Sustainable Solution for Educational Accreditation. Sustainability, 17(5), 1968. https://doi.org/10.3390/su17051968