Abstract
The coordinated relationship of new-type urbanization (NU) and the eco-environment (EE) is of great significance for high-quality and healthy development. A multi-dimensional index system of NU and EE was established to measure and compare the coordinated level of 30 Chinese provinces from 2009 to 2020 by the entropy method, coupling coordination degree model, and Markov chain. Furthermore, the regional differences in and distribution dynamic evolution of the coordination level of the four east, west, central, and northeast regions in China were analyzed using the Dagum Gini coefficient and the kernel density estimation method. The results showed that China’s NU and EE was in the low coordination state, and the distribution was uneven. In addition, the coordinated evolution was continuous. The study also revealed that intra-regional differences in coordination level were small and stable in China, and the overall difference in NU and EE coordination was mainly ascribed to inter-regional difference. The national coordination level rose, and the polarization phenomenon gradually disappeared. In the process of NU, the environmental capacity in China should be considered to promote the coordinated development of regions and fully reflect the sustainable development requirements of NU.
1. Introduction
Urbanization and eco-environment (EE) closely interact and have mutual influence. Urbanization requires energy and resource consumption, causing certain damage to the EE. If the process of urbanization exceeds the carrying capacity of the EE, it could lead to the deterioration of EE, thereby restricting the urbanization. Sustainable urbanization requires a good EE to provide support. The coordinated relationship of urbanization and the eco-environment (EE) is of vital significance for sustainable and healthy development. There are few studies on the regional differences and dynamic evolution of the coordination of Chinese new-type urbanization (NU) and the EE composite system in different provinces and different regions. Since the late 1970s, China’s urbanization level has rapidly improved. The rapid development of urbanization consumes huge energy and resources, also damaging the EE. The deterioration of the EE has also affected urbanization quality. New-type urbanization (NU) is a new plan put forward by China in response to economic transformation and development. The “National New-type Urbanization Plan” points out that NU puts more emphasis on the development layout within the resources and environment’s carrying capacity. There is a complex relationship of mutual restriction and interaction in the NU and eco-environment (EE) system. The EE itself contains the coordination and sustainability required by the NU. The healthy development of NU could hardly do without the effective support of the EE.
In the process of China’s NU, the compatibility of the NU and EE composite system requires attention. In addition, the dynamic evolution of the coordination between China’s NU and EE system should be revealed to provide a basis for the sustainable development of NU. Meanwhile, due to different development levels in different provinces and regions of China, the situations of NU and EE are different. It is necessary to select an appropriate evaluation index system and evaluation method to measure the coordination level of NU and EE systems in China, so as to more comprehensively understand the development status and regional differences in the coordinated level of NU and EE systems in China.
At present, more and more scholars are paying attention to the relationship between urbanization and environmental pollution, energy consumption, environment [1,2,3,4], etc. With the development of urbanization, urban sustainability is gradually being more highly valued. The composite systems of society, resources, the economy, and the environment were chosen to investigate urban sustainability [5,6]. As for the relationship between urbanization and environmental pollution, certain pollutants types, such as carbon emissions, haze, and air pollution were studied [7,8,9]. The coordination level of society, economy, resources, the environment, and urbanization were investigated at some province or city area level [10,11,12,13,14,15]. With the high level of energy and resources consumption and emissions in the process of urbanization, NU with sustainable development is proposed, which places more emphasis on compatibility with the environment. The indicator system of urbanization is no longer limited to the use of population urbanization or land urbanization to characterize the level of urbanization, but also includes economic and social indicators [9,14]. The effect of NU on energy intensity, energy efficiency, carbon emissions, haze, and the eco-environment were widely researched [16,17,18,19,20].
Furthermore, the influence mechanism and coupling coordination of NU and the eco-environment were studied in 31 provinces of China, including western China–Guanzhong, and the Yangtze River Delta, respectively [20,21,22]. However, the systematicity and complexity of urbanization and EE were ignored in the analysis of the influence of urbanization on energy consumption, environmental pollution, and the ecological environment. The system of EE includes not only energy consumption, environmental pollution, and the ecological environment. The NU and EE system constitutes an interactive and nonlinear composite system.
From the existing research, it can be seen that there are few studies on the regional differences in NU and EE composite system coupling coordination in different provinces and different regions in China. Studies about the dynamic evolution of NU and EE composite system coupling coordination from the perspective of time and space are relatively scarce. Based on this, a comprehensive evaluation index system of the NU and EE composite system was constructed in this paper. The interconnection of the NU and EE composite system was studied by the coupling coordination degree model. Moreover, the transfer situation of the NU and EE system coordination level was investigated using the Markov chain. The Dagum Gini coefficient was chosen to explore the situations of regional differences and the source differences in the coordinated development of the NU and EE composite system in China. Furthermore, kernel density estimation was applied to investigate the distribution dynamic evolution of the coordinated development of the NU and EE system.
This paper studied the coordinated level and evolution of the NU and EE composite system in different provinces and four different regions in China from 2009 to 2020. Firstly, the comprehensive evaluation index system of the NU and EE composite system was built, and the determination of the indicators weights in the comprehensive evaluation index system by the entropy method. Secondly, the coordinated status of the NU and EE composite system was investigated by the coupling coordination degree model which was used to measure the interaction between two or more systems, in which the coordination level and the interaction strength of NU and EE system was characterized by the coordination degree and the coupling degree, respectively. Furthermore, Markov chain was used to describe the transition probability of coordinated states. The regional relative differences and the differences sources of the NU and EE system coordination degree were studied by the Dagum Gini coefficient. The kernel density estimation method was further used to measure the evolution of the absolute difference in the NU and EE system coordination degree. Later, the above methods were empirically analyzed in China, to provide some references for sustainable development.
2. Materials and Methods
2.1. Evaluation Index System of the NU and EE System
(1) Index System
The evaluation index system of the NU and EE composite system is shown in Table 1. The selection of evaluation indicators for the NU subsystem and the EE subsystem followed the principles of scientific data and availability, and considered the results of references [5,11,14,23,24].

Table 1.
Evaluation index system of NU-EE.
The indexes of NU subsystem consisted of the aspects of economy, population, industry, society, and space urbanization, with 20 indicators in total. The indexes of the EE subsystem were composed of two aspects, energy resources and environmental quality, including 12 indicators.
(2) The entropy method was applied to determine the weight of indicators in the evaluation system. The composite system was composed of two subsystems, s = {S1, S2}, in which S1 represents the NU subsystem and S2 represents the EE subsystem. The steps were as follows [6,25]:
① Standardization, was the normalized index value, was the value of the ith index of j province (i = 1, 2 …, m; j = 1, 2, …, n)
② Proportion of j province in index i:
③ Entropy value of index i:
> 0 and ≥ 0;
④ Difference coefficient of index i:
⑤ Weight of indicators:
⑥ Comprehensive development index of z subsystem:
(3) Data source. The data of 30 provinces (due to lack of data, excluding Tibet, Hong Kong, Macao, and Taiwan in China) in China from 2009 to 2020 were from the China Urban Statistical Yearbook, China Statistical Yearbook, Provincial Statistical Yearbooks, China Energy Statistical Yearbook, China Environmental Statistical Yearbook, etc. For a small number of data that could not be obtained, the missing values were filled in by the average interpolation method.
2.2. Evaluation on Coordinated Development of the NU and EE System
To evaluate the composite system coordinated development, the coupling coordination degree model was used. And the coupling coordination degree model includes the coupling degree and the coordination degree. The coupling degree, C, was used to measure the interaction between two or more systems. The calculation formula was [6]:
The coordination degree, D, was used to assess the coordination degree of the composite system.
T was the comprehensive development level of the composite system. α and β were the weight of the subsystem’s importance to the coordination of the composite system. The NU subsystem and the EE subsystem were equally important, so α = β = 1/2.
The values of C and D were both between [0–1]. The closer the values of C and D to 1, the higher the C and D are, and the higher C means the closer the connection between the two subsystems. The higher the D means the more coordinated the composite system would be. Referring to Wang and An et al. [12,26], the classification standards of C and D are presented in Table 2.
Table 2.
Classification standard of coupling degree and coordination degree.
2.3. Markov Chain
Markov chain was applied to measure the transfer probability of composite system coordination degree [27,28]:
was used to describe the transferring probability of i coordination level to j level the next year; was the sum of the number of i level provinces transferred to j level the next year; was the i coordination level provinces.
2.4. Dagum Gini Coefficient
The Dagum Gini coefficient [28,29,30] was applied to describe the regional relative differences and the differences sources of the composite system coordination degree.
Overall Gini coefficient:
In the Formula (11), k was the regions amount, n was the provinces amount, was the coordination degree of the NU and EE system of the i(r) province in the j(h) region, was the number of provinces in j(h) region, and was the average coordination degree of the NU and EE system in all provinces.
In Formulas (12) and (13), was the Gini coefficient of j region, was the Gini coefficient between jh regions, was the average value of the regional coordination degree of j(h) region.
Defined variable:; ;
was the relative impact of inter-regional coordination between j and h regions; was the cumulative density distribution function of j(h) region; was the difference in coordination between regions, i.e., the mathematical expectation for the sum of all ; was the first-order moment of hypervariable, all samples with in .
The Gini coefficient was decomposed into intra-regional gap , inter-regional gap , and hypervariable density (representing the impact of regional sample overlap on regional disparity),
2.5. Kernel Density Estimation
As a nonparametric estimation method, the kernel density estimation method used continuous density curves to describe the distribution of random variables [28,29].
Let f(x) be the density function of the coordination degree x of the NU and EE system:
N was the number of observations, was independent, identically distributed observations; x was the mean of x-observations, K was kernel density function, h was bandwidth, and the smaller h, the higher the estimation accuracy.
The Gaussian kernel density function was:
3. Results
3.1. Analysis on Coordinated Development Level of NU and EE System
3.1.1. Comprehensive Development Level Index
(1) Comprehensive Development Index of NU
The comprehensive evaluation index of NU was used to describe Chinese NU development status. The comprehensive development index of Chinese NU subsystem from 2009 to 2020 is displayed in Table 3.
Table 3.
Comprehensive development index of NU.
As shown in Table 3, the average value of the comprehensive development index of NU subsystem was 0.297–0.331, indicating that the average level of NU in China was not high. The composite index of NU rose slightly, from 0.297 in 2009 to 0.331 in 2020, an increase of 11.66%. Next, the region and province differences in NU comprehensive development index were studied. Based on the National Bureau of Statistics of China, Chinese provinces are divided into four regions: eastern, central, western, and northeastern.
The arithmetic mean value (A1) of comprehensive development index of NU subsystem was 0.317 and standard deviation (SD1) was 0.130. A1 + 0.5SD1 = 0.382, A1 − 0.5SD1 = 0.252. The development level of NU was divided into high urbanization (>0.382), medium to high urbanization (0.317–0.382), medium urbanization (0.252–0.317), and low urbanization (<0.252) [31].
The regional distribution of NU development level was shown in Table 4. There were seven highly urbanized provinces, all in the eastern region of China. There are two provinces with medium to high urbanization. There were 10 provinces with medium urbanization, mainly in the central and western regions. There were 11 other provinces with low urbanization, 7 in the west, 2 in the northeast, 1 in the east, and 1 in the central region.
Table 4.
Regional distribution of Chinese NU development level.
(2) Comprehensive Development Index of EE Subsystem
The comprehensive evaluation index of EE was used to describe the EE development status in China. The comprehensive development index of China’s provincial EE subsystem from 2009 to 2020, is displayed in Table 5.
Table 5.
Comprehensive development index of EE subsystem.
According to Table 5, the average comprehensive development index of Chinese national EE was 0.420, which indicated that the situation of EE was good. It was relatively stable from 2009 to 2020.
The arithmetic mean A2 of average value of EE comprehensive development index was 0.420, and the standard deviation SD2 was 0.073, with a small difference. A2 + 0.5SD2 = 0.457, A2 − 0.5SD2 = 0.384. The development level of EE was divided into high level for those values above 0.457, medium–high level for those between 0.420 and 0.457, medium level for those between 0.384 and 0.420, and low level for those below 0.384.
Table 6 shows the Chinese regional distribution of EE levels. It could be concluded from Table 6 that there were seven provinces with high levels of EE: six in the east and one in the west. There were 11 provinces with medium–high levels: three in the east, one in the northeast, four in the central, and three in the west. The remaining 11 provinces were at a low level: one province in the east region of China and one in the northeast region, two in the central region and seven in the west region. The results indicate that the development levels of regional distribution in the NU subsystem and EE subsystem are unequal in China. It is worth exploring the coordination of the Chinese NU and EE system and its dynamic development.
Table 6.
Regional distribution of EE level.
3.1.2. Coupling and Coordination Degree of NU and EE System
(1) Coupling Analysis
The interaction between NU and EE was evaluated by the coupling degree. The coupling development of the NU and EE composite system in 30 provinces in China from 2009 to 2020 is displayed in Table 7.
Table 7.
Coupling degree of NU and EE system.
From 2009 to 2020, the coupling degree of Chinese NU and EE composite system gradually increased, at a high level of coupling. This meant that the interaction between elements in the Chinese NU and EE composite system was strong. The coupling degrees of the four regions of China, eastern, central, western and northeastern, were calculated from the average coupling degree of the corresponding provinces in each region. The coupling degree of NU and EE composite system in the four major regions is shown in Figure 1.
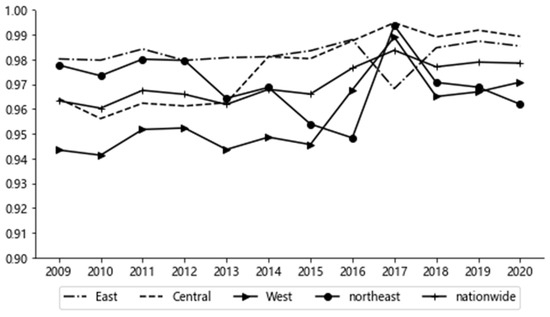
Figure 1.
Coupling degree of NU and EE system by region.
It can be seen from Figure 1 and Table 7 that the coupling degree of the NU and EE composite system in eastern, central, western, northeastern, and the whole country of China varied within the range of 0.94–1, at a high level of coupling. The coupling level of the whole country of China, the northeast, central, and western regions reached the highest value in 2017, while that of eastern region was the lowest in 2017. The coupling degree of the whole country of China and the eastern, central, and western regions of China showed an upward trend, while the coupling degree in the northeast region decreased slightly, by 1.6%.
(2) Coordination Analysis
The coordinated relationship of NU and EE was analyzed using the coordination degree. The coordination degree of the NU and EE composite system in China from 2009 to 2020 is displayed in Table 8.
Table 8.
Coordination degree of NU and EE composite system.
It can be seen from Table 8 that the average coordination degree of the NU and EE composite system was 0.594, in the low-coordination state. It indicates that although the elements of the composite system interacted strongly, the harmony between the NU subsystem and EE subsystem in China was low.
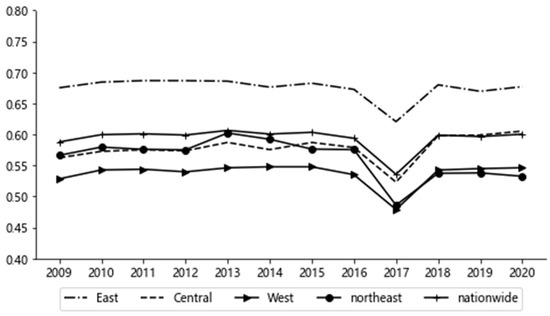
Figure 2.
The coordination degree of NU and EE system by region.
Table 9.
Regional distribution of NU and EE system coordination.
Figure 2 shows that the coordination degrees of the whole country of China and the east, northeast, central, and western regions were lowest in 2017; the decrease was not very significant. That might be due to the influences of environmental factors; the coordination level in a certain year may not be effective, and due to the mutual influence between regions, caused the coordination level to decrease. Subsequently, after adjustments in urbanization and environment policies, the coordination level rebounded. The whole country of China was between low and moderate coordination (0.594); the eastern region was in moderate coordination (0.675), and the central region was in low coordination (0.578) and reached moderate coordination (0.605) in 2020, The northeast was in low coordination (0.561), and the west was in low coordination (0.537).
As shown in Table 9, there were five provinces with high coordination, all in the eastern region of China. There were four provinces with moderate coordination, three in the east and one in the west. A total of 19 provinces were in low coordination, including 2 provinces in the east region, 3 in the northeast, 6 in the central region, and 8 in the west. Notably, two provinces, located in the west, were on the verge of imbalance.
From the above analysis of the provincial and regional coupling degree and coordination degree of the Chinese NU and EE composite system, it can be seen that there are significant differences between regions.
3.1.3. Markov Chain
Markov chain was applied to measure the transfer probability of NU and EE system coordination status. According to the coordination degree values, coordination status could be divided into four categories; that is, incoordination, low, moderate, and high coordination. The values of 1, 2, 3, and 4 were used to indicate the four levels: incoordination, low, moderate, and high coordination. Table 10 displayed the state transition probability matrix of China’s provincial NU and EE composite system coordination degree from 2009 to 2020. The probability that the coordination state remained unchanged was represented by diagonal numerical values of transition probability matrix. The probability of coordinated state transition was reflected by non-diagonal values. N represents the number of provinces in corresponding coordination states, and each province was counted as one each year.
Table 10.
Transition probability of system coordination degree.
It can be seen from Table 10 that there were non-zero numbers on non-diagonal lines, which were located on both sides of the diagonal line. This situation indicated that the coordinated development and evolution of NU and EE system was continuous. And the coordination level would transfer to a lower or higher level in the adjacent years, and it was unlikely that there would be cross level transformation. The maximum value on the diagonal line was 0.8246, and the minimum value was 0.6061, indicating that the minimum probability that the coordination state of composite system remained unchanged was 60.61%. The probability that the provinces (five provinces in eastern region) with high coordination would still maintain at a high level was 82.46%, while the probability of transferring to a moderate level was 15.9%. The provinces in moderate coordination (three in the eastern and one in western region) had a 64.29% probability of maintaining moderate coordination, and 12.86% and 22.86% probabilities of moving to high and low levels, respectively. The provinces with low coordination (two in the east, three in the northeast, six in the central region, and nine in the west) had an 80% probability of maintaining low coordination, and 12.86% and 22.86% probabilities of transferring to the moderate and incoordination levels, respectively. The possibility of Gansu province maintaining incoordination was 60.61%, and the possibility of transition to low coordination was 39.39%.
3.2. Regional Differences and Distribution Dynamic Evolution of NU and EE System Coordination
3.2.1. Regional Differences and Differences Sources
Regional differences and differences sources were described by the Dagum Gini coefficient. The Dagum Gini coefficient of China’s NU and EE system coordination from 2009 to 2020 is displayed in Figure 3, Figure 4 and Figure 5.
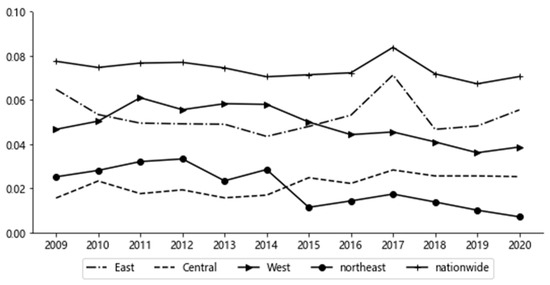
Figure 3.
Overall and regional differences in NU and EE system coordination.
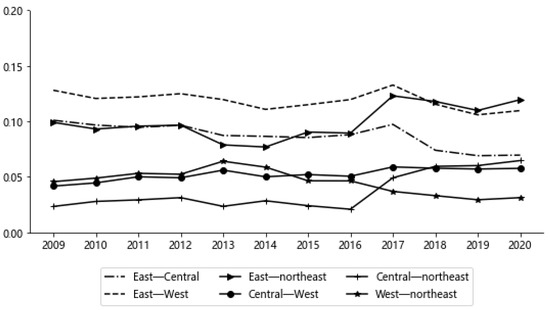
Figure 4.
Regional differences in NU and EE system coordination.
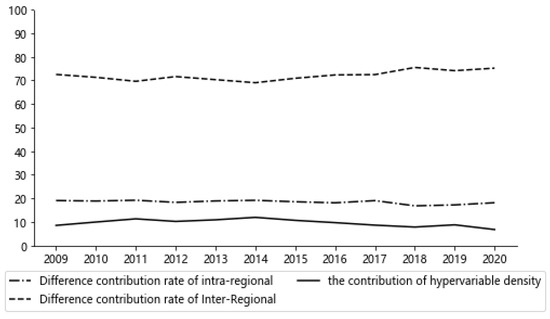
Figure 5.
Sources of overall differences in NU-EE system coordination.
(1) Intra-regional differences in China’s NU and EE system coordination. From Figure 3, it can be seen that China’s NU and EE system coordination had a small intra-regional difference, with an average Gini coefficient of 0.0740, which was relatively stable, and only slightly increased to 0.0838 in 2017. The average values of the Gini coefficient of different regions in China were eastern region > western region > central region > northeast region. The gap in intra-regional differences in China’s NU and EE system coordination in northeast region narrowed fastest. The intra-regional difference in the western region of China’s NU and EE system coordination gradually narrowed. The intra-regional difference in China’s NU and EE system coordination in the central region gradually increased.
(2) Inter-regional differences.Figure 4 displays inter-regional differences in NU and EE system coordination. The inter-regional differences were small. The average Gini coefficient was 0.0368–0.1186. And the average Gini coefficient value east–west > east–northeast > east–central > central–west > west–northeast > central–northeast.
The differences between east–west, east–northeast, and east–central regions were relatively large. The regional differences between east–central and east–west displayed downward fluctuation. The Gini coefficient between east–northeast regions presented upward fluctuation, and regional difference increased by 20.61%. Relatively small differences among Chinese regions were observed between the central–northeast, west–northeast, and central–west regions. However, the difference in central–west regions and central–northeast regions slightly increased. The difference in west–northeast regions had decreased by 31.58%.
(3) Source of the difference. Figure 5 showed the source of overall difference in Chinese NU and EE system coordination. The average contribution rate of inter-regional difference, intra-regional difference, and hypervariable density to the overall coordination difference was 72.04%, 18.4%, and 9.56%, respectively. Therefore, it could be concluded that inter-regional difference was the main reason for the overall difference in system coordination. The contribution rate of the inter-regional difference was 68.99–75.46%. The variation range of the contribution rate of intra-regional differences was 16.77–19.15%, and the contribution rate of hypervariable density was 6.72–11.89%. To solve the overall difference in Chinese NU and EE system coordination, it was necessary to narrow the differences among the eastern, western, central and northeastern regions of China.
3.2.2. Kernel Estimation Results
The kernel density estimation method was used to further study the evolution of the absolute difference in coordinated development between regions and to show the evolution process of the distribution dynamics of coordinated development levels in China. Figure 6 reveals the evolution of the coordinated development and distribution of the NU and EE system in the whole nation of China and its four major regions, namely east, west, central, and northeast, from 2009 to 2020.

Figure 6.
Coordinated distribution dynamics of NU and EE systems in China.
As shown in Figure 6a, the main peak of the distribution curve gradually moved to the right, which indicated that the NU and EE system-coordinated level of China nationwide was gradually improving. Furthermore, the height of main peak decreased and width increased. There were two main peaks with polarization; while late, there was only one main peak, and polarization gradually disappeared. As in Figure 6b, the peak of the kernel density curve in the eastern region is shown as “right–left–right”, and the coordinated level in the eastern region improved. The height of the main peak displayed “rising–falling–rising”. Later, the polarization disappeared, indicating that the coordinated level in the eastern region rose and the absolute difference reduced. As in Figure 6c, the peak of the density curve in the western region appeared as “right–left–right”. The height of the peak first decreased and then rose, and the width first broadened and then narrowed. Furthermore, there was no polarization, indicating that the coordinated level was gradually rising, and internal differences were gradually narrowing. As displayed in Figure 6d, the height of the main peak in the central region appeared as “decreasing–increasing–decreasing”, and the distribution curve shown as “right–left–right”. In addition, the width became wider, and the polarization gradually appeared, indicating that the coordinated level of the composite system in the central region gradually improved, and the absolute difference increased. According to Figure 6e, the height of the main peak in northeast China appeared as “rise–drop–rise–drop–rise–rise”, and the curve position fluctuated “right–left”, indicating that the system-coordinated level decreased. And polarization gradually disappeared and the width narrowed, meaning that the absolute difference in northeast China narrowed.
4. Discussion and Conclusions
Urbanization and EE have an interdependent and mutually influential relationship. The coordinated development between urbanization and EE has been attracting scholars’ interest [4,14,15,16]. The NU pays more attention to coordinated development and EE to achieve more sustainable urbanization development. Though the coordination of NU and EE were studied [21,22,23], due to the different development levels in different parts of China, the situation of NU and EE is different, and it is essential to measure and compare the coordination degree of NU and EE in different regions. There are few studies on the provincial and regional differences and the evolution of the coordination development of the Chinese NU and EE composite system in different provinces and different regions. This paper measured and analyzed the regional differences in the coordinated level of NU and EE systems in China.
The average level of the Chinese NU was not high. The development level of the Chinese national EE subsystem was good. Furthermore, the development levels of regional distribution in the NU subsystem and EE subsystem were unequal in China. So, it is necessary to explore China’s NU and EE system coordination and dynamic development. The coupling degree of the Chinese NU and EE composite system gradually increased, at a high level of coupling. This meant that the interaction between elements in the Chinese NU and EE composite system was strong. Although the elements of the composite system interacted strongly, the harmony between the NU subsystem and the EE subsystem of China was low. Moreover, there were obvious differences between regions in the coupling degree and coordination degree of the Chinese NU and EE composite system. And the coordinated evolution of the NU and EE system was continuous. NU and EE are interdependent, there is systematicity and complexity between NU and EE. In the process of NU, the capacity of resources and the environment should be considered to achieve the sustainable development. The overall difference in NU and EE coordination was mainly ascribed to the inter-regional difference. The differences between eastern–western, eastern–northeastern and eastern–central regions were relatively large. To solve the overall difference in Chinese NU and EE system coordination, it was necessary to narrow the differences among the eastern, western, central, and northeastern regions of China.
This paper explored the coordination development level and relationship of NU and EE of 30 provinces in China from 2009 to 2020. The paper took the provinces as the research scale, there might also be differences between cities within each province, and it was not possible to consider all factors of NU and EE due to factors such as data availability. Therefore, in the future, the research scale might expand to cities, and more relevant studies, expert opinions, and field investigations would be used to obtain more rigorous and objective research.
An evaluation index system for China’s NU and EE system coordination level was constructed in this paper. Furthermore, the coordinated levels of 30 provinces in China (excluding Tibet, Hong Kong, Macao, and Taiwan) from 2009 to 2020 were measured by the entropy method, with a coupling coordination degree model. In addition, Markov chain was used to describe the transition probability of coordinated states. The regional relative differences and the sources of differences in the NU and EE system coordination degree were studied by Dagum Gini coefficients. The kernel density estimation method was further used to measure the evolution of the absolute difference in the NU and EE system coordination degree.
(1) The regional development levels of the NU subsystem and the EE subsystem are unequal in China. The average comprehensive development index of China’s NU subsystem is not high. There are seven highly urbanized provinces, which are all located in the east. Two provinces with medium to high urbanization were in the east and northeast. Ten medium-urbanization provinces were mainly distributed in the central and western regions. A total of 11 other provinces were low-urbanization: 7 in the west, 2 in the northeast, 1 in the east, and 1 in the central region. The comprehensive development index of the Chinese EE subsystem was good. There were six provinces with high-level EE in the east and one in the west. There were three eastern, one northeastern, four central, and three western provinces with medium to high levels. One province with a medium level was located in the northeast, alongside eleven provinces with a low level.
(2) The interaction of the NU and EE systems in China was strong, with a high-level coupling state. However, the NU and EE composite system was in low coordination, the harmony was low, and the overall coordinated level was rising. There were 5 eastern provinces in high-level coordination: 4, 19, and 2 provinces were in moderate, low, and incoordination levels, respectively. The eastern region had always been in moderate coordination, the central region reached moderate coordination in 2020, and the northeast and western regions were in low coordination.
(3) The coordinated development evolution of the NU and EE system was continuous, and the minimum probability of keeping the coordinated state unchanged was 60.61%. The probability of maintaining high, moderate, low, and incoordination coordination levels were 82.46%, 64.29%, 80%, 60.61%, respectively.
(4) China’s NU and EE composite system coordination had a small intra-regional difference. The inter-regional difference was the main reason for the overall difference in system coordination.
(5) Chinese national NU and EE system coordination was raising, and the polarization gradually disappeared. The peak of kernel density curves in the eastern, western, and central regions indicated that the coordination level improved. The absolute difference between the eastern and western regions narrowed, while the absolute difference in the central region increased. The coordination level in northeast China decreased, and regional absolute difference shrunk.
There were some differences in the Chinese NU and EE system coordination state in four major regions and provinces. The main reason for the unbalanced coordinated development was the regional differences. In the process of NU, it was necessary to consider the carrying capacity of resources and the environment, and the status of energy resources in various regions and provinces, to actively promote the coordinated development among regions, and fully reflect the high-quality development requirements of NU.
Author Contributions
Conceptualization, N.C.; methodology and formal analysis, N.C. and X.C.; original draft writing, N.C., S.L. and X.C.; review—editing and writing, N.C. and S.L. All authors have read and agreed to the published version of the manuscript.
Funding
This work was supported by the ‘Humanities and Social Sciences Research Program, Ministry of Education of People’s Republic of China: The evolution research on the coordinated development of regional industrial structure, economy and ecological environment system (Grant No. 22YJAZH003)’.
Institutional Review Board Statement
Not applicable.
Informed Consent Statement
Not applicable.
Data Availability Statement
Data are contained within the article.
Conflicts of Interest
Shicong Ling was employed by Zhejiang Sanhua Automotive Components Co., Ltd. All authors declare that the research was conducted in the absence of any commercial or financial relationships that could be construed as a potential conflict of interest.
Abbreviations
The following abbreviations are used in this manuscript:
| NU | New-type urbanization |
| EE | Eco-environment |
References
- Li, Y.F.; Li, Y.; Zhou, Y.; Shi, Y.L.; Zhu, X.D. Investigation of a coupling model of coordination between urbanization and the Environment. J. Environ. Manag. 2012, 98, 127–133. [Google Scholar] [CrossRef] [PubMed]
- Fan, W.P.; Wang, H.K.; Liu, Y.; Liu, H.P. Spatio-temporal variation of the coupling relationship between urbanization and air quality: A case study of Shandong Province. J. Clean. Prod. 2020, 272, 122812. [Google Scholar] [CrossRef]
- Lv, Y.L.; Chen, W.; Cheng, J.Q. Direct and Indirect Effects of Urbanization on Energy Intensity in Chinese Cities: A Regional Heterogeneity Analysis. Sustainability 2019, 11, 3167. [Google Scholar] [CrossRef]
- Zheng, H.; Khan, Y.A.; Abbas, S.Z. Exploration on the coordinated development of urbanization and the eco-environmental system in central China. Environ. Res. 2022, 204, 112097. [Google Scholar] [CrossRef]
- Li, W.W.; Yi, P.T. Assessment of city sustainability-Coupling coordinated development among economy, society and environment. J. Clean. Prod. 2020, 256, 120453. [Google Scholar] [CrossRef]
- Wang, J.K.; Han, Q.; Wun, K.X.; Xu, Z.T.; Liu, P. Spatial-temporal patterns and evolution characteristics of the coordinated development of industrial economy, natural resources and environment in China. Resour. Policy 2022, 75, 102463. [Google Scholar] [CrossRef]
- Wu, Y.Q.; Zhou, C.Y.; Lai, X.Y.; Li, Y.; Miao, L.; Yu, H. Spatio-temporal characteristics and decoupling relationship of new-type urbanization and carbon emissions at the county Level: A case study of Zhejiang Province, China. Ecol. Indic. 2024, 160, 111793. [Google Scholar] [CrossRef]
- Li, J.; Li, F.D.; Li, J. Does new-type urbanization help reduce haze pollution damage? Evidence from China’s county-level panel data. Environ. Sci. Pollut. Res. 2022, 29, 47123–47136. [Google Scholar] [CrossRef]
- Zhao, C.; Wang, B. How does new-type urbanization affect air pollution? Empirical evidence based on spatial spillover effect and spatial Durbin model. Environ. Int. 2022, 165, 107304. [Google Scholar] [CrossRef]
- Cui, X.G.; Fang, C.L.; Liu, H.M.; Liu, X.F. Assessing sustainability of urbanization by a coordinated development index for an Urbanization-Resources-Environment complex system: A case study of Jing-Jin-Ji region, China. Ecol. Indic. 2019, 96, 383–391. [Google Scholar] [CrossRef]
- Wang, Y.F.; Geng, Q.J.; Si, X.H.; Kan, L.P. Coupling and coordination analysis of urbanization, economy and environment of Shandong Province, China. Environ. Dev. Sustain. 2021, 23, 10397–10415. [Google Scholar] [CrossRef]
- Wang, J.K.; Han, Q.; Du, Y.H. Coordinated development of the economy, society and environment in urban China: A case study of 285 cities. Environ. Dev. Sustain. 2021, 24, 12917–12935. [Google Scholar] [CrossRef]
- Gong, Z.Q.; Mao, R.J.; Jiang, J.J. Coupling and Coordination Degree between Urbanization and Ecological Environment in Guizhou, China. Discret. Dyn. Nat. Soc. 2021, 2021, 8436938. [Google Scholar] [CrossRef]
- Sun, C.G.; Zhang, S.Y.; Song, C.C.; Xu, J.; Fan, F. Investigation of Dynamic Coupling Coordination between Urbanization and the Eco-Environment—A Case Study in the Pearl River Delta Area. Land 2021, 10, 190. [Google Scholar] [CrossRef]
- Geng, Y.Q.; Zhang, H. Coordination assessment of environment and urbanization:Hunan case. Environ. Monit. Assess. 2020, 192, 637. [Google Scholar] [CrossRef]
- Lin, B.Q.; Zhu, J.P. Impact of China’s new-type urbanization on energy intensity: A city-level analysis. Energy Econ. 2021, 99, 105292. [Google Scholar] [CrossRef]
- Jiang, T.; Feng, T.C.; Bi, S.H. Towards Urban Sustainable Development: The Effect of New Type Urbanization on Energy Utilization Efficiency. Pol. J. Environ. Stud. 2024, 33, 6181–6194. [Google Scholar] [CrossRef]
- Jiang, J.K.; Zhu, S.L.; Wang, W.H.; Li, Y.; Li, N. Coupling coordination between new urbanisation and carbon emissions in China. Sci. Total Environ. 2022, 850, 158076. [Google Scholar] [CrossRef]
- Yu, Y.; Zhao, K.Z.; Du, Y.M. Nexus between New-Type Urbanization, Economic Development, and Haze Pollution in China: A Spatial Analysis. J. Urban Plan. Dev. 2024, 150, 04024043. [Google Scholar] [CrossRef]
- Zhang, Y.; Wei, T.Y.; Tian, W.T.; Zhao, K. Spatiotemporal Differentiation and Driving Mechanism of Coupling Coordination between New-Type Urbanization and Ecological Environment in China. Sustainability 2022, 14, 11780. [Google Scholar] [CrossRef]
- Shang, J.; Dong, L.; Ali, R.; Shen, X.; Rehman, R. The influence mechanism of new-type urbanization on the eco-environment in western china-guanzhong using improved entropy weight method. Int. J. Environ. Sci. Technol. 2022, 7, 1–24. [Google Scholar] [CrossRef]
- Song, Y.C.; Gao, Y.S.; Zhang, S.X.; Dong, H.; Liu, X. Research on the Coupling Coordination and Driving Mechanisms of New-Type Urbanization and the Ecological Environment in China’s Yangtze River Delta. Sustainability 2024, 16, 5308. [Google Scholar] [CrossRef]
- Liu, W.J.; Jiao, F.C.; Ren, L.J.; Xu, X.G.; Wang, J.C.; Wang, X. Coupling coordination relationship between urbanization and atmospheric environment security in Jinan City. J. Clean. Prod. 2018, 204, 1–11. [Google Scholar] [CrossRef]
- Hao, Y.; Weng, J.H. How does energy consumption affect China’s urbanization? New evidence from dynamic threshold panel models. Energy Policy 2019, 127, 24–38. [Google Scholar]
- Chen, J.D.; Li, Z.W.; Dong, Y.Z.; Song, M.; Shahbaz, M.; Xie, Q. Coupling coordination between carbon emissions and the eco-environment in China. J. Clean. Prod. 2020, 276, 123848. [Google Scholar] [CrossRef]
- An, S.; Zhang, S.; Hou, H.; Zhang, Y.; Xu, H.; Liang, J. Coupling Coordination Analysis of the Ecology and Economy in the Yellow River Basin under the Background of High-Quality Development. Land 2022, 11, 1235. [Google Scholar] [CrossRef]
- Lv, C.C.; Bian, B.C.; Lee, C.C.; He, Z. Regional gap and the trend of green finance development in China. Energy Econ. 2021, 102, 105476. [Google Scholar] [CrossRef]
- Wang, K.L.; Xu, R.Y.; Zhang, F.Q.; Miao, Z.; Peng, G. Spatiotemporal heterogeneity and driving factors of PM2.5 reduction efficiency: An empirical analysis of three urban agglomerations in the Yangtze River Economic Belt, China. Ecol. Indic. 2021, 132, 10830. [Google Scholar] [CrossRef]
- Xue, Y.T.; Liu, K. Regional differences, distribution dynamics, and convergence of air quality in urban agglomerations in China. Sustainability 2022, 14, 7330. [Google Scholar] [CrossRef]
- Dagum, C. A new approach to the decomposition of the Gini income inequality ratio. Empir. Econ. 1997, 22, 515–531. [Google Scholar] [CrossRef]
- Wei, M.; Li, S.H. Study on the measurement of Economic High-quality development level in China in the new era. J. Quant. Tech. Econ. 2018, 11, 3–20. [Google Scholar]
Disclaimer/Publisher’s Note: The statements, opinions and data contained in all publications are solely those of the individual author(s) and contributor(s) and not of MDPI and/or the editor(s). MDPI and/or the editor(s) disclaim responsibility for any injury to people or property resulting from any ideas, methods, instructions or products referred to in the content. |
© 2025 by the authors. Licensee MDPI, Basel, Switzerland. This article is an open access article distributed under the terms and conditions of the Creative Commons Attribution (CC BY) license (https://creativecommons.org/licenses/by/4.0/).