Article

Electricity Demand Characteristics in the Energy Transition Pathway Under the Carbon Neutrality Goal for China

1
Zhejiang Carbon Neutral Innovation Institute, Zhejiang University of Technology, Hangzhou 310014, China
2
Zhejiang International Cooperation Base for Science and Technology on Carbon Emission Reduction and Monitoring, Zhejiang University of Technology, Hangzhou 310014, China
3
Energy Research Institute, Chinese Academy of Macroeconomic Research, Beijing 100038, China
4
Institutes of Science and Development, Chinese Academy of Sciences, Beijing 100190, China
5
Department of Environmental Science, Beijing University of Technology, Beijing 100124, China
*
Author to whom correspondence should be addressed.
Sustainability 2025, 17(4), 1759; https://doi.org/10.3390/su17041759
Submission received: 10 January 2025 / Revised: 1 February 2025 / Accepted: 13 February 2025 / Published: 19 February 2025

Abstract

:
The energy transition towards achieving carbon neutrality is marked by the decarbonization of the power system and a high degree of electrification in end-use sectors. The decarbonization of the power system primarily relies on large-scale renewable energy, nuclear power, and fossil fuel-based power with carbon capture technologies. This structure of power supply introduces significant uncertainty in electricity supply. Due to the technological progress in end-use sectors and spatial reallocation of industries in China, the load curve and power supply curve is very different today. However, most studies’ analyses of future electricity systems are based on today’s load curve, which could be misleading when seeking to understand future electricity systems. Therefore, it is essential to thoroughly analyze changes in end-use load curves to better align electricity demand with supply. This paper analyzes the characteristics of electricity demand load under China’s future energy transition and economic transformation pathways using the Integrated Energy and Environment Policy Assessment model of China (IPAC). It examines the electricity and energy usage characteristics of various sectors in six typical regions, provides 24-h load curves for two representative days, and evaluates the effectiveness of demand-side response in selected provinces in 2050. The study reveals that, with the transition of the energy system and the industrial relocation during economic transformation, the load curves in China’s major regions by 2050 will differ notably from those of today, with distinct characteristics emerging across different regions. With the costs of solar photovoltaic (PV) and wind power declining in the future, the resulting electricity price will also differ significantly from today. Daytime electricity prices will be notably lower than those during the evening peak, as the decrease in solar PV and wind power output leads to a significant increase in electricity costs. This pricing structure is expected to drive a strong demand-side response. Demand-side response can significantly improve the alignment between load curves and power supply.

1. Background

Achieving carbon neutrality necessitates a significant transition of the energy system [1], which will also drive economic transformation [2,3,4]. The realization of carbon neutrality, along with the energy and economic transitions, requires support from various technologies. Technological advancements will bring about changes in future energy usage patterns, in which electrification, as one of the key decarbonization measures towards the Paris Agreement temperature targets (2 °C/1.5 °C), will play a crucial role on a global scale. The shift to electrification, which involves replacing non-electric energy sources with electricity at the point of end use, is an increasingly prominent trend in energy markets. According to statistics and analysis from the International Energy Agency [5], electricity demand is increasing, with a more electrified energy system on the horizon. The annual electricity demand growth between 2010 and 2023 was 2.7%, while the overall energy demand growth was 1.4%. In the stated policy scenario, the annual electricity demand growth is expected to be 3.0% between 2023 and 2035, while the energy demand growth is only expected to be 0.5% during the same period. This shift is expected to bring notable changes in electricity consumption modes. After the pledge of the carbon neutrality goal in China, a notable feature of the future energy transition is the marked decline in the proportion of fossil fuels in primary energy generation. The majority of scenario studies indicate that by 2050, non-fossil fuels will account for more than 75% of primary energy [6,7,8,9]. The remaining use of fossil fuels will also need to be matched with carbon capture and utilization or carbon capture and storage technologies. At the same time, from the perspective of final energy consumption, the level of electrification will significantly increase. Many studies suggest that by around 2050, electricity will account for more than 65% of final energy consumption [10,11,12]. Therefore, highly reliable power supply becomes a core element of the energy supply system, and must be well-constructed in the process of energy and economic transformation. Recently, there has been extensive discussion on how to achieve the construction of a highly reliable power system under a high-proportion zero-carbon power structure [13,14,15,16]. However, discussions about the new power system remain largely at the conceptual and theoretical stages.
Compared to developed countries, China has a relatively shorter timeline to achieve carbon peaking and carbon neutrality [17,18,19], while the construction of a new power system will take longer. Thus, it is necessary to promptly define the mode for the new power system and begin planning investments for its development. However, up to now, different studies have presented significantly varied understandings of the future patterns of end-use electricity consumption and power supply technologies [20,21,22]. As a result, there are diverse approaches to constructing a new power system in the future [23,24]. However, one big problem is, due to the technology progress in end-use sectors and spatial reallocation trends of industry sectors in China, the load curve and power supply curve will be very different from today. Most of studies’ analyses of future electricity systems are based on today’s load curve; this could be misleading when seeking to understand the future electricity system [25,26,27]. There are some research studies that focus on demand side response [28,29,30], but they tend to lack technology details suitable for the response. This paper focuses on analyzing the characteristics of electricity usage in future end-use sectors and the power generation landscape by using the IPAC-AIM/technology model, aiming to provide insights into the future power system under an energy transition scenario. The technology details in the IPAC-AIM/technology model, with more than 800 technologies in both energy demand and supply sectors, have advantages when describing the technology portfolios by 2050 in the energy and economic transition. By using modeling analysis, it is also the first study that seeks to present the electricity price in 2050 in a typical region in China. The electricity price could be very different among provinces in 2050 due to the differences between their electricity supply patterns.
The methodology of this study is presented in the second session. The structural changes that will occur in China’s future energy demand and electricity supply under the carbon neutrality goal are discussed in the third part of this study. In the fourth part, it simulates the 24-h load curves for two typical days in six representative provincial regions of China, discussing the electricity and energy usage characteristics of regions with different development features. The fifth part discusses the significant role of supply-side response in balancing supply and demand in China’s future power sector. The main findings of this study will be presented in the sixth part.

2. Methodology

This study is based on modeling analysis using the IPAC model, which was initially developed in 1993 and has been continually developed. The model was used to simulate energy transition pathways [31,32,33]. IPAC is a model family and includes more than 10 models with different modeling methodologies, such as CGE, dynamic economics, and technology least cost optimization, etc. The key model used to simulate China’s energy transition pathways is the IPAC-AIM/technology model, which is a linear program based on the least cost optimization model. It optimizes technologies selection under the constraints of achieving objectives such as carbon reduction [34]. There are 62 sectors covered in the IPAC-AIM/technology model, including all energy supply sectors and energy demand sectors. The model encompasses more than 800 energy utilization and emission reduction technologies. The provincial energy transition pathways given in this paper are also given by this model. The optimization function is given as follows:
T C = i ( l , p ) W j C l , p , i r l , p , i + p 1 C l , p 1 p , i M l , p 1 p , i                                     + g l , p , i 0 + k g k , i 1 - ξ l , i E k , l , p , i 1 S C l , p , i r X l , p , i + m ε i m Q i m + k ε k , i Q k , i min
where
  • T C : Total cost
  • W j : Set of combinations of device and removal process ( l , p ) that can satisfy service type j
  • C l , p , i : Annualized investment cost of a unit of combination of a device l with removal process p in a sector and region i
  • r l , p , i : Recruitment quantity of a device l with removal process p in a sector and region i
  • C l , p 1 p , i : Annualized investment cost of exchanging a unit of combination ( l , p 1 ) in the previous year’s stock to ( l , p ) in the current year’s stock in sector and region i
  • M l , p 1 p , i : Stock of a device l with removal process p 1 in a sector and region i in the previous year that is replaced in the current year by its combination with another removal process p
  • g l , p , i 0 : Operating cost (non-energy cost) per unit operation of combination of a device l with removal process p in a sector and region i
  • g k , i : Energy cost of energy kind k per unit operation of combination of a device l with removal process p in a sector and region i
  • ξ l , i : Energy efficiency improvement ratio by device l in sector and region i , due to efficiency improvement of operation and management
  • E k , l , p , i : Energy consumption of energy kind k per unit operation of combination of a device l with removal process p in a sector and region i
  • S C l , p , i r : Subsidy rate for operating cost of additional quantity of combination of a device l with removal process p in a sector and region i
  • X l , p , i : Operating quantity of a combination of a device l with removal process p in a sector and region i
  • ε i m : Emission tax on gas m in a sector and region i
  • Q i m : Emission quantity of a gas m in a sector and region i
  • ε k , i : Energy tax on energy k in a sector and region i
  • Q i , k : Consumption of energy type k in a sector and region i
There are 65 sectors and more than 800 technologies in the IPAC-AIM/technology model for China, and more than 400 technologies for 31 province models. The model will provide a technology portfolio by 2050 for targeted GHG reduction and other objectives. By using the technology portfolio in 2050, characteristics of operation in 24 h will be analyzed to establish the demand response based on electricity price, given in this paper. With assumed electricity price based on the electricity supply, especially with high share of solar PV and wind, the load curve can be obtained by adding all technologies’ energy demands together to present 24-h changing in load in selected days in 2050.
Due to quite different electricity supply patterns among provinces [33], the electricity price will also be very different by province in China in 2050. Based on the studies using the IPAC model for electricity supply in 31 provinces, electricity price in Beijing is given in this paper as an example to present the possible shape of electricity price in 24 h in a day in 2050. The electricity price in Beijing is given based on the local power supply together with electricity import from other provinces outside Beijing, along with their electricity prices.
The demand response with electricity price in 24-h in 2050 is given based on the lowest cost of using electricity in 24 h.

3. Energy and Power Transition Under Carbon Neutrality Goal

Achieving China’s carbon neutrality goal requires a transformation of the entire energy system. This transformation encompasses both the demand side and the supply side, forming the basis for the reform of the new energy system. Based on the previous works of the IPAC model team [31], Figure 1 shows the future primary energy mix result under the carbon neutrality goal. The primary energy demand illustrates the transformation of both the energy demand side and the supply side, whose changes interact with each other. The variability of the supply curve in an energy supply system, which is dependent on renewable energy, brings about a need for demand-side response. Meanwhile, the potential low cost of zero-carbon electricity could drive an increase in demand. The development of nuclear power is also included in the IPAC scenario study. By 2050, the installed capacity for nuclear power generation is projected to reach 560 million kilowatts. If we count the inclusion of other nuclear energy uses, the total installed capacity will reach 750 million kilowatts [32].
The connotation of energy security in the future will also change along with the energy transition [35]. In a scenario with a high proportion of non-fossil energy, energy no longer needs to be imported in China, and China may even begin to export hydrogen to neighboring countries. The connotation of energy security will shift from degree of dependence on imported energy to controlling energy-related incidents and ensuring a highly reliable energy supply. In a scenario relying on renewable energy, energy can be supplied more securely, and energy prices will remain independent. This will significantly reduce the import of energy and avoid the impact of international price fluctuations on energy costs. Vigorously developing nuclear energy can also make energy prices more competitive in the system. Although there are still big concerns about nuclear energy, technological advancements in nuclear power have significantly improved safety compared to earlier nuclear power technologies. Third-generation nuclear technology can achieve a high level of safety, ensuring there will be no fatalities and no harmful nuclear contamination outside the plant, even in the event of a nuclear power plant accident. From the perspective of the energy system, nuclear power is one of the safest, most low-carbon, and highly reliable methods of power generation.
A key means to achieve carbon neutrality is to significantly increase the level of electrification in end-use sectors, under the premise of achieving net-zero emissions of the power system at an earlier stage, which will lead to a significant rise in electricity demand. Figure 2 shows the power generation scenario result in the IPAC model. From the perspective of power generation, the future development of renewable energy sources such as wind power and solar photovoltaic (PV) power needs to maintain the current rapid growth trend. By 2050, zero-carbon electricity is expected to account for approximately 90% of the total power generation. On the demand side, with the electricity generation sector achieving net-zero or negative emissions, the transition to electrification in end-use sectors should be actively encouraged by 2050. Specifically, the transportation sector should be fully electrified, the building sector should achieve near-complete electrification, and the industrial sector should strive for maximum electrification.
Besides electrification, another key factor in the transition is the development of a hydrogen-based economy or hydrogen-based industries. For those processes that cannot be electrified, the use of hydrogen as a substitute should be promoted. This involves producing green hydrogen using zero-carbon electricity. Affordable zero-carbon electricity will enable transformative advancements in hard-to-decarbonize industrial sectors and transportation technologies. For example, in the production of raw materials such as ammonia, benzene, ethylene, and methanol, hydrogen can be used as a reducing agent and feedstock in the production process. Similarly, hydrogen can be employed to reduce ores in industries such as non-ferrous metals and inorganic chemicals. Analyzing the transformation needs of the transportation and industrial sectors reveals that China’s future hydrogen demand will be significant, ranging from 50 to 70 million tons annually. This necessitates accelerating the development of green hydrogen, which involves producing hydrogen using zero-carbon electricity [33].
Thus, the installed capacity and power generation of renewable energy sources such as solar PV and wind power in China will continue to grow, and this trend will also reshape the economic development layout of the country. The production areas of downstream industries may shift to regions with lower renewable energy or nuclear power generation costs, such as the northern, western, and northeastern regions of China [36].

4. Characteristics of Electricity Demand Load

By using the IPAC-AIM/technology model, this study analyzes the final energy demand, power generation structure, heating, as well as energy extraction and transportation through 2050. Due to the model’s detailed energy utilization and power generation technologies, it can be used to analyze the usage characteristics of energy end-use technologies in future years based on the model results. However, the model is an annual model. To analyze energy use at an hourly level within a single day requires incorporating the energy consumption characteristics of various devices. By combining the energy-using equipment of different industries, an energy load curve for a region can be derived.
This paper will analyze six representative regions in China, including Beijing, Guangdong, Jiangsu, Sichuan, Gansu, and Jilin, which are located in the eastern, central, and western regions of the country and are in different development stages. Due to differences in the socioeconomic development patterns and scales of various regions, as well as the fact that different regions are connected to different power grids, analyzing electricity load curves requires considering the region’s socioeconomic development and energy usage patterns. The IPAC modeling team has conducted studies on energy transition pathways aimed at achieving carbon neutrality and air pollution control targets at the provincial level [37]. The potential of key technologies, such as solar PV power and green hydrogen generation, in different provincial regions have been evaluated. The quantitative results show that zero-carbon electricity will develop rapidly in western and northern regions of China, including Gansu and Jilin provinces, which have abundant photovoltaic resources. By contrast, Beijing, Guangdong, and Jiangsu provinces are more developed areas and need more imported electricity. Sichuan province, which is located in southwest China, is rich in hydropower resources. This study will build on the findings of IPAC’s previous research.
To analyze the electricity demand load curves for these provinces and cities in 2050, two typical days that significantly impact power demand will be analyzed: one during a cold winter day and the other during a hot summer day. The 24-h load curves for both days will be provided for analysis. The socioeconomic and industrial development of the six provinces and cities in 2050 will be based on the results from the IPAC model. The economic structure of China until 2050 has been analyzed with the IPAC model in previous works [31]. Based on the layout and costs of zero-carbon electricity under the energy transition pathway, it has also been used to study the process of industrial spatial redistribution by 2050 [36]. The key finding shows that the future layout and cost of zero-carbon electricity will have a significant impact on the country’s industrial distribution. Industries will likely shift to regions with cheaper zero-carbon electricity. Overall, the western, northern, and northeastern provinces will benefit from this shift. The future socioeconomic development and industrial sectors of China’s 31 provincial regions have also been studied using the IPAC model [37]. Based on these research findings, the socioeconomic development scenarios for the six provinces and cities in 2050 are presented in Table 1, the population and urbanization rate in Table 2, and the production volumes of major industrial products in the six regions in Table 3.
Based on the socioeconomic development scenarios and the technological advancements required to achieve carbon neutrality and air pollution control targets, the future energy demand and power generation mix for the six provinces and cities can be determined. Figure 3 presents the scenario results for the final energy demand for the six provinces and cities by 2050. The main pathway for achieving energy transition in each province and city in the future will be to vigorously promote the electrification of end-use sectors while achieving net-zero emissions in the power sector. The promotion of electrification will lead to significant changes in electricity usage patterns and loads. In this context, the energy consumption status of end-use sectors, broken down by sub-sectors and technologies, will be used to analyze the future electricity load curves.
Based on the socioeconomic and industrial development, residential and service sectors, and transportation development scenarios for the six provinces and cities by 2050, as well as energy usage technologies, the 24-h load curves for two characteristic days in 2050 (one hot summer day and the other one cold winter day) can be derived. Here, several load curves are provided, considering both with demand-side response (DSR) measures and without any response measures. The specific measures for DSR are outlined below. Based on the energy utilization technologies, the technology costs, and the electricity prices in the model, the effects of DSR for different sectors have been established. The load curves that consider demand-side response reflect the assumed outcomes of various DSR measures, which are adjusted based on the prevailing electricity prices at the time.
Based on the analysis of the load curves, it can be observed that the load curve characteristics of these six provinces and cities are quite different and could be divided primarily based on the economic and industrial foundation of each region. Beijing, as a city primarily driven by the service sector, has its load curve determined by electricity usage in buildings. Therefore, both the summer and winter electricity load curves are shaped by the characteristics of building electricity consumption, resulting in a significant peak-to-valley difference. In Guangdong and Jiangsu, even by 2050, despite a significant transfer of basic industries to the western regions, industries primarily focused on mechanical manufacturing will still dominate industrial outputs. These mechanical manufacturing sectors exhibit characteristics of the standard 8-h workday, which are influenced by electricity prices. As a result, their production activities will reflect the impact of electricity prices, leading to a more noticeable peak-to-valley difference in the load curves. In Sichuan, Jilin, and Gansu, the relatively low renewable energy electricity prices enable them to take on basic industries, especially energy-intensive industries, which reflect the characteristics of currently industrialized provinces and cities. As a result, the load curve within 24 h shows little variation.
By 2050, with a high level of electrification, there will be noticeable load increases during lunch and dinner times, particularly due to electric cooking. This effect is especially pronounced in service-oriented cities like Beijing, leading to tighter power supply during the evening hours. In contrast, in highly industrialized provinces and cities, the proportion of electric cooking in the total load is relatively small, so its impact on the load curve is less significant.
For electricity price, with the power system primarily relying on renewable energy and nuclear power by 2050, electricity supply will be abundant during the day, resulting in lower electricity prices. However, in the evening, as solar output decreases, the system will require support from energy storage facilities, leading to a significant rise in electricity prices.

5. The Role of Demand-Side Response (DSR)

With the future zero-carbonization of the power system and the high electrification of end-use sectors, matching the power system’s load with electricity supply will face significant challenges. When analyzing power load curves, demand-side response (DSR) becomes critical to achieving a highly reliable power supply. Effective DSR can significantly reduce supply risks, lower investment requirements, and result in reduced electricity costs.
According to the analysis conducted by the IPAC modeling team, without DSR, the power system would need to incur very high costs to maintain a highly reliable electricity supply. DSR can significantly reduce the costs associated with power supply. From the conclusions drawn from Figure 4, during the 24-h period of the two selected typical days, the greatest pressure on power supply occurs in the evening time. On the one hand, power supply pressure can be alleviated for a few hours through methods such as pumped storage, fossil fuel power peak-shaving, and chemical energy storage. On the other hand, DSR in certain regions can effectively reduce supply pressure [38,39,40], lowering the load by over 25%. This enables the power system, energy storage, and transmission infrastructure to be designed more efficiently, ultimately achieving a highly reliable power supply under a high-proportion zero-carbon electricity generation mode.
Based on the IPAC model analysis, DSR types primarily include users actively adjusting their electricity usage based on electricity prices and virtual power plants. Under the current peak-valley electricity price differences, many factories have already increased production during nighttime hours when electricity prices are lower, thereby reducing production costs. Different electricity prices can lead to significant adjustments in electricity usage patterns. Therefore, in the future, electricity price signals provided based on power supply can effectively adjust consumers’ electricity usage behavior.
According to the model results, by 2050, zero-carbon electricity, including solar PV, wind, hydro, and nuclear power, will have costs significantly lower than the current fossil fuel power generation costs. Even considering the overall supply cost of the power system, it will still be lower than current user electricity prices. With solar PV power installed capacity exceeding 3 TW, wind power 1.5 TW, hydropower 520 GW, and nuclear power 560 GW, the total installed capacity will be sufficient to meet electricity demand under various weather conditions in 2050. However, the regional distribution of power capacity will require high demands on power transmission channels. In this situation, electricity prices will exhibit a pattern where daytime prices are low, evening prices are very high, and nighttime prices are moderate. This pricing layout will benefit daytime production and electricity use, and the demand-side response layout will also align with this pricing arrangement.
Based on the socio-economic development, industrial distribution, transportation modes, and changes in building energy use in various regions by 2050, there are many ways to adjust the electricity load curve through demand-side response. Table 4 presents the electricity usage characteristics of major users and devices in the IPAC model. According to the operating characteristics and power of energy technologies in the end-use sectors approaching carbon neutrality goal, as well as the potential demand-side response features, the model can provide hourly load demand for the country and for regions. The model results indicate that with a significant increase in the electrification level of end-use sectors, the diversity of electricity facilities can significantly improve the load curve on the demand side through DSR. Therefore, it will be crucial to construct an intelligent power system with demand-side response well-supported. A key feature of such an intelligent power system is that, by obtaining short-term and long-term electricity price forecasts, it can manage user electricity consumption and automatically adjust the operation of electricity-consuming devices to respond to electricity prices, thus adjusting the load curve to match the power supply curve.
Figure 5 shows the electricity price curve for a typical day in Beijing, and such a curve can incentivize demand-side response. This electricity price is determined by a well-established electricity market, ensuring that the price accurately reflects supply and demand, enabling demand-side response and energy storage facilities to ultimately match the supply curve. It is suitable for some industries that operate during the daytime, such as mechanical manufacturing and food processing, and electric vehicles, as they can begin operations or charge during the low-price daytime period. In the evening, demand can be further adjusted through virtual power plants and other methods to shift energy use for devices like air conditioning, heating, and appliances, avoiding high-demand periods. The high intelligence of electrical devices, empowered by the Internet of Things (IoT), can design operational schedules based on expected electricity prices for the next 24 h, better automating demand-side response. The expected electricity prices need to be gradually determined based on several years of price data, which requires the development of a well-functioning electricity market and price determination mechanism. At the same time, Beijing’s electricity price takes into account the electricity costs and transmission costs of zero-carbon power sources. According to the IPAC model research, overall, electricity prices in China are expected to decrease in the future, primarily due to a significant drop in the generation costs of solar PV and wind power. When considering industrial redistribution and transmission costs, the national average electricity price will decline [36,37]. For Beijing, after 2030, when solar PV capacity can increase to over 30 GW, exceeding Beijing’s load, the electricity price during the day is expected to be lower. However, during the evening time, as solar and wind power output decrease significantly, the cost of power supply rises, necessitating higher electricity prices to drive demand-side response. Based on the analysis for Beijing, there will be eight high voltage transmit lines from outside Beijing to supply electricity to Beijing, including two lines from nuclear power plants and six lines from solar PV and wind power rich regions. With the local electricity supply price, together with the electricity price from the high voltage transmit lines, the electricity prices could be calculated.

6. Conclusions

In the context of China’s carbon neutrality goal, the energy system, especially the power system, will undergo deep transformations, developing towards zero carbon emissions. The shift in the power structure from fossil energy dominance to a high proportion of renewable energy and nuclear power is a necessary condition for achieving zero-carbon electricity systems. However, this will also raise concerns about the security and stability of the power supply. At the same time, the technology and equipment in end-use sectors need to achieve electrification. This poses new demands for matching the changes in end-use loads with overall electricity supply.
In the context of this study, further exploration has been conducted on the energy transition and economic transformation paths of China under the carbon neutrality goal, building upon previous research by the research group. The study analyzes the electricity demand load under the different transformation paths, discusses the electricity and energy usage characteristics of six typical provincial regions, and provides 24-h load curves for two typical days in each region. It then analyzes the effects of demand-side response. The study draws the following main conclusions:
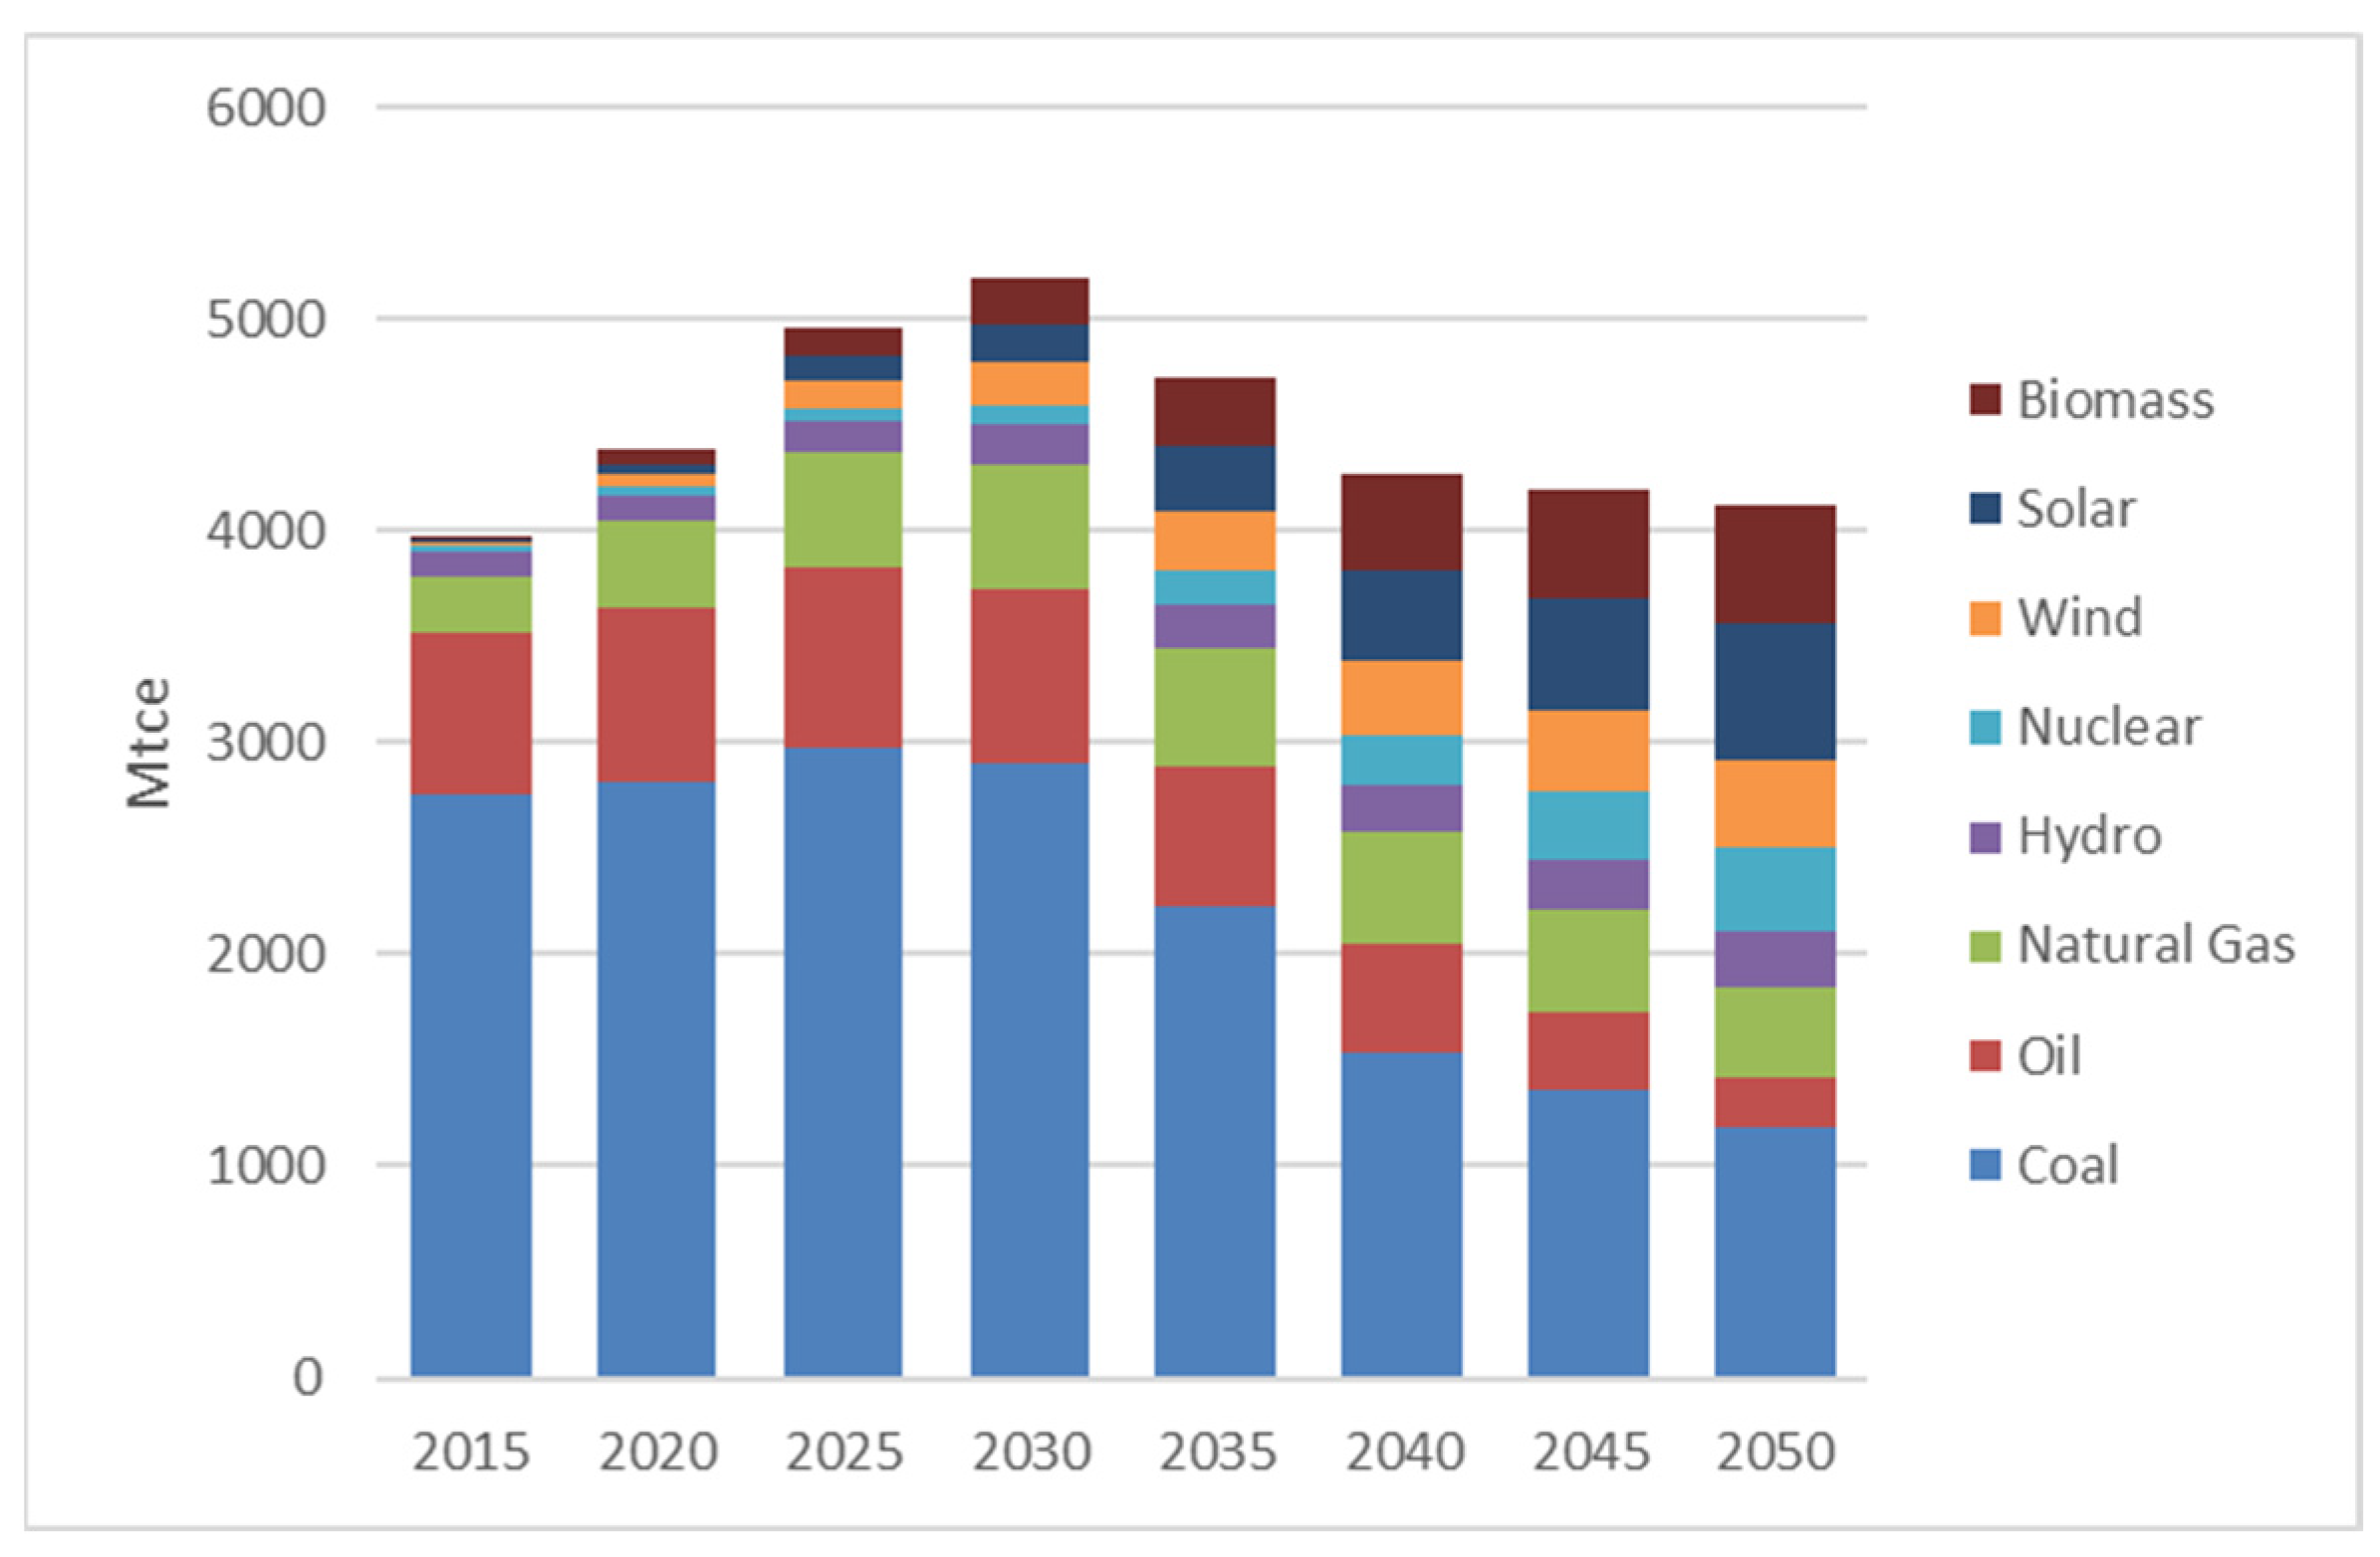
  • Under the carbon neutrality goal, China’s future energy structure will rapidly transition towards a dominant position of non-fossil energy, primarily consisting of renewable energy and nuclear power. This will lead to a shift in the concept of energy security in China, with energy security moving from being focused on the proportion of imported energy to controlling energy-related accidents and ensuring a high-reliability energy supply.
  • A highly reliable energy system should ensure the alignment of supply and demand, while maintaining the independence of energy prices and ensuring affordability.
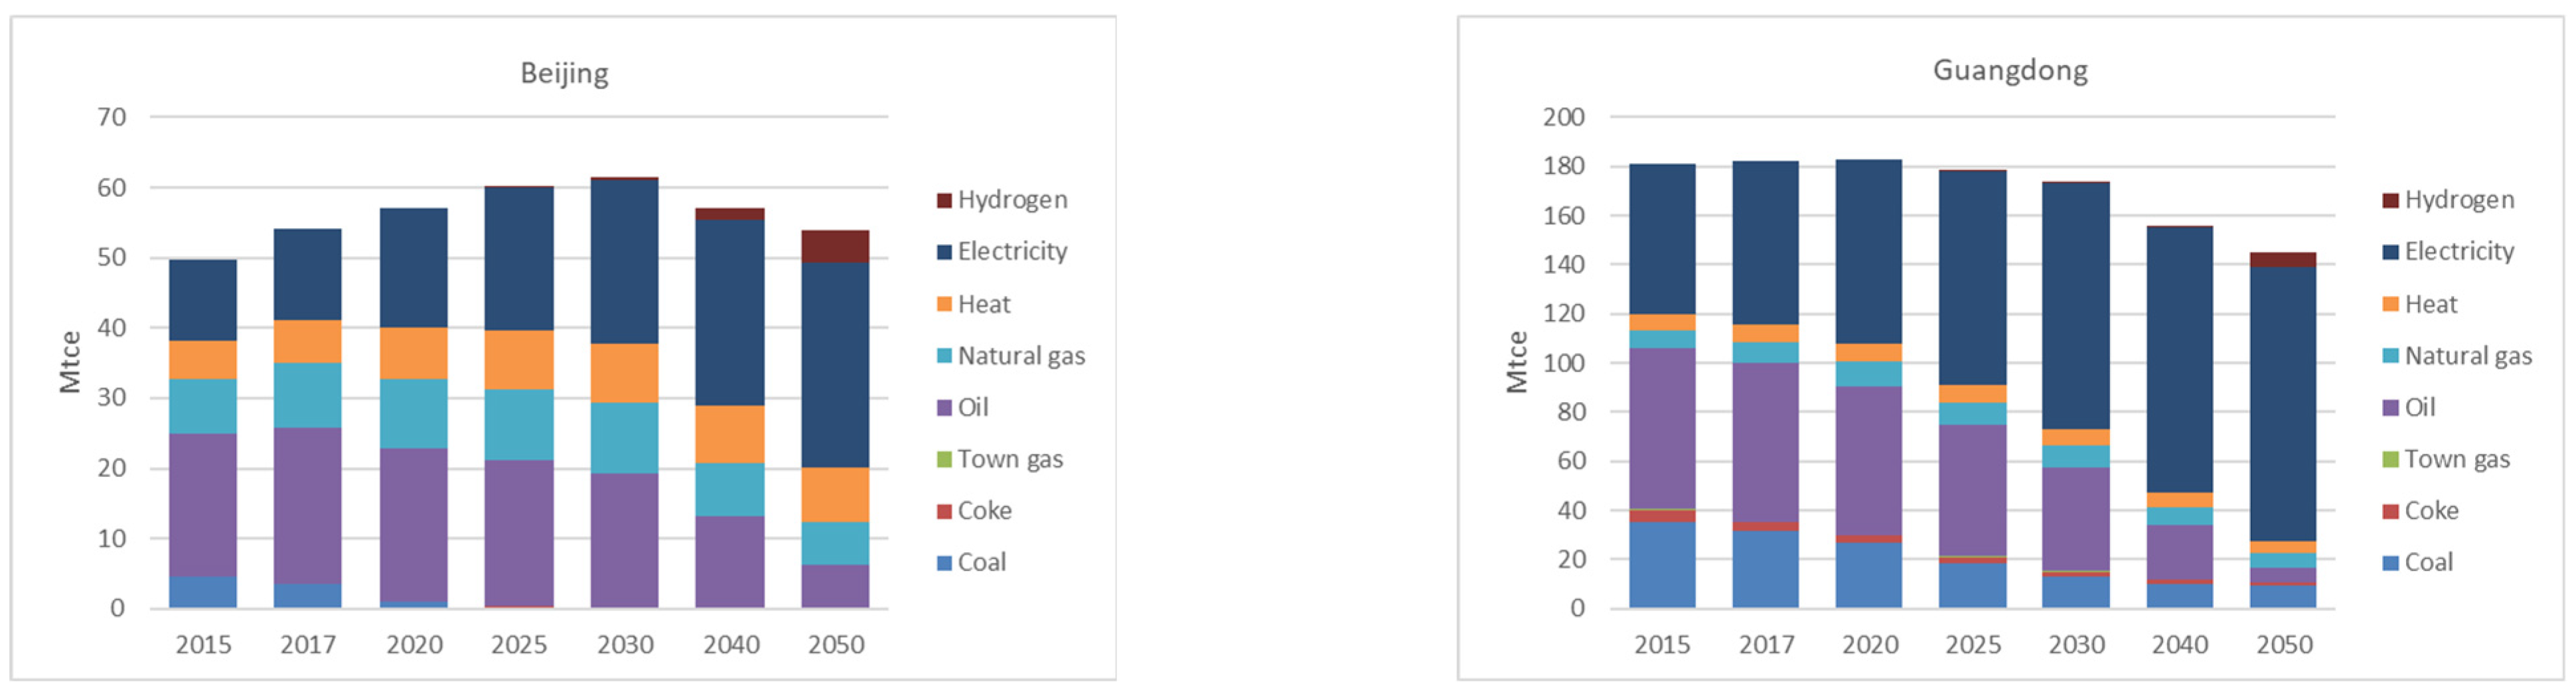
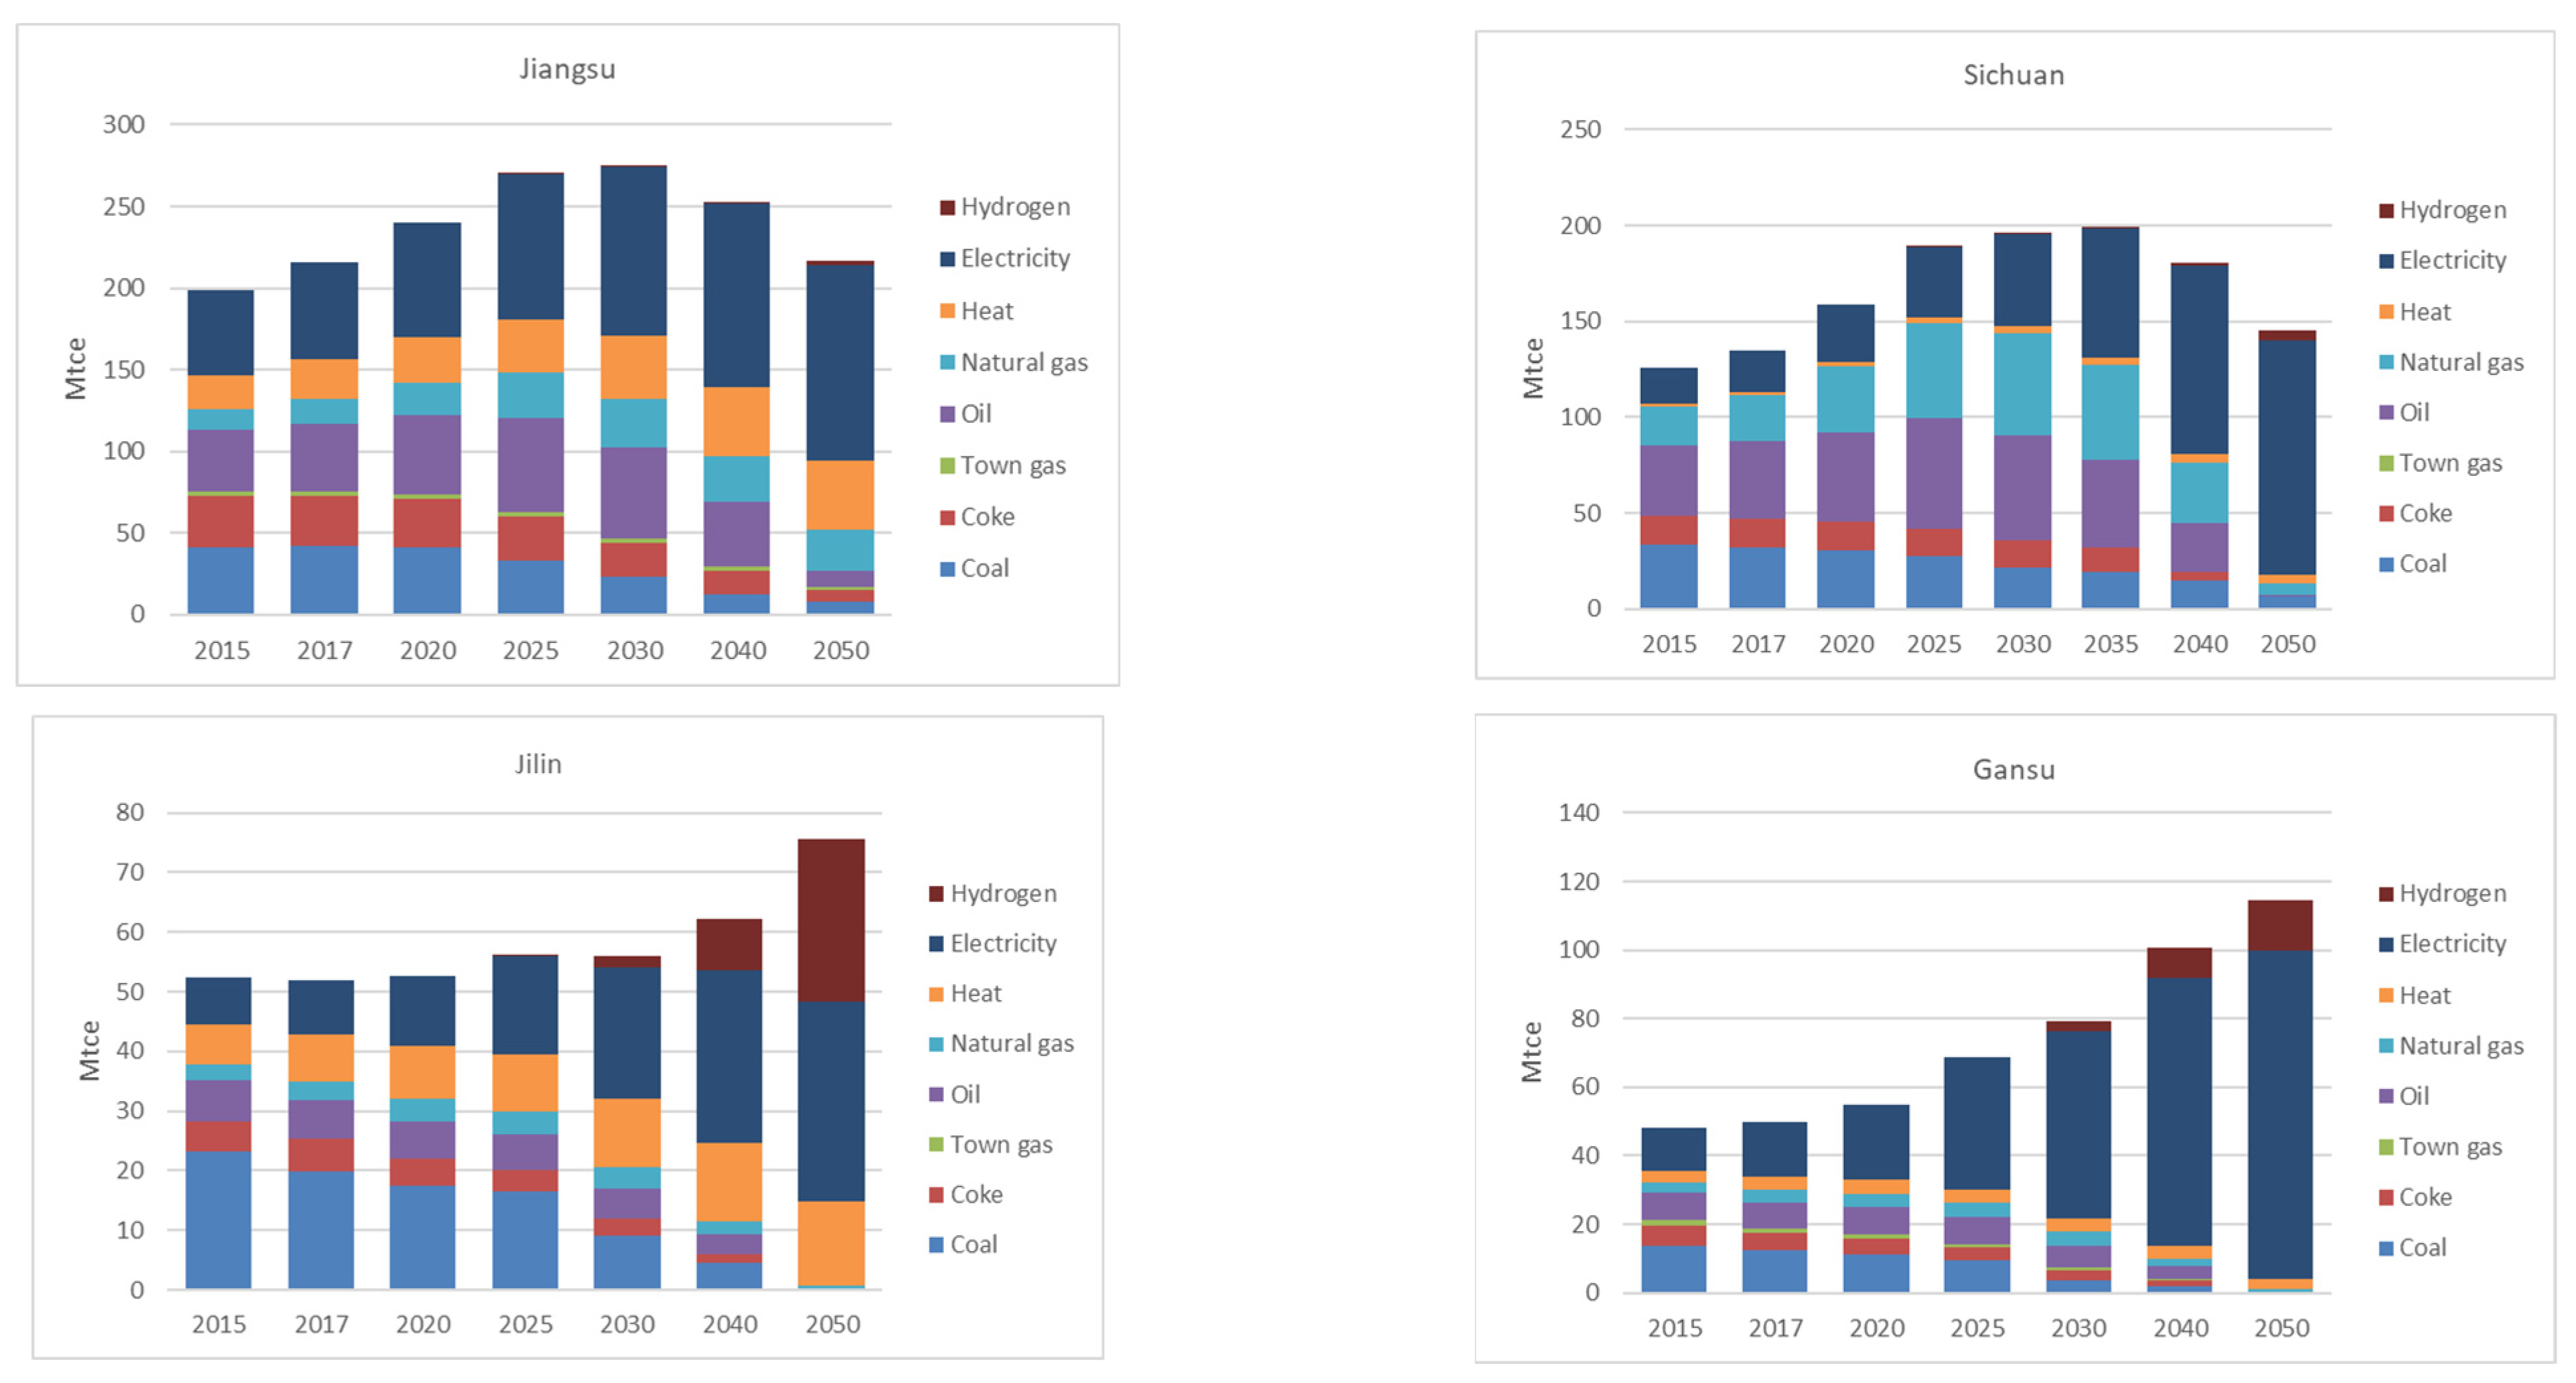
  • Combined with the results of end-use energy demand, the electricity demand load curves can effectively describe the electricity demand characteristics of different regions. With the transformation of the energy system and the industrial reorganization in the economic transition, by 2050, the load curves of China’s major regions will differ significantly from those of today, with each region showing its own characteristics. Noting the differences in load curves in 2050 compared with today is crucial for analyzing the future electricity system, which is a key topic in China’s research and policy making. This study presented a different output compared with many other studies. Using today’s load curve to design the future electricity system could be a misleading.
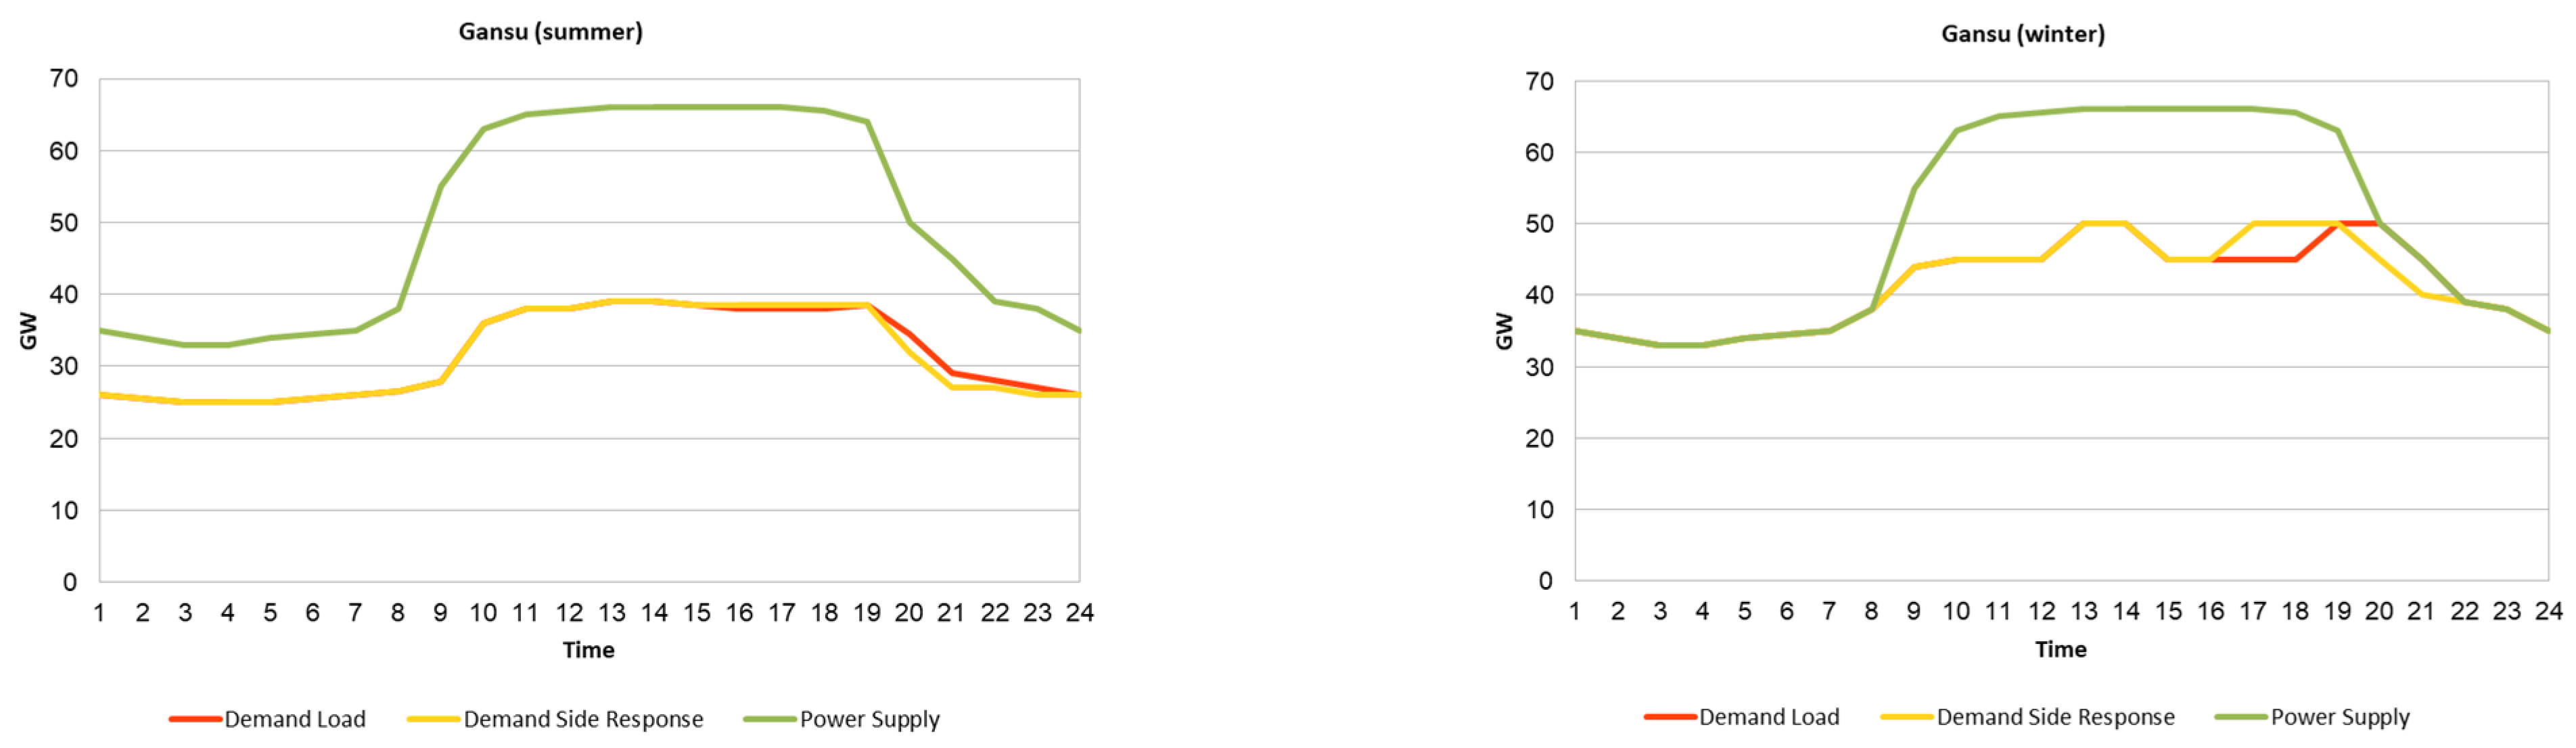
  • Traditional industrial regions such as Guangdong and Jiangsu, as large-scale industrial sectors move out, will see their load curves exhibit greater fluctuations. In contrast, regions like Sichuan, Jilin, and Gansu, due to abundant local renewable energy resources, will experience large-scale industrial development, gradually reflecting the load characteristics of current industrialized provinces. Beijing will further strengthen its role as a service-oriented economy, with electricity consumption mainly driven by buildings and transportation, and its load curve will be more influenced by electricity used in buildings.
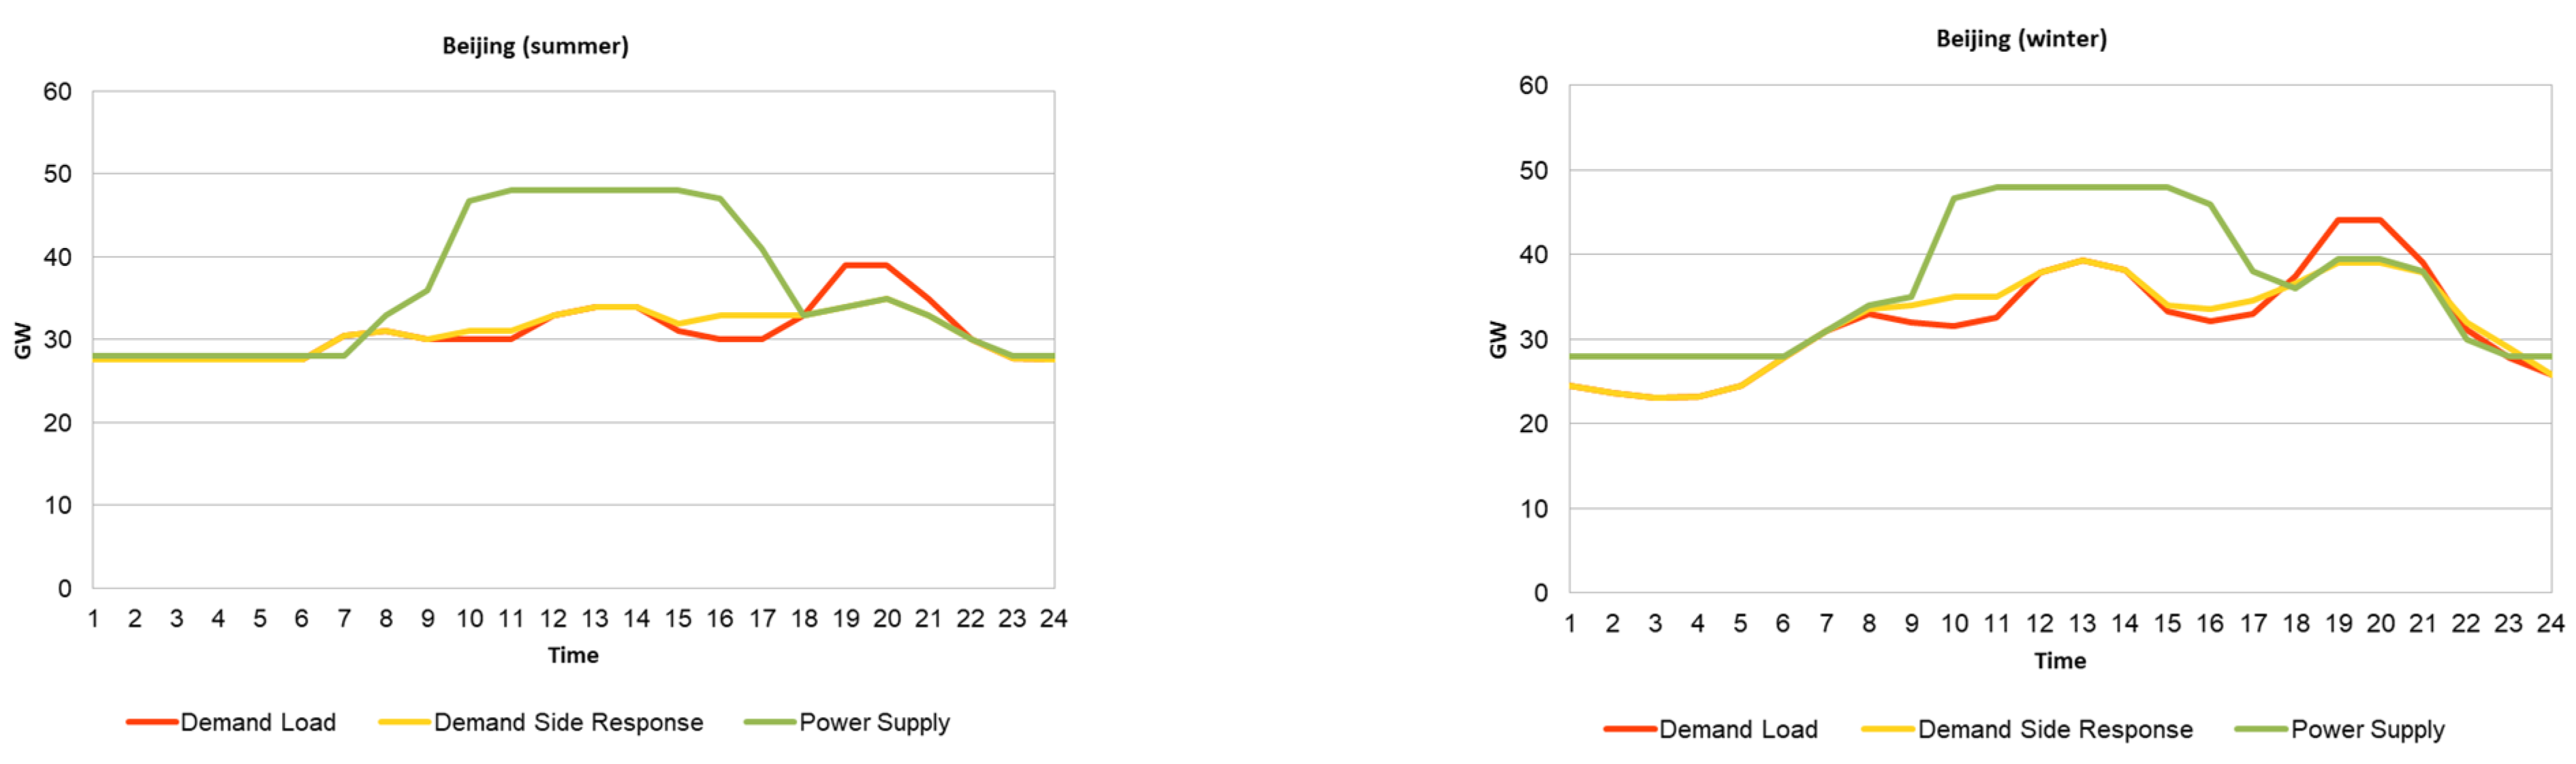
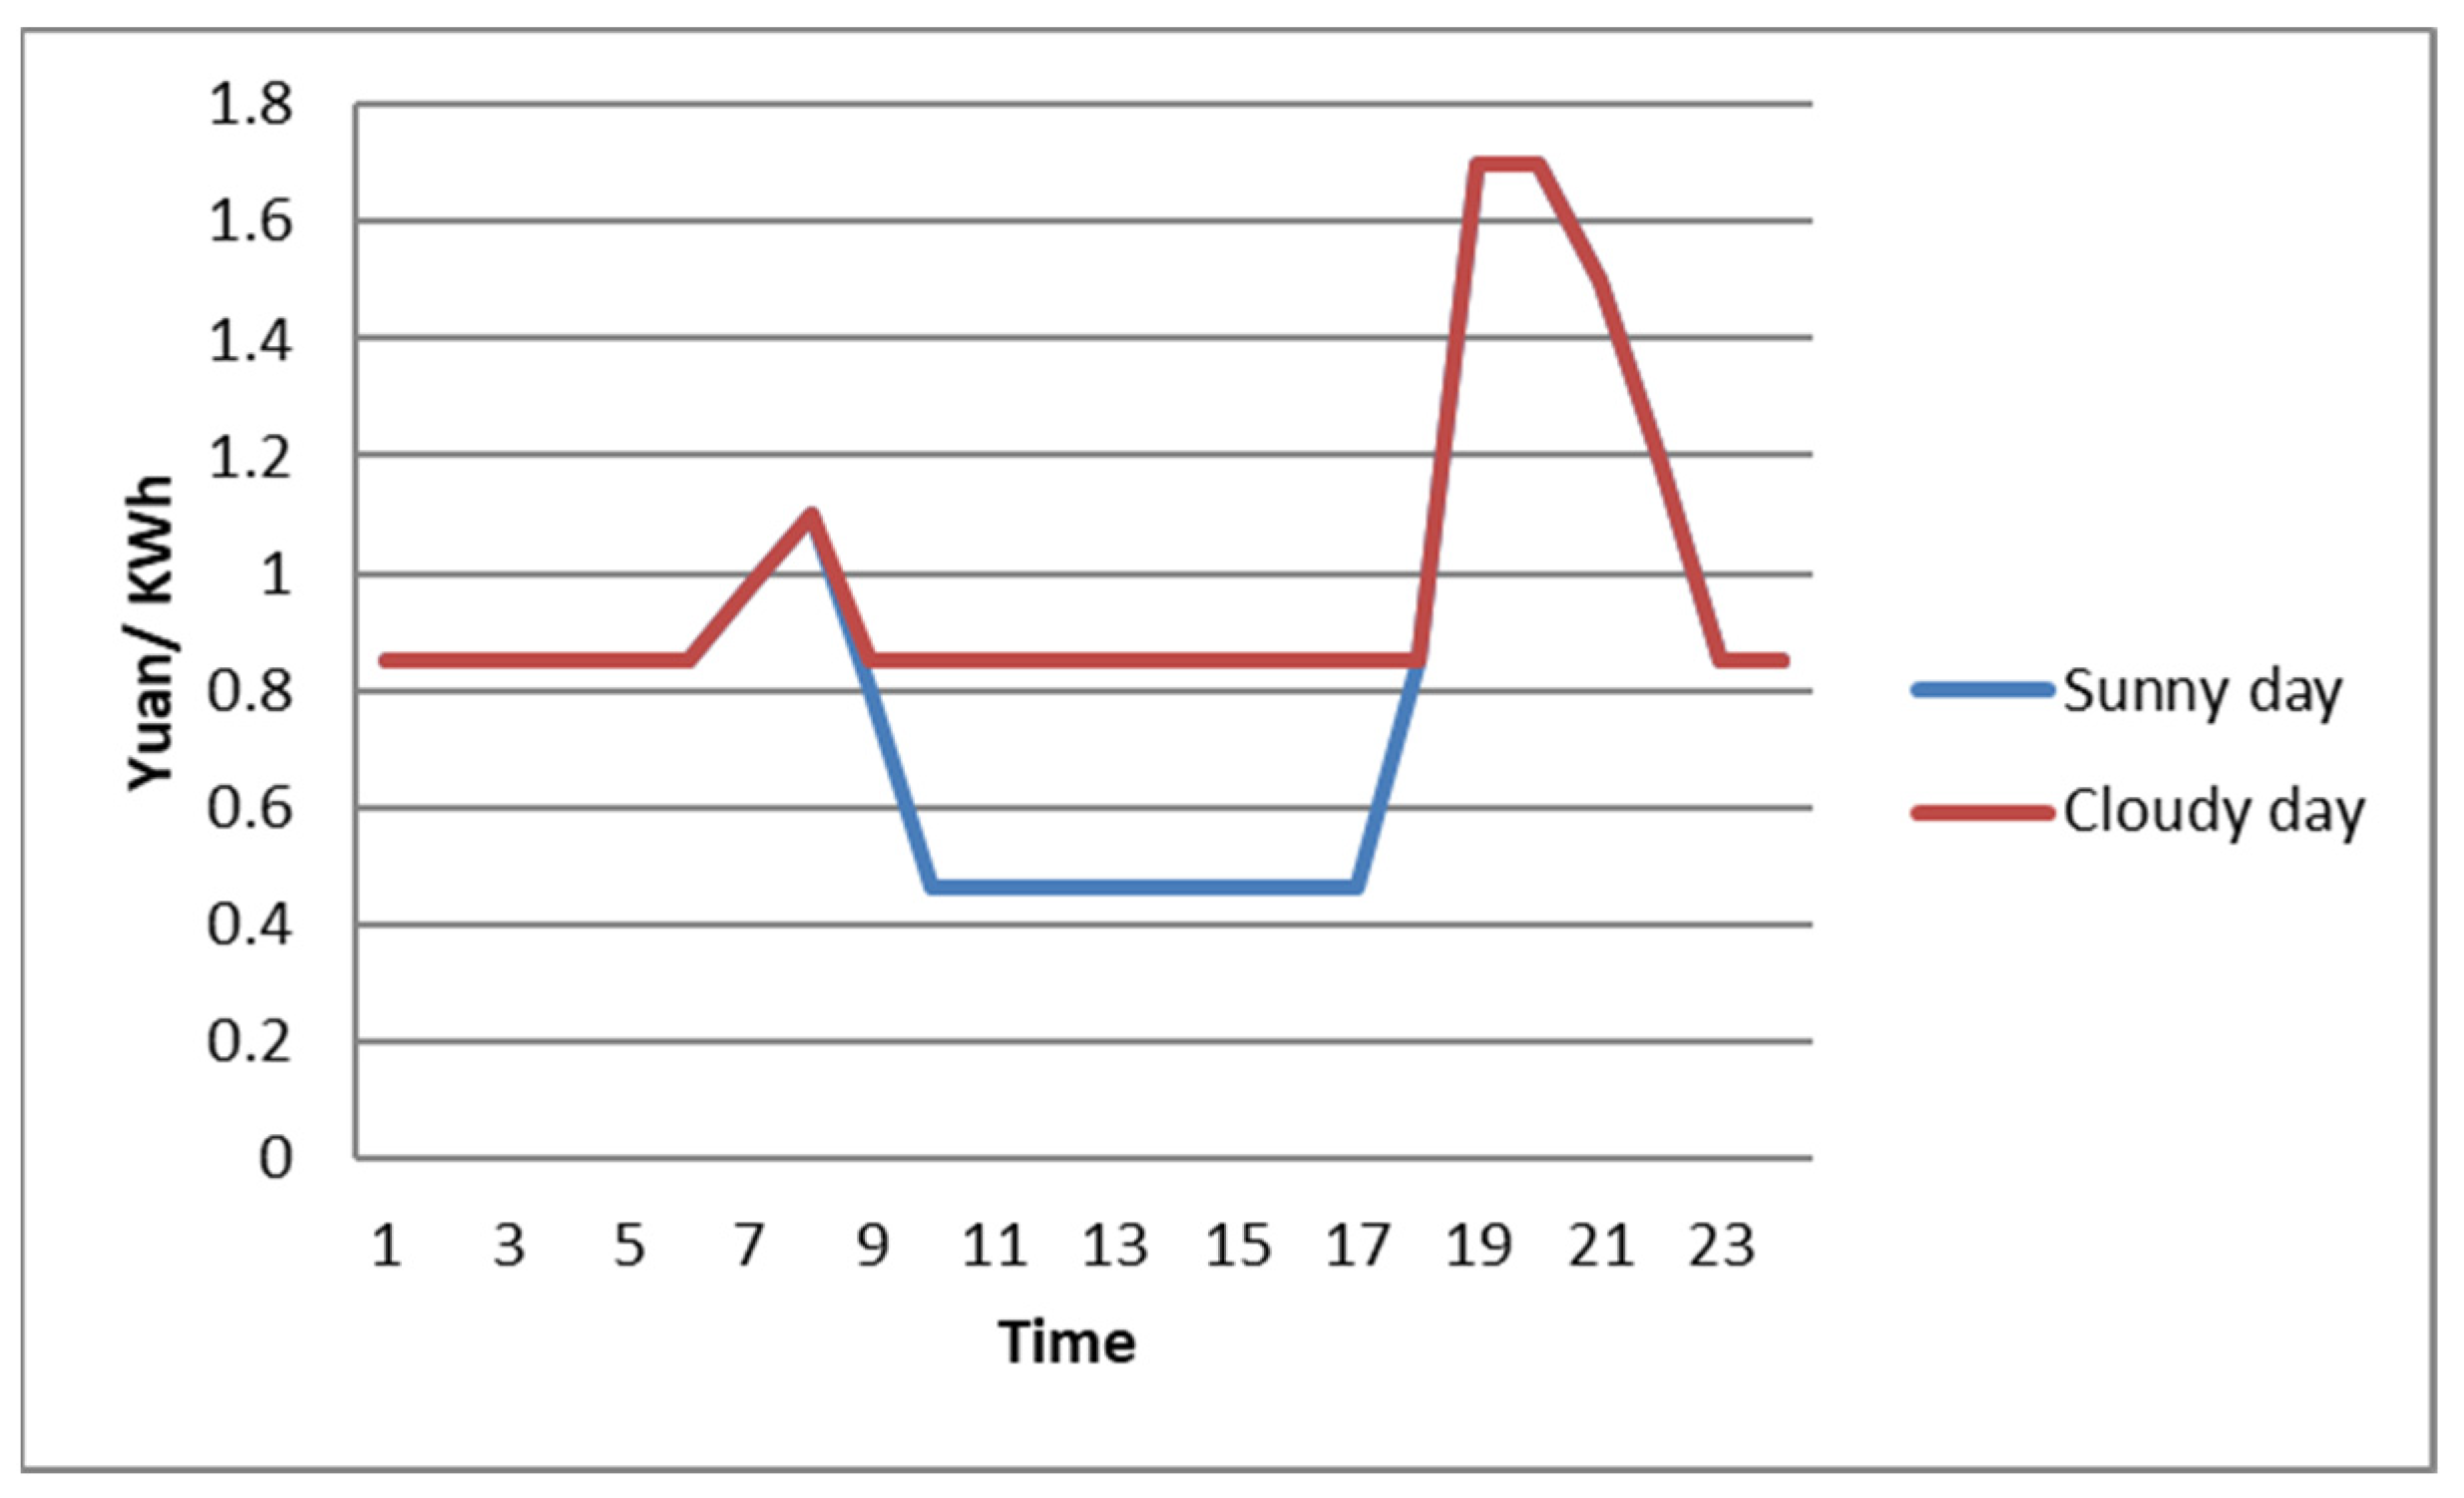
  • Due to the significant reduction in the cost of photovoltaics and wind power in the future, the electricity price structure will change significantly, differing from the current situation. The electricity price during the day will be significantly lower than during the evening peak period, when electricity prices will rise due to the noticeable increase in power generation costs as photovoltaic and wind power output decreases.
  • The changes in electricity pricing will lead to a strong demand-side response across various end-use sectors. By constructing an intelligent power system, through methods such as price adjustments and virtual power plants, demand-side response can be created, significantly improving the matching between the load curve and power supply.
  • Technologies using electricity in 2050 could change their operation timing to match the electricity supply; they could shut down at night or reduce the working load of specific technologies to follow the electricity supply, such as electricity arc furnaces for steel making, hydrogen electrolytic process, etc. This makes the electricity user side flexible and able to match with electricity supply characteristics with a high share of solar PV and wind power.
  • The high share of solar PV and wind power could lead to a flexible electricity supply in 2050, which is regarded as a negative effect for electricity supply security. But good forecasting of weather conditions means that the electricity supply could be planned in a foreseeable way. Together with an electricity price forecast generated by an IT system with big data learning, a high security energy system could be reached.
  • The relatively high share of nuclear power, hydro power, and biomass power has the potential to provide higher electricity supply security compared with other studies, which could support the power supply at night.

Author Contributions

Conceptualization, K.J.; Data curation, C.H. and P.X.; Formal analysis, C.H.; Funding acquisition, C.H. and K.J.; Methodology, C.H. and K.J.; Resources, K.J.; Supervision, K.J.; Visualization, K.J., Y.J. and M.L.; Writing—original draft, C.H. and K.J.; Writing—review and editing, C.H., K.J., P.X. and Y.J. All authors have read and agreed to the published version of the manuscript.

Funding

This work is part of projects that supported by National Social Science Foundation of China under grant No. [22&ZD103], and Zhejiang Provincial Natural Science Foundation of China under grant No. [LQ24D050002].

Institutional Review Board Statement

Not applicable.

Informed Consent Statement

Not applicable.

Data Availability Statement

The data presented in this study are available on request from the corresponding author.

Conflicts of Interest

The authors declare no conflict of interest.

References

  1. IPCC. Climate Change 2021: The Physical Science Basis. Contribution of Working Group I to the Sixth Assessment Report of the Intergovernmental Panel on Climate Change; Intergovernmental Panel on Climate Change: Cambridge, UK; New York, NY, USA, 2021. [Google Scholar]
  2. Lin, B. China’s High-Quality Economic Growth in the Process of Carbon Neutrality. China Financ. Econ. Rev. 2023, 11, 3–22. [Google Scholar]
  3. Khalifa, A.A.; Ibrahim, A.-J.; Amhamed, A.I.; El-Naas, M.H. Accelerating the Transition to a Circular Economy for Net-Zero Emissions by 2050: A Systematic Review. Sustainability 2022, 14, 11656. [Google Scholar] [CrossRef]
  4. Balgehshiri, S.K.M.; Zohuri, B. The Impact of Energy Transition to Net-Zero Emissions on The World Economy and Global Strategies. J. Econ. Manag. Res. 2023, 4. [Google Scholar] [CrossRef]
  5. IEA. World Energy Outlook 2024; International Energy Agency: Paris, France, 2024. [Google Scholar]
  6. Energy Research Institute of National Development and Reform Commission. China 2050 High Renewable Energy Penetration Scenario and Roadmap Study; Energy Research Institute of National Development and Reform Commission: Beijing, China, 2015.
  7. Zou, P.; Chen, Q.; Yu, Y.; Xia, Q.; Kang, C. Electricity markets evolution with the changing generation mix: An empirical analysis based on China 2050 High renewable Energy Penetration Roadmap. Appl. Energy 2017, 185, 56–67. [Google Scholar] [CrossRef]
  8. Energy Transitions Commission. China 2050: A Fully Developed Rich Zero-Carobon Economy; Energy Transitions Commission: London, UK, 2019. [Google Scholar]
  9. Khanna, N.; Fridley, D.; Zhou, N.; Karali, N.; Zhang, J.; Feng, W. Energy and CO2 implications of decarbonization strategies for China beyond efficiency: Modeling 2050 maximum renewable resources and accelerated electrification impacts. Appl. Energy 2019, 242, 12–26. [Google Scholar] [CrossRef]
  10. Qin, D. Climate and Environmental Evolution in China: 2021; Science Press: Beijing, China, 2021. [Google Scholar]
  11. Wang, Z.; Zheng, Y.; Zhao, Y.; Tao, Y.; Hui, J.; He, Z. China Renewable Energy Outlook in the Context of Carbon Neutrality. Energy China 2021, 9, 7–13. [Google Scholar]
  12. Zhang, X.; Huang, X.; Zhang, D.; Geng, Y.; Tian, L.; Fan, Y.; Chen, W. Research on the Pathway and Policues for China’s Energy and Economy Transformation toward Carbon Neutrality. J. Manag. World 2022, 38, 35–51. [Google Scholar]
  13. Meegahapola, L.; Mancarella, P.; Flynn, D.; Moreno, R. Power system stability in the transition to a low carbongrid: A techno-economic perspective on challenges andopportunities. WIREs Energy Environ. 2021, 10, e399. [Google Scholar] [CrossRef]
  14. Song, S.; Liu, P.; Li, Z. Low carbon transition of China’s electric and heating sector considering reliability: A modelling and optimization approach. Renew. Sustain. Energy Rev. 2022, 169, 112904. [Google Scholar] [CrossRef]
  15. Shen, X.; Li, X.; Yuan, J.; Jin, Y. A hydrogen-based zero-carbon microgrid demonstration in renewable-rich remote areas: System design and economic feasibility. Appl. Energy 2022, 326, 120039. [Google Scholar] [CrossRef]
  16. Ahmed, F.; Kez, D.A.; McLoone, S.; Best, R.J.; Cameron, C.; Foley, A. Dynamic grid stability in low carbon power systems with minimum inertia. Renew. Energy 2023, 210, 486–506. [Google Scholar] [CrossRef]
  17. UNFCCC. The Paris Agreement. In Proceedings of the Paris Climate Change Conference, Paris, France, 30 November–12 December 2015; United Nations Framework Convention on Climate Change: Paris, France, 2015. [Google Scholar]
  18. Levin, K.; Rich, D. Turning Points: Trends in Countries’ Reaching Peak Greenhouse Gas Emissions over Time; World Resources Institute: Washington, DC, USA, 2017. [Google Scholar]
  19. van Soest, H.L.; den Elzen, M.G.J.; van Vuuren, D.P. Net-zero emission targets for major emitting countries consistent with the Paris Agreement. Nat. Commun. 2021, 12, 2140. [Google Scholar] [CrossRef] [PubMed]
  20. Tuunanen, J. Modelling of Changes in Electricity End-Use and Their Impacts on Electricity Distribution; Lappeenranta University of Technology: Lappeenranta, Finland, 2015. [Google Scholar]
  21. Ardakani, F.J.; Ardehali, M.M. Long-term electrical energy consumption forecasting for developing and developed economies based on different optimized models and historical data types. Energy 2014, 5, 452–461. [Google Scholar] [CrossRef]
  22. Franco, A.; Rocca, M. Renewable Electricity and Green Hydrogen Integration for Decarbonization of “Hard-to-Abate” Industrial Sectors. Electricity 2024, 5, 471–490. [Google Scholar] [CrossRef]
  23. Mayer, M.J.; Biró, B.; Szücs, B.; Aszódi, A. Probabilistic modeling of future electricity systems with high renewable energy penetration using machine learning. Appl. Energy 2023, 336, 120801. [Google Scholar] [CrossRef]
  24. Lindberg, K.B.; Seljom, P.; Madsen, H.; Fischer, D.; Korpås, M. Long-term electricity load forecasting: Current and future trends. Util. Policy 2019, 58, 102–119. [Google Scholar] [CrossRef]
  25. Shu, Y.; Chen, G.; He, J.; Zhang, F. Building a New Electric Power System Based on New Energy Sources. Strateg. Study CAE 2021, 23, 61–69. [Google Scholar] [CrossRef]
  26. Balasubramanian, S.; Balachandra, P. Characterising electricity demand through load curve clustering: A case of Karnataka electricity system in India. Comput. Chem. Eng. 2021, 150, 107316. [Google Scholar] [CrossRef]
  27. Hou, Q.; Zhang, N.; Du, E.; Miao, M.; Peng, F.; Kang, C. Probabilistic duck curve in high PV penetration power system: Concept, modeling, and empirical analysis in China. Appl. Energy 2019, 242, 205–215. [Google Scholar] [CrossRef]
  28. Liu, J.; Hu, H.; Yu, S.S.; Trinh, H. Virtual Power Plant with Renewable Energy Sources and Energy Storage Systems for Sustainable Power Grid-Formation, Control Techniques and Demand Response. Energies 2023, 16, 3705. [Google Scholar] [CrossRef]
  29. Jordehi, A.R. Optimisation of demand response in electric power systems, a review. Renew. Sustain. Energy Rev. 2019, 103, 308–319. [Google Scholar] [CrossRef]
  30. Chen, Y.; Xu, P.; Gu, J.; Schmidt, F.; Li, W. Measures to improve energy demand flexibility in buildings for demand response (DR): A review. Energy Build. 2018, 177, 125–139. [Google Scholar] [CrossRef]
  31. Jiang, K.; He, C.; Dai, H.; Liu, J.; Xu, X. Emission Scenario Analysis for China under the Global 1.5 °C Target. Carbon Manag. 2018, 9, 481–491. [Google Scholar] [CrossRef]
  32. Xiao, X.; Jiang, K. China’s nuclear power under the global 1.5 °C target: Preliminary feasibility study and prospects. Adv. Clim. Change Res. 2018, 9, 138–143. [Google Scholar] [CrossRef]
  33. Xiang, P.; He, C.; Chen, S.; Jiang, W.; Liu, J.; Jiang, K. Role of hydrogen in China’s energy transition towards carbon neutrality target: IPAC analysis. Adv. Clim. Change Res. 2023, 14, 43–48. [Google Scholar] [CrossRef]
  34. He, C.; Jiang, K.; Xiang, P.; Jiang, W.; Zhang, Y. Alignment of energy transition and water resources under the carbon neutrality target in China. J. Integr. Environ. Sci. 2024, 21, 2389072. [Google Scholar] [CrossRef]
  35. National Energy Administration; China Electricity Council. National Electricity Reliability Annual Report 2023; National Energy Administration; China Electricity Council: Beijing, China, 2024.
  36. Jiang, K.; Xiang, P.; He, C.; Feng, S.; Liu, C.; Tan, X.; Chen, S.; Dai, C.; Deng, L. Impact Analysis of Zero Carbon Emission Power Generation on China’s Industrial Sector Distribution. J. Glob. Energy Interconnect. 2021, 4, 5–11. [Google Scholar]
  37. Jiang, K. Energy and Economic Transformation Paths to Achieve Multiple Goals. Yuejiang Acad. J. 2022, 14, 35–44. [Google Scholar]
  38. Su, H.; Chi, L.; Zio, E.; Li, Z.; Fan, L.; Yang, Z.; Liu, Z.; Zhang, J. An integrated, systematic data-driven supply-demand side management method for smart integrated energy systems. Energy 2021, 235, 121416. [Google Scholar] [CrossRef]
  39. Saleh, I.M.; Postnikov, A.; Arsene, C.; Zolotas, A.C.; Bingham, C.; Bickerton, R.; Pearson, S. Impact of Demand Side Response on a Commercial Retail Refrigeration System. Energies 2018, 11, 371. [Google Scholar] [CrossRef]
  40. Wen, L.; Zhou, K.; Feng, W.; Yang, S. Demand Side Management in Smart Grid: A Dynamic-Price-Based Demand Response Model. IEEE Trans. Eng. Manag. 2024, 71, 1439–1451. [Google Scholar] [CrossRef]
Figure 1. Primary energy demand for China, carbon neutrality scenario in IPAC model. (Unit: million ton of coal equivalent, Mtce).
Sustainability 17 01759 g001
Figure 2. Power generation for China, carbon neutrality scenario in IPAC model.
Sustainability 17 01759 g002
Figure 3. Final energy demand and structure of six provincial regions in China. (Unit: million ton of coal equivalent, Mtce).
Sustainability 17 01759 g003aSustainability 17 01759 g003b
Figure 4. Load curves and power supply curves for two typical days in 2050 across the six provinces and cities.
Sustainability 17 01759 g004aSustainability 17 01759 g004bSustainability 17 01759 g004c
Figure 5. Electricity price of a typical day in Beijing by 2050.
Sustainability 17 01759 g005
Table 1. GDP growth rate until 2050.
2020–20252025–20302030–20402040–2050
Beijing5.04%5.40%4.30%3.30%
Guangdong5.49%5.40%4.30%3.10%
Jiangsu5.80%5.20%4.10%3.30%
Sichuan6.40%5.30%4.20%3.30%
Jilin5.50%5.60%4.40%3.40%
Gansu6.38%6.00%4.92%3.72%
Table 2. Population and urbanization rate.
2020203020402050
Population, million
Beijing22.3623.0323.2623.26
Guangdong112.83116.21116.21108.08
Jiangsu82.9585.4485.4482.88
Sichuan85.3287.8887.8885.24
Jilin28.6329.4929.4927.43
Gansu27.0427.8526.7324.86
Urbanization rate, %
Beijing89929393
Guangdong75798082
Jiangsu73788181
Sichuan52606571
Jilin60697682
Gansu47576268
Table 3. Production of major industrial products.
Crude SteelCementEthyleneHydrogen
20202050202020502020205020202050
Beijing004320798000
Guangdong158679111,3345725299130190500
Jiangsu9896493814,084711416101900
Sichuan190995210,9915552016090560
Jilin10565272594131077150130450
Gansu81840837161877642000600
AmmoniaBenzenePXMethanol
20202050202020502020205020202050
Beijing00172006000
Guangdong0044606930000
Jiangsu30706665102100570
Sichuan248560160366082300
Jilin46300275006010
Gansu35600141000100631000
Table 4. Electricity demand characteristics of major users and devices.
TypeDeviceCharacteristicModel Assumption
ResidentAir conditioningThere will be some response to electricity prices, but not significantly10% load adjustment
Electric heaterThe response is not significant8% load adjustment
RefrigeratorThe response is not obvious, and the price of smart refrigerators can be adjusted to a certain extent8% load adjustment
Electric cookingInconspicuous response7% load adjustment
other household appliancesCertain response, arrange the using time10% load adjustment
ServiceRestaurantThe response is not obvious, with a few responses5% load adjustment
Office canteenGood response, arrange cooking time according to electricity price25% load adjustment
Central air conditioningOrderly response within an hour12% load adjustment
Electric water heaterOrderly response under intelligent control8% load adjustment
LightingIt has some responsiveness, but not much8% load adjustment
Urban landscape lightingIt has some responsiveness, but not much8% load adjustment
IndustryNon-continuous production industries24-h orderly response15% load adjustment
Continuous production industriesSeasonal response75% utilization rate, maintenance scheduled according to seasonal electricity prices
Hydrogen-based industriesPeak shaving in electrolytic water hydrogen;
Peak shaving in the production of ammonia and other products
25% peak shaving capacity;
15% peak shaving potential
TransportationElectric vehiclegood responsedo not charge during peak periods generally
Electricity for ports, stations, airportsEnergy storage response8%
Disclaimer/Publisher’s Note: The statements, opinions and data contained in all publications are solely those of the individual author(s) and contributor(s) and not of MDPI and/or the editor(s). MDPI and/or the editor(s) disclaim responsibility for any injury to people or property resulting from any ideas, methods, instructions or products referred to in the content.

