Article

Quantitative Evaluation of China’s Carbon Peaking Policies Based on PMC Index Model: Evidence from the First Batch of National Carbon Peak Pilot Provinces and Regions

1
School of Public Administration, Jilin University, Changchun 130012, China
2
School of International Relations and Public Affairs, Fudan University, Shanghai 200433, China
*
Author to whom correspondence should be addressed.
Sustainability 2025, 17(4), 1738; https://doi.org/10.3390/su17041738
Submission received: 11 December 2024 / Revised: 15 February 2025 / Accepted: 17 February 2025 / Published: 19 February 2025

Abstract

:
The carbon peaking policy in China has been established within the context of global climate change, one of the most pressing environmental challenges of the 21st century. This study constructs a quantitative policy evaluation system based on the Policy Model Consistency Index (PMC-Index) model to assess the effectiveness of carbon peaking policies in the provinces selected for China’s first batch of carbon peaking pilot projects. This assessment is crucial for improving policy quality and effectiveness, as well as for providing direction for carbon peaking and carbon neutrality governance. The results show that the 15 carbon peaking action plan policies are generally rated as “good” and “acceptable” with an average score of 6.59. Seven core focus areas were identified within the policy texts, including green development, renewable energy use, technological innovation, key industry promotion, corporate management improvements, ecological protection, and achieving carbon neutrality. The study also identified a PMC surface map, visually illustrating the strengths and weaknesses of the policy texts. While the design of China’s carbon peaking policies is reasonable, there is still room for improvement, especially in integrating economic development with carbon reduction targets, enhancing policy timeliness, expanding policy coverage, increasing public participation, and strengthening market-based policy tools. This study proposes optimization paths for each policy from a specific perspective and provides clear directions for optimizing and improving the overall carbon peaking policy from a general perspective.

1. Introduction

Global climate change ranks among the most urgent environmental challenges ever confronted by humanity and remains one of the 21st century’s most complex issues [1]. The Sixth Assessment Report from the Intergovernmental Panel on Climate Change (IPCC) indicates that the global average surface temperature during the period from 2011 to 2020 rose by 1.09 °C compared to the average temperature recorded between 1850 and 1900. Many changes caused by greenhouse gas (GHG) emissions are irreversible over hundreds to almost a thousand years, especially the changes in oceans, ice sheets, and global sea levels. The international community has engaged in repeated rounds of climate negotiations to mitigate global warming. With the adoption and signing of a series of international treaties such as the Kyoto Protocol and the Paris Agreement [2], many countries have made substantial progress on emission reduction; however, numerous studies indicate that, even if all parties fulfill the Nationally Determined Contributions (NDCs) from the 2015 Paris Agreement, global temperatures may still rise by over 3 °C, surpassing the intended limits of 2 °C or 1.5 °C. Therefore, regarding the task of stabilizing atmospheric greenhouse gas concentrations at levels that enable sustainable development on Earth, the international community still has a long way to go.
As a responsible major country, China puts forward value appeals to achieve substantive and procedural climate justice. On 22 September 2020, during the general debate of the 75th United Nations General Assembly, Chinese President Xi Jinping announced, “China will enhance its nationally determined contributions, adopt more vigorous policies and measures, strive to peak carbon dioxide emissions before 2030, and work towards achieving carbon neutrality before 2060”. This statement represents China’s formal commitment to the objectives of carbon peaking and carbon neutrality, which has garnered widespread attention both domestically and internationally. To meet these targets, the Chinese government has developed a series of policies and action plans. The country’s carbon peaking and carbon neutrality policy framework follows a “1+N” structure. Here, “1” refers to the “Opinions of the Central Committee of the Communist Party of China and the State Council on Effectively Implementing the New Development Philosophy and Doing a Good Job in Carbon Peaking and Carbon Neutrality”, issued by the State Council on 22 September 2021. This document serves as the top-level design and overall framework for carbon peaking and carbon neutrality policies, clarifying the general requirements, main goals, and major measures for achieving these objectives. “N” refers to the carbon peaking action plans and policy measures formulated by various departments and local governments before 2030, covering key sectors such as energy, industry, urban and rural development, transportation, and agriculture. The policy system emphasizes systemic and coordinated approaches, with the “N” policies from different departments and local governments complementing each other, thereby forming a comprehensive policy system that robustly supports the achievement of carbon peaking and carbon neutrality.
A scientific policy system will significantly improve the quality and effectiveness of policies and provide fundamental guidelines and direction for carbon peaking and carbon neutrality governance [3]. Policy evaluation is a key foundation for assessing the quality of public policies [4]. By evaluating the policy texts themselves, we can identify their strengths and weaknesses, and we can predict potential issues during policy implementation to preemptively address them. This study evaluates carbon peaking and carbon neutrality policies, contributing in three main ways. First, it employs text mining techniques to conduct a thorough analysis of these policies, offering a more comprehensive view and data-driven support, thereby enhancing the depth and accuracy of policy evaluations. Second, it develops a quantitative evaluation framework using the PMC-Index model to systematically assess the textual quality of these policies, providing an innovative methodology for related research. Third, through empirical analysis, it selects 15 representative carbon peaking and carbon neutrality policies, comprehensively evaluating the pros and cons of these policy texts, offering new insights and recommendations for policy adjustment and optimization. Moreover, this study not only supports the adjustment of China’s carbon peaking and carbon neutrality policies; it also serves as a reference for global climate governance research and practice, promoting further international communication and cooperation in policy-making. Through these evaluations, policy-makers can receive more accurate decision-making support, driving the effective implementation of carbon peaking and carbon neutrality policies and ultimately achieving global climate change mitigation goals.
The structure of this paper is as follows: Section 2 reviews the theories and contributions of existing studies; Section 3 describes the data sources and the development of the PMC-Index model; Section 4 presents representative carbon peaking and carbon neutrality policies, followed by the calculation and evaluation of their PMC-Index scores; Section 5 concludes the paper and discusses future prospects.

2. Literature Review

The literature review of this paper consists of two parts. The first part covers “Research on Carbon Peaking”, and the second part focuses on “Research on Policy Evaluation”. By combining research insights from these two areas, we can achieve a deeper understanding of carbon peaking, carbon neutrality, and policy evaluation.

2.1. Research on Carbon Peaking

Carbon peaking refers to the moment when carbon dioxide emissions hit their highest level in a particular year and then begin to decline. Carbon neutrality refers to achieving a state where the carbon dioxide emissions produced by a specific organization over a certain period are balanced out and offset by natural or artificial methods, such as afforestation, ocean absorption, and engineering sequestration, ultimately resulting in net “zero emissions” of carbon dioxide resulting from human activities. In the practice of carbon peak and carbon neutrality, the European Union, the United Kingdom, Norway, and Uruguay have achieved significant results and set clear policy goals. The EU has planned to reduce greenhouse gas emissions by at least 55% compared to 1990 levels by 2030 and aims to achieve climate neutrality by 2050 through the European Green Deal and the Emissions Trading System (ETS). The UK has set a target of achieving net-zero emissions by 2050 under the Climate Change Act and plans to implement the Carbon Border Adjustment Mechanism (CBAM) from 2027 to promote industrial decarbonization. Norway set a goal of achieving carbon neutrality by 2030 as early as 2009 and has been promoting emission reductions through measures such as carbon taxes and carbon capture and storage (CCS) projects. Uruguay also submitted its Long-Term Climate Strategy for 2050 in 2021, planning to achieve carbon neutrality through policies like carbon taxes and renewable energy subsidies. The policy practices of these countries and regions have provided valuable experience for global climate change mitigation.
Since China set its carbon peaking and carbon neutrality targets, academic research has emerged from a range of perspectives, disciplines, and levels. Initially, research focused on the theoretical framework of these goals, which are grounded in the concept of sustainable development and represent tangible expressions of this principle. A review of China’s low-carbon development trajectory shows that “carbon peaking and carbon neutrality” reflect the natural progression of the country’s low-carbon development strategy. An analysis of the underlying logic of this strategy reveals three key characteristics: First, the objectives are under increasing reinforcement, with an exceptionally high strategic level and rapid implementation pace; second, the objectives have evolved from being implicit to becoming central targets; third, the objectives are becoming more diversified and structured, encompassing energy conservation, optimization of the energy structure, control of total energy consumption, reduction of carbon intensity, and overall carbon control [5]. The mechanism for achieving carbon peaking and carbon neutrality consists of systemic reform mechanisms, energy transformation mechanisms, controls on total energy consumption and energy use intensity, and incentive mechanisms that combine government and market forces [6]. China’s path to carbon neutrality includes controlling carbon emissions, enhancing carbon sinks, advancing key technologies, and securing policy support. Through energy transformation, energy conservation, carbon capture and storage (CCUS), ecological restoration, zero-carbon utilization, and innovations in coal and new energy coupling and energy storage, a comprehensive system solution is being formed. Concurrently, the carbon trading market law is being refined, corporate carbon emission standards are being developed, and public awareness campaigns are being strengthened. China will also promote a low-carbon circular economy, accelerate energy transformation, and foster green technological innovation to achieve its carbon peaking and neutrality goals [7]. Achieving these objectives necessitates the implementation of long-term low-carbon strategies, including industrial restructuring, shifting towards a green and low-carbon circular economy, enhancing energy efficiency in end-use sectors, promoting the substitution of electricity and hydrogen in power generation and transportation, expediting the decarbonization of the energy mix, and reducing non-CO2 greenhouse gas emissions [8]. From an industry-specific standpoint, the coal sector is a critical driver of China’s economic growth and plays a pivotal role in achieving the country’s carbon peaking and carbon neutrality objectives [9]. The sustainability-oriented scenario represents a low-carbon development state that the coal industry can attain through more comprehensive and proactive efforts to meet socio-economic development goals. It also offers a viable pathway for achieving carbon peaking and carbon neutrality. Electricity, as a primary non-fossil energy source, has the potential to eventually replace fossil fuel-based power generation. The rapid expansion of wind and solar energy is crucial for China in reaching its carbon neutrality targets. Additionally, carbon capture and storage (CCS) technology plays a significant role in the global transition to carbon neutrality [10]. For developing countries like China, where economic growth is heavily reliant on fossil energy consumption, advancing carbon sequestration technology is essential for achieving substantial reductions in carbon emissions [11]. Improvements in agricultural infrastructure and human capital have positively contributed to the growth of agricultural eco-efficiency, while public investment in agricultural in agricultural research and development (R&D) and industrial structure has produced a detrimental effect. Therefore, green-oriented policies that address regional differences, alongside targeted agricultural public investments, are essential for both reducing agricultural carbon emissions and enhancing agricultural eco-efficiency [12]. The synergistic relationship between digital finance and green technological innovation plays a crucial role in enhancing local carbon emission efficiency, and China should focus on strengthening the integration of digital finance with green technology and develop tailored policies and measures based on local conditions to improve urban carbon emission efficiency [13]. In conjunction with carbon peaking and carbon neutrality policies, national land use planning must establish essential technical reserves, such as multi-scenario simulations. Moving forward, it is crucial to understand the interplay between land use/land cover (LULC) and carbon storage (CS) in the allocation of land resources and the optimization of ecosystem functions. This understanding will enable dynamic adjustments to land use planning to support sustainability goals [14,15]. Some studies have constructed a framework to assess the synergy of carbon neutrality policies from the perspectives of policy content, issuers, and temporal dimensions. By employing text mining techniques and network analysis methods, these studies quantify policy synergy based on 224 carbon neutrality policies issued by the Chinese government [16]. Other studies have determined the scale, scope, and key contributions of various social science disciplines to carbon neutrality through scientometric analysis and a systematic review of recent literature, based on articles from the Web of Science database. These studies identify a range of disciplines that focus on both common and distinct aspects of carbon neutrality. By highlighting potential areas for future research and policy development, they provide insights into achieving a net-zero or post-carbon future [17].

2.2. Research on Policy Evaluation

Evaluation in public policy can be broadly defined as an analytical tool and process with two primary objectives: First, as an analytical tool, evaluation research involves examining a policy program to gather comprehensive information relevant to assessing its performance, including both processes and outcomes; second, as a phase in the policy cycle, evaluation refers to the communication of these findings back to the policy-making process [18]. Policy evaluation enables policymakers to identify existing issues and draw insights from past experiences, thereby informing improvements in the development of future policies [19]. Broadly speaking, policy evaluation methods can be classified into two categories: qualitative and quantitative. Qualitative methods rely on expert judgment and experience, while quantitative methods employ data and mathematical models to minimize subjectivity and increase precision in policy assessment. Current research largely focuses on quantitative approaches for ex-post evaluation of public policy implementation, such as Life Cycle Assessment (LCA), the TRANSECON method, regression models, matching techniques, synthetic control, and others [20,21,22]. However, there is limited development of quantitative methods for ex-ante or early-stage policy evaluation, leaving a gap in this area. The Policy Modeling Consistency Index (PMC-Index) model provides a quantitative framework for assessing policy effectiveness. It leverages text mining to extract relevant data, considers a range of influencing factors, and assigns equal weight to each variable, which helps mitigate subjectivity. This model is particularly useful for evaluating the consistency of newly implemented or early-stage policies, enabling timely optimization and correction of policy content. It addresses the limitations of ex-post evaluations and, when combined with mid-term and ex-post assessments, creates a comprehensive feedback loop in policy evaluation, from narrow to broad analyses of public policies. The PMC-Index model, introduced by Ruiz Estrada et al. [23], can also compute policy evaluation outcomes and visualize them using tools such as surface charts, radar charts, and other graphical representations [24]. Essentially, the PMC-Index model serves two primary functions: measuring the consistency of policy models and visualizing their strengths and weaknesses. Currently, the application of the PMC-Index model spans various sectors, including high-tech industry policies [25], China’s basin ecological compensation policies [26], Chinese medicine development policy [27], biogenetic resources conservation policies [28], long-term care insurance policies [29], national park policies [30], and employment promotion policies for college graduates [31]. Some studies have also combined the PMC-Index model with other methodologies to enhance policy analysis. For instance, the PMC–AE model integrates the PMC-Index with autoencoder (AE) technology [32], while others have merged the PMC-Index with the Latent Dirichlet Allocation (LDA) method to create the LDA–PMC model [33]. This study applies the PMC-Index model to evaluate China’s carbon peaking and carbon neutrality policies for several reasons: First, the PMC-Index model is well-suited for the timely evaluation of recently issued policies, making it ideal for assessing China’s new carbon peaking and neutrality policies; second, the model incorporates various influencing factors, reducing the risk of biased evaluations; third, it helps identify the internal consistency, strengths, and weaknesses of policy texts, facilitating a deeper analysis of their unique characteristics and issues. Ultimately, this model supports the refinement and improvement of China’s carbon peaking and neutrality policies. In conclusion, the PMC-Index model offers policy-makers and researchers a valuable tool for a more scientific and objective evaluation of public policies.

3. Research Design

3.1. Data Sources

The “Action Plan for Carbon Peaking by 2030”, issued by the State Council, serves as the cornerstone document in the “1+N” policy framework. It outlines the strategic actions necessary to achieve the carbon peaking goal by 2030. On 20 October 2023, the National Development and Reform Commission (NDRC) released the “National Carbon Peak Pilot Construction Plan” (Development and Reform Commission Circular [2023] No. 1409), which advocates for the selection of cities and industrial parks with typical characteristics in implementing carbon peak pilot programs. These pilots are intended to address key obstacles in green and low-carbon development and to provide replicable, scalable, and operable solutions. Conducting these pilot projects is crucial for promoting the transformation and upgrading of the economic structure, fostering competitive advantages in green and low-carbon industries and ensuring the achievement of carbon peaking and carbon neutrality objectives. When selecting the initial batch of pilot areas, the “National Carbon Peak Pilot Construction Plan” considered factors such as the total carbon emissions and growth trends in each region, economic and social development conditions, and geographical distribution across eastern, central, and western China. The first round of pilot projects includes 15 provinces and regions, covering major economic and energy-consuming areas like Guangdong, Jiangsu, Shandong, Zhejiang, and Henan, as well as energy-rich provinces such as Shanxi, Shaanxi, Inner Mongolia, and Xinjiang. It also includes regions with significant industrial and manufacturing sectors, including Hebei, Liaoning, Heilongjiang, Anhui, Hubei, and Hunan.
Based on the “National Carbon Peak Pilot Construction Plan”, this study analyzes the carbon peaking implementation plans from the 15 selected provinces, autonomous regions, and municipalities, totaling 15 policy samples (see Table 1). These policy texts were sourced from the official websites of local governments to ensure their authority. It is important to note that Zhejiang, Hubei, Xinjiang, and Heilongjiang have not published carbon peaking implementation plans explicitly named after their regions. As a result, this study selected broader, influential policies, such as the “Action Plan for Technological Innovation in Carbon Peaking and Carbon Neutrality” and the “Carbon Peaking Implementation Plan in Urban and Rural Construction”, as representative policy samples for these regions.

3.2. Identification of Basic Policy Features

Policies are typically conveyed through textual forms, with underlying connotations and references embedded in the policy texts themselves. The textualization of policies serves to eliminate ambiguity and controversy, rendering the policy content clearer and more authoritative. This process transforms public policies into practical instruments for implementing abstract governance in human society. Policy texts fulfill four primary functions: conveying ideas and shaping political discourse; providing top-level design and strategic planning; regulating behavior and managing society; allocating tasks and facilitating political communication. By conducting a detailed analysis of policy texts, key policy elements can be scientifically and accurately extracted, forming the basis for selecting indicators and designing variables. In this study, 15 policy texts were consolidated into a single TXT document totaling 178,412 words. The document was then imported into the text analysis software ROSTCM6.0 for lexical processing. After performing Chinese word segmentation, custom word inclusion, synonym merging, and stop word removal, non-significant high-frequency words—such as place names, directional terms, and general verbs like “increase”, “promote”, and “utilize”—were excluded as they hold no relevance for the further modeling and analysis of policy characteristics. Following this, a total of 298 words that appeared 40 times or more were identified. Using Price’s formula to set a threshold for high-frequency words, 30 words that occurred more than 241 times were selected (Table 2). Based on this analysis, this study extracts the key concerns and preferences of policymakers regarding carbon peaking and carbon neutrality. Table 2 shows that the primary focus of the carbon peaking implementation plan policy texts revolves around themes such as green development, low-carbon, the construction and utilization of renewable energy, technological innovation and research support, promotion of key sectors and projects, enhancement of corporate and management systems, ecological preservation and environmental enhancement, and the achievement of carbon neutrality and long-term goals.
Word frequency analysis reflects the keywords frequently mentioned by policy-makers [34], highlighting the important conditions and key factors considered by decision-makers in the process of achieving carbon peaking and carbon neutrality goals. The high-frequency terms extracted from the policy texts provide insight into the priorities and objectives set forth in the carbon peaking implementation plans. The analysis identifies seven core areas of focus. First, green development and low-carbon transition: Terms like “Green”, “Development”, and “Low-carbon” are the most frequently mentioned, each occurring over 1000 times. This highlights the central role of promoting a green economic transition and achieving low-carbon development. The policy encourages various sectors, including industry, construction, and transportation, to reduce carbon emissions, with a particular emphasis on implementing green technologies in energy-intensive industries to reduce carbon footprints. Second, construction and utilization of renewable energy: High-frequency terms such as “Energy” and “Energy-saving” underscore the importance of improving energy efficiency and transitioning to clean energy. The implementation plan prioritizes the development of renewable energy sources, particularly solar and wind power, aiming to enhance energy efficiency and reduce reliance on fossil fuels. It also stresses the use of energy-saving technologies to reduce energy intensity and optimize the energy mix. Third, technological innovation and research support: The frequent appearance of words like “Technology”, “Innovation”, and “Science and Technology” signals the vital role of technological advancement in achieving carbon peaking and neutrality. The plan supports research into clean energy technologies and carbon capture and storage (CCS) technologies, promoting innovation within research institutions and enterprises. Financial incentives, including tax breaks, are provided to encourage investments in low-carbon technologies. Fourth, promotion of key sectors and projects: High-frequency terms such as “Field”, “Project”, and “Promotion” suggest that the carbon peaking implementation plan focuses on specific sectors and projects, particularly in high-emission areas like industry, construction, and transportation. The government seeks to support technological upgrades and industrial transformations in these sectors by formulating targeted project plans to accelerate the peaking process. Fifth, improvement of enterprises and management systems: Words like “Enterprise”, “Management”, and “System” reflect the significant role of businesses in achieving carbon peaking and neutrality. The policy mandates enterprises to establish carbon emission management systems, improve carbon monitoring and assessment mechanisms, and strengthen overall management. Additionally, the government promotes active participation through policy tools such as carbon trading and carbon taxes. Sixth, ecological preservation and environmental enhancement: The frequent use of terms such as “Ecology” and “Improvement” indicates that carbon peaking policies are not limited to emission reductions but also focus on ecosystem health. The policy encourages ecological restoration, protection, and the creation of carbon sinks, such as forests and wetlands. It emphasizes integrating ecological measures with carbon reduction efforts, striving for a win-win outcome for both the environment and the economy. Seventh, achievement of carbon neutrality and long-term goals: Repeated references to “Carbon Neutrality” emphasize that the ultimate goal of carbon peaking is to achieve carbon neutrality. The implementation plan balances short-term peaking efforts with long-term carbon neutrality objectives, setting clear timelines for various industries and sectors. Mid-term assessments will guide adjustments to implementation strategies, ensuring progress toward the long-term goal. In summary, the carbon peaking implementation plan focuses on promoting green and low-carbon development, expanding clean energy utilization, fostering technological innovation, and advancing key sector projects. It also emphasizes enhancing enterprise management and ecological protection, all of which can contribute to the gradual realization of carbon peaking and carbon neutrality goals across 15 pilot provinces and autonomous regions.
Network analysis and visualization offer a novel approach to understanding the relationships between key terms in the policy texts [35]. By constructing a semantic network based on high-frequency words using the data analysis software ROSTCM6.0 (Figure 1), nodes represent key terms, the size of each node is proportional to its word frequency, and the degree of connection between them is illustrated by the number of lines linking the nodes. If two words co-occur in the same context and meet the specified threshold, an arrow is drawn between them; the direction of the arrow indicates the order in which these words appear in the text. A greater number of connections indicates stronger associations between terms. Additionally, terms that are closer to the center of the network diagram have larger nodes and more connecting lines, reflecting their centrality and higher importance in the policy framework. The visualization results reveal that terms such as “Green”, “Development”, and “Low-carbon” have high centrality, indicating their significant role in the overall policy focus. These terms are centrally located in the network, reflecting the government’s emphasis on green and low-carbon development. Other key terms, including “Energy”, “Construction”, “Building”, and “Energy-saving”, are also prominently featured, reinforcing the policy’s focus on new energy development, technological innovation, and energy-saving strategies for emission reduction.

3.3. Construction of PMC-Index Model

This study employs the PMC-Index model to conduct a quantitative evaluation of the policy texts within carbon peak implementation plans. Originally developed by Estrada, the PMC-Index model is grounded in the “Omnia Mobilis” hypothesis, which asserts that all elements in the world are dynamic and interconnected. According to this hypothesis, when constructing a model, all relevant variables must be included without exception [36]. The model construction process involves four key steps: variable design and parameter identification; creation of a multi-input-output table; calculation of the PMC index; construction of the PMC surface.

3.3.1. Variable Classification and Parameter Identification

This study follows the principle of “everything is interconnected, and everything is equal” and incorporates five guiding principles in the design and construction of a comprehensive evaluation index system: guidance, completeness, scientificity, feasibility, and developmental potential [37]. By integrating high-frequency words from the Carbon Peak Implementation Plan policy texts, a policy rating index system for carbon peaking and carbon neutrality is developed (Table 3). The index system is comprised of 10 primary variables and 43 secondary variables. The primary variables include the following: Policy Perspective (X1), Policy Timeliness (X2), Policy Structure (X3), Policy Area (X4), Policy Receptors (X5), Policy Tool (X6), Policy Focus (X7), Policy Social Benefits (X8), Policy Guarantee (X9), and Policy Disclosure (X10).

3.3.2. Building a Multi-Input–Output Table

In the early-20th century, Wassily Leontief pioneered input–output analysis, a mathematical approach to studying the relationships between inputs and outputs among different activities within economic systems. Input–output models enable researchers to comprehensively understand the multidimensional relationships between policy measures at both the aggregate and local levels [38]. The PMC-Index model adopts a similar data analysis framework, utilizing multi-input–output tables to evaluate policy variables comprehensively. This approach includes both primary and secondary variables [39]. In this model, primary variables are independent of each other, while secondary variables typically range between 0 and 1, with no limit on quantity and the option to assign equal weights. This study primarily relies on the content of Carbon Peak Action Plan policies and text mining results to identify two-tier variables and design policy evaluation indicators, facilitating the construction of a multi-input–output table (Table 4).

3.3.3. PMC-Index Calculation

The calculation of PMC indices for carbon peaking and carbon neutrality policies involves four steps: First, based on the explanations of 10 primary variables and 43 secondary variables, binary values are assigned to the secondary variables using Equations (1) and (2); second, using the results of these assignments, a multi-input–output table is constructed; third, based on this table, values for the corresponding primary variables are calculated using Equation (3); fourth, PMC indices for each policy are computed using Equation (4). The preceding steps establish the multi-input–output table, while the following primarily involves computing PMC indices for each policy based on Equations (3) and (4).
X ~ N [0, 1]
X = {XR: [0~1]}
Xt   ( n j = 1 X t j n )   t = 1 ,   2 ,   3 ,   4 ,   5 ,   6 ,   7 ,   8 ,   9 ,   10
PMCr = X 1 i = 1 2 X 1 i 2 + X 2 j = 1 3 X 2 j 3 + X 3 k = 1 4 X 3 k 4 + X 4 l = 1 5 X 4 l 5 + X 5 m = 1 4 X 5 m 4 + X 6 n = 1 8 X 6 n 8 + X 7 o = 1 8 X 7 o 8 + X 8 p = 1 5 X 8 p 5 + X 9 q = 1 4 X 9 q 4 + X 10
In Equation (3), t represents the primary variable and j represents the secondary variable. In Equation (4), r denotes the policy identifier and ~ denotes the secondary variable. Based on these formulae, the PMC indices for each carbon peak implementation policy are obtained (Table 5). Drawing on existing standards for policy evaluation grading, this study categorizes the evaluation into four levels: if 0 ≤ PMC index ≤ 4.99, the policy assessment is deemed “Poor”; if 5 ≤ PMC index ≤ 6.99, the policy assessment is deemed “Acceptable”; if 7 ≤ PMC index ≤ 8.99, the policy assessment is deemed “Good”; if 9 ≤ PMC index ≤ 10, the policy assessment is deemed “Excellent”.

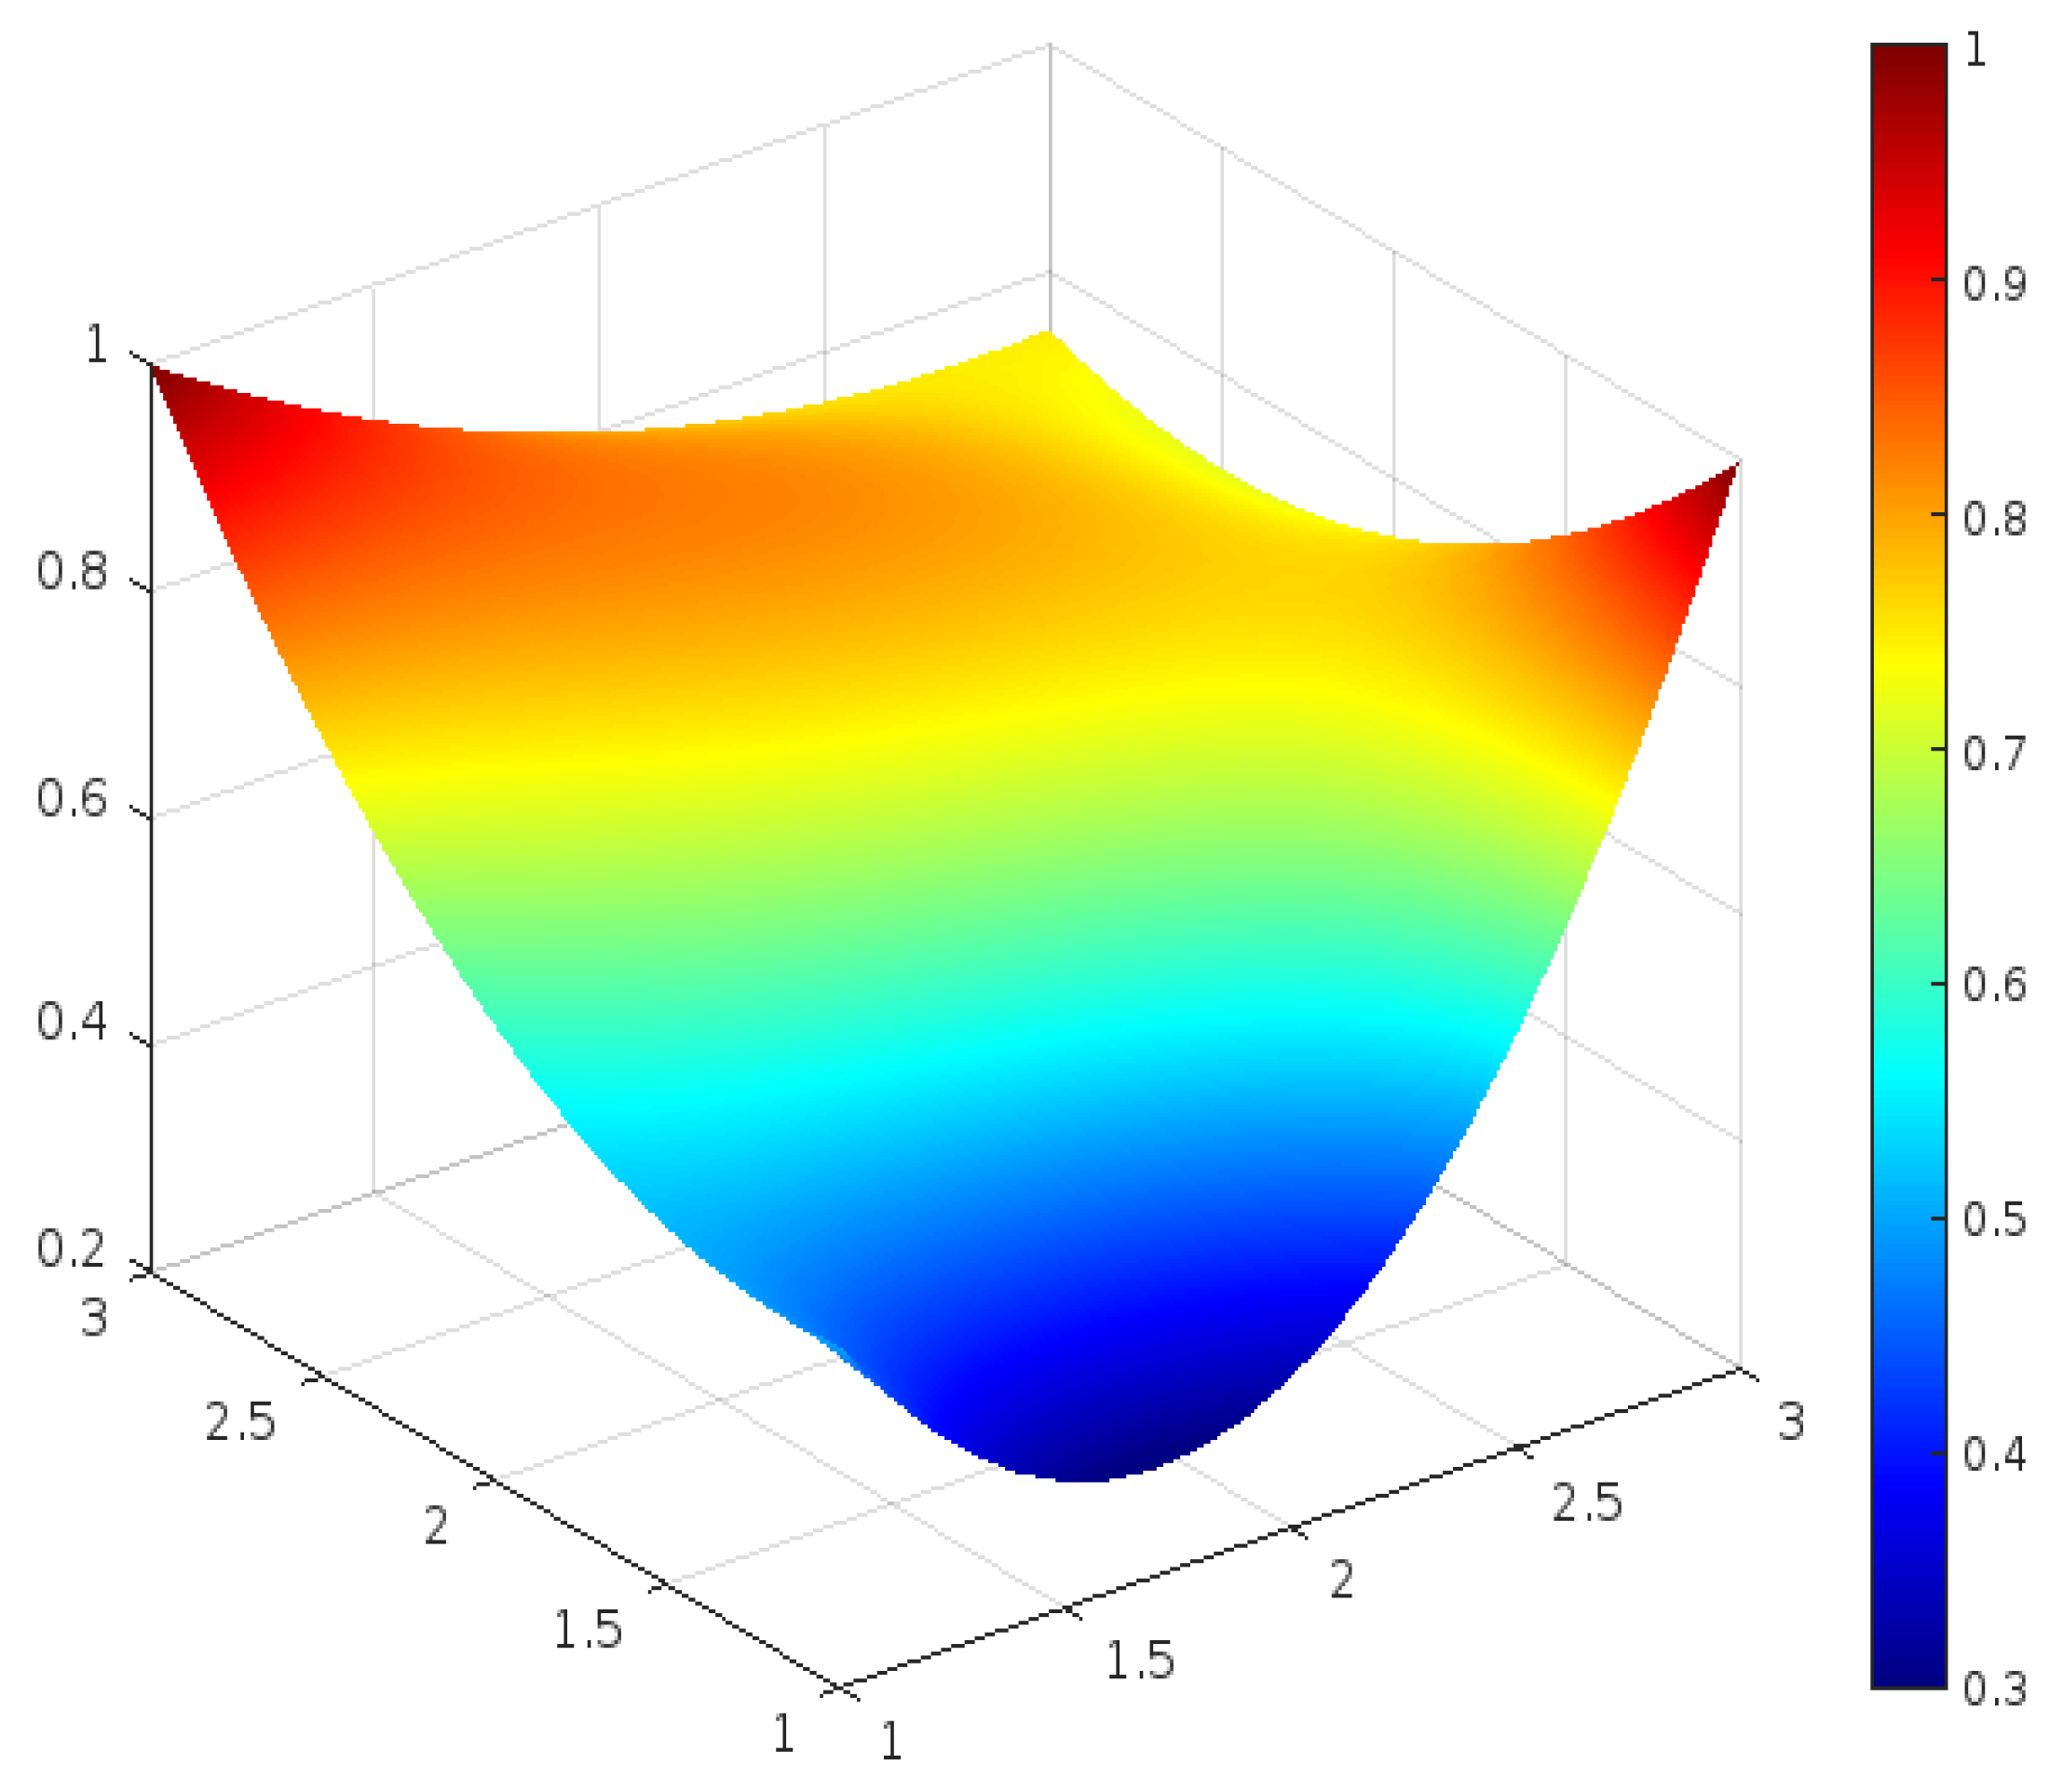
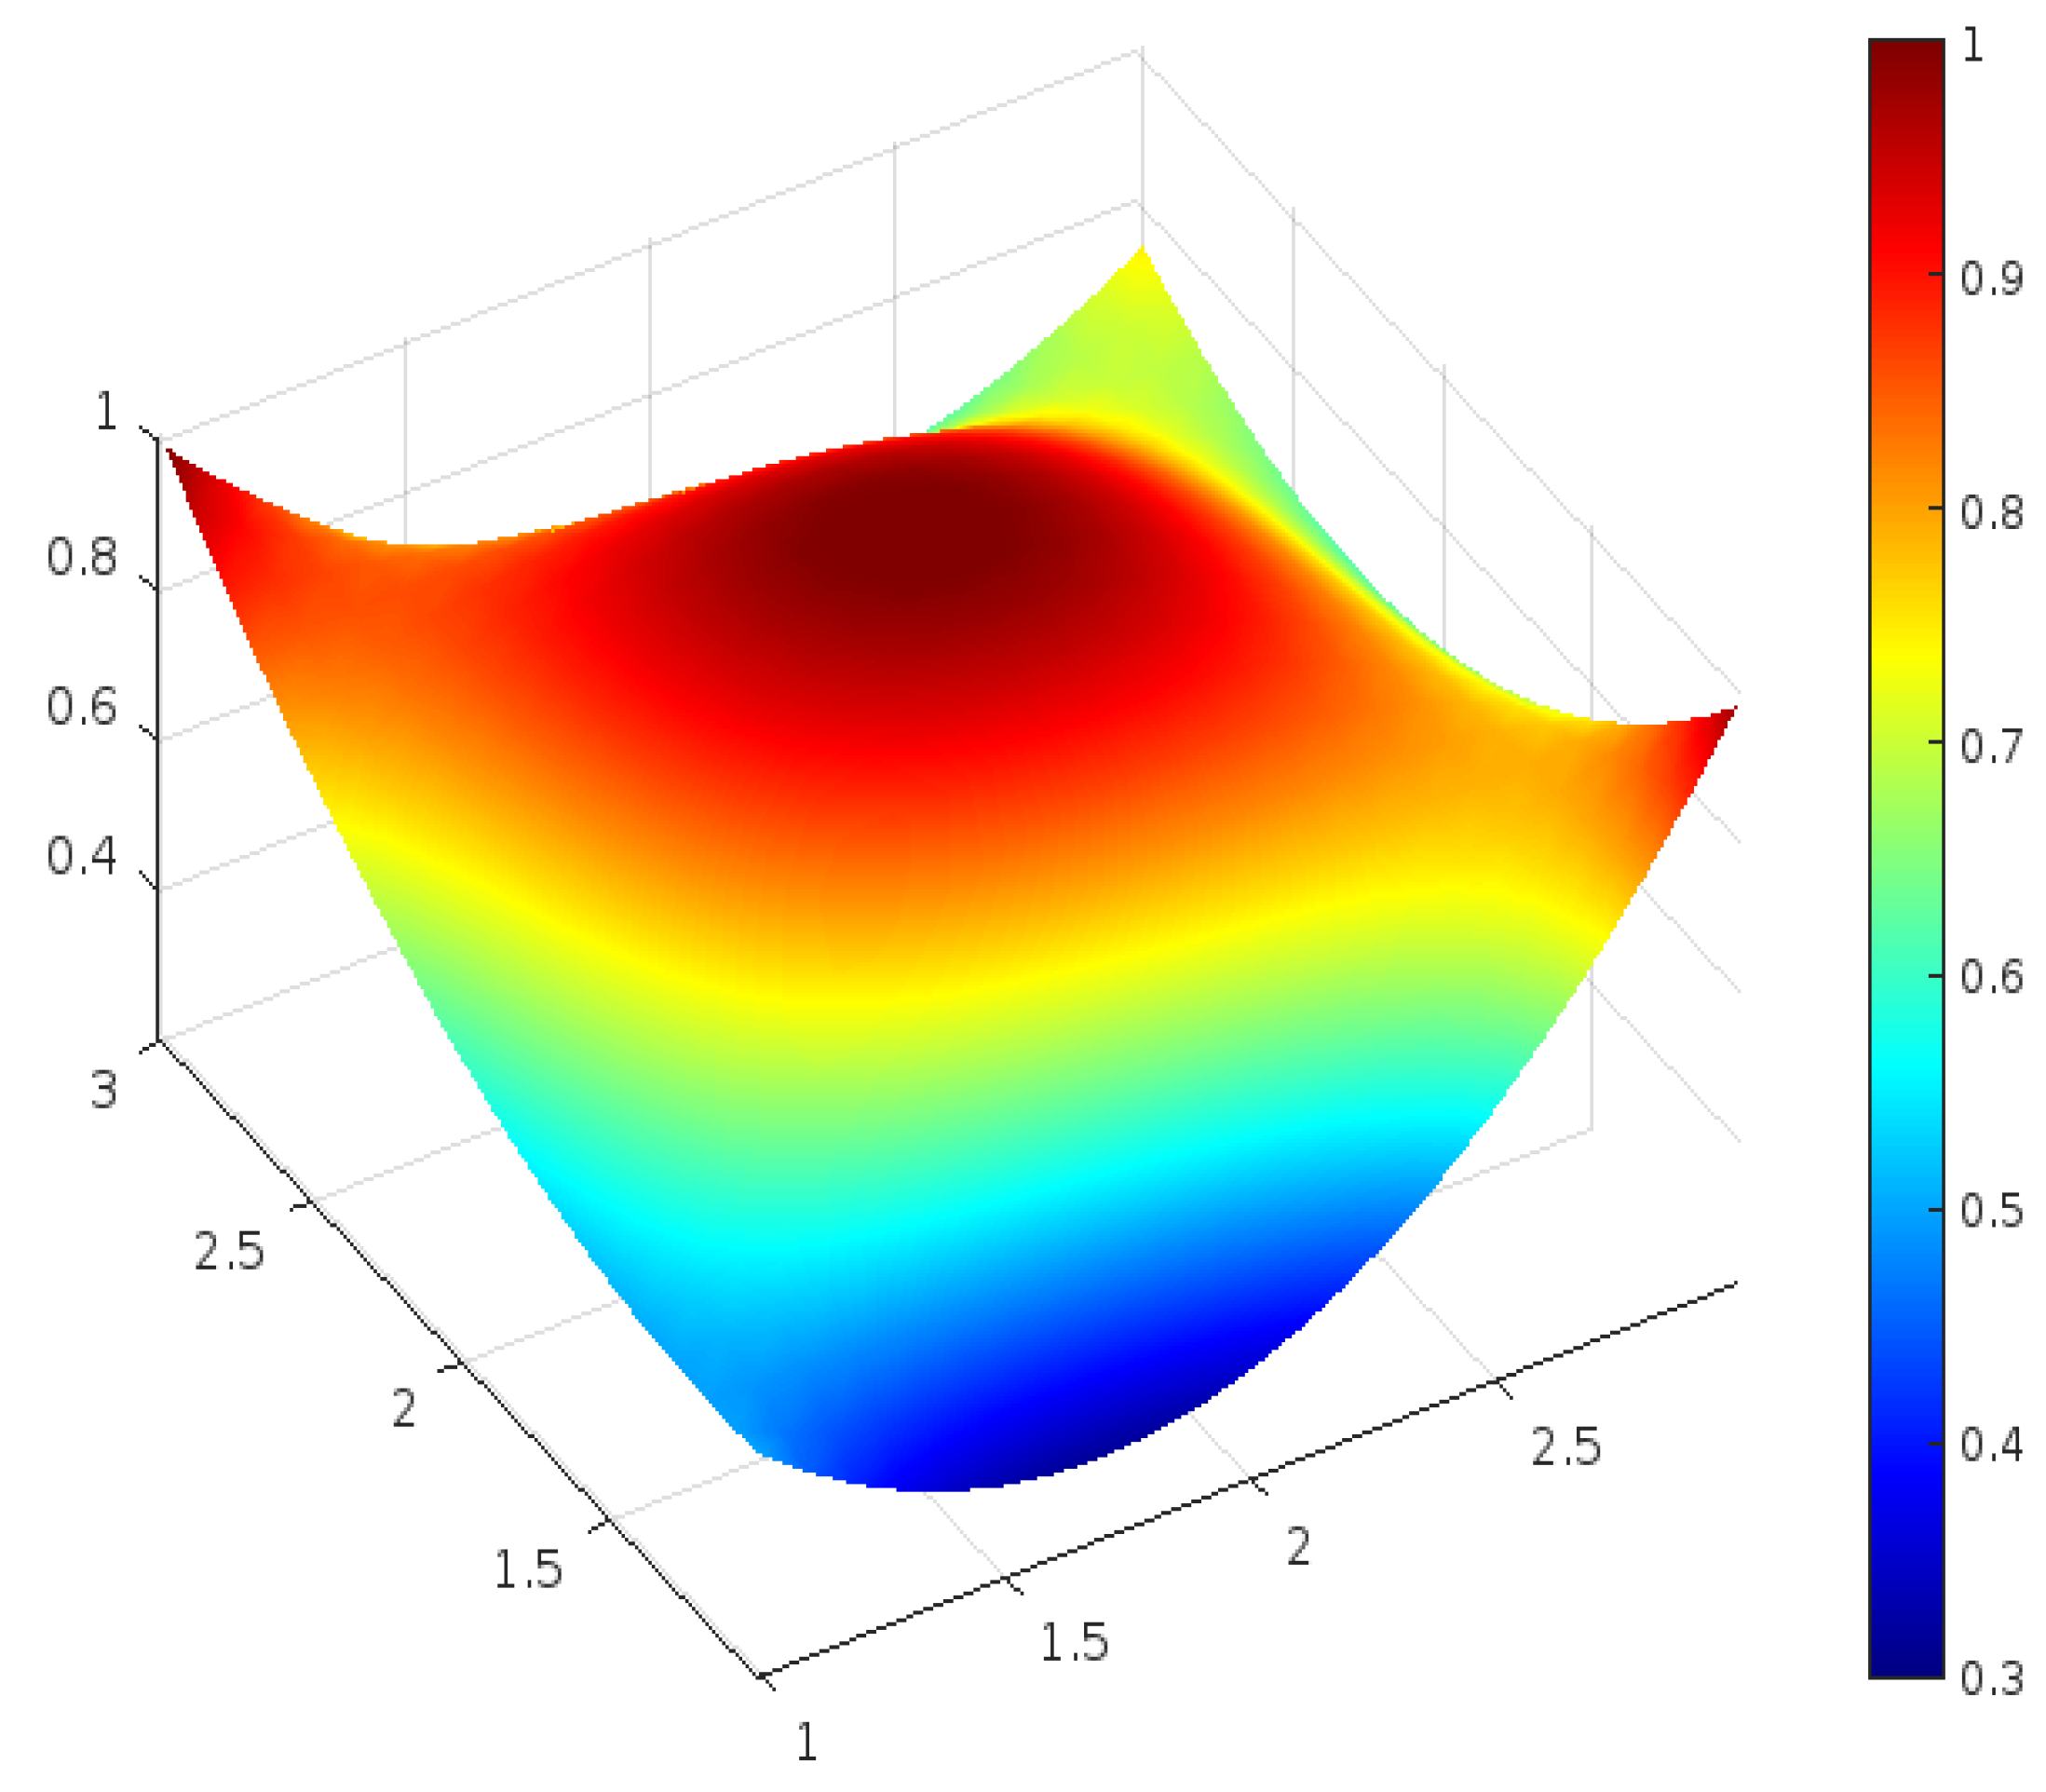
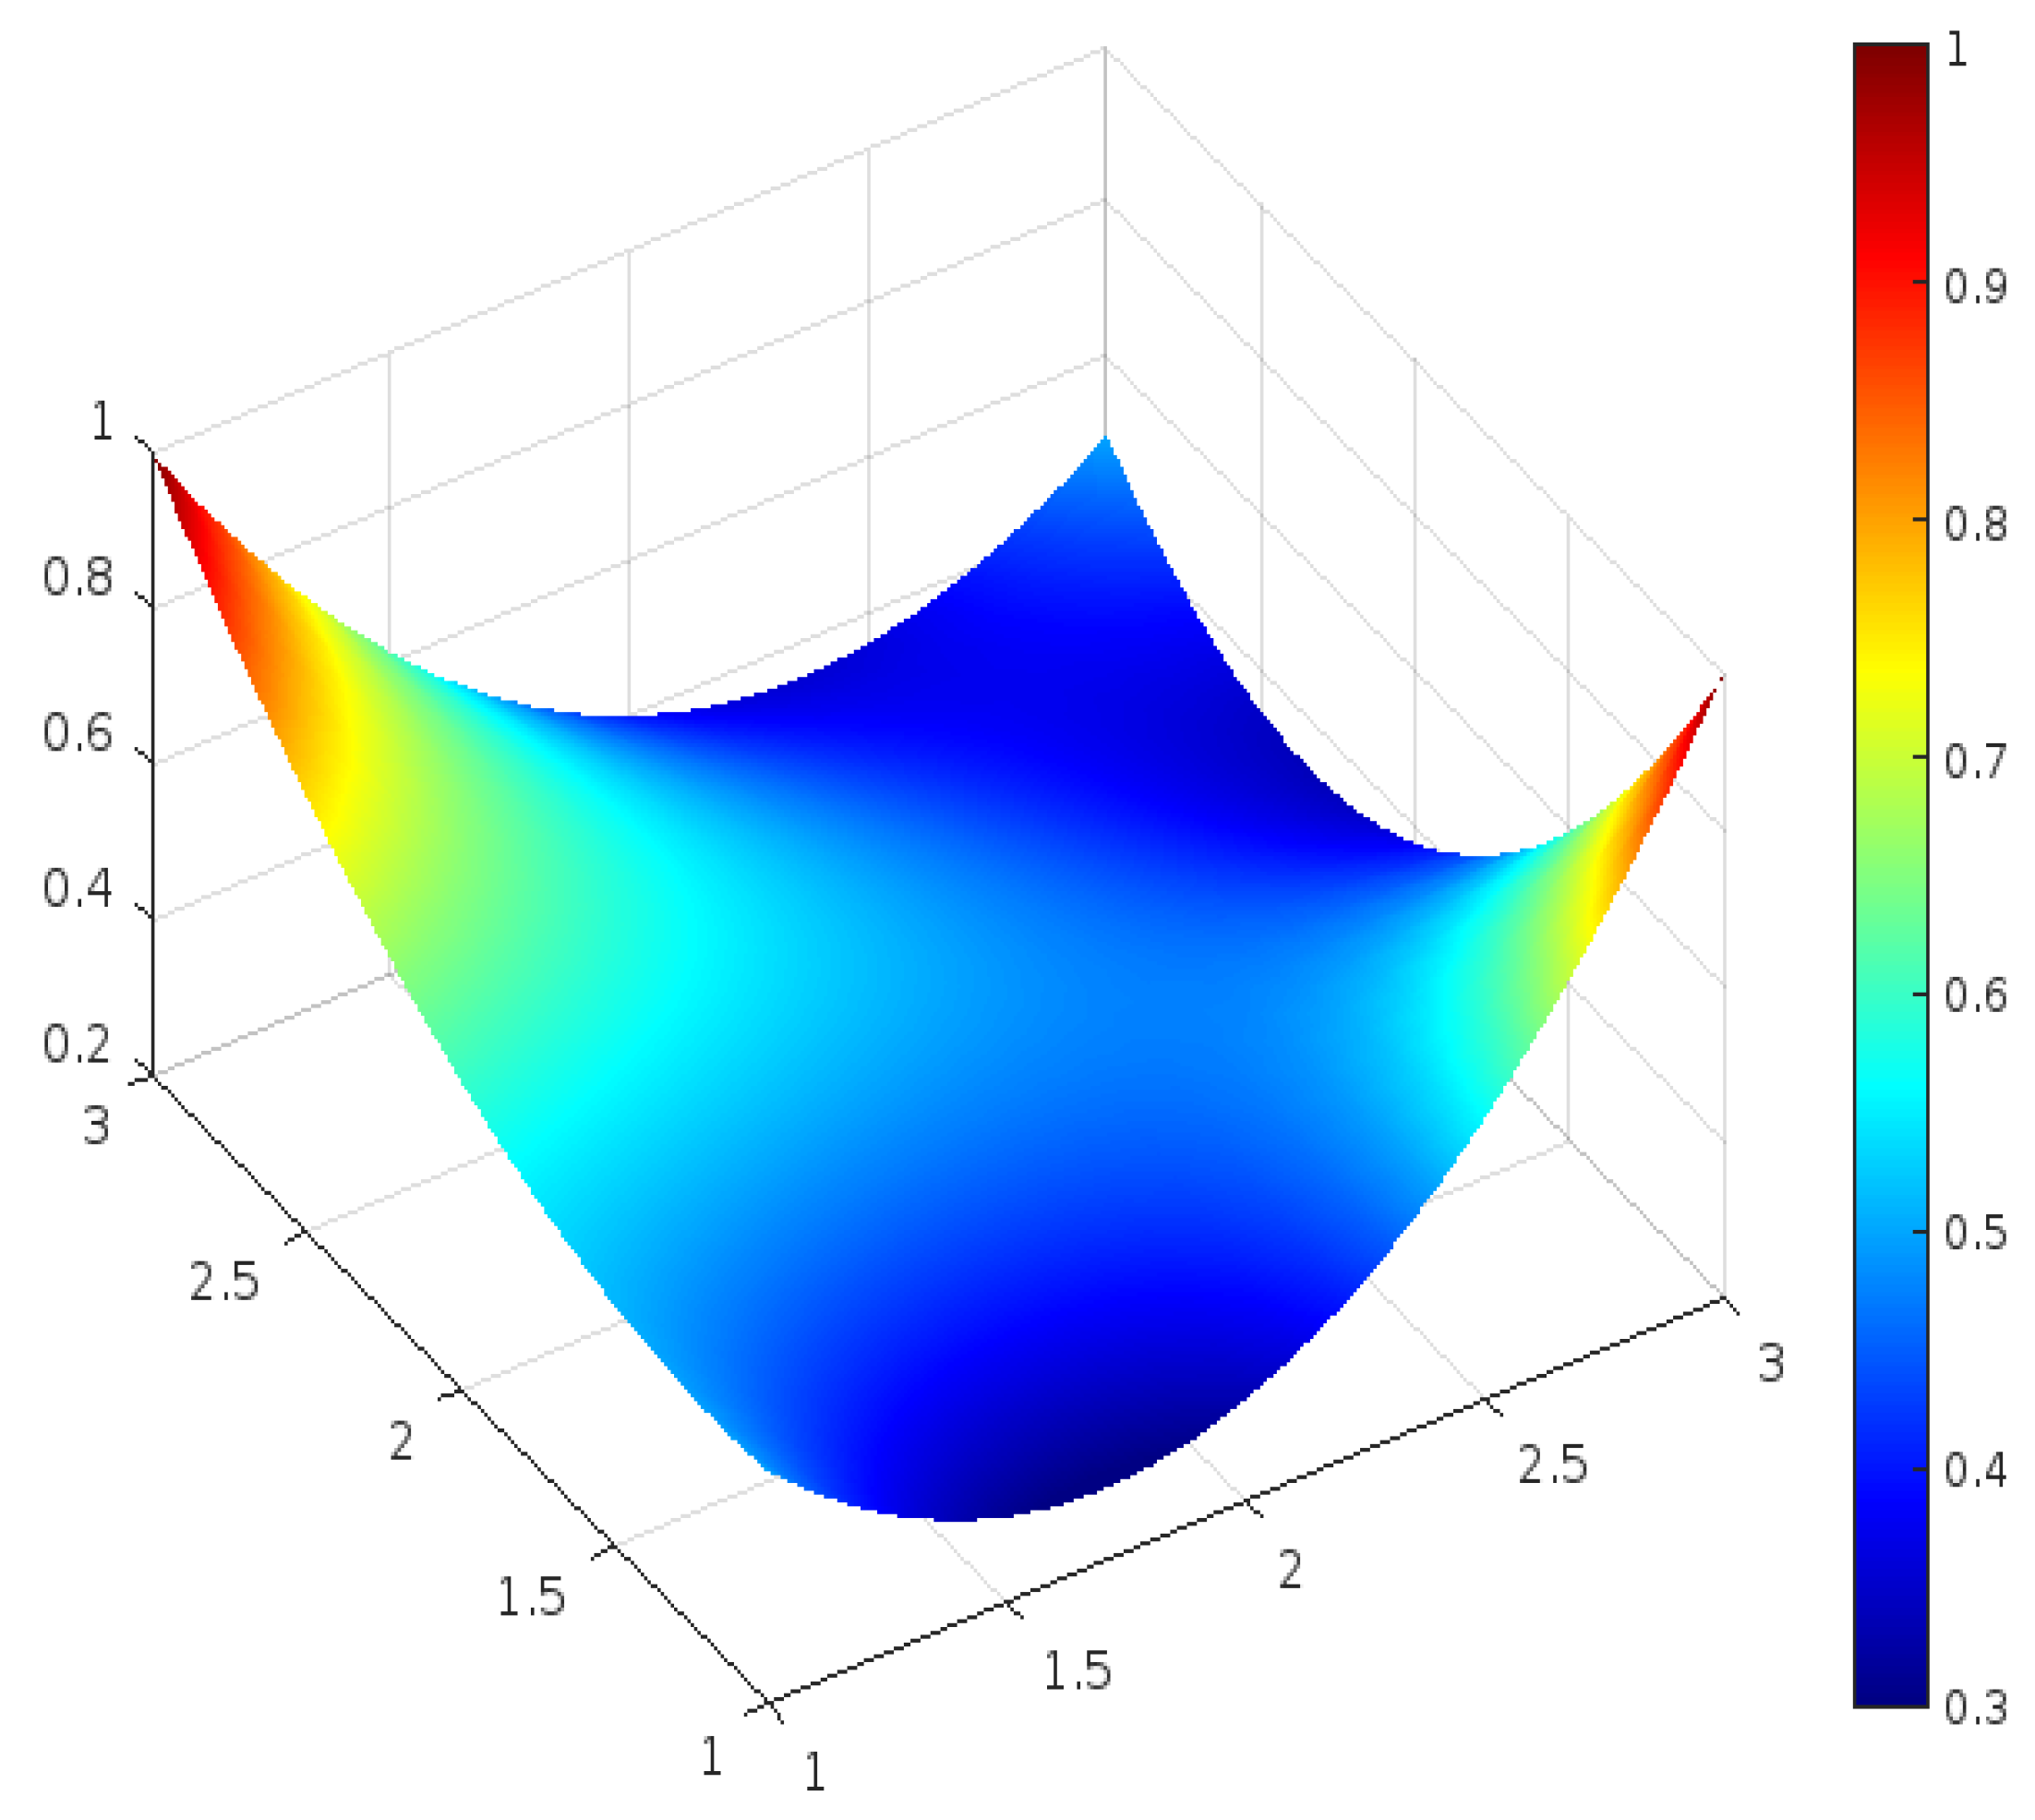
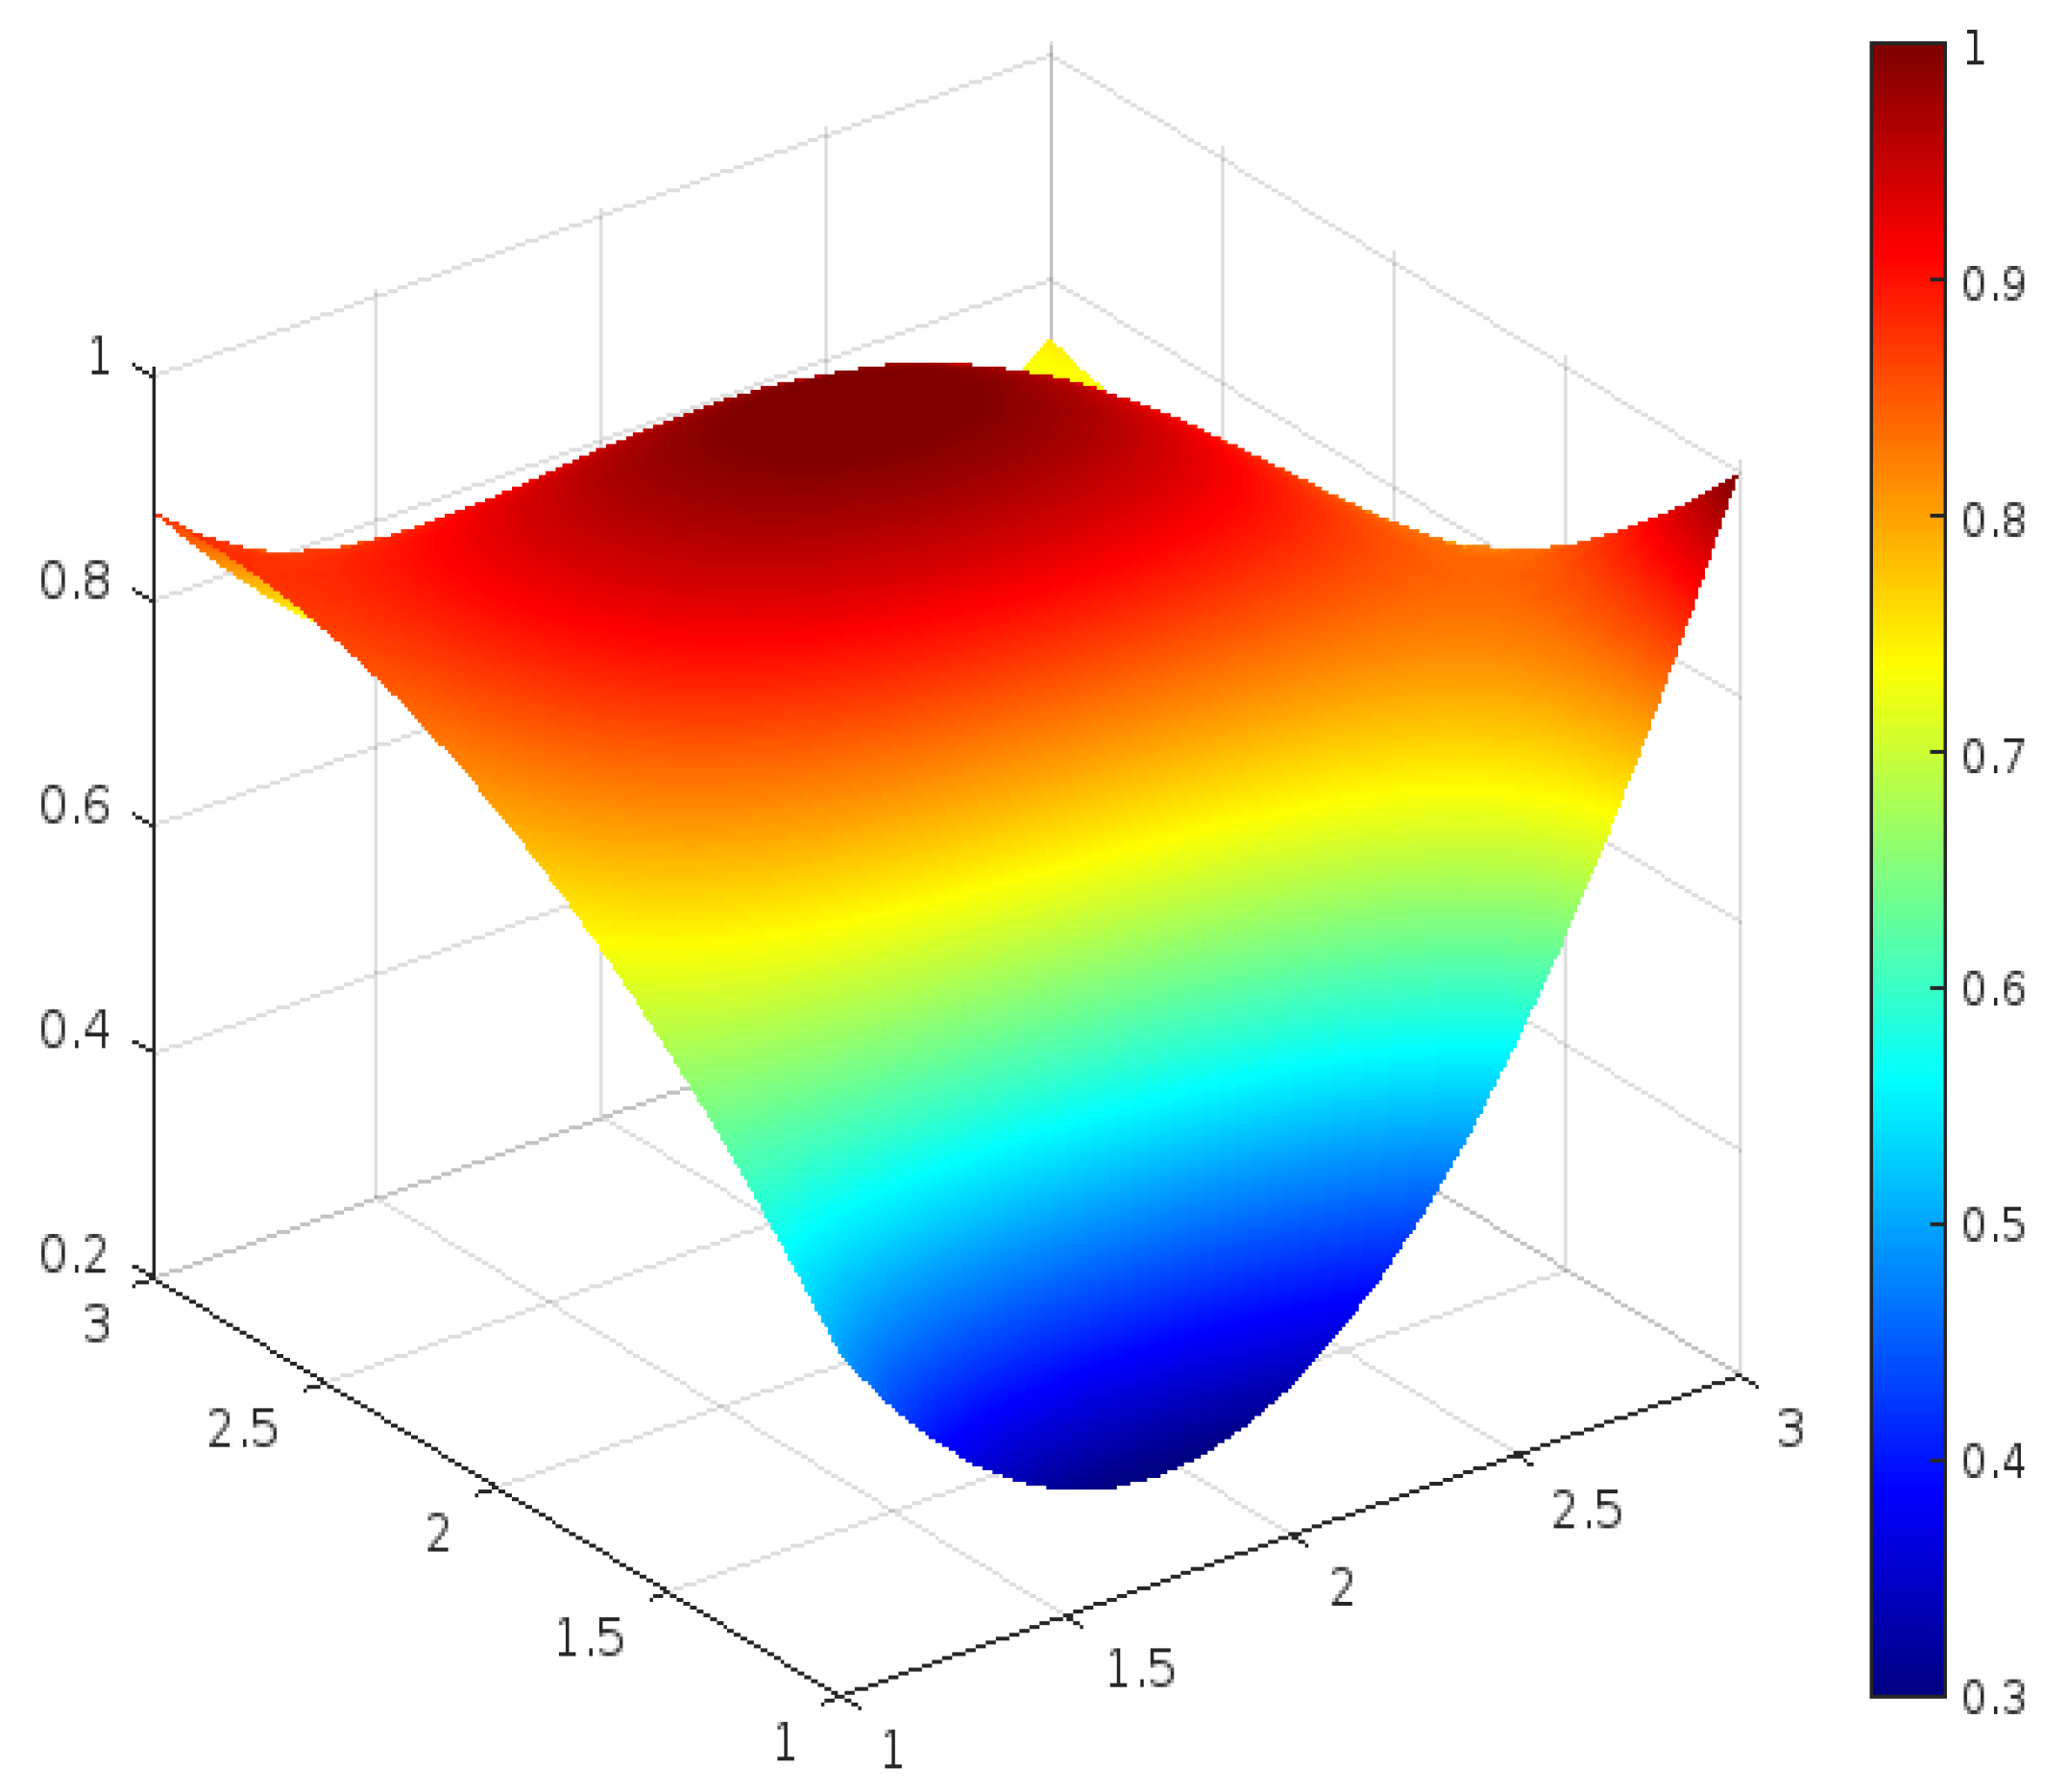
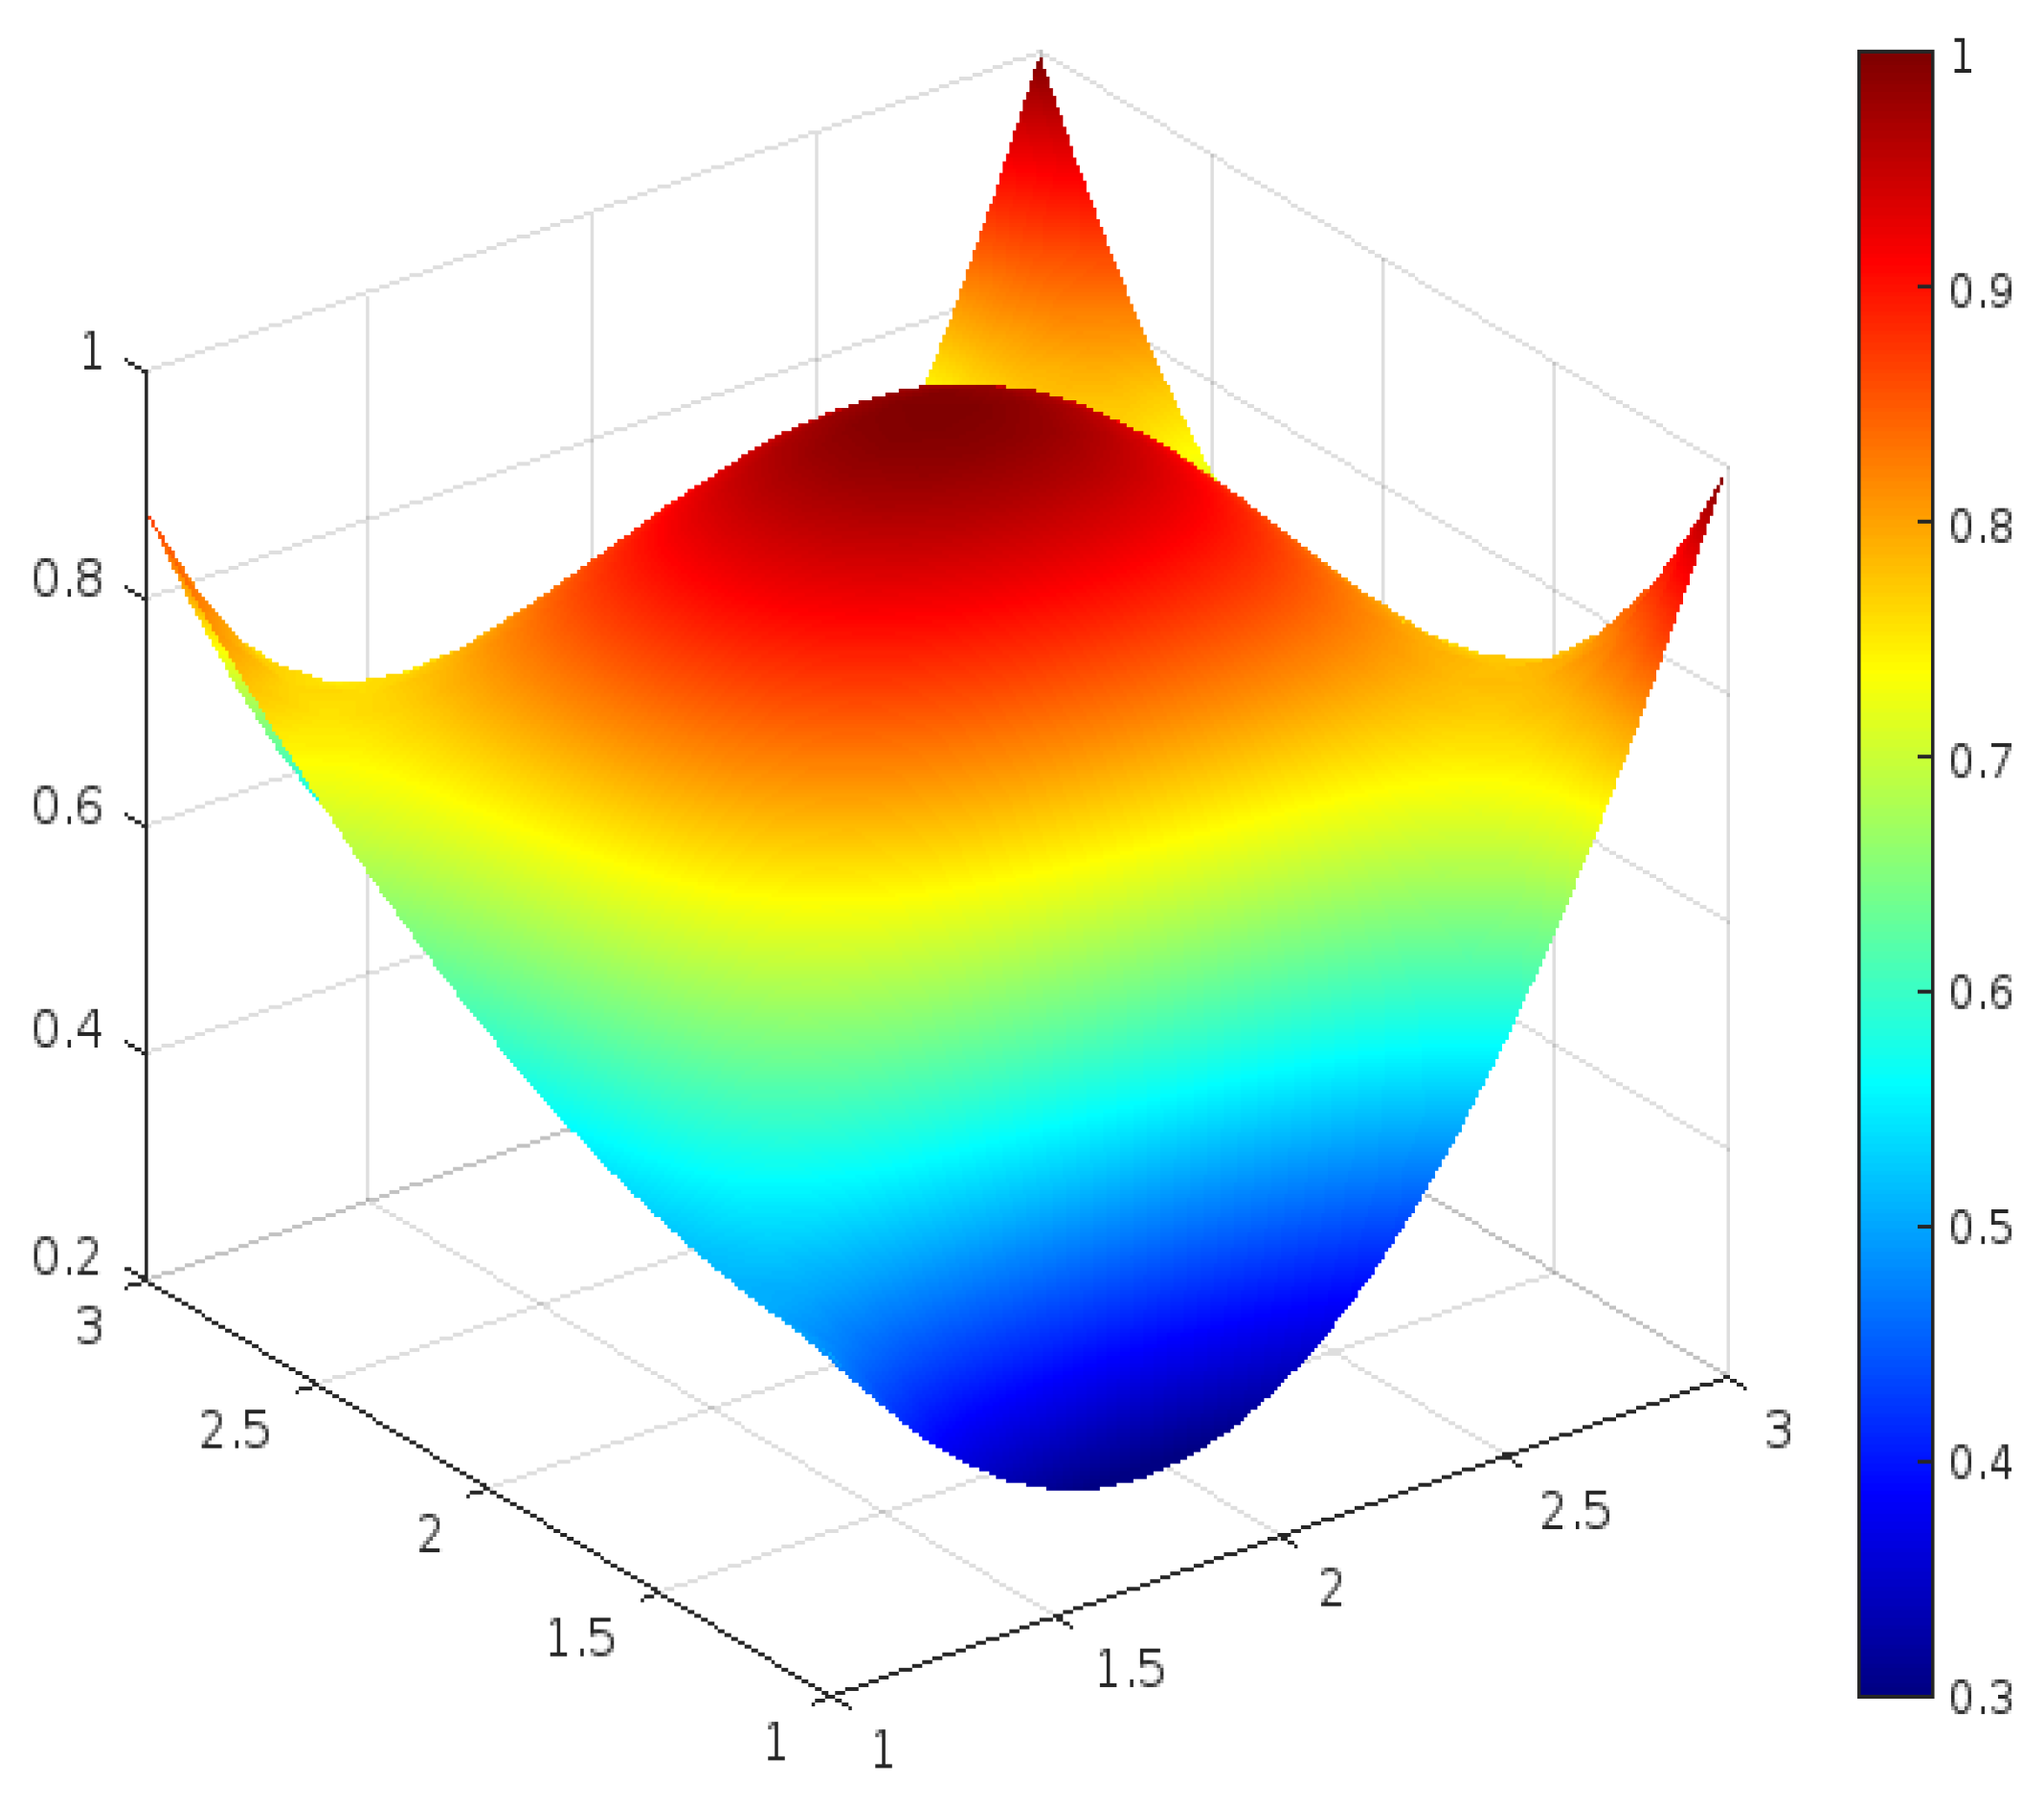
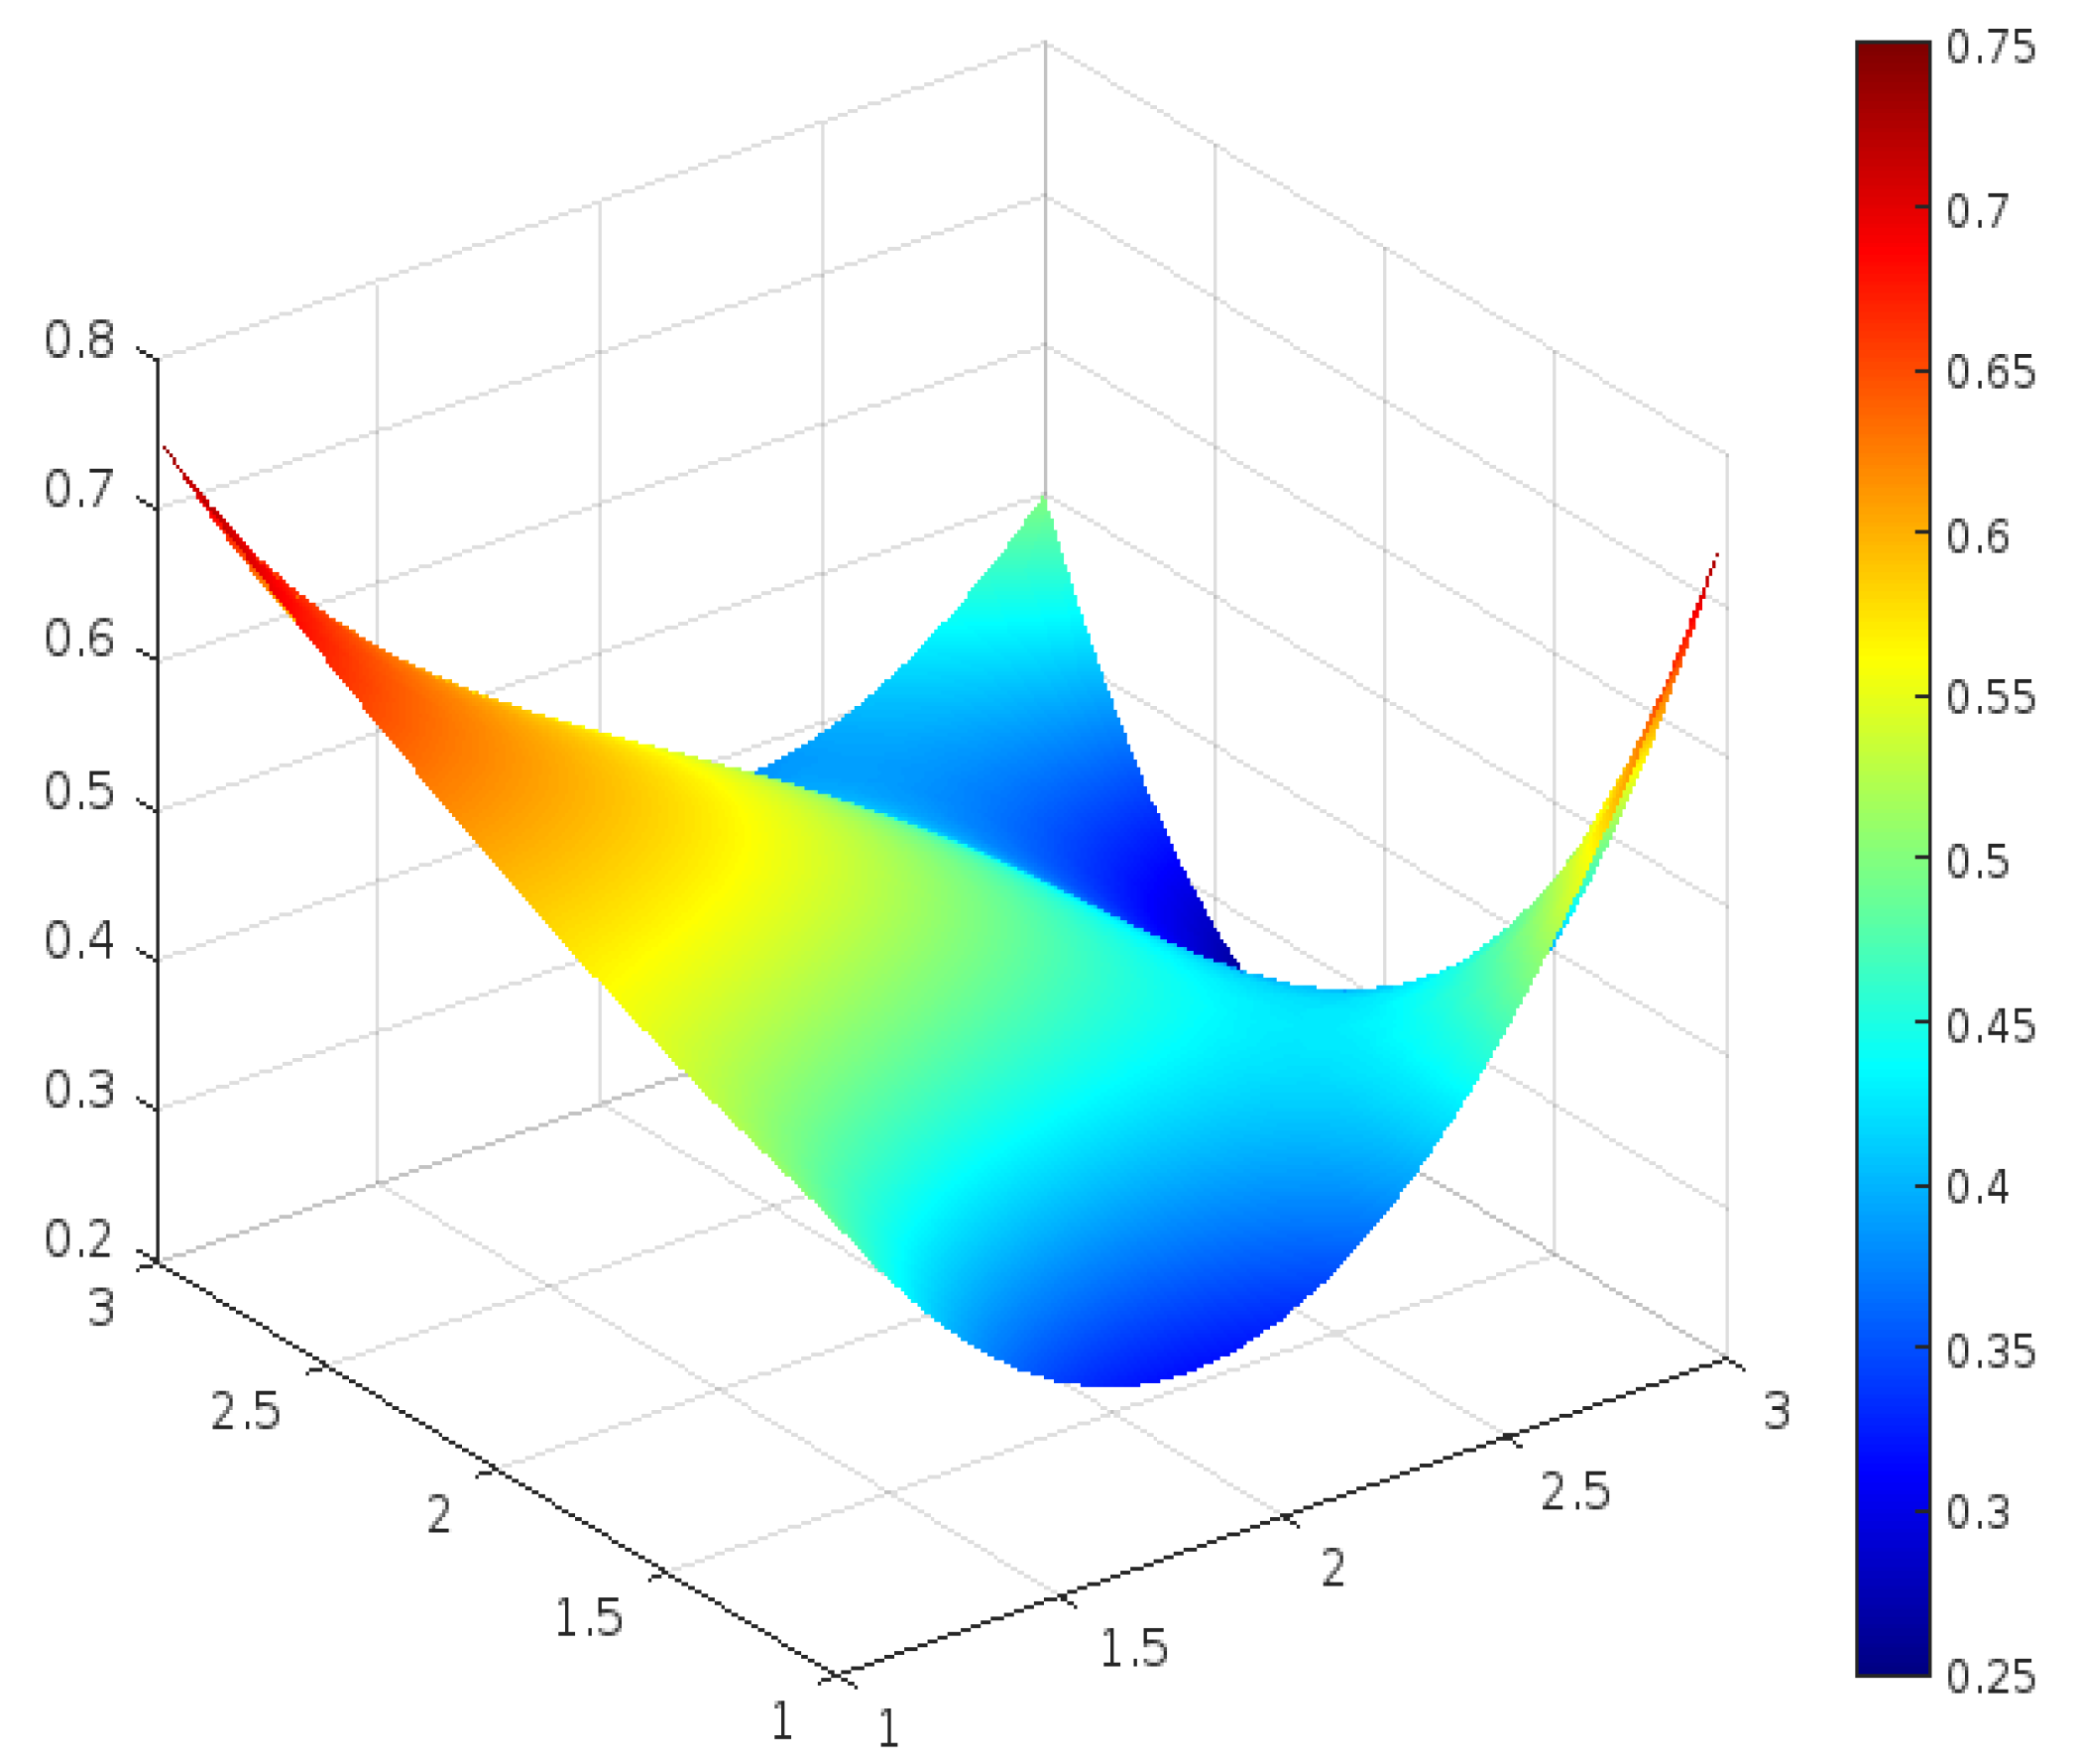
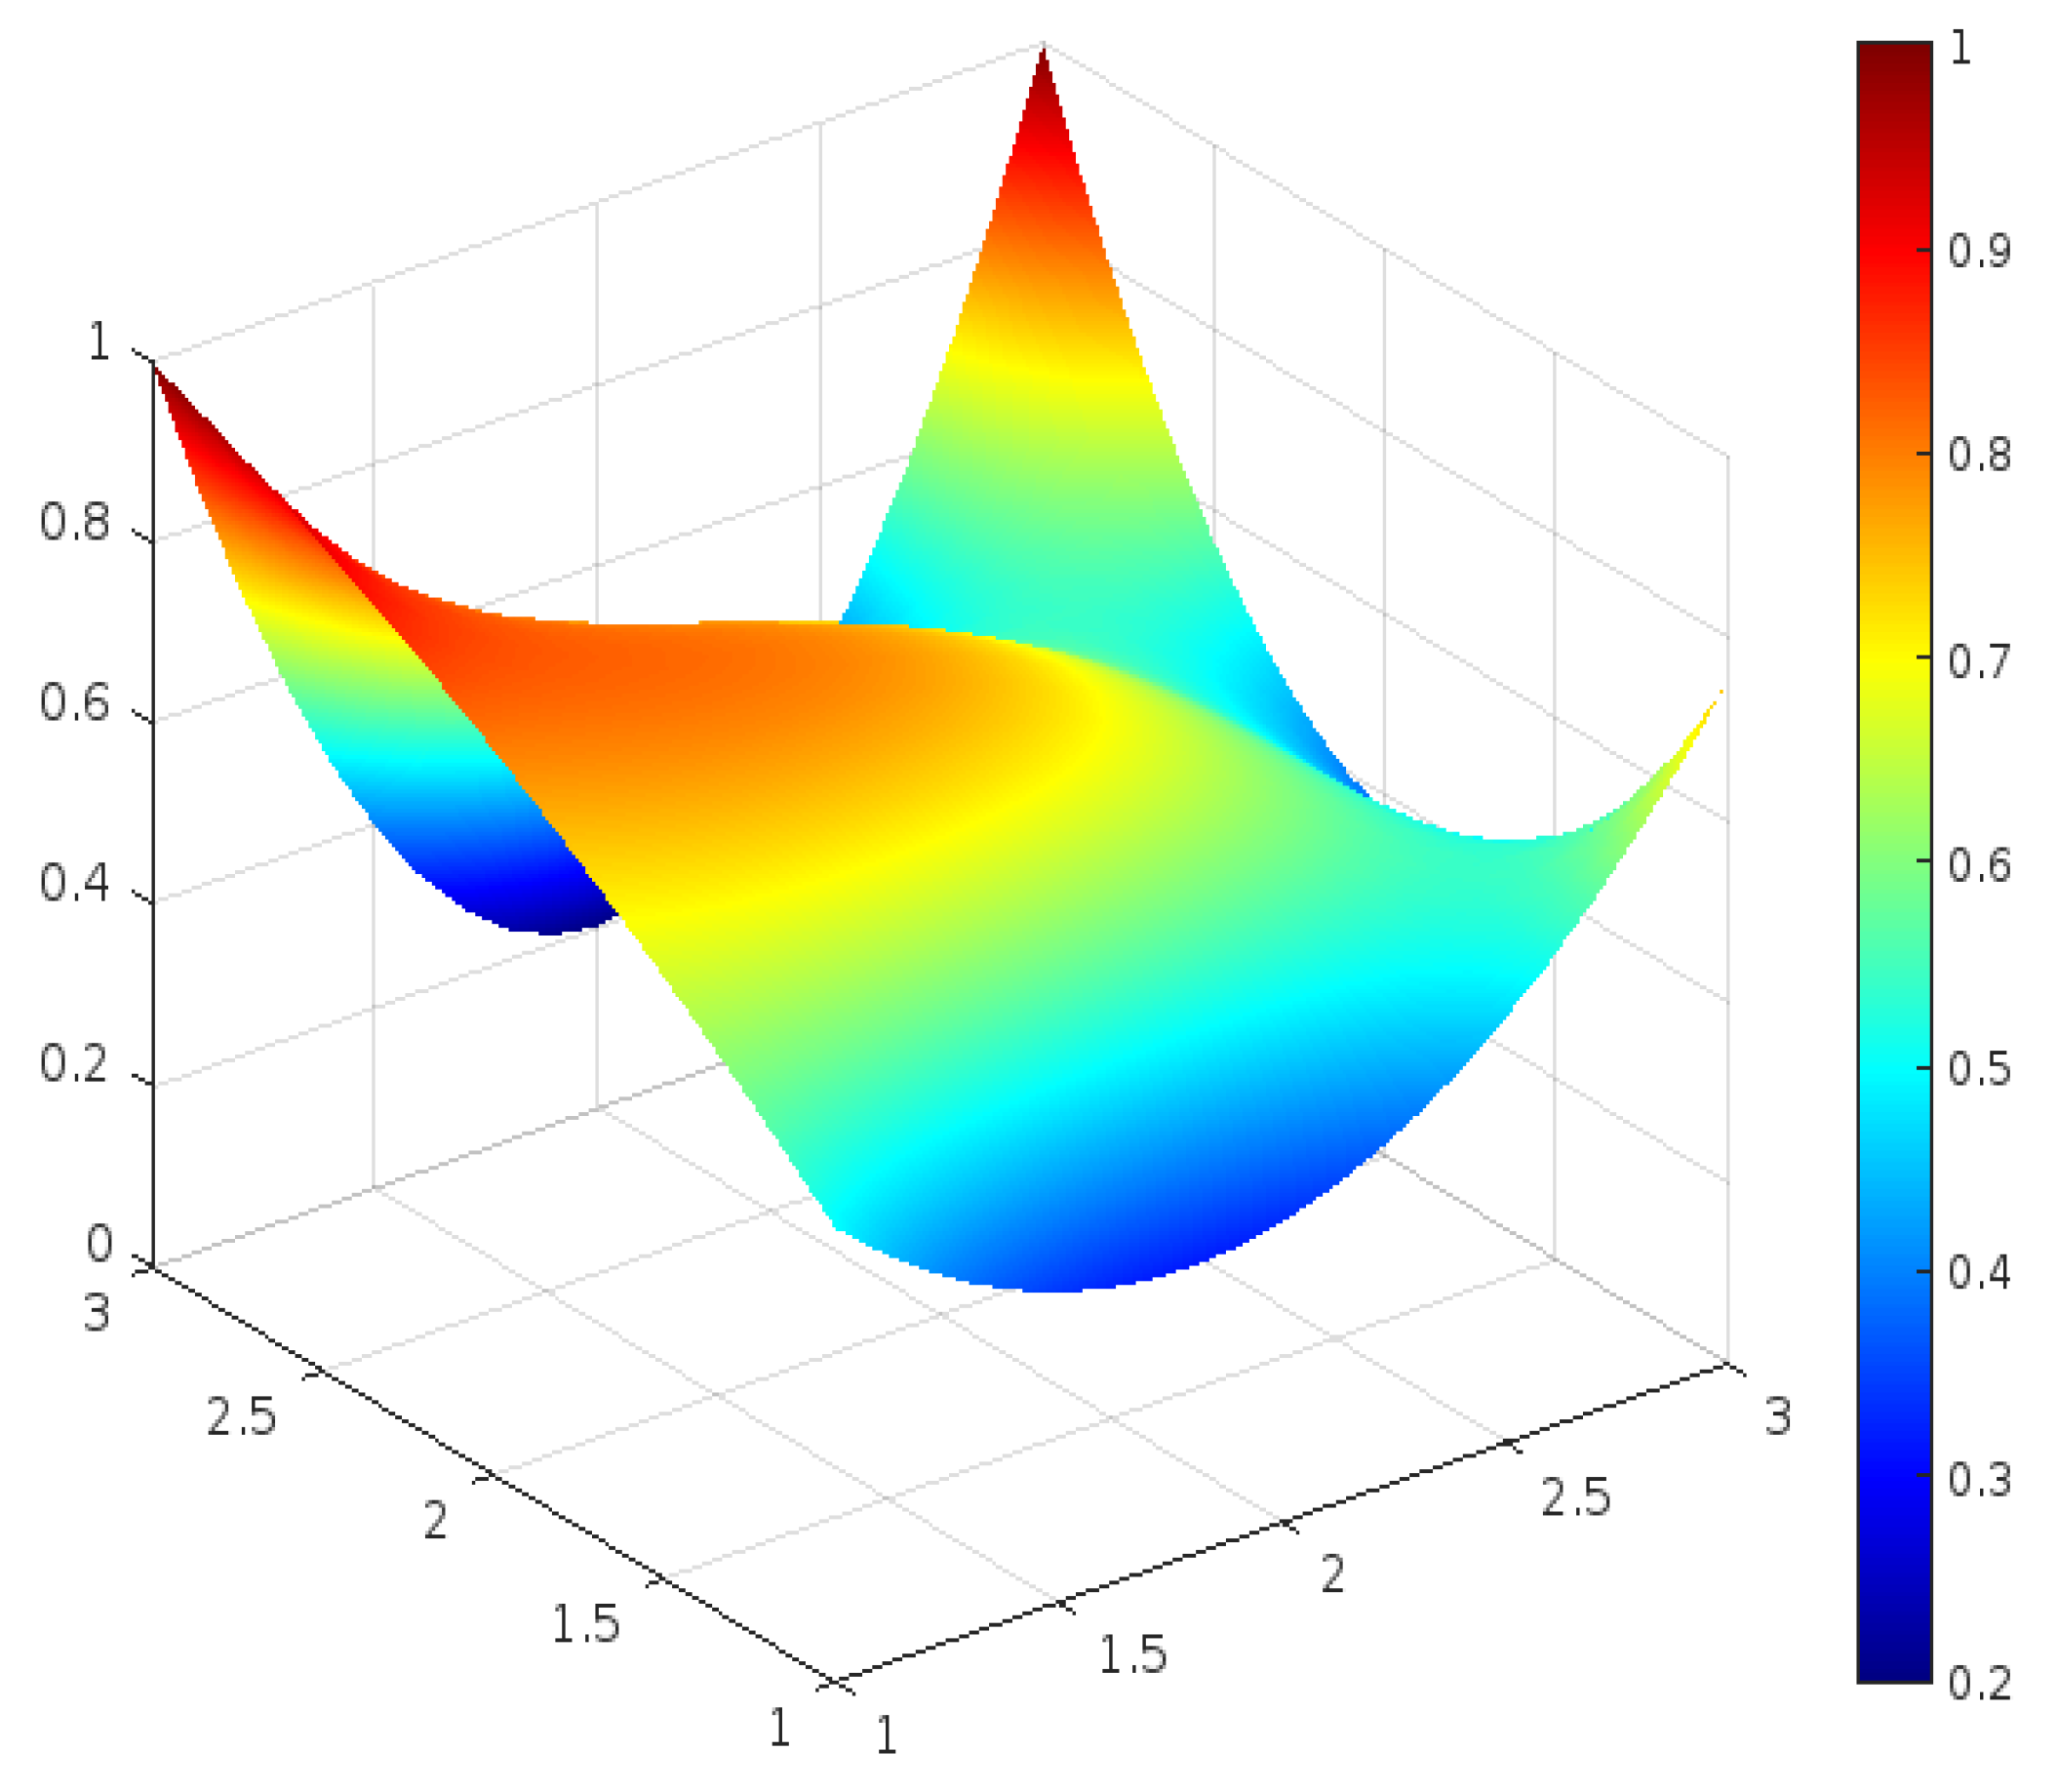
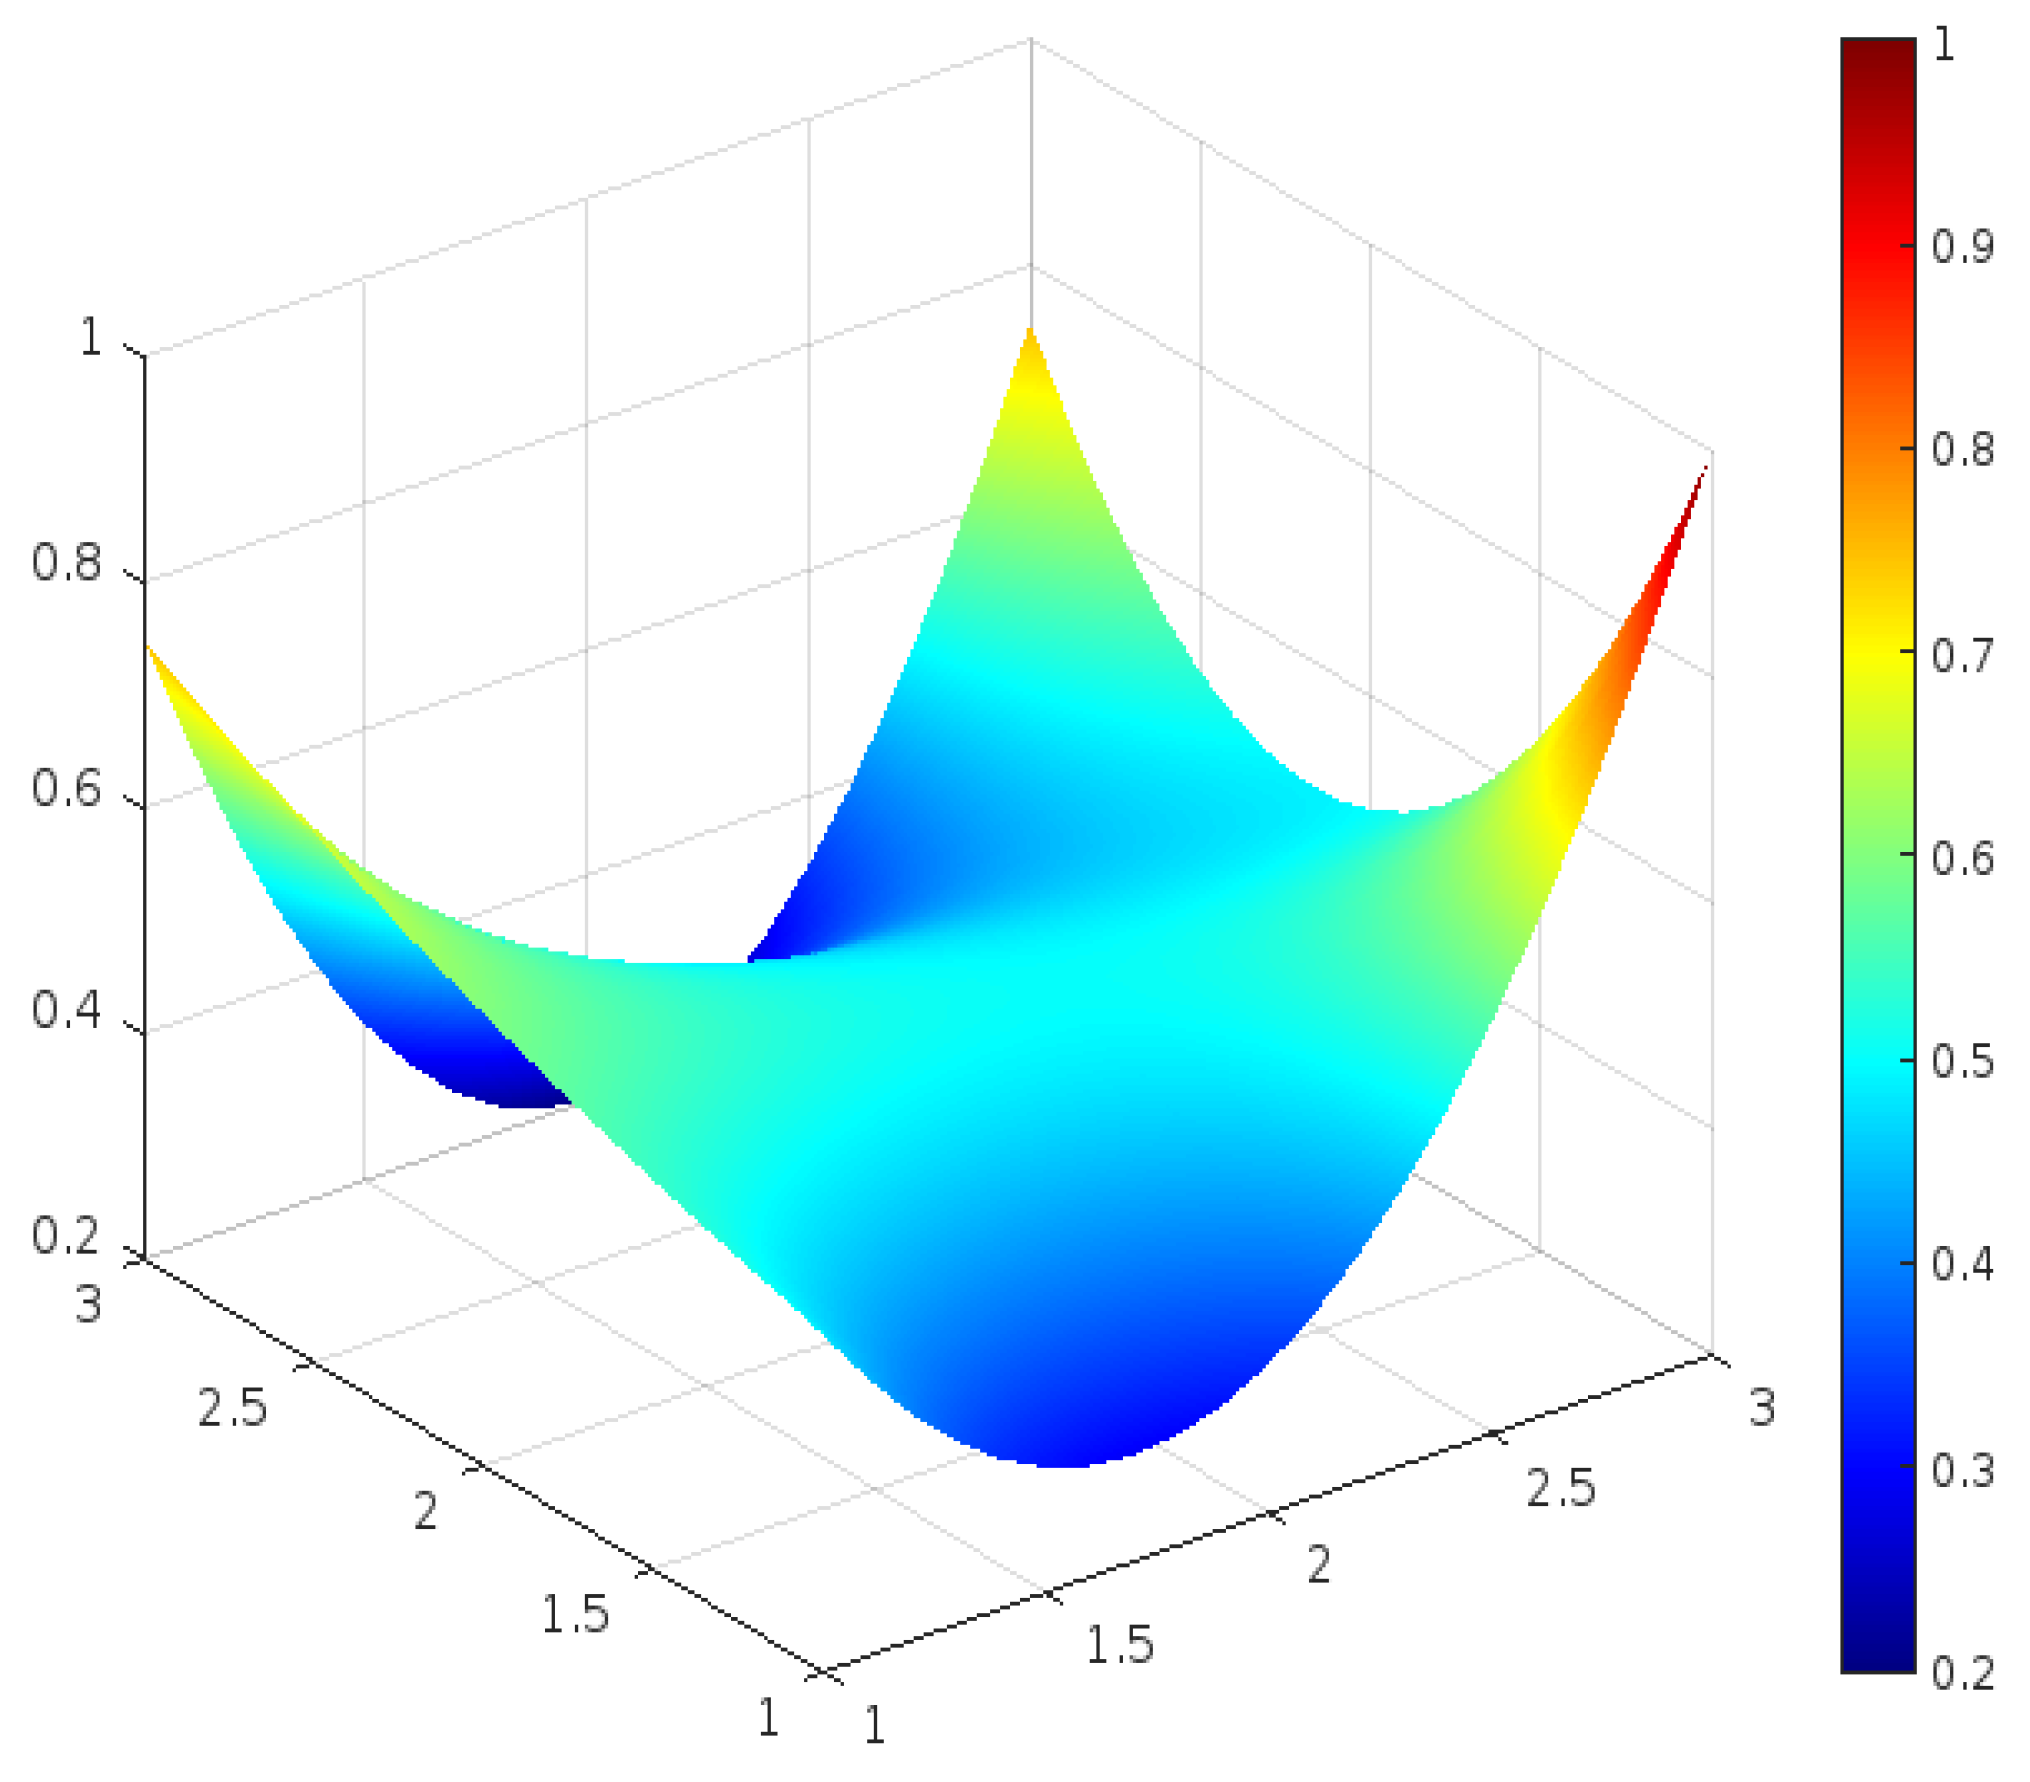
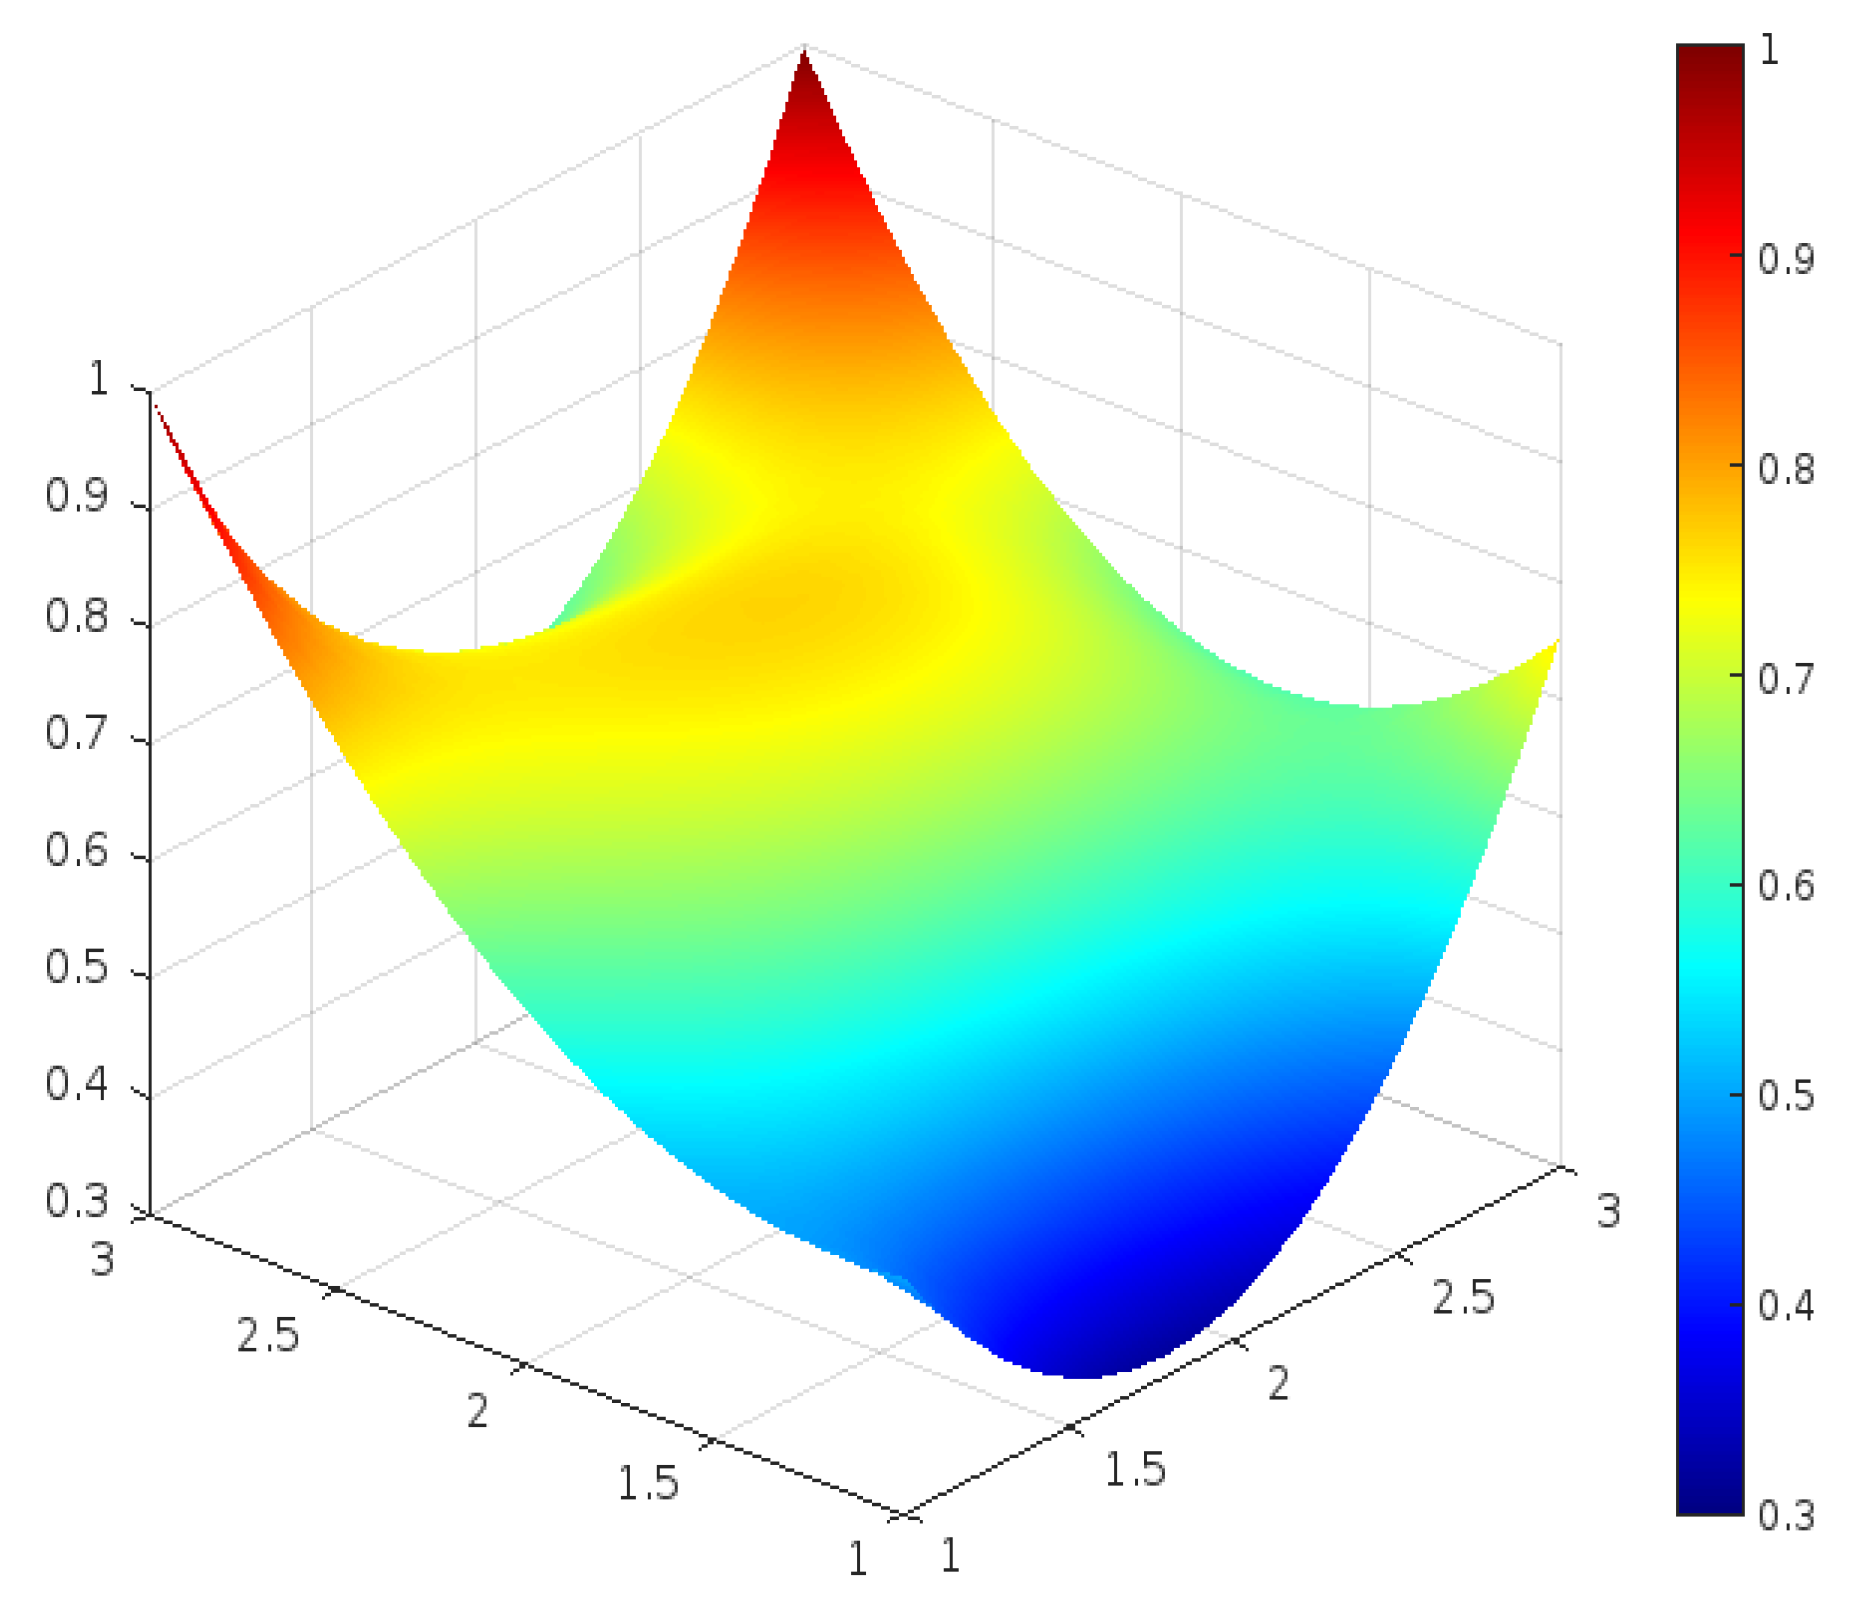
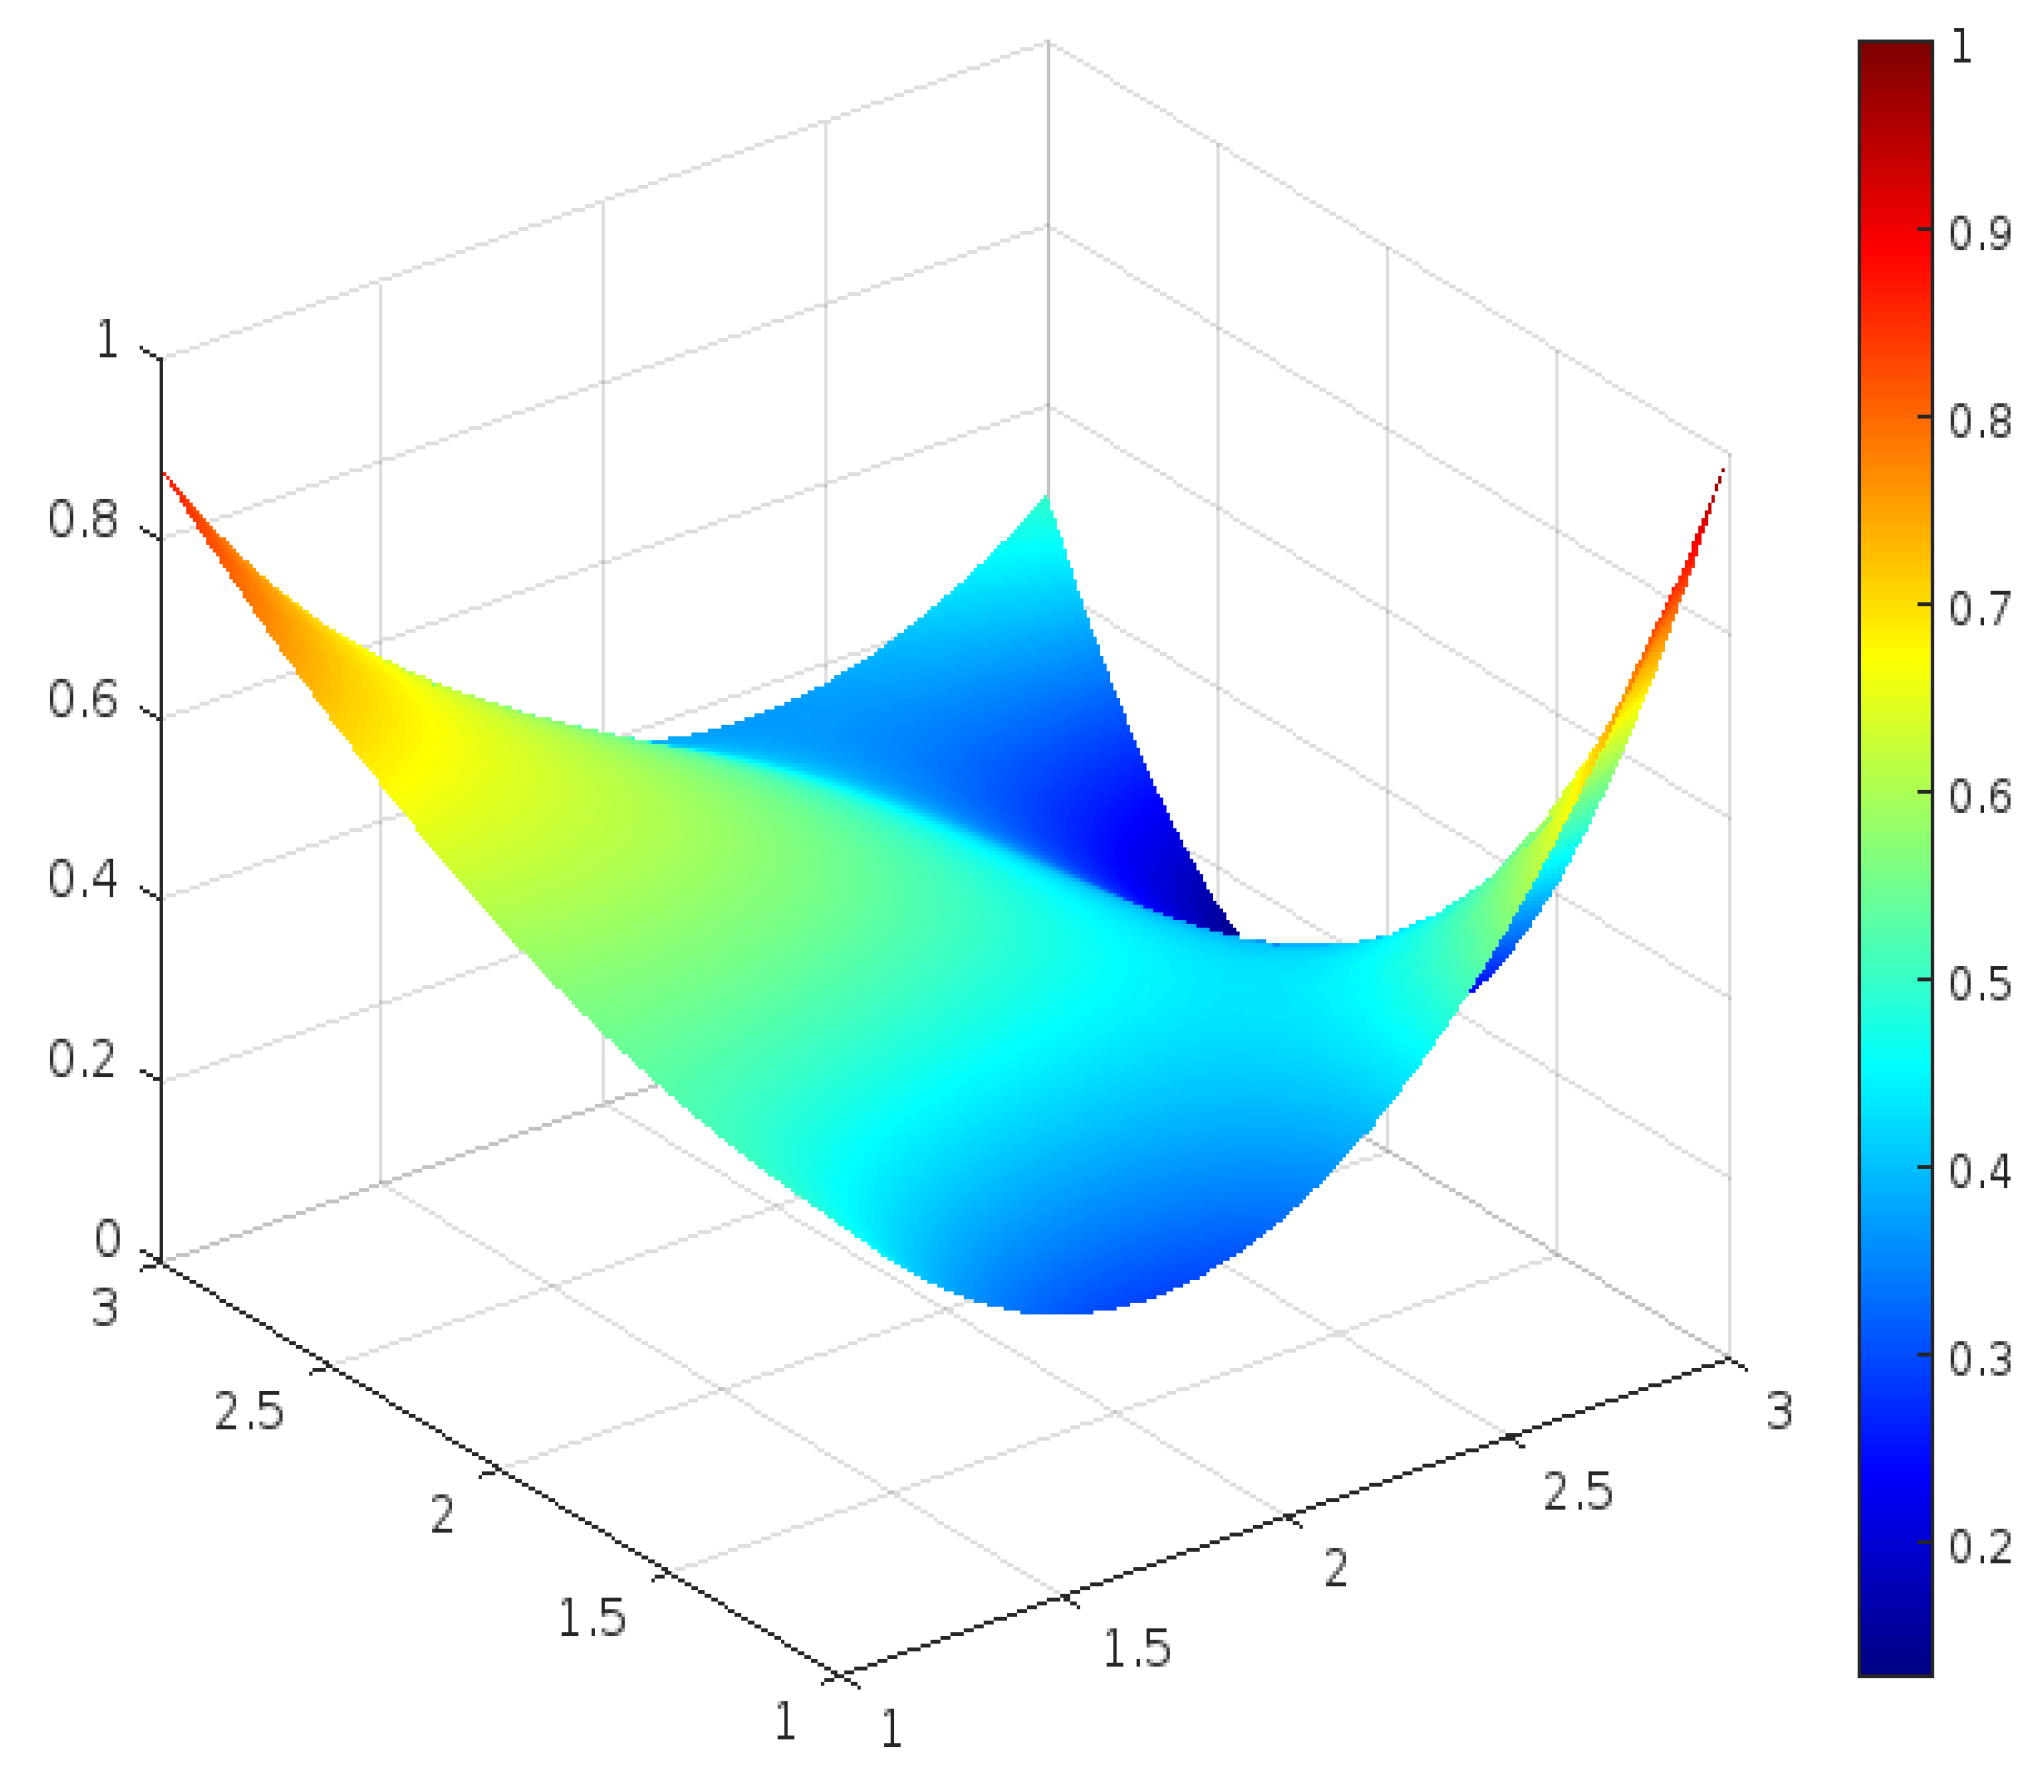
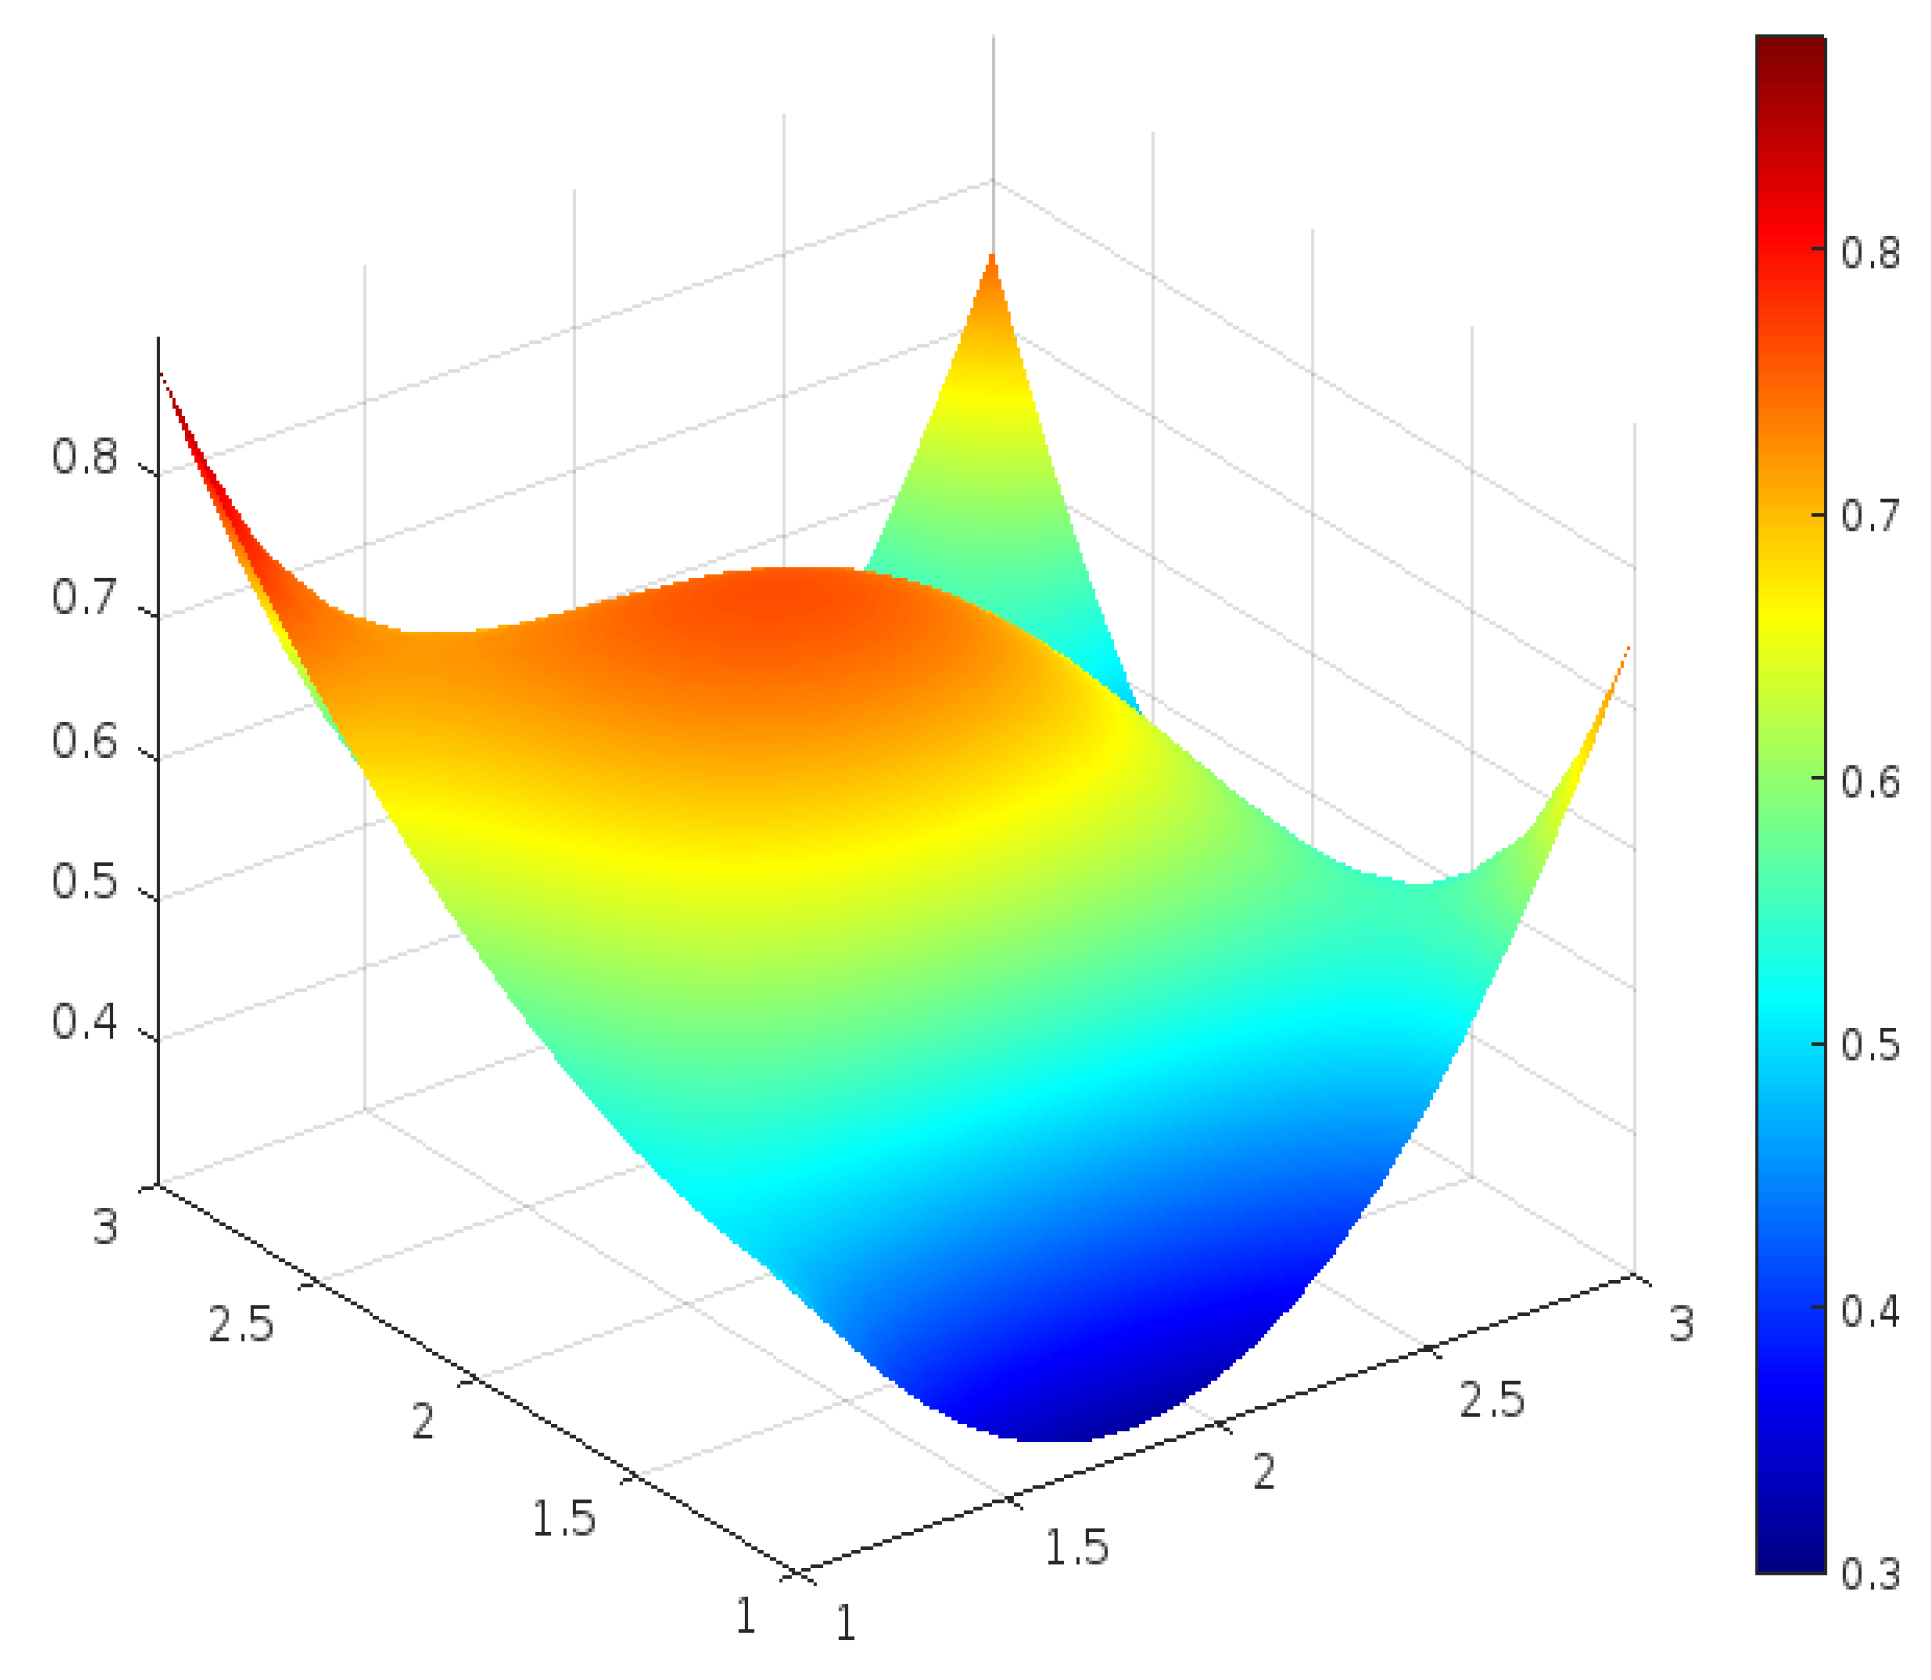
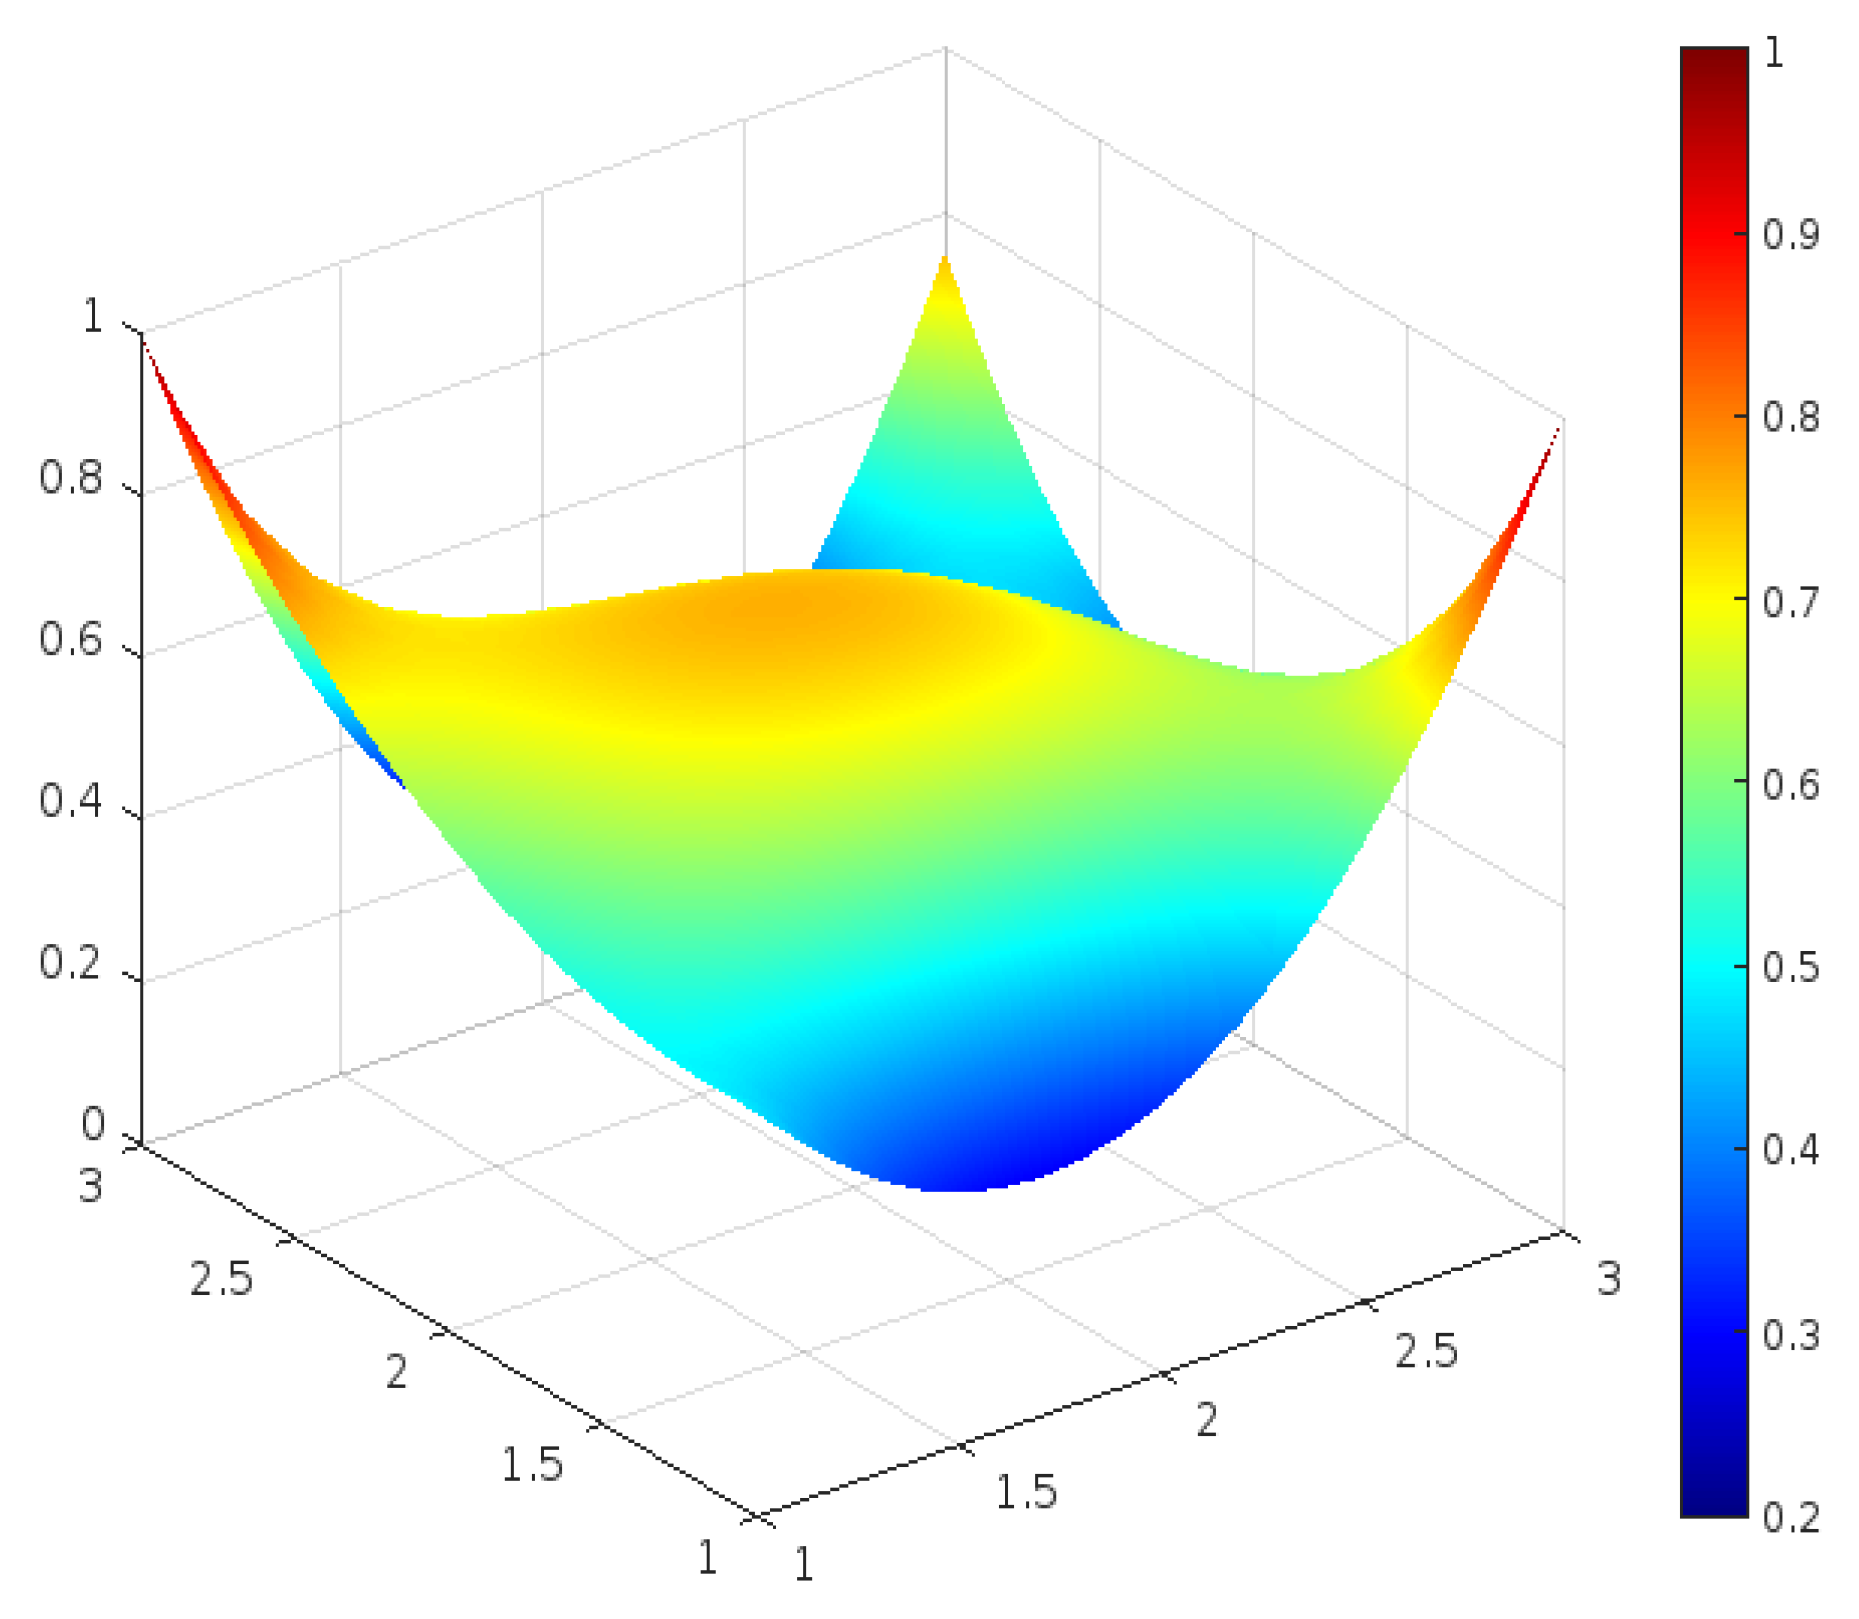
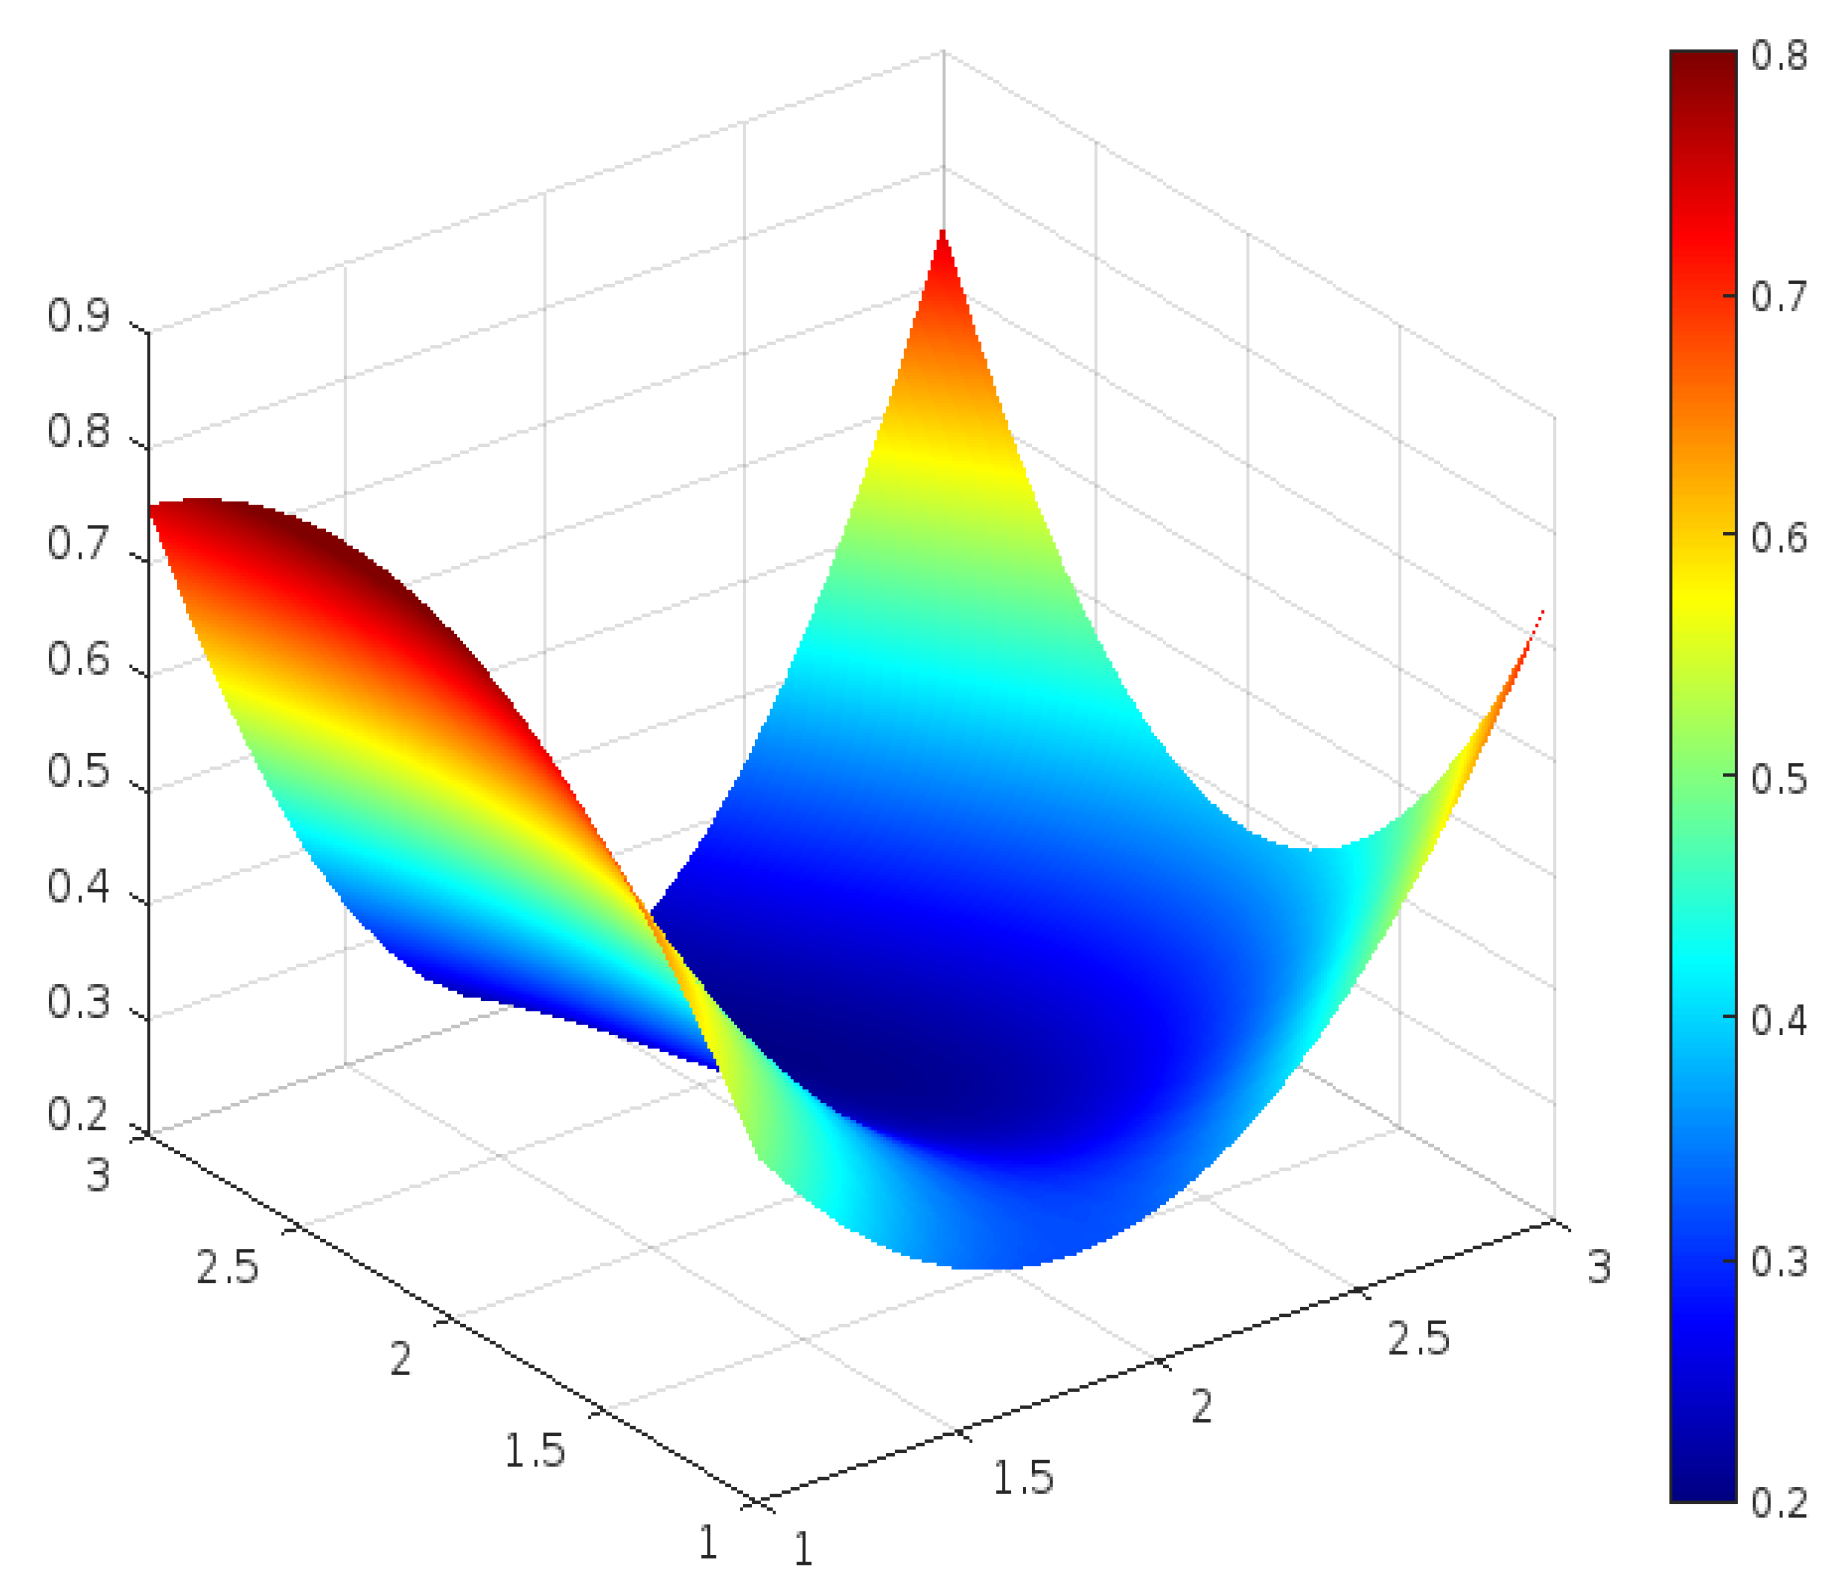
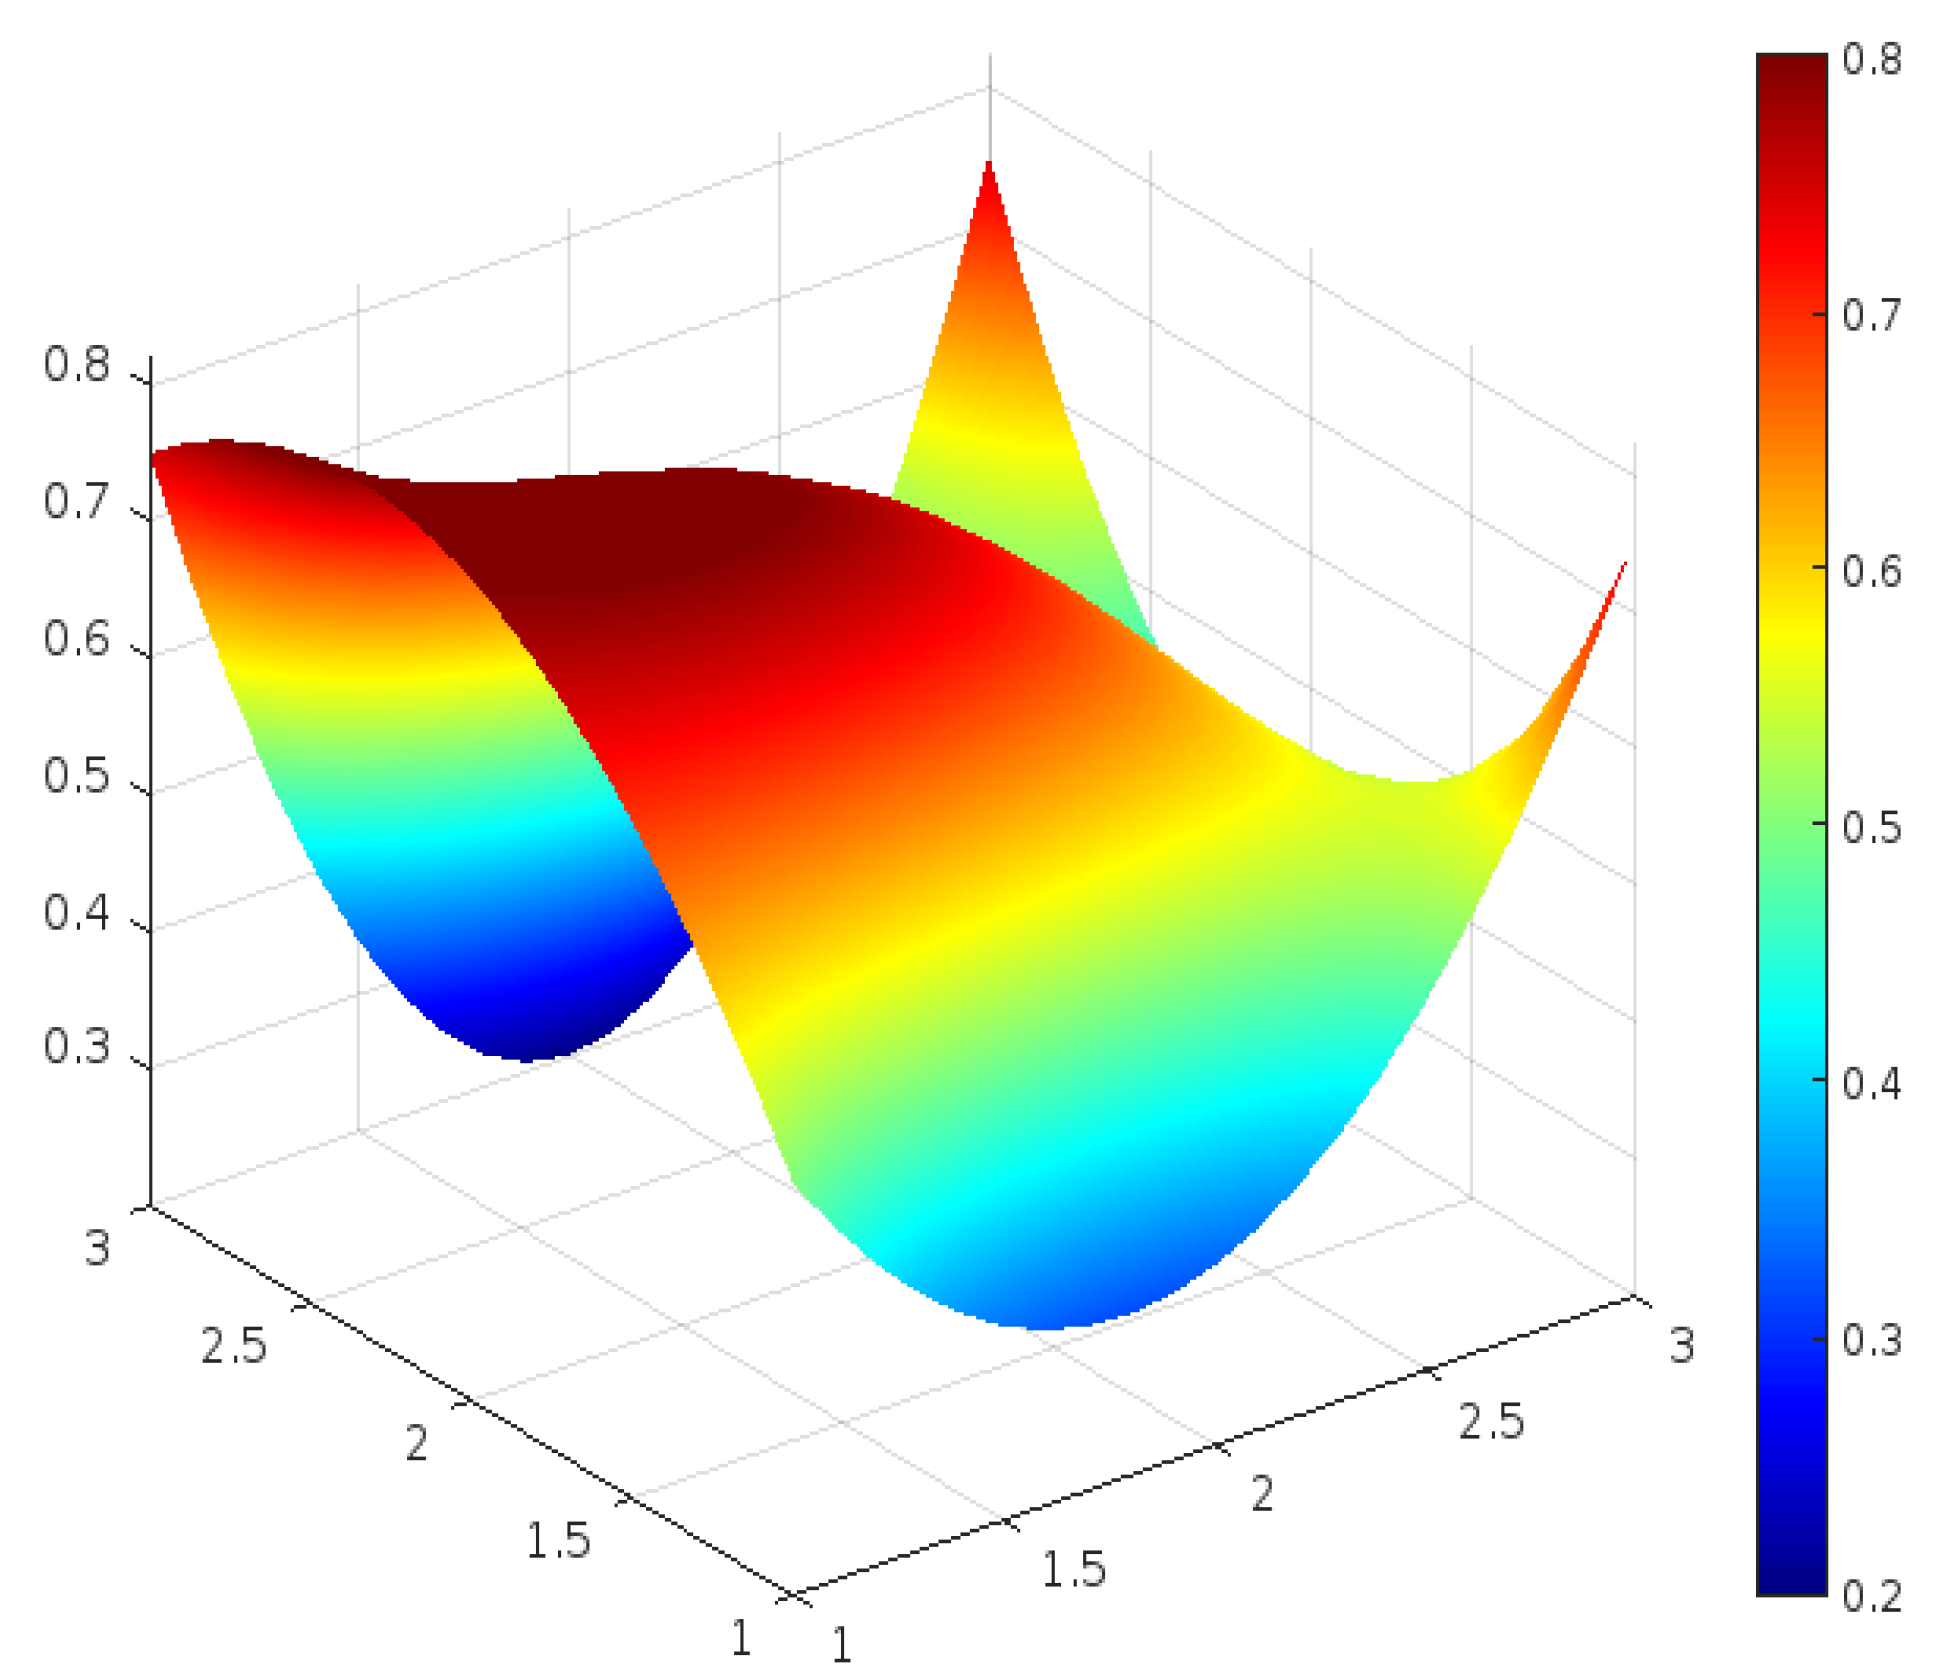
3.3.4. PMC Surface Construction

By plotting the PMC surface, we can more intuitively observe and analyze the strengths and weaknesses of various carbon peak implementation policies. A 3 × 3 matrix is constructed based on the scores of the primary variables X1 to X9 for each policy and the average scores of the 15 policy primary variables. The matrix does not include X10 for two main reasons: First, to maintain the balance and symmetry of the PMC surface; second, the X10 values for the 15 policies are all 1.00, which provides no reference value for plotting the surface graph. The PMC matrix expression (5) is as follows:
PMCr = X 1 X 2 X 3 X 4 X 5 X 6 X 7 X 8 X 9
This study generated the PMC surface graph for 15 policy samples in MATLAB2023a software according to expression (5), visually displaying the quantitative data analysis of the carbon peak implementation plans (Figure 2, Figure 3, Figure 4, Figure 5, Figure 6, Figure 7, Figure 8, Figure 9, Figure 10, Figure 11, Figure 12, Figure 13, Figure 14, Figure 15 and Figure 16). This approach allows for better identification of the strengths and weaknesses of the policy texts and exploration of their potential value. In addition, the color variations in the diagrams reflect the scores of various policies in the primary indicators, with prominent areas indicating that the policy has attained a high score in the relevant primary indicator, while recessed areas suggest a lower score. The overall height of the shape indicates the level of the overall performance of the policy, and the variations in the surface reflect the extent of balance or consistency in the policy [40].

4. Quantitative Results and Discussion

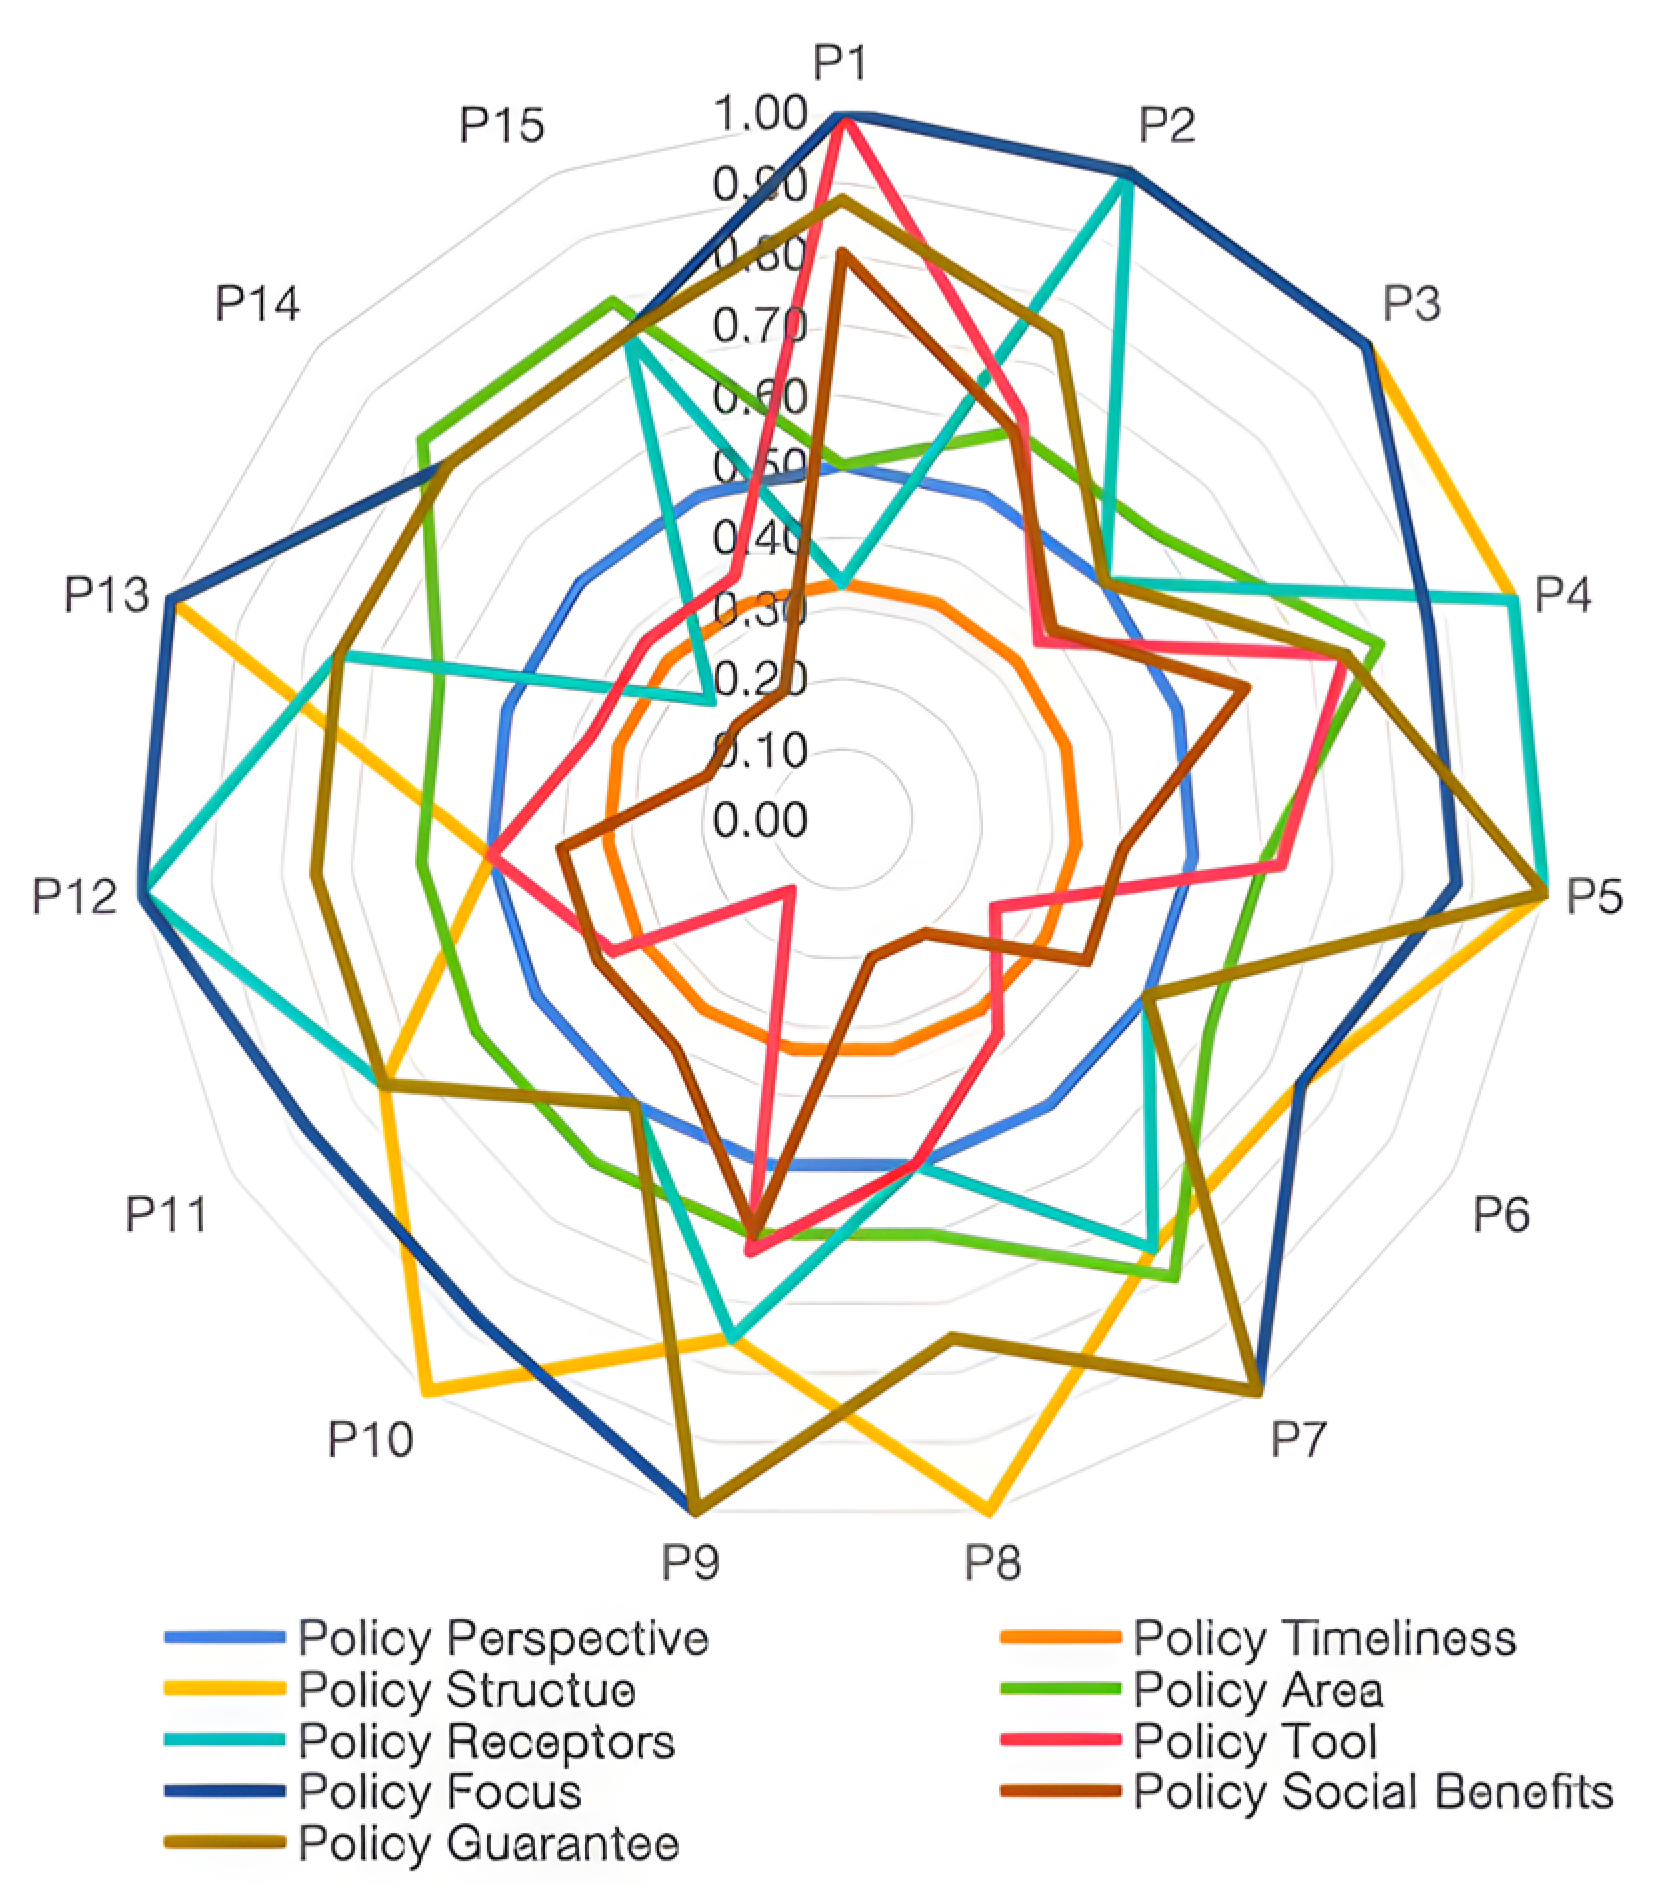
4.1. The PMC Index of 15 Samples

The evaluation results reveal that the PMC index for the 15 carbon peak action plan policies ranges from 5 to 8, with an average score of 6.58, categorizing the policy texts as either “Good” or “Acceptable”. The policies are ranked as follows: P4 > P1 > P2 > P5 > P9 > P7 > P12 > P13 > P11 > P3 > P15 > P8 > P10 > P14 > P6. Policy 4, representing the Liaoning Province Carbon Peak Implementation Plan, achieved the highest score of 7.61 and was rated “Good”. Conversely, Policy 6, the Zhejiang Province Carbon Peak and Carbon Neutrality Technological Innovation Action Plan, scored 5.58, marking it as the lowest-performing policy, though still within the acceptable range. The Liaoning Province Carbon Peak Implementation Plan (Policy 4) received a higher score, likely due to its practical policy content, clear measures, operational feasibility, and, most notably, its focus on the transformation of traditional industries and energy efficiency improvements, which can show results in the short term. Additionally, Liaoning may have established a well-developed policy implementation and monitoring mechanism, ensuring effective execution. In contrast, the Zhejiang Province Carbon Peak and Carbon Neutrality Technological Innovation Action Plan (Policy 6) received a lower score, mainly because it relies on technological innovation and long-term research and development, which, while forward-looking, face challenges such as technology maturity, funding, and market acceptance during implementation. Therefore, the Zhejiang plan’s implementation effects may require more time to materialize, and its policy implementation and adjustment mechanisms may have some delays, impacting the overall score.
Figure 17 provides a radar chart illustrating the scores of the first-level variables for each policy, offering a clear and intuitive visualization of their respective strengths and weaknesses. It also highlights areas for potential policy optimization. Analysis of the average scores for the primary variables indicates that “Policy Structure”, “Policy Area”, “Policy Receptors”, “Policy Focus”, “Policy Guarantee”, and “Policy Disclosure” demonstrate strong performance, as evidenced by relatively high average scores. In contrast, “Policy Perspective”, “Policy Timeliness”, “Policy Tool”, and “Policy Social Benefits” show weaker performance with lower average scores. (1) Policy Perspective: Average score of 0.50, indicating a predominant focus on macro-level areas. (2) Policy Timeliness: Average score of 0.33, reflecting stability but limited adaptability. (3) Policy Structure: Average score of 0.87, suggesting that policies are detailed and well-supported. (4) Policy Area: Average score of 0.65, demonstrating an effort to balance values across the political, economic, cultural, social, and technological domains. (5) Policy Receptors: Average score of 0.72, highlighting a primary focus on government departments, enterprises, social organizations, and individuals. (6) Policy Tool: Average score of 0.47, indicating a limited variety of policy instruments. (7) Policy Focus: Average score of 0.90, showing comprehensive coverage across sectors such as transportation, industry, energy, buildings, agriculture, forestry, waste management, and residential life. (8) Policy Social Benefits: Average score of 0.40, suggesting a lack of clearly defined or tangible social benefits. (9) Policy Guarantee: Average score of 0.76, reflecting the presence of execution guarantees and support mechanisms. These findings emphasize the strengths and shortcomings of the carbon peak action plans, providing clear directions for enhancing their effectiveness and impact.

4.2. Specific Evaluation of Each Group of Carbon Peaking Policies

Based on the consistency criteria established in this study, the 15 policies are categorized into two groups for detailed analysis. The first group comprises “Good” policies, including five items: P1, P2, P4, P5, and P9. The second group consists of “Acceptable” policies, encompassing 10 items: P3, P6–8, P10, P11–15.

4.2.1. The “Good” Group of Policies

The PMC index for P1 is 7.60, ranking 2nd, with an assessment grade of “Good”. The Hebei Province Carbon Peaking Implementation Plan demonstrates strong timeliness and forward-looking qualities by clearly defining carbon peak targets for the 14th and 15th “Five-Year Plan” periods. Specifically, the score for Policy Area (X4) is below average because the policy does not cover political and cultural aspects. Policy Structure (X3) and Policy Focus (X7) both scored full marks, due to the plan’s well-organized structure, which includes general requirements, main objectives, key tasks, international cooperation, policy guarantees, and organizational implementation, all of which demonstrate strong logic. The policy also covers multiple fields such as energy, technological innovation, industry, construction, public action, circular economy, carbon sinks, and transportation, comprehensively covering the key areas for carbon peaking. In summary, the Hebei Province Carbon Peaking Implementation Plan is a robust and systematic policy. It provides a detailed roadmap with specific goals and safeguard measures, emphasizing long-term objectives for carbon peaking and neutrality. Its implementation is expected to significantly advance Hebei Province’s sustainable development, delivering substantial benefits across environmental protection, economic growth, and social progress.
The PMC index for P2 is 7.41, ranking 3rd, with an assessment grade of “Good”. The Shanxi Province Carbon Peaking Implementation Plan focuses on the actual situation of being an energy-rich province, proposing the main strategic direction of “five integrations” development. Specifically, the score for Policy Area (X4) is below average because the policy does not cover political and cultural aspects. Policy Structure (X3), Policy Receptors (X5), and Policy Focus (X7) all scored full marks, due to the clear and reasonable policy structure, which is divided into general requirements, main objectives, key tasks, safeguard measures, and other parts. It involves multiple receptors, including government, enterprises, and the public, emphasizing collaborative cooperation among various industries within the province, as well as focusing on energy revolution and the innovation of green low-carbon technologies. Overall, the Shanxi Province’s carbon peaking policy is a comprehensive plan that not only sets goals but also focuses on the pathways and safeguards for implementation, reflecting the province’s firm determination and clear planning in achieving carbon peaking and carbon neutrality. Through related policy measures, Shanxi Province is expected to play an important role in the national and even global carbon peaking and carbon neutrality process. Overall, the Shanxi Province Carbon Peaking Implementation Plan is a well-rounded and actionable strategy.
The PMC index for P4 is 7.61, ranking 1st, with an assessment grade of “Good”. The Liaoning Province Carbon Peaking Implementation Plan fully considers the province’s resource endowment and industrial characteristics, reflecting a perspective that starts from the local reality while aligning with national goals, balancing local realities with broader objectives. Policy Structure (X3) and Policy Receptors (X5) both scored full marks. The policy has a rational structure, from overall requirements to main objectives to key tasks and safeguard measures, forming a complete policy system that is easy to execute and supervise. Additionally, the policy involves multiple receptors including government, enterprises, and the public, which contributes to fostering a positive atmosphere throughout society regarding participation in carbon peaking efforts. In summary, the Liaoning Province Carbon Peaking Implementation Plan stands out for its comprehensive and forward-looking approach. By promoting a green and low-carbon economic transformation while ensuring energy security, the policy is positioned to drive substantial improvements in environmental quality and sustainable development for the province.
The PMC index for P5 is 7.33, ranking 4th, with an assessment grade of “Good”. The Jiangsu Province Carbon Peaking Implementation Plan emphasizes green development and ecological civilization construction, reflecting a sustainable development perspective overall. It supports economic structure optimization and promotes low-carbon transformation. Specifically, the score for Policy Area (X4) is below average, mainly because the policy does not cover the cultural sector; however, the plan addresses traditional high-pollution industries and also focuses on emerging sectors such as smart manufacturing, new energy, and green transportation, reflecting a comprehensive approach to multi-sectoral governance. Policy Structure (X3) and Policy Receptors (X5) scored full marks, mainly because the policy structure is clear, including specific implementation paths, timelines, target breakdowns, and responsibility allocation, with clear levels of responsibility. Additionally, it takes into account the roles and collaborative mechanisms of local governments, businesses, social organizations, and the public, making the policy content systematic and comprehensive. Overall, the Jiangsu Province Carbon Peaking Implementation Plan has clear policy goals and diverse policy tools, and it aligns with the national low-carbon transformation strategy.
The PMC index for P9 is 7.16, ranking 5th, with an assessment grade of “Good”. The Henan Province Carbon Peaking Implementation Plan, starting from the carbon peaking goal, focuses on ecological environmental protection, energy structure optimization, and industrial upgrading, demonstrating a long-term vision for sustainable development and green transformation. Specifically, the ratings for Policy Structure (X3) and Policy Area (X4) are below average, mainly because not all policy goals are quantified, with many being qualitatively described. For example, “By 2030, the province aims to further increase the share of non-fossil energy in its energy mix, while reducing energy consumption and carbon dioxide emissions per unit of GDP, thereby successfully reaching its carbon peaking target”. Additionally, the policy does not cover the cultural sector; however, the scores for Policy Focus (X7) and Policy Guarantee (X9) are full marks, mainly because the policy outlines targeted measures in critical sectors such as industry, transportation, construction, agriculture, and forestry. Simultaneously, the Henan Province Carbon Peaking Plan explicitly proposes multiple guarantee measures, including strengthening organizational leadership, improving the policy system, providing technical support, promoting green finance, and increasing supervision to ensure effective implementation of the policy. In summary, the Henan Province Carbon Peaking Implementation Plan is closely aligned with the province’s conditions, providing targeted and feasible measures to achieve carbon peaking. While some quantitative targets could be refined, the plan demonstrates strong potential for supporting Henan’s green transformation and sustainable development.

4.2.2. The “Acceptable” Group of Policies

The PMC index for P3 is 6.21, ranking 10th, with an evaluation grade of “Acceptable”. The Inner Mongolia Autonomous Region Carbon Peaking Implementation Plan emphasizes energy and ecological security from both national and regional strategic perspectives, aligning with Inner Mongolia’s role within the broader national development framework. While the policy excels in comprehensiveness, goal clarity, structural rationality, technological innovation, and ecological protection, it falls short in several areas. Specifically, the scores for Policy Area (X4), Policy Receptors (X5), Policy Tool (X6), and Policy Guarantee (X9) are below average. Key shortcomings include limited engagement with government departments and social organizations, an underdeveloped carbon trading market and pricing mechanisms, and the lack of adequate supervision and assessment systems. Addressing these weaknesses and tailoring the policy to the region’s specific circumstances could significantly enhance its effectiveness in driving Inner Mongolia’s shift toward a sustainable, low-carbon economy.
The PMC index for P6 is 5.58, ranking 15th, with an evaluation grade of “Acceptable”. The Zhejiang Province Action Plan for Technological Innovation in Carbon Peaking and Carbon Neutrality leverages the province’s strategic positioning to capitalize on its strengths in technological innovation and green and low-carbon development. This approach reflects the directives of the provincial party committee and government. Despite these strengths, the scores for Policy Structure (X3), Policy Area (X4), Policy Receptors (X5), Policy Tool (X6), Policy Focus (X7), and Policy Guarantee (X9) are all below average. Notably, the policy lacks key instruments such as carbon trading markets, carbon taxes, low-carbon standards, legal frameworks, and public education initiatives. Nevertheless, the plan aims to advance green and low-carbon development, enhance resource utilization efficiency, reduce environmental pollution, and expand ecosystem carbon sink capacity, thereby delivering substantial social and environmental benefits. Overall, the policy aligns with Zhejiang’s vision of building an ecological civilization.
The PMC index of P7 is 6.71, ranking 6th, with an evaluation grade of “Acceptable”. The Anhui Province Carbon Peaking Implementation Plan primarily emphasizes reducing carbon emissions, promoting green transformation, and enhancing energy efficiency. However, scores for Policy Structure (X3), Policy Tool (X6), and Policy Social Benefits (X8) are below average, reflecting a lack of emphasis on the social benefits of sustainability, technological advancements, effective mechanisms, and environmental protection. Despite these shortcomings, the plan comprehensively addresses key areas such as industrial structure adjustment, energy transition, green low-carbon technology innovation, and resource conservation. It includes targeted measures to transition away from a coal-dependent energy system while fostering the development of green and renewable energy industries. The policy’s relatively strong guarantees include provisions for fiscal support, policy incentives, regulatory enforcement, and low-carbon pilot programs. A robust implementation framework and monitoring mechanisms ensure progress toward the carbon peaking goal. Furthermore, cross-departmental coordination and cooperation are strengthened, providing additional support for effective implementation. In summary, the Anhui Province Carbon Peaking Implementation Plan is comprehensive and strategically designed, with clearly defined policy objectives and actionable measures. It holds significant potential in facilitating the achievement of carbon peaking goals and lays a strong foundation for green transformation.
The PMC index of P8 is 6.13, ranking 12th, with an evaluation grade of “Acceptable”. The Shandong Province Carbon Peaking Implementation Plan proposes gradually reducing total carbon emissions, strengthening the application of low-carbon technologies, and promoting economic transformation and upgrading while ensuring energy supply security. The scores for Policy Area (X4), Policy Receptors (X5), Policy Focus (X7), and Policy Social Benefits (X8) are below average. The primary audiences of Shandong’s carbon peaking policy are government departments, key industry enterprises, and financial institutions, with less attention given to the general public. As the policy implementer, government departments need to coordinate efforts across various sectors to promote green transformation at the local government and enterprise levels. Enterprises, especially in high-emission industries, need to actively respond and implement green transformation measures. At the same time, financial institutions, as key supporters of funding, need to use green financial tools to support the financing of low-carbon projects. Additionally, the Shandong Province Carbon Peaking Implementation Plan has relatively sound policy guarantees, including government leadership and inter-departmental coordination, legal and regulatory safeguards, financial support, and monitoring and evaluation systems. In conclusion, the Shandong Province Carbon Peaking Implementation Plan, in combining the province’s industrial characteristics and developmental needs, is highly feasible and can provide a solid foundation for achieving the carbon peaking goal.
The PMC index of P10 is 5.83, ranking 13th, with an evaluation grade of “Acceptable”. The Hubei Province Action Plan for Technological Innovation in Carbon Peaking and Carbon Neutrality emphasizes leveraging technological innovation as the core driver for carbon emission reduction, with a clear focus on leading low-carbon economic development through innovation. However, the scores for Policy Area (X4), Policy Receptors (X5), Policy Tool (X6), Policy Focus (X7), and Policy Guarantee (X9) are below average. Compared to similar policies, Hubei’s plan employs fewer policy tools, lacking explicit references to market-based mechanisms, fiscal incentives, legal regulations, and social mobilization strategies. A more effective integration of these tools could establish a diversified incentive mechanism, encouraging both the innovation and application of low-carbon technologies. Despite these shortcomings, the plan demonstrates a well-structured policy design, particularly in goal setting, with clearly defined timelines for achieving carbon peaking and carbon neutrality. It underscores the pivotal role of technological innovation in meeting these objectives. While the policy provides a solid foundation, there is significant room for improvement in enhancing Policy Tool and Policy Guarantee measures. Strengthening the integration of technological innovation with green development will be critical to achieving the plan’s intended outcomes.
The PMC index of P11 is 6.33, ranking 9th, with an assessment grade of “Acceptable”. The Hunan Province Carbon Peaking Implementation Plan adopts a comprehensive strategic approach, emphasizing the goals of carbon peaking and carbon neutrality. By integrating multiple dimensions and sectors, the plan offers a relatively clear policy framework; however, the scores for Policy Structure (X3), Policy Area (X4), Policy Tool (X6), and Policy Focus (X7) remain below average. The plan incorporates various policy tools, such as fiscal and financial measures, education and awareness campaigns, and the establishment of carbon trading mechanisms. Additionally, it provides support for technological R&D and incentives to promote green innovation. Nevertheless, the utilization of key tools, including tax incentives, green credit, emission standards, and legal oversight, requires further enhancement. Moreover, improving the liquidity and transparency of the carbon market and increasing corporate participation are critical for optimizing the effectiveness of these policy tools. Overall, the Hunan Province Carbon Peaking Implementation Plan prioritizes energy structure transformation, industrial greening, low-carbon technological innovation, and ecological environment improvement. Particularly noteworthy are its efforts to advance clean energy development and green industries. These focused measures are well-positioned to reduce carbon intensity and foster the growth of a green and low-carbon economy.
The PMC index of P12 is 6.58, ranking 7th, with an assessment grade of “Acceptable”. The Guangdong Province Carbon Peaking Implementation Plan is an important policy in driving the green transformation of the regional economy. It addresses climate change and covers aspects such as policy goal setting, implementation pathways, and the application of tools. The scores for Policy Structure (X3) and Policy Area (X4) are below average, with “Sufficient Basis” and “Clear Objectives” scoring 0, indicating that the plan does not specify the higher-level laws or policies it follows, nor does it quantify its policy goals. However, the policy effectively assigns responsibilities and tasks to different stakeholders and provides strong, actionable guidance for the implementation of various measures. Additionally, the Guangdong Province Carbon Peaking Implementation Plan focuses on several key areas: energy structure transformation, industrial green upgrading, green technological innovation, and low-carbon city construction. It emphasizes promoting clean energy development, optimizing the industrial structure, supporting the research, development, and deployment of high-tech green technologies, and strengthening policies related to green buildings and low-carbon transportation.
The PMC index of P13 is 6.51, ranking 8th, with an assessment grade of “Acceptable”. The Shaanxi Province Carbon Peaking Implementation Plan starts from the national macro-policy framework, combining the province’s resources, economy, and industrial characteristics, and proposes regionally differentiated goals. The scores for Policy Area (X4), Policy Tool (X6), and Policy Social Benefits (X8) are below average. As an energy-rich province, the transformation of traditional industries, especially the coal sector, may bring certain social impacts, such as unemployment and social instability; therefore, Shaanxi should focus on balancing social benefits with local economic development during implementation, ensuring social stability in the low-carbon transition process. Additionally, the policy plan has a clear structure, ensuring that the responsibilities of various stakeholders are well-defined. It also proposes corresponding supervision and evaluation mechanisms to ensure the policy’s effectiveness. Overall, the Shaanxi Province Carbon Peaking Implementation Plan takes into account local economic structure, energy characteristics, and social development needs in its design, offering region-specific emission reduction measures. The plan performs well in policy structure but needs to further refine its approach to balancing economic growth with carbon reduction, improving the policy guarantee system, and addressing the transformation of traditional high-carbon industries, social impact mitigation, and cross-departmental coordination in the implementation process.
The PMC index for P14 is 5.57, ranking 14th, with an evaluation grade of “Acceptable”. The Xinjiang Uygur Autonomous Region Urban and Rural Construction Carbon Peaking Implementation Plan emphasizes the low-carbon transformation of urban and rural construction, focusing on enhancing building energy efficiency, promoting green buildings, and developing low-carbon urban infrastructure. Scores for Policy Structure (X3), Policy Receptors (X5), Policy Tool (X6), Policy Focus (X7), and Policy Social Benefits (X8) are below average. The policy primarily targets government departments as the main recipients and implementers responsible for policy formulation and oversight; however, it provides limited attention to enterprises, social organizations, and the public. Construction companies are critical for green building construction and renovation, social organizations can offer resource support for policy execution, and public engagement is essential in promoting low-carbon lifestyles and green consumption practices. Overall, the policy highlights low-carbon transformation in construction and transportation, proposing practical measures tailored to Xinjiang’s unique conditions; however, challenges such as energy dependency, urban–rural disparities, and economic development levels may hinder effective implementation. To address these issues, stakeholders must enhance financial support, advance technological research and development, strengthen market mechanisms, and improve social security measures. These efforts will help ensure the policy’s successful implementation, gain widespread societal support, and promote the region’s transition to low-carbon development.
The PMC index for P15 is 6.21, ranking 11th, with an evaluation grade of “Acceptable”. The Heilongjiang Province Urban and Rural Construction Carbon Peaking Implementation Plan adopts a comprehensive strategic approach, emphasizing carbon peaking in urban and rural construction. It focuses on green buildings, low-carbon urban planning, and transportation infrastructure. Scores for Policy Structure (X3), Policy Tool (X6), Policy Focus (X7), and Policy Social Benefits (X8) are below average. The plan employs various policy tools, including financial subsidies, tax incentives, and support for technological research and development. It also promotes the adoption of clean energy and green building standards to achieve carbon peaking objectives; however, policy tools such as green finance, carbon trading markets, and carbon taxes are underdeveloped and require further enhancement. Overall, the plan demonstrates strengths in policy structure, focus areas, and potential social benefits. Nevertheless, there is significant room for improvement in the depth of policy tool application, the adaptability of policy recipients, and inter-departmental collaboration. Strengthening the policy guarantee system, particularly regarding financial and technical support, will be essential to ensuring the effective implementation of the plan’s measures.

4.3. Policy Optimization Suggestions

These policies share a common goal of achieving carbon peaking and carbon neutrality, promoting green and low-carbon development, and reducing carbon emissions. Most of the policies emphasize energy structure transformation and reducing reliance on traditional energy sources, and focus on carbon reduction in the energy, industry, and transportation sectors. Additionally, the policies generally adopt financial support, tax incentives, and other mechanisms to encourage green technology and low-carbon innovation. However, there are differences in the implementation paths, focus areas, and policy structures across provinces. Different regions have developed distinct optimization paths based on their economic and industrial characteristics, with some focusing more on green technology innovation, while others emphasize the integration of energy transformation and industrial upgrading. Furthermore, the level of policy detail and implementation guidelines vary, with some provinces providing clear instructions and responsibility assignments, while others offer broader guidelines. In terms of policy recipients, some provinces focus on government and business execution, while others place more emphasis on engaging the public to drive societal low-carbon transformation. Additionally, some provinces pay particular attention to the social benefits of the policies, such as employment and health, while others place less emphasis on these non-economic outcomes. A thorough analysis of the causal relationships in these policies reveals that the setting of policy objectives drives the transformation of energy structures and the optimization of industries. Financial support and tax incentives encourage green technological innovation. Differences in regional economies and industrial foundations lead to variations in policy implementation pathways and key focus areas.
Optimizing the carbon peak implementation plans across various provinces and regions is essential not only for achieving the national carbon peak target but also for ensuring the sustainable development of local economies, environments, and societies. The following comprehensive optimization suggestions are provided from both individual and collective perspectives to enhance the adaptability, effectiveness, and coordination of these policies. In view of the analysis results of the PMC index for 15 representative policies, specific optimization pathways are proposed for each region: For Hebei Province’s carbon peak implementation plan, the optimization pathway is X4; for Shanxi Province, it is X4; for the Inner Mongolia Autonomous Region, the pathway is X9-X5-X6-X4; for Zhejiang Province’s Carbon Peak and Carbon Neutrality Science and Technology Innovation Action Plan, it is X9-X5-X6-X7-X3-X4; for Anhui Province, the pathway is X8-X3-X6; for Shandong Province, it is X5-X8-X7-X4; for Henan Province, it is X3-X4; for Hubei Province’s Carbon Peak and Carbon Neutrality Science and Technology Innovation Action Plan, it is X6-X9-X5-X4-X7; for Hunan Province, it is X3-X6-X4-X7; for Guangdong Province, it is X3-X4; for Shaanxi Province, it is X8-X6-X4; for Xinjiang Uygur Autonomous Region’s Urban–Rural Construction Carbon Peak Implementation Plan, it is X5-X8-X7-X3-X6; and for Heilongjiang Province’s Urban–Rural Construction Carbon Peak Implementation Plan, it is X8-X7-X3-X6.
From a general perspective, the following optimization pathways for carbon peak implementation plans are proposed: First, the current carbon peak implementation plans are predominantly focused on carbon emission reduction and energy transformation, yet they often overlook a comprehensive approach that balances economic development with carbon reduction, social equity, and environmental protection. To optimize these outcomes, policies should integrate the carbon peak goal with regional economic development, industrial upgrading, employment, and social fairness, fostering a cross-departmental and cross-sectoral collaborative approach to drive low-carbon transformation and the deep integration of local industries, with a focus on innovation and green economy for high-quality green development. Second, the current carbon peak targets are often medium-term and long-term oriented, lacking in short-term actionable measures and timeliness. Provinces should establish phased carbon peak targets and timelines, with detailed annual and quarterly plans to ensure timely policy implementation, regular evaluation, and adjustment, taking into account economic cycles and international environmental changes to maintain policy effectiveness. Third, most provinces have a top-down policy structure that lacks detailed implementation guidelines, specific measures, and clear responsibility distribution. This study suggests strengthening policy layering, clarifying the responsibilities of different stakeholders, and enhancing policy coordination and collaboration, establishing more detailed implementation guidelines and evaluation standards. Local governments should adjust policies flexibly based on actual conditions to avoid a one-size-fits-all approach. Fourth, most provinces’ carbon peak policies focus on energy, industry, and transportation; they fail to fully address the diversity and complexity of carbon emissions. Policy areas should be broadened to include sectors such as agriculture, construction, forestry, and urban planning, enhancing the role of agricultural carbon sinks and strengthening green building standards to increase carbon emission reduction capacities comprehensively [41]. Fifth, the primary policy recipients are government departments, businesses, and some research institutions, with limited outreach to the public in terms of mobilization and education. The range of policy receptors should be expanded to include ordinary citizens and social organizations, educating, promoting, and incentivizing the public to raise awareness of low-carbon lifestyles and to drive the adoption of green consumption patterns. Sixth, many of the carbon peak policies in provinces rely on administrative measures and fiscal incentives, lacking market-driven, technology innovation-oriented mechanisms. More market-based policy tools, such as carbon trading, carbon taxes, and green credits, should be introduced to leverage the market’s role in resource allocation. Additionally, technological innovation support through R&D funding, green finance, and low-carbon technology investment should be enhanced to provide the technical and financial foundation for achieving carbon peak targets. Seventh, most provincial carbon peak policies focus on “emission reduction” and neglect the synergistic effects between carbon peak and carbon neutrality goals. Policies should focus on both carbon peak and carbon neutrality, strengthening the integration of short-term and long-term goals. They can combine “carbon peak” with “green development”, emphasizing the promotion of green technological innovation, carbon emission management, and the establishment of carbon market systems. Eighth, the social benefits of carbon peak implementation plans are often under-assessed, particularly in terms of cultural, employment, health, and environmental protection outcomes. Quantifiable social benefit indicators should be incorporated into policy design, promoting low-carbon industries to create employment opportunities, improve public health, reduce diseases caused by air pollution, and enhance the quality of life. Regular assessments and feedback on social benefits should be conducted to optimize policy execution. Ninth, the guarantee mechanisms for carbon peak policies in various provinces are weak, with insufficient supporting measures and funding guarantees. A comprehensive policy guarantee, including financial support, technical assistance, and talent training, should be provided. Supervision and accountability mechanisms should be strengthened to ensure the achievement of carbon peak goals. Government investment should be increased, especially in key carbon reduction areas like renewable energy and green transportation, and private capital should be guided to participate in the process.
In summary, for the carbon peak implementation plans for provinces and regions such as Liaoning, Shanxi, Anhui, Jiangsu, Heilongjiang, Zhejiang, Shandong, Hunan, Guangdong, Inner Mongolia, Shaanxi, Xinjiang and Hubei, optimizing policies from multiple perspectives—including policy vision, timeliness, structure, area, receptors, tools, focus, social benefits, and guarantees—not only enhances their operability and effectiveness but also promotes the smooth advancement of green and low-carbon transformation across the regions. Provinces should adapt their policies based on local characteristics, adjust measures flexibly, and strengthen cross-regional cooperation and knowledge sharing to jointly attain the national objectives of carbon peaking and carbon neutrality. Under China’s carbon peak policies, significant emission reduction achievements have been made in industries such as power generation, steel, aluminum, new energy vehicles, and construction. The power sector has seen a substantial increase in renewable energy capacity, with wind and solar power installations reaching 1.206 billion kilowatts by the end of July, 2024, 2.25 times that at the end of 2020. The steel industry has continuously reduced its carbon intensity by phasing out outdated production capacities and promoting green technologies, with an expected carbon peak by 2025. The aluminum industry has achieved carbon peak while increasing production by optimizing its energy structure and increasing the use of recycled aluminum. The new energy vehicle industry has emerged as a leader in low-carbon transformation through technological innovation and market expansion. The construction industry is expected to reach its carbon peak around 2030 by enhancing energy efficiency standards and promoting green building technologies. The emission reduction achievements in these industries are not only driven by policies but also closely related to the active efforts of enterprises in green transformation, laying a solid foundation for achieving the carbon peak goal.

5. Conclusions

This study quantitatively evaluated China’s carbon peaking policies using the PMC-Index model, focusing on the first batch of national carbon peak pilot provinces and regions. The main findings are as follows: First, the PMC index for the 15 carbon peak action plan policies ranged between 5 and 8, with an average score of 6.59, indicating that the policy text ratings were generally “Good” and “Acceptable”. Second, there was an imbalance in policy performance, with some policies scoring higher in certain areas such as “Policy Structure” and “Policy Area”, while others like “Policy Perspective” “Policy Term” and “Policy Social Benefits” scored lower, indicating weaker performance in these aspects. Third, the study identified seven core focus areas within the policy texts: green development and low-carbon transition, construction and utilization of renewable energy, technological innovation and research support, promotion of key sectors and projects, improvement of enterprises and management systems, ecological protection and environmental improvement, and achievement of carbon neutrality and long-term goals. Fourth, the PMC surface diagrams visually displayed the strengths and weaknesses of the policy texts, providing a clear direction for policy optimization and improvement.
The limitations of the study are as follows: First, the study’s analysis was based on policy texts and did not account for actual implementation outcomes, which could vary from the intended policy goals. Second, The PMC-Index model relied on the textual analysis of policies, which may not fully capture the complexities and nuances of policy execution. Third, the study concentrated on a particular set of pilot provinces and regions, and the findings may not be generalizable to all provinces in China. Additionally, the PMC method itself has certain limitations, such as potential subjectivity in the allocation of variable weights. Future research could improve the distribution of weights and further refine the applicability of the method. The suggested directions for further research are as follows: First, future studies could conduct a longitudinal analysis to assess the progression of policy effectiveness over time, considering the dynamic nature of policy implementation. Second, research could be broadened to encompass a wider variety of provinces and regions to enhance the generalizability of the findings. Third, future work could incorporate qualitative methods, including methods like interviews and case studies, to complement the quantitative analysis and provide a more comprehensive understanding of policy impacts. Fourth, studies could also explore the development of more advanced models or adaptations of the PMC-Index model to better predict policy outcomes and address the limitations identified in this study.

Author Contributions

Conceptualization, G.W.; methodology, L.J.; software, G.W.; validation, L.J.; formal analysis, G.W.; investigation, L.J.; resources, G.W. and L.J.; data curation, L.J.; writing—original draft preparation, G.W. and L.J.; writing—review and editing, G.W. and L.J.; visualization, L.J. and G.W.; supervision, G.W.; project administration, G.W. All authors have read and agreed to the published version of the manuscript.

Funding

This work was supported by the Research Fund of the School of Public Administration at Jilin University of China (Grant No. 2024CX017).

Institutional Review Board Statement

Not applicable.

Informed Consent Statement

Not applicable.

Data Availability Statement

Data is contained within the article.

Conflicts of Interest

The authors declare no conflicts of interest.

References

  1. Karl, T.R.; Trenberth, K.E. Modern Global Climate Change. Science 2003, 302, 1719–1723. [Google Scholar] [CrossRef] [PubMed]
  2. Jacobs, M. Reflections on COP26: International Diplomacy, Global Justice and the Greening of Capitalism. Political Q. 2022, 93, 270–277. [Google Scholar] [CrossRef]
  3. Zhou, C.; Zhang, R.; Loginova, J.; Sharma, V.; Zhang, Z.; Qian, Z. Institutional Logic of Carbon Neutrality Policies in China: What Can We Learn? Energies 2022, 15, 4391. [Google Scholar] [CrossRef]
  4. Wang, Z.; Xiong, Y.; Zhang, C. Quantitative Evaluation of Eco-Environmental Protection Policy in the Yangtze River Economic Belt: A PMC-Index Model Approach. Sustainability 2024, 16, 805. [Google Scholar] [CrossRef]
  5. Yang, J.; Zheng, C.; Liu, H. Digital Transformation and Rule of Law Based on Peak CO2 Emissions and Carbon Neutrality. Sustainability 2022, 14, 7487. [Google Scholar] [CrossRef]
  6. Zhang, Z.; Hu, G.; Mu, X.; Kong, L. From Low Carbon to Carbon Neutrality: A Bibliometric Analysis of the Status, Evolution and Development Trend. J. Environ. Manag. 2022, 322, 116087. [Google Scholar] [CrossRef]
  7. Wang, Y.; Guo, C.; Du, C.; Chen, X.; Jia, L.; Guo, X.; Chen, R.; Zhang, M.; Chen, Z.; Wang, H.; et al. Carbon Peak and Carbon Neutrality in China: Goals, Implementation Path, and Prospects. China Geol. 2021, 4, 720–746. [Google Scholar] [CrossRef]
  8. He, J.; Li, Z.; Zhang, X.; Wang, H.; Dong, W.; Chang, S.; Ou, X.; Guo, S.; Tian, Z.; Gu, A.; et al. Comprehensive Report on China’s Long-Term Low-Carbon Development Strategies and Pathways. Chin. J. Popul. Resour. Environ. 2020, 18, 263–295. [Google Scholar] [CrossRef]
  9. Wang, Y.; Sun, Q.; Wu, J.; Han, S.; Zhang, R.; Jiang, S.; Gu, X. Research on the Low Carbon Development Path of China’s Coal Industry under Carbon Peaking & Carbon Neutral Target: Based on the RCPs-SSPs Framework. Resour. Policy 2023, 86, 104091. [Google Scholar]
  10. Duan, H.; Zhou, S.; Jiang, K.; Bertram, C.; Harmsen, M.; Kriegler, E.; Van Vuuren, D.P.; Wang, S.; Fujimori, S.; Tavoni, M.; et al. Assessing China’s efforts to pursue the 1.5 °C warming limit. Science 2021, 372, 378–385. [Google Scholar] [CrossRef]
  11. Hu, Y.; Wu, W. Can Fossil Energy Make a Soft Landing? the Carbon-Neutral Pathway in China Accompanying CCS. Energy Policy 2023, 174, 113440. [Google Scholar] [CrossRef]
  12. Yang, H.; Wang, X.; Bin, P. Agriculture Carbon-Emission Reduction and Changing Factors behind Agricultural Eco-Efficiency Growth in China. J. Clean. Prod. 2022, 334, 130193. [Google Scholar] [CrossRef]
  13. Zhang, M.; Liu, Y. Influence of Digital Finance and Green Technology Innovation on China’s Carbon Emission Efficiency: Empirical Analysis Based on Spatial Metrology. Sci. Total Environ. 2022, 838, 156463. [Google Scholar] [CrossRef] [PubMed]
  14. Guo, W.; Teng, Y.; Yan, Y.; Zhao, C.; Zhang, W.; Ji, X. Simulation of Land Use and Carbon Storage Evolution in Multi-Scenario: A Case Study in Beijing-Tianjin-Hebei Urban Agglomeration, China. Sustainability 2022, 14, 13436. [Google Scholar] [CrossRef]
  15. Mirici, M.E.; Berberoglu, S.; Akin, A.; Satir, O. Land Use/Cover Change Modelling in a Mediterranean Rural Landscape Using Multi-Layer Perceptron and Markov Chain (mlp-Mc). Appl. Ecol. Env. Res. 2018, 16, 467–486. [Google Scholar] [CrossRef]
  16. Chen, J.; Wang, D.; Wang, Q.; Cai, Q. Quantifying the Synergy of China’s Carbon Neutrality Policies through Policy Documents. Renew. Sustain. Energy Rev. 2024, 200, 114585. [Google Scholar] [CrossRef]
  17. Zhang, Y.; Pan, C.L.; Liao, H.T. Carbon Neutrality Policies and Technologies: A Scientometric Analysis of Social Science Disciplines. Front. Environ. Sci. 2021, 9, 761736. [Google Scholar] [CrossRef]
  18. Wollmann, H. Policy evaluation and evaluation research. In Handbook of Public Policy Analysis; Routledge: London, UK, 2017; pp. 419–428. [Google Scholar]
  19. Dai, S.; Zhang, W.; Zong, J.; Wang, Y.; Wang, G. How Effective Is the Green Development Policy of China’s Yangtze River Economic Belt? A Quantitative Evaluation Based on the PMC-Index Model. Int. J. Environ. Res. Public Health 2021, 18, 7676. [Google Scholar] [CrossRef]
  20. Bailey, A.; Angell, B.; Scott, T.; Beedell, J.; Beechener, S.; Rana, R. Helping Farmers Adjust to Policy Reforms Through Demonstration Farms: Lessons From a Project in England. In Proceedings of the 15th International Farm Management Association Congress (IFMA), Campinas SP, Brazil, 14–19 August 2005. [Google Scholar]
  21. Spiliotopoulou, L.; Charalabidis, Y.; Loukis, E.N.; Diamantopoulou, V. A Framework for Advanced Social Media Exploitation in Government for Crowdsourcing. Transform. Gov. People Process Policy 2014, 8, 545–568. [Google Scholar] [CrossRef]
  22. Venetoklis, T. Public Policy Evaluation: Introduction to Quantitative Methodologies; VATT Institute for Economic Research: Helsinki, Finland, 2002. [Google Scholar]
  23. Ruiz Estrada, M.A. Policy Modeling: Definition, Classification and Evaluation. J. Policy Model. 2011, 33, 523–536. [Google Scholar] [CrossRef]
  24. Liu, J.; Mao, H. Evaluation of Fire Safety Management Policy Based on PMC Index Model. Fire Sci. Technol. 2021, 9, 1405–1409. [Google Scholar]
  25. Liu, Y.; Li, J.; Xu, Y. Quantitative Evaluation of High-Tech Industry Policies Based on the PMC-Index Model: A Case Study of China’s Beijing-Tianjin-Hebei Region. Sustainability 2022, 14, 9338. [Google Scholar] [CrossRef]
  26. Liu, L.; Chen, J.; Wang, C.; Wang, Q. Quantitative Evaluation of China’s Basin Ecological Compensation Policies Based on the PMC Index Model. Environ. Sci. Pollut. Res. 2022, 30, 17532–17545. [Google Scholar] [CrossRef] [PubMed]
  27. Yang, C.; Yin, S.; Cui, D.; Mao, Z.; Sun, Y.; Jia, C.; An, S.; Wu, Y.; Li, X.; Du, Y.; et al. Quantitative Evaluation of Traditional Chinese Medicine Development Policy: A PMC Index Model Approach. Front. Public Health 2022, 10, 1041528. [Google Scholar] [CrossRef] [PubMed]
  28. Qi, L.; Chen, W.; Li, C.; Song, X.; Ge, L. Quantitative Evaluation of China’s Biogenetic Resources Conservation Policies Based on the Policy Modeling Consistency Index Model. Sustainability 2024, 16, 5158. [Google Scholar] [CrossRef]
  29. Peng, R.; Deng, X.; Xia, Y.; Wu, B. Assessing the Sustainability of Long-Term Care Insurance Systems Based on a Policy–Population–Economy Complex System: The Case Study of China. Int. J. Environ. Res. Public Health 2022, 19, 6554. [Google Scholar] [CrossRef] [PubMed]
  30. Wang, H.; Zeng, Y. Policy Optimization for Hainan Tropical Rainforest National Park Based on Quantitative Comparison of Regional Policies of Free Trade Port Areas. Front. Environ. Sci. 2022, 10, 891432. [Google Scholar] [CrossRef]
  31. Chen, T.; Rong, J.; Peng, L.; Yang, J.; Cong, G.; Fang, J. Analysis of Social Effects on Employment Promotion Policies for College Graduates Based on Data Mining for Online Use Review in China during the COVID-19 Pandemic. Healthcare 2021, 9, 846. [Google Scholar] [CrossRef]
  32. Shen, H.; Xiong, P.; Yang, L.; Zhou, L. Quantitative Evaluation of Science and Technology Financial Policies Based on the PMC-AE Index Model: A Case Study of China’s Science and Technology Financial Policies Since the 13th Five-Year Plan. PLoS ONE 2024, 19, e0307529. [Google Scholar] [CrossRef] [PubMed]
  33. Xu, L.; Xi, M. Quantitative Evaluation of Policies for Combining Medical and Nursing Care Based on the LDA–PMC Model: A Comparative Analysis of Typical Chinese Provinces. Public Organ. Rev. 2024, 24, 693–713. [Google Scholar] [CrossRef]
  34. Che, J.; Liu, W.; Wang, J.; Xie, Z. Vocational Education Policy Analysis Based on Word Frequency Analysis Technology. Int. J. Wirel. Mob. Comput. 2023, 25, 30–36. [Google Scholar] [CrossRef]
  35. Dai, S.; Zhang, W.; Lan, L. Quantitative Evaluation of China’s Ecological Protection Compensation Policy Based on PMC Index Model. Int. J. Environ. Res. Public Health 2022, 19, 10227. [Google Scholar] [CrossRef] [PubMed]
  36. Ruiz Estrada, M.A.; Yap, S.F.; Nagaraj, S. Beyond the Ceteris Paribus Assumption: Modeling Demand and Supply Assuming Omnia Mobili; Social Science Electronic Publishing: Rochester, NY, USA, 2010. [Google Scholar]
  37. Ye, L.; Yu, F.; Zhong, J. Study on Comprehensive Evaluation Index System for Education E-Government Performance of College and University. MATEC Web Conf. 2016, 61, 2002. [Google Scholar] [CrossRef]
  38. Ma, J.J.; Du, G.; Xie, B.C. CO2 Emission Changes of China’s Power Generation System: Input-Output Subsystem Analysis. Energy Policy 2019, 124, 1–12. [Google Scholar] [CrossRef]
  39. Cai, D.; Chai, Y.; Tian, Z. Quantitative Evaluation of Digital Economy Policy Text in Jilin Province Based on PMC Index Mode. Inf. Sci. 2021, 39, 139–145. [Google Scholar]
  40. Xiong, Y.; Zhang, C.; Qi, H. How Effective is the Fire Safety Education Policy in China? A Quantitative Evaluation Based on the PMC-Index Model. Saf. Sci. 2023, 161, 106070. [Google Scholar] [CrossRef]
  41. Wei, Y.M.; Chen, K.; Kang, J.N.; Chen, W.; Wang, X.Y.; Zhang, X. Policy and Management of Carbon Peaking and Carbon Neutrality: A Literature Review. Engineering 2022, 14, 52–63. [Google Scholar] [CrossRef]
Figure 1. Keyword Network Map.
Sustainability 17 01738 g001
Figure 2. PMC surface diagram for P1 (Good).
Sustainability 17 01738 g002
Figure 3. PMC surface diagram for P2 (Good).
Sustainability 17 01738 g003
Figure 4. PMC surface diagram for P3 (Acceptable).
Sustainability 17 01738 g004
Figure 5. PMC surface diagram for P4 (Good).
Sustainability 17 01738 g005
Figure 6. PMC surface diagram for P5 (Good).
Sustainability 17 01738 g006
Figure 7. PMC surface diagram for P6 (Acceptable).
Sustainability 17 01738 g007
Figure 8. PMC surface diagram for P7 (Acceptable).
Sustainability 17 01738 g008
Figure 9. PMC surface diagram for P8 (Acceptable).
Sustainability 17 01738 g009
Figure 10. PMC surface diagram for P9 (Good).
Sustainability 17 01738 g010
Figure 11. PMC surface diagram for P10 (Acceptable).
Sustainability 17 01738 g011
Figure 12. PMC surface diagram for P11 (Acceptable).
Sustainability 17 01738 g012
Figure 13. PMC surface diagram for P12 (Acceptable).
Sustainability 17 01738 g013
Figure 14. PMC surface diagram for P13 (Acceptable).
Sustainability 17 01738 g014
Figure 15. PMC surface diagram for P14 (Acceptable).
Sustainability 17 01738 g015
Figure 16. PMC surface diagram for P15 (Acceptable).
Sustainability 17 01738 g016
Figure 17. Debra chart of 15 representative policies.
Sustainability 17 01738 g017
Table 1. The representative carbon peaking implementation plans of 15 provinces.
Serial NumberProvincePolicy TitlePolicy Issuance DateIssuing Authority
P1Hebei ProvinceHebei Province Carbon Peaking Implementation Plan19 June 2022Hebei Provincial Government
P2Shanxi ProvinceShanxi Province Carbon Peaking Implementation Plan9 January 2023Shanxi Provincial Government
P3Inner MongoliaInner Mongolia Autonomous Region Carbon Peaking Implementation Plan19 November 2022Inner Mongolia Autonomous Region Government
P4Liaoning ProvinceLiaoning Province Carbon Peaking Implementation Plan12 September 2023Liaoning Provincial Government
P5Jiangsu ProvinceJiangsu Province Carbon Peaking Implementation Plan2 October 2022Jiangsu Provincial Government
P6Zhejiang ProvinceZhejiang Province Action Plan for Technological Innovation in Carbon Peaking and Carbon Neutrality11 June 2021Zhejiang Provincial Government
P7Anhui ProvinceAnhui Province Carbon Peaking Implementation Plan18 December 2022Anhui Provincial Government
P8Shandong ProvinceShandong Province Carbon Peaking Implementation Plan28 December 2022Shandong Provincial Government
P9Henan ProvinceHenan Province Carbon Peaking Implementation Plan6 February 2023Henan Provincial Government
P10Hubei ProvinceHubei Province Action Plan for Technological Innovation in Carbon Peaking and Carbon Neutrality26 December 2022Hubei Provincial Government
P11Hunan ProvinceHunan Province Carbon Peaking Implementation Plan28 October 2022Hunan Provincial Government
P12Guangdong ProvinceGuangdong Province Carbon Peaking Implementation Plan23 June 2022-Guangdong Provincial Government
P13Shaanxi ProvinceShaanxi Province Carbon Peaking Implementation Plan22 February 2023Shaanxi Provincial Government
P14Xinjiang Autonomous RegionXinjiang Uygur Autonomous Region Urban and Rural Construction Carbon Peaking Implementation Plan20 January 2023Autonomous Region Housing and Urban–Rural Development Department, Autonomous Region Development and Reform Commission
P15Heilongjiang ProvinceHeilongjiang Province Urban and Rural Construction Carbon Peaking Implementation Plan14 October 2022Heilongjiang Housing and Urban–Rural Development Department, Heilongjiang Development and Reform Commission
Table 2. Policy text key words’ frequency statistics table.
Serial NumberVocabularyFrequencySerial NumberVocabularyFrequency
1Green140616Application325
2Development102817Promotion319
3Low-carbon100318Field317
4Energy96119Level316
5Construction86520Project311
6Technology82021Carbon Neutrality304
7Building56322System302
8Energy-saving55923Renovation284
9Ecology46124Improvement272
10Focus40725Management272
11Carbon Peak40626Resources272
12Innovation37227Foundation263
13Enterprise35828Science and Technology248
14Institution35529Nation246
15Emission35230Facilities242
Note: The numbers in the “Frequency” column of the table represent the total occurrences of the corresponding high-frequency words in the 15 “Carbon Peaking Implementation Plan” policy texts. Additionally, the final number of high-frequency words adopted in this study is determined using Price’s method (M = 0.749 N m a x , where M is the minimum frequency of high-frequency words and N m a x represents the highest value of all word frequencies), which is more objective compared to thresholds set through subjective judgment.
Table 3. Variable design and evaluation standard.
No.The Primary IndicatorNo.The Secondary IndicatorDefine
X1Policy PerspectiveX1.1MacroWhether the policy adopts a macro perspective and emphasizes province-wide carbon peaking; if yes, it is 1; if no, it is 0.
X1.2MicroWhether the policy adopts a micro perspective and focuses on carbon peaking within individual sectors; if yes, it is 1; if no, it is 0.
X2Policy TimelinessX2.1Long-TermWhether the policy’s duration exceeds 5 years; if yes, it is 1; if no, it is 0.
X2.2Medium-TermWhether the policy’s duration is between 3 and 5 years; if yes, it is 1; if no, it is 0.
X2.3Short-TermWhether the policy’s duration is less than 3 years; if yes, it is 1; if no, it is 0.
X3Policy StructureX3.1 Sufficient BasisWhether the policy basis is sufficient; if yes, it is 1; if no, it is 0.
X3.2 Clear ObjectivesWhether the policy objectives are clear; if yes, it is 1; if no, it is 0.
X3.3 Scientific ProgramWhether the policy program is scientific; if yes, it is 1,; if no, it is 0.
X3.4 Detailed PlanningWhether the policy planning is detailed; if yes, it is 1; if no, it is 0.
X4Policy AreaX4.1PoliticsWhether the content of the policy addresses politics; if yes, it is 1; if no, it is 0.
X4.2EconomicsWhether the content of the policy addresses economics; if yes, it is 1; if no, it is 0.
X4.3CulturalWhether the content of the policy addresses cultural issues; if yes, it is 1; if no, it is 0.
X4.4SocialWhether the content of the policy addresses social issues; if yes, it is 1; if no, it is 0.
X4.5Science and TechnologyWhether the content of the policy addresses science and technology; if yes, it is 1; if no, it is 0.
X5Policy ReceptorsX5.1Government-
Related Departments
Whether the policy targets government-related departments; if yes, it is 1; if no, it is 0.
X5.2EnterpriseWhether the policy targets enterprises; if yes, it is 1; if no, it is 0.
X5.3Social OrganizationWhether the policy targets social organization; if yes, it is 1; if no, it is 0.
X5.4IndividualsWhether the policy targets individuals; if yes, it is 1; if no, it is 0.
X6Policy ToolX6.1 Carbon Trading MarketsWhether the policy involves establishing or participating in carbon trading markets, requiring high-emission enterprises to purchase carbon emission allowances, using market-driven approaches to encourage cost-effective emissions reduction; if yes, it is 1; if no, it is 0.
X6.2 Levy Carbon TaxesWhether the policy involves levying carbon taxes on high-emission industries to increase the cost of emissions; if yes, it is 1; if no, it is 0.
X6.3 Fiscal and Financial IncentivesWhether the policy involves subsidies and rewards or green finance; if yes, it is 1; if no, it is 0.
X6.4 Technological InnovationWhether the policy includes funding for the research and development of carbon capture, utilization, and storage (CCUS) technologies, renewable energy, energy storage, and other carbon reduction technologies; if yes, it is 1; if no, it is 0.
X6.5 Establish Low-Carbon StandardsWhether the policy involves establishing low-carbon standards across industries, such as clean production and green building standards, to encourage the broad adoption of energy-saving and clean technologies; if yes, it is 1; if no, it is 0.
X6.6 Legal and Regulatory MeasuresWhether the policy involves setting carbon emission limits or reduction targets and implementing mandatory performance and emission standards; if yes, it is 1; if no, it is 0.
X6.7 Public Awareness and EducationWhether the policy involves promoting green and low-carbon concepts to increase public awareness of carbon neutrality, advocating for low-carbon consumption and lifestyles, and encouraging public participation in carbon reduction efforts; if yes, it is 1; if no, it is 0.
X6.8 Green Industry UpgradingWhether the policy supports the growth of high-tech, low-energy green industries through policy guidance and support; if yes, it is 1; if no, it is 0.
X7Policy FocusX7.1 TransportationWhether the policy addresses transportation; if yes, it is 1; if no, it is 0.
X7.2 IndustryWhether the policy addresses industry; if yes, it is 1; if no, it is 0.
X7.3 EnergyWhether the policy addresses energy; if yes, it is 1; if no, it is 0.
X7.4 BuildingsWhether the policy addresses buildings; if yes, it is 1; if no, it is 0.
X7.5 Agriculture and LivestockWhether the policy addresses agriculture and livestock; if yes, it is 1; if no, it is 0.
X7.6 ForestryWhether the policy addresses forestry; if yes, it is 1; if no, it is 0.
X7.7 Waste ManagementWhether the policy addresses policy involves waste management; if yes, it is 1; if no, it is 0.
X7.8 Residential LifeWhether the policy addresses residential life; if yes, it is 1; if no, it is 0.
X8Policy Social BenefitsX8.1 Win-Win CooperationWhether the policy assists win-win cooperation; if yes, it is 1; if no, it is 0.
X8.2 SustainabilityWhether the policy assists sustainable development; if yes, it is 1; if no, it is 0.
X8.3 Technological AdvancementWhether the policy promote technological advancement; if yes, it is 1; if no, it is 0.
X8.4 Sound MechanismWhether the policy produces the utility of an effective mechanism; if yes, it is 1; if no, it is 0.
X8.5 Environmental ProtectionWhether the policy assists environment protection; if yes, it is 1; if no, it is 0.
X9Policy GuaranteeX9.1 Supervision and AssessmentWhether the policy addresses supervision and assessment; if yes, it is 1; if no, it is 0.
X9.2Pilot ConstructionWhether the policy addresses pilot construction; if yes, it is 1; if no, it is 0.
X9.3 Organizational LeadershipWhether the policy addresses organizational leadership; if yes, it is 1; if no, it is 0.
X9.4 Collaborative Division of LaborWhether the policy addresses the collaborative division of labor; if yes, it is 1; if no, it is 0.
X10Policy Disclosure//Whether the policy is transparent and accessible; if yes, it is 0; if no, it is 1.
Table 4. The multi-input–output table for China’s carbon peaking policies.
First-Level VariableSecond-Level Variable
X1X1:1 X1:2
X2X2:1 X2:2 X2:3
X3X3:1 X3:2 X3:3 X3:4
X4X4:1 X4:2 X4:3 X4:4 X4:5
X5X5:1 X5:2 X5:3 X5:4
X6X6:1 X6:2 X6:3 X6:4 X6:5 X6:6 X6:7 X6:8
X7X7:1 X7:2 X7:3 X7:4 X7:5 X7:6 X7:7 X7:8
X8X8:1 X8:2 X8:3 X8:4 X8:5
X9
X10
X9:1 X9:2 X9:3 X9:4
-
Table 5. PMC index of the evaluated policies.
X1X2X3X4X5X6X7X8X9X10PMC IndexTypeRank
P10.50 0.33 1.00 0.60 0.74 0.75 1.00 0.80 0.88 1.00 7.60 Good2
P20.50 0.33 1.00 0.60 1.00 0.63 1.00 0.60 0.75 1.00 7.41 Good3
P30.50 0.33 1.00 0.60 0.50 0.38 1.00 0.40 0.50 1.00 6.21 Acceptable10
P40.50 0.33 1.00 0.80 1.00 0.75 0.88 0.60 0.75 1.00 7.61 Good1
P50.50 0.33 1.00 0.60 1.00 0.63 0.88 0.40 1.00 1.00 7.33 Good4
P60.50 0.33 0.75 0.60 0.50 0.25 0.75 0.40 0.50 1.00 5.58 Acceptable15
P70.50 0.33 0.75 0.80 0.75 0.38 1.00 0.20 1.00 1.00 6.71 Acceptable6
P80.50 0.33 1.00 0.60 0.50 0.50 0.75 0.20 0.75 1.00 6.13 Acceptable12
P90.50 0.33 0.75 0.60 0.75 0.63 1.00 0.60 1.00 1.00 7.16 Good5
P100.50 0.33 1.00 0.60 0.50 0.13 0.88 0.40 0.50 1.00 5.83 Acceptable13
P110.50 0.33 0.75 0.60 0.75 0.38 0.88 0.40 0.75 1.00 6.33 Acceptable9
P120.50 0.33 0.50 0.60 1.00 0.50 1.00 0.40 0.75 1.00 6.58 Acceptable7
P130.50 0.33 1.00 0.60 0.75 0.38 1.00 0.20 0.75 1.00 6.51 Acceptable8
P140.50 0.33 0.75 0.80 0.25 0.38 0.75 0.20 0.75 1.00 5.71 Acceptable14
P150.50 0.33 0.75 0.80 0.75 0.38 0.75 0.20 0.75 1.00 6.21 Acceptable11
Total7.50 5.00 13.00 9.80 10.75 7.00 13.50 6.00 11.38 15.00 98.80 //
Average0.50 0.33 0.87 0.65 0.72 0.47 0.90 0.40 0.76 1.00 6.59 //
Disclaimer/Publisher’s Note: The statements, opinions and data contained in all publications are solely those of the individual author(s) and contributor(s) and not of MDPI and/or the editor(s). MDPI and/or the editor(s) disclaim responsibility for any injury to people or property resulting from any ideas, methods, instructions or products referred to in the content.

